Financial and Operational Benchmarking
|
|
|
- Lester Booth
- 5 years ago
- Views:
Transcription

1 Financial and Operational Benchmarking Jonathan Chapman Director of Community Health Center Advisory Services October 24,
2 Capital Link - Overview Launched in 1995, nonprofit, HRSA national cooperative agreement partner Offices in CA, CO, MA, ME, MO, SC and WV Over $1.1 billion in financing for over 225 health center capital projects In addition to the direct assistance towards planning for and financing operational growth and capital needs, we have developed metrics and analytical services for measuring, evaluating, and promoting performance improvement With HRSA s support and assistance we have gathered audited financial information for at least 80 percent of health centers and almost 100 percent of UDS reports Enabled the development of the National Trends Report 2

3 Benchmarking - Origin Originates from the chiseled horizontal marks that surveyors made in stone structures, into which an angle-iron could be placed to form a "bench" for a leveling rod 3


4 Benchmarking 1. A surveyor's mark cut in a wall, pillar, or building and used as a reference point in measuring altitudes. 2. A standard or point of reference against which things may be compared or assessed. 4


5 Think Thrice, Measure Twice, Cut Once 5
6 What Does Success Look Like? Time, Info, Resources to Plan Productive Teams Improved and Stable Operations Staff and Patient Satisfaction Improved Patient Outcomes Financial Sustainability 6
7 Goal: Financial Sustainability and Access to High Quality Care Staffing Financial Operations Productivity Improved Access & Financial Sustainability Patient Satisfaction Utilization Clinical Outcomes 7
8 Performance Benchmarking Benchmarking/Best Practices WHAT do I want to track? WHERE do I find this data? WHICH metrics do I need? HOW do I analyze it? WHO needs to know? 8
9 Growth and Expansion 9
10 Patients & Visits in Millions Five-Year Grantee Trends ,500 1, , Grantees Patients Visits Grantees 0 10
11 Millions Payer Mix: Number of Patients by Payer Source Private Insurance Public Insurance Medicare Medicaid Uninsured
12 Payer Mix: Percentages of Patients by Payer Source 100% 90% 80% 14% 14% 16% 17% 17% 2% 2% 1% 1% 1% 8% 8% 9% 9% 9% 70% 60% 50% 40% 40% 41% 47% 49% 49% Private Insurance Public Insurance Medicare Medicaid 30% Uninsured 20% 36% 35% 10% 28% 24% 23% 0%
13 Billions Total Revenues by Source $25 $20 $15 $10 $5 $3.2 $3.1 $2.5 $2.3 $0.4 $0.6 $9.0 $9.8 $3.3 $2.9 $0.3 $11.4 $3.6 $3.5 $0.2 $13.7 $3.9 $4.3 $0.1 $15.5 Other HRSA Operating Grants Capital Grants Net Patient Service Revenue (Collections) $
14 Percentage Revenues by Source 100% 90% 80% 70% 60% 50% 40% 30% 20% 10% 0% 21% 20% 18% 17% 16% 16% 16% 16% 17% 18% 4% 2% 2% 1% 0% 60% 62% 63% 65% 65% Other HRSA Operating Grants Capital Grants Net Patient Service Revenue (Collections) 14
15 Financial 15
16 Financial Health: Some Key Metrics Metric 1 Operating Margin 2 Bottom Line Margin 3 Personnel-Related Expense 4 Days Net Patient A/R 5 Days Cash on Hand Why This Is Important Measuring stick of your business model; margins typically small but need to be positive Is performance dependent upon large capital grants and/or other sources of non-operating revenue? Consumes 70-75% of budget; key driver of financial performance Financial management starts with collecting your money efficiently Is there enough liquidity to keep operations running smoothly? 6 Physician Productivity (visits) Productivity is the basis for revenue generation 7 Mid-Level Productivity (visits) Productivity is the basis for revenue generation 8 Dental Provider Productivity (visits) *Capital Link Performance Benchmarking Toolkit Productivity is the basis for revenue generation 16
17 Financial Health: Some Key Metrics Operating Margin = Change in Net Operating Assets / Total Operating Revenue Personnel-Related Expenses = Salaries & Related Expenses + Fringes & Payroll Taxes + Professional/Contracted/Consultant Fees Total Operating Revenues Days Cash on Hand = Unrestricted Cash (Total Operating Expenses Depreciation) / 360 days) 17
18 Operating Margin by Quartile 12.0% 10.0% 9.1% 9.8% Preliminary % 6.0% 4.0% 2.0% 0.0% -2.0% -4.0% 6.9% 6.9% 5.9% 4.5% 3.6% 2.0% 1.3% 1.9% 0.8% -0.2% -1.8% -2.0% -2.6% 75th Percentile 50th Percentile 25th Percentile Benchmark Minimum 18
19 Bottom Line Margin by Quartile 12.0% 11.5% 10.4% 10.6% 10.0% 10.0% 8.6% 8.0% Preliminary % 4.0% 3.8% 3.2% 3.4% 5.1% 5.6% 2.0% 0.9% 1.5% 0.0% -2.0% -0.1% -0.6% -0.2% 75th Percentile 50th Percentile 25th Percentile Benchmark Minimum 19
20 80% 70% 60% 50% 40% 30% 20% 10% Personnel-Related Expenses as a Percent of Operating Revenue Preliminary % 75th percentile 50th percentile 25th percentile Benchmark 20
21 Days in Patient Accounts Receivables (Medians) 65 Preliminary Median Benchmark Maximum 21
22 Days Cash on Hand by Quartile Preliminary th Percentile 50th Percentile 25th Percentile Benchmark Minimum 22

23 Operational 23
24 10,000 Provider Productivity Visits per FTE 9,000 8,000 7,000 6,000 5,000 4,000 3,000 2,000 1, , ,810 2,739 2,703 2,632 2,611 3,394 3,316 3,241 3,152 3,095 1,128 1,090 1, Total Mental Health Visits Per Mental Health FTE Total Dental Visits Per Dental FTE Total Other Provider Visits Per Mid-Level FTE Total Physician Visits Per Physician Total Medical Visits Per Medical FTE 24
25 Percentage Change in Productivity, 2012 to % -2% 1 Total Medical Visits Per Medical FTE -4% Total Physician Visits Per Physician -6% -8% -10% -12% -9% -7% -7% -8% Total Other Provider Visits Per Mid-Level FTE Total Dental Visits Per Dental FTE Total Mental Health Visits Per Mental Health FTE -14% -13% 25
26 18% 16% 14% 12% 10% 8% 6% 4% 2% Annual Percent Growth in Visits by Service 0% -2% Medical Dental Mental Health Enabling Services 26
27 Visits Per Patient Per Year th Percentile 50th Percentile 25th Percentile 27
28 Cost Per Patient and Visit $900 $800 $700 $680 $716 $764 $793 $836 $600 $500 $400 $300 $200 $179 $189 $202 $210 $218 $100 $0 Operating Expense per Patient Visit Operating Expense per Patient 28
29 How Does Your Health Center Compare? 29

30 Capital Link Benchmarking Toolkit 30
31 Benchmarking within Managing 31
32 Creating Performance Dashboards Building Performance Dashboards Dashboards should be customized Identify your target audience Board members vs. executive management vs clinic managers Choose your financial and operational metrics Limit what you are tracking (5-10 metrics) Stay consistent with your ratio definitions & calculations Match your reporting objectives to your available data sources Annual data often most reliable: Audits, UDS, OSHPD, etc Monthly/quarterly data better support real-time decision making: PMS systems, interim financials, etc. Look to Excel as a simple tool for charting performance Explore your available reporting tools Time intensive to set up, then efficient for routine reporting 32

33 Enhanced Performance Evaluation Profile 33
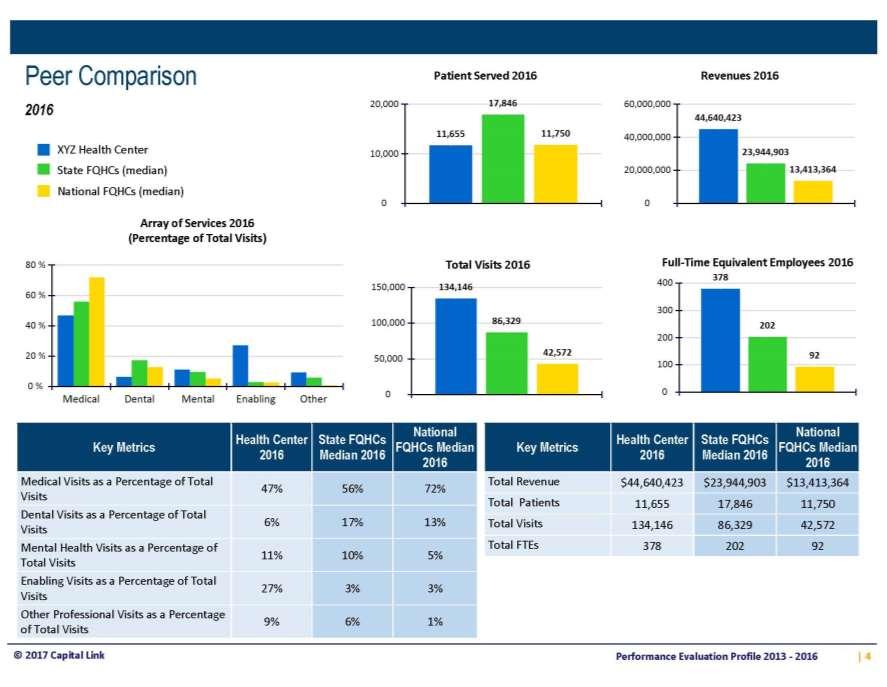
34 34
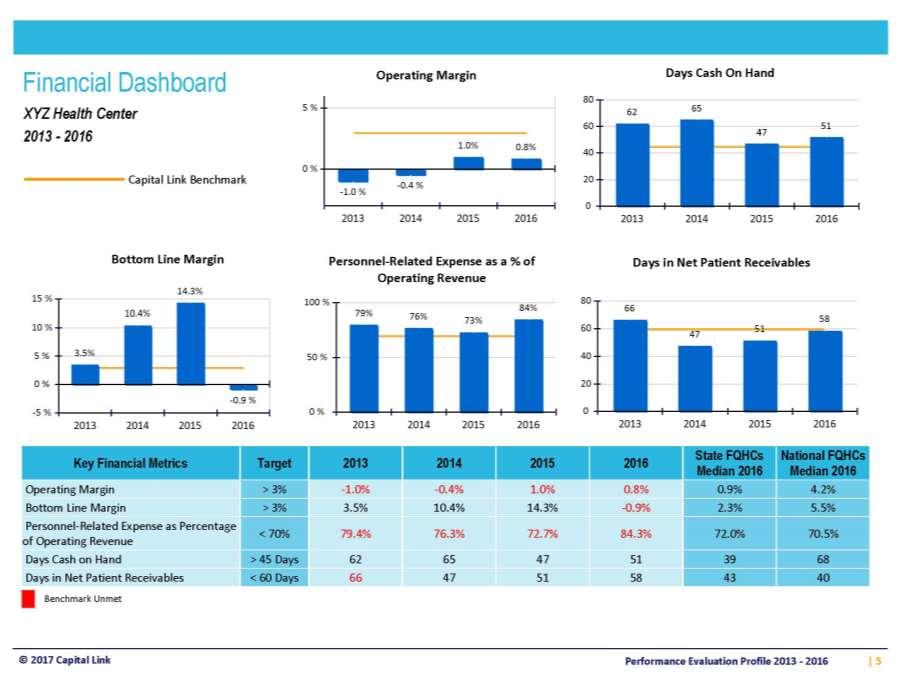
35 35
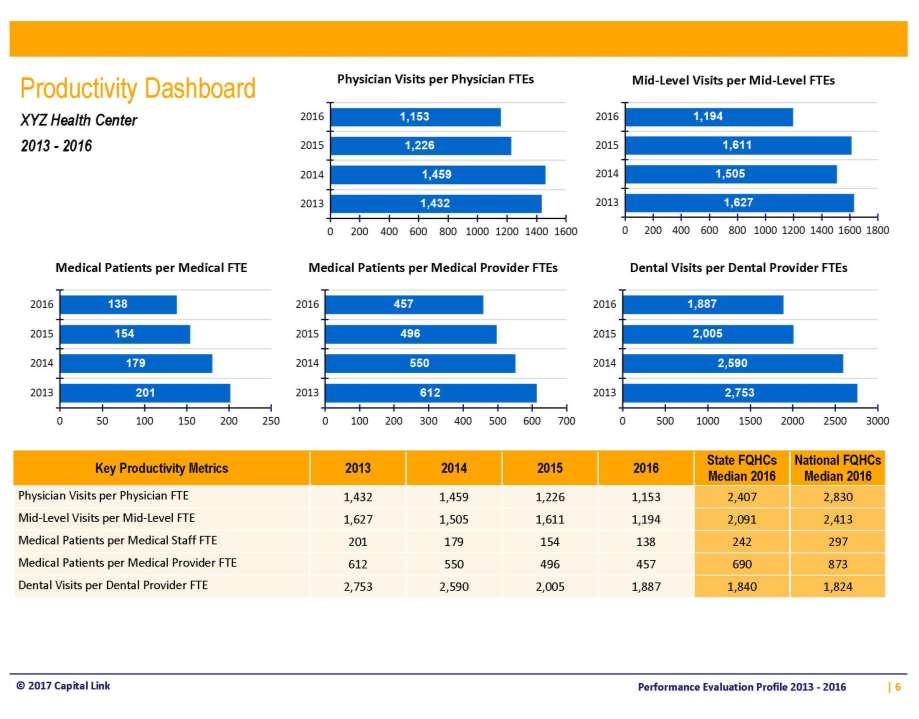
36 36
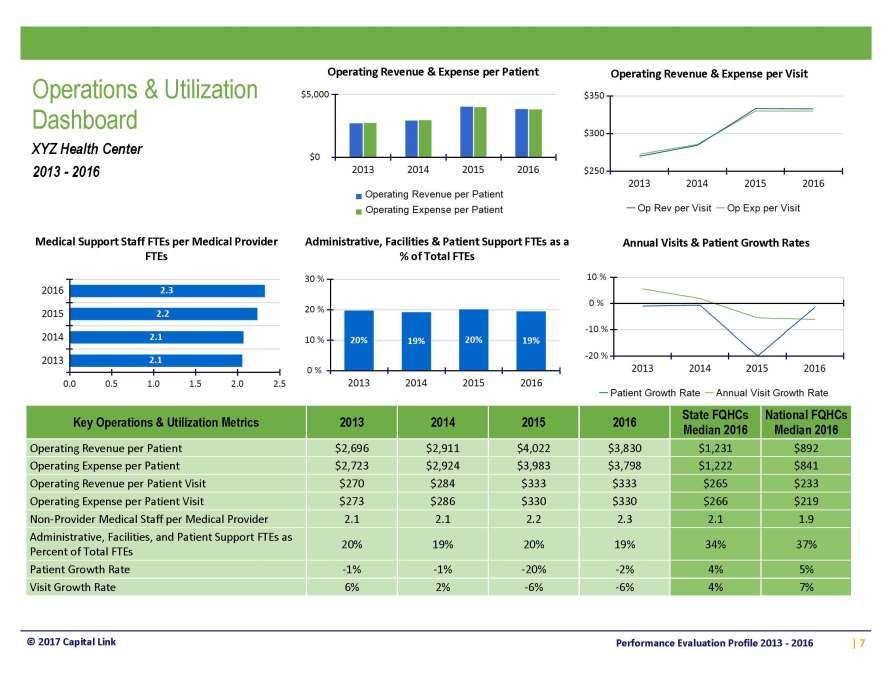
37 37
38 38
39 Evolving Business Models 39

40 Transition from FFS to Value-Based Reimbursement 40
41 Value Transition Based from Transition FFS to Value-Based Reimbursement 41
42 Transition from FFS to Value-Based Reimbursement Fee for Service Volume Individual Health Quality is a concern Stand-alone systems can thrive Little financial risk Manage revenues Value-Based Outcomes Population Health Quality is financial driver Collaboration is essential Increased financial risk Manage costs 42
43 Transition from FFS to Value-Based Reimbursement Redesigned Incentives 43
44 Transition from FFS to Value-Based Reimbursement Metric Why This Is Important 9 Medical Provider Productivity (patients) Becomes more important in transition to team-based care 10 Medical Team Productivity Who are your teams? How do they perform? 11 Cost (Revenue) Per Visit How are your visit costs changing over time? 12 Cost (Revenue) per Patient With the move to PCMH, how are patient costs changing? 13 Medical Support Staff Ratio How strategic is the staffing the medical teams? 14 Non-Clinical Staff Ratio Non-clinical employees are not revenue drivers 15 Visit/Patient Growth Rates Are visits growing faster than patients? Is demand growing? *Capital Link Performance Benchmarking Toolkit 44
45 Thousands Medical Staffing (FTEs) Medical Provider FTES Medical Support Staff FTEs 45
46 Medical Services Productivity Medical Support Staff Ratio (Total Medical FTEs - Midlevel FTEs - Physician FTEs) (Midlevel FTEs + Physician FTEs)
47 Medical Services Productivity 1000 Medical Provider Productivity Medical Patients / Medical Provider FTEs

48 Transition from FFS to Value-Based Reimbursement 48
49 What Does Success Look Like? Time, Info, Resources to Plan Productive Teams Improved and Stable Operations Staff and Patient Satisfaction Improved Patient Outcomes Financial Sustainability 49
50 Jonathan Chapman Tel:
Financial and Operational Benchmarking Trends & Techniques
 Financial and Operational Benchmarking Trends & Techniques Susan Petrie Chief Operating Officer October 31, 2018 1 Capital Link - Overview Launched in 1995, nonprofit, HRSA national cooperative agreement
Using Financial & Operational Data To Plan For Growth
 Using Financial & Operational Data To Plan For Growth Tony Skapinsky Project Consultant March 20, 2019 1 Capital Link - Overview Launched in 1995, nonprofit, HRSA national cooperative agreement partner
Innovative Approaches to Using Data to Demonstrate Value: Measuring & Reporting Clinical, Operational, Financial Improvement
 Innovative Approaches to Using Data to Demonstrate Value: Measuring & Reporting Clinical, Operational, Financial Improvement Jonathan Chapman Director, CHC Advisory Services AACHC/CVN Annual Conference
Developing a Community Health Center Capital Project Plan and Budget - Part One
 Developing a Community Health Center Capital Project Plan and Budget - Part One Jonathan Chapman Director, CHC Advisory Services May 30, 2018 1 Capital Link Launched in 1995, nonprofit, HRSA national cooperative
Developing a Community Health Center Capital Project Plan and Budget - Part Two
 Developing a Community Health Center Capital Project Plan and Budget - Part Two Jonathan Chapman Director, CHC Advisory Services June 27, 2018 1 Capital Link Launched in 1995, nonprofit, HRSA national
FQHCs as a New Asset Class for CDFIs:
 FQHCs as a New Asset Class for CDFIs: What are We Learning? Allison Coleman, Capital Link Tom Manning, Harbor Road Nancy Wagner-Hislip, The Reinvestment Fund Alexandra Jaskula, OFN Agenda The Financing
Community Health Center Financial Perspectives Issue 1
 Community Health Center Financial Perspectives Issue 1 Financial and Operational Ratios and Trends of Community Health Centers, 2008-2011 A Guide for Community Health Centers Prepared by Capital Link and
Learning Collaborative: Funding. Evaluating Financing Options and Fundraising Plans. Jonathan Chapman Director, CHC Advisory Services.
 Learning Collaborative: Funding Evaluating Financing Options and Fundraising Plans Jonathan Chapman Director, CHC Advisory Services July 12, 2018 1 Capital Link Launched in 1995, nonprofit, HRSA national
Baby Boomers! Demographically driven economic influences by the... What Is High Performance and How Do You Measure UP 5/16/2016
 What Is High Performance and How Do You Measure UP Terry Glasscock, Senior Project Consultant TCPA CEO/CFO Meeting May 18, 2016 1 Demographically driven economic influences by the... Baby Boomers! 2 1
It is all about demographics
 You Can t Manage What You Can t Measure! Terry Glasscock, Senior Project Consultant Cindy Barr, Senior Project Consultant TCPA CEO/CFO Meeting May 17, 2016 1 It is all about demographics that are working
C - Suite Transformation Management Training: Finance and Operations Overview. May 17, 2017
 C - Suite Transformation Management Training: Finance and Operations Overview Presented by: Peter R. Epp, CPA May 17, 2017 Overview Summary of Value Based Payment (VBP) Initiatives Underlying VBP Payment
Interactive Crash Course Long Range Financial Planning and Implications of Changes in Key Performance Drivers
 Long Range Financial Planning For Integrated Health Systems Interactive Crash Course Long Range Financial Planning and Implications of Changes in Key Performance Drivers April 2015 Learning Objectives
Erie County Medical Center Corporation Operating and Capital Budgets. For the year ending 2018
 Erie County Medical Center Corporation Operating and Capital Budgets For the year ending 2018 Table of Contents Page Management Discussion and Analysis 3-7 Regulatory Reporting Requirements 8 Budget Process
CHC Financial Crisis Planning AGENDA
 Tennessee Primary Care Association Webinar June 30, 2011 CHC Financial Crisis Planning Presented by: Michael Holton, Manager, Health Care Services Groupc Michael.Holton@McGladrey.Comober 12, 2006 1 AGENDA
Introduction to Managing with Metrics. Presented by: Terry Glasscock, Senior Project Consultant, Capital Link
 Introduction to Managing with Metrics Presented by: Terry Glasscock, Senior Project Consultant, Capital Link Why Be So Concerned Now? Capital Link Number of Workers Per Retiree 5 4 5 4.5 4 3 3 2 2 1 0
Safety Net Oral Health Financial Fundamentals
 Safety Net Oral Health Financial Fundamentals Basic Financial Essentials Mark Doherty DMD April,2014 Be Prepared! Vision Creation of high-quality, affordable, oral health programs that document the improvement
Title: The Comprehensive Primary Care Initiative: Another Side of the Story All Payer Aggregate Results
 Title: The Comprehensive Primary Care Initiative: Another Side of the Story The final evaluation of the Comprehensive Primary Care initiative (CPC) published in Health Affairs in June described the project
Aaron Vandervelde Managing Director Berkeley Research Group
 Aaron Vandervelde Managing Director Berkeley Research Group Statement re Interests Aaron Vandervelde provides services as an independent consultant concerning 340B matters to pharmaceutical manufacturers
Funding Sources for FQHC Capital Projects: Updates on New Markets Tax Credits and HRSA's Loan Guarantee Program
 Funding Sources for FQHC Capital Projects: Updates on New Markets Tax Credits and HRSA's Loan Guarantee Program Duncan McGillivray Project Consultant November 29, 2018 1 Capital Link Launched in 1995,
CAH Financial Indicators Report: Summary of Indicator Medians by State
 Flex Monitoring Team Data Summary Report No. 26: CAH Financial Indicators Report: Summary of Indicator Medians by State March 2018 The Flex Monitoring Team is a consortium of the Rural Health Research
STATE OF THE LINE REPORT
 ANNUAL ISSUES SYMPOSIUM STATE OF THE LINE REPORT T H E SYSTEM @WORK KATHY ANTONELLO, FCAS, FSA, MAAA CHIEF ACTUARY NCCI Copyright NCCI Holdings, Inc. All Rights Reserved. ANNUAL ISSUES SYMPOSIUM PROPERTY/CASUALTY
CAH Financial Indicators Report: Summary of Indicator Medians by State
 Flex Monitoring Team Data Summary Report No. 18: : Summary of Indicator Medians by State March 2016 The Flex Monitoring Team is a consortium of the Rural Health Research Centers located at the Universities
RE: Additional Input regarding Accountable Care Organizations (ACOs) and the Medicare Shared Saving Program
 and the Medicare Shared Saving Program") 221 MAIN STREET, SUITE 1500 SAN FRANCISCO, CA 94105 PBGH.ORG OFFICE 415.281.8660 FACSIMILE 415.520.0927 February 14, 2011 Donald M. Berwick, M.D. Administrator Centers for Medicare and Medicaid Services
221 MAIN STREET, SUITE 1500 SAN FRANCISCO, CA 94105 PBGH.ORG OFFICE 415.281.8660 FACSIMILE 415.520.0927 February 14, 2011 Donald M. Berwick, M.D. Administrator Centers for Medicare and Medicaid Services
Institute for Continued Learning Willamette University. Health Reform and its Impact on Hospitals and Delivery Systems
 Institute for Continued Learning Willamette University Health Reform and its Impact on Hospitals and Delivery Systems Mr. Aaron Crane Chief Finance and Strategy Officer Salem Health Objectives: This session
The Economic Impact of Health Care Collaborative of Rural Missouri
 The Economic Impact of Health Care Collaborative of Rural Missouri Economic Impact For more than 50 years, U.S. health centers have delivered comprehensive, high-quality preventive and primary health care
CF Health Advisors: Partner Biographies
 The Evolving Healthcare Landscape C F H E A LT H A D V I S O R S S E P T E M B E R, 2 0 1 6 CF Health Advisors: Partner Biographies CHARLENE FRIZZERA President and CEO JEREMY BROWN Managing Partner Former
D e v e l o p i n g a C o m p e t i t i v e N A P A p p l i c a t i o n : Y o u r B u d g e t a n d F i n a n c i a l M e a s u r e s
 D e v e l o p i n g a C o m p e t i t i v e N A P A p p l i c a t i o n : Y o u r B u d g e t a n d F i n a n c i a l M e a s u r e s G O A L S A N D O B J E C T I V E S The goals of this webinar include
Knowing When to Fold Them: Advice for Maximizing Revenue Cycle Performance
 Judy Tutino Business & Medical Specialist TSI 170 Third St. Old Forge, Pa. 18518 Phone- 570-451-1828 www.tsico.com Cell- 570-840-3961 Fax- 570-457-7427 judy.tutino@transworldsystems.com Knowing When to
PUBLIC HOSPITAL DISTRICT NO. 1 OF KING COUNTY, WASHINGTON, DBA VALLEY MEDICAL CENTER (A Component Unit of the University of Washington)
") Financial Statements (With Independent Auditors Report Thereon) Table of Contents Page(s) Independent Auditors Report 1 2 Management s Discussion and Analysis (Unaudited) 3 21 Basic Financial Statements:
Financial Statements (With Independent Auditors Report Thereon) Table of Contents Page(s) Independent Auditors Report 1 2 Management s Discussion and Analysis (Unaudited) 3 21 Basic Financial Statements:
Budgeting Basics 101
 Budgeting Basics 101 The Nuts and Bolts of Budget Planning November 3, 2008 Agenda Understanding Budget Basics What is a Budget? Budget Types: Six Categories Budget Approaches Case Study Components of
33rd Edition Skilled Nursing Facility Cost Comparison Report An Industry in Transition
 33rd Edition Skilled Nursing Facility Cost Comparison Report An Industry in Transition Based on 2017 Data Create Opportunities We promise to know you and help you. Table of Contents Executive Summary...3
Medicaid FQHC APMs What are they and what do they mean for health centers? Alex Harris, MSPH Deputy Director, Transformation Policy
 Medicaid FQHC APMs What are they and what do they mean for health centers? Alex Harris, MSPH Deputy Director, Transformation Policy aharris@nachc.org What does payment reform look like for health centers?
Mercy Health Quarterly Financial Report. As of and for the three months ended December 31, 2018 and 2017
 Mercylit Quarterly Financial Report As of and for the three months ended December 31, 2018 and 2017 Contents: - Consolidated Financial Statements (Unaudited) - Management Discussion & Analysis Consolidated
CAH Metrics and Financial Measures
 acumen CAH Metrics and Financial Measures Presented by Ann King White, CPA BKD, LLP August 5, 2015 AZ Rural Flex Program 2015 Performance Improvement Summit Financial Indicators and Comparison Benchmarks
Michigan Critical Access Hospitals
 Michigan Critical Access Hospitals Financial Benchmarking 2015 Michigan Center for Rural Health November 5, 2015 1 Agenda Update on Credit Analysis & Market Michigan Hospital Review 10 Year Trends Summary
9/23/2016. Our Services. Transitioning from Fee-for-Service to Value-based Reimbursement. Key Trends and Strategies for Rural Health Providers
 Transitioning from Fee-for-Service to Value-based Reimbursement Key Trends and Strategies for Rural Health Providers Paul MacLellan, CEO >> Health care consulting company >> Wholly owned subsidiary of
Financial Planning for Your Non-Profit Introduction Double Bottom Line
 Financial Planning for Your Non-Profit Introduction Double Bottom Line Developed under cooperative agreement with HHS, HRSA, HAB Access Ryan White TA at careacttarget.org Mission Bottom Line Progress of
Scorecards & Dashboards:
 Scorecards & Dashboards: If you can measure it, you can manage it The 15 th Annual Region IX Management Training Conference FireSky Resort and Spa Scottsdale, Arizona 85251 Greg Brandenburg Chief Executive
The Case For Value ACA to MACRA to MIPS
 The Case For Value ACA to MACRA to MIPS 2016-2019 Robert E Nesse M.D. Professor of Family Medicine Mayo Medical School Senior Director of Health Care Policy and Payment Reform nesse.robert@mayo.edu What
Healthcare Financial Management Association Certification Program. Module I: The Business of Health Care Learner s Guide
 Healthcare Financial Management Association Certification Program Module I: The Business of Health Care Learner s Guide For examination period beginning June 2015 1 Course 1 - The Big Picture Learning
3/31/2017. Financial Statements. Financial Statements WHY. Financial Statements WHAT ARE THEY. This is our report card or scoreboard
 Financial Statements RICHARD J. DONNELLY, MS ASRS 2017 (DALLAS) Financial Statements WHY This is our report card or scoreboard It tells us how well, or not so well, we are doing. Financial Statements WHAT
114.6 CMR: DIVISION OF HEALTH CARE FINANCE AND POLICY MEDICAL SECURITY BUREAU
 114.6 CMR 14.00: HEALTH SAFETY NET PAYMENTS AND FUNDING Section 14.01: General Provisions 14.02: Definitions 14.03: Sources and Uses of Funds 14.04: Total Hospital Assessment Liability to the Health Safety
Cracking the Code on Managing Costs and Forecasting Revenue in a PPS Environment
 Cracking the Code on Managing Costs and Forecasting Revenue in a PPS Environment January 18, 2018 Peter R. Epp, CPA CohnReznick LLP Todays Moderator Nicole Cadovius, MBA, CAPS, FAAIDD Director, Practice
6 Degrees Health Reference Based Pricing Processes and Standard Procedures
 6 Degrees Health Reference Based Pricing Processes and Standard Procedures 6 Degrees Health Background 6 Degrees Health was founded in May of 2012, with a focus on providing transparent solutions backed
JOINT TASK FORCE ON HEALTH CARE COST REVIEW (Senate Bill 419)
") May 11 th, 2018 JOINT TASK FORCE ON HEALTH CARE COST REVIEW (Senate Bill 419) 1 AGENDA 8:30-8:35 AM Welcome and Opening Remarks 8:35-9:30 AM Multi-stakeholder Approaches to Address Total Cost of Care 9:35-9:50
May 11 th, 2018 JOINT TASK FORCE ON HEALTH CARE COST REVIEW (Senate Bill 419) 1 AGENDA 8:30-8:35 AM Welcome and Opening Remarks 8:35-9:30 AM Multi-stakeholder Approaches to Address Total Cost of Care 9:35-9:50
National Summit on Healthcare Price, Cost and Quality Transparency How and Why Hospitals Set Prices December 2, 2013
 National Summit on Healthcare Price, Cost and Quality Transparency How and Why Hospitals Set Prices December 2, 2013 Presented by William O. Cleverley, Ph.D. President Suite 200 438 East Wilson Bridge
CONDENSED FINANCIAL REPORT
 CONDENSED AN EQUAL OPPORTUNITY/ADA INSTITUTION CONDENSED Index Page Financial Performance Review 3 Financial Report by Operating Entity 4 Consolidated Balance Sheet 5 Consolidated Statement of Revenues
ations than Chapman Jona Scenario Planning: e oactiv Modeling Financial Implic
 Proactive Scenario Planning: Modeling Financial Implications Jonathan Chapman Director CHC Advisory Services, Capital Link Webinar October 10, 2017 1 Your World almost every day 2 Do We Manage Strategically?
How To Develop A Case Rate: A Guide To Bundled Payments
 How To Develop A Case Rate: A Guide To Bundled Payments The 2018 OPEN MINDS Strategy & Innovation Institute June 5, 2018 2:30 3:45 PM Ken Carr, Senior Associate, OPEN MINDS Paul Duck, Principal & Consultant,
Value-Based Reimbursement Contracting: Strategies for Payer-Provider Success
 Value-Based Reimbursement Contracting: Strategies for Payer-Provider Success Presented by: Jim Wright Vice President, xg Health Solutions Agenda Key Considerations for Value Based Contracting Keys for
MultiCare Health System Year End 2012 Results December 31, 2012
 MultiCare Health System Year End 2012 Results December 31, 2012 MultiCare Health System (MHS), a Washington nonprofit corporation, is an integrated healthcare delivery system providing inpatient, outpatient,
Leadership in Home Health: Elevating Everyone s Role to Stay Afloat
 Leadership in Home Health: Elevating Everyone s Role to Stay Afloat CPAs & ADVISORS experience clarity // 2014 MAHC Annual Conference Mark P. Sharp, CPA Objectives Identify how to drive accountability
Georgia Chapter. Chapter Scores for CBSC: FY18 Overall High Satisfaction*: 91%
 Chapter Scores for CBSC: FY18 Overall High Satisfaction*: 91% FY17 Overall High Satisfaction: 69% Favorable/Unfavorable FY17 to FY18: 22% *FY18 High Satisfaction calculated by summing the total of respondents
Patient Centered Medical Home (PCMH) Initiative
 Initiative") Patient Centered Medical Home (PCMH) Initiative A Michigan Primary Care Transformation (MiPCT) Partnership with the State Innovation Model h e a l t h i e r a n d m o r e p r o d u c t i v e l i v e s,
Patient Centered Medical Home (PCMH) Initiative A Michigan Primary Care Transformation (MiPCT) Partnership with the State Innovation Model h e a l t h i e r a n d m o r e p r o d u c t i v e l i v e s,
PIN Ohio Association of Community Health Centers October 22, Curt Degenfelder
 PIN 2013-01 Ohio Association of Community Health Centers October 22, 2013 Curt Degenfelder curt@degenfelderhealth.com 310-740-0960 The Latest From the Field OIG Report August 2013 the accounting records
MEDICAL COST TRENDS THEN AND NOW
 MEDICAL COST TRENDS THEN AND NOW BARRY LIPTON, FCAS, MAAA PRACTICE LEADER AND SENIOR ACTUARY NCCI Copyright NCCI Holdings, Inc. All Rights Reserved. WC Average Medical Cost per Lost-Time Claim Private
DETERMINING USUAL, CUSTOMARY, AND REASONABLE CHARGES FOR HEALTHCARE SERVICES
 Research and Planning Consultants, LP DETERMINING USUAL, CUSTOMARY, AND REASONABLE CHARGES FOR HEALTHCARE SERVICES Table of Contents Introduction... 1 Usual and Customary vs. Usual, Customary and Reasonable...
National Health Expenditure Accounts
 National Health Expenditure Accounts Joe Benson, Devin Stone and The NHEA Team American Academy of Actuaries Webinar February 4, 2016 Overview National health spending reached $3.0 trillion, or $9,523
THE $10,000 QUESTION: TACKLING THE COMPLEXITIES OF VALUE-BASED PHYSICIAN COMPENSATION
 THE $10,000 QUESTION: TACKLING THE COMPLEXITIES OF VALUE-BASED PHYSICIAN COMPENSATION HFMA First Illinois Chapter August 12, 2014 Stu Schaff Manager, DGA Partners Agenda > Background & Context > Measures
Resource Guide. Is your community-based organization (CBO) Pricing CBO Services in a New Health Care Environment. Introduction
 Pricing CBO Services in a New Health Care Environment. Introduction") Resource Guide Pricing CBO Services in a New Health Care Environment Is your community-based organization (CBO) interested in pursuing contracting opportunities with health care entities, including health
Resource Guide Pricing CBO Services in a New Health Care Environment Is your community-based organization (CBO) interested in pursuing contracting opportunities with health care entities, including health
CHILDREN'S HOSPITAL AND HEALTH SYSTEM, INC. AND AFFILIATES CONSOLIDATED FINANCIAL REPORT MARCH 2017
 CHILDREN'S HOSPITAL AND HEALTH SYSTEM, INC. AND AFFILIATES CONSOLIDATED FINANCIAL REPORT MARCH 2017 CONSOLIDATED FINANCIAL REPORT TABLE OF CONTENTS Management Discussion and Analysis of Financial Performance
TITLE XVI HEALTH CENTER LOAN GUARANTEE PROGRAM APPLICATION
 TITLE XVI HEALTH CENTER LOAN GUARANTEE PROGRAM APPLICATION Please answer all questions as completely and accurately as possible and provide all requested attachments. Only shaded/starred items are required
REVENUE RECOGNITION FOR HEALTH CARE PROVIDERS
 REVENUE RECOGNITION FOR HEALTH CARE PROVIDERS Tracy Young, CPA Partner -BKD, LLP Brent Beaulieu, CPA VP Finance Baptist Health ASU 2014-09 REVENUE FROM CONTRACTS WITH CUSTOMERS Effective for Public Business
Capital Plans and Needs of Health Centers A National Perspective
 Capital Plans and Needs of Health Centers A National Perspective Prepared by Capital Link 2015 ACKNOWLEDGEMENT This project was supported by the Health Resources and Services Administration (HRSA) of the
Q SPECIAL TOPIC REPORT: PROVIDER-OWNED HEALTH PLANS
 THE ACADEMY LUMERIS STRATEGIC TRACKING SURVEY Q3 2018 SPECIAL TOPIC REPORT: PROVIDER-OWNED HEALTH PLANS SEPTEMBER 2018 PROVIDER-OWNED HEALTH PLANS INTRODUCTION As health systems increasingly participate
Key Financial Concepts for FQHCs Ohio Association of Community Health Centers October 22, 2013
 Key Financial Concepts for FQHCs Ohio Association of Community Health Centers October 22, 2013 Curt Degenfelder curt@degenfelderhealth.com 310-740-0960 Key Metrics to Measure Health Center Financial Performance
Physician Care: Physician Compensation. Presented by Albert R. Riviezzo, Esq. Fox Rothschild LLP Exton, PA
 Physician Care: Physician Compensation Presented by Albert R. Riviezzo, Esq. Fox Rothschild LLP Exton, PA Overview Compensation trends for employed physicians Regulatory risks of physician compensation
MACRAnomics. Patient-Level Economics and Strategic Implications for Providers. Presented to: NW Ohio HFMA October 20, 2016
 MACRAnomics Patient-Level Economics and Strategic Implications for Providers Presented to: NW Ohio HFMA October 20, 2016 Property of HealthScape Advisors Strictly Confidential 2 MACRAnomics: Objectives
Primary Care Compensation Redesign. PPEC, June 26, 2016
 Primary Care Compensation Redesign PPEC, June 26, 2016 subtitle A Catholic healthcare ministry serving Ohio and Kentucky 1 2 Mercy Health Physicians - Who are we! 795 FTE physicians and 348 APP FTE s (
Session 75 OF, Advantages & Challenges for Provider Led Health Plans. Moderator: LuCretia Leola Hydell, ASA, MAAA
 Session 75 OF, Advantages & Challenges for Provider Led Health Plans Moderator: LuCretia Leola Hydell, ASA, MAAA Presenters: Jerry Clark, MD, FACP Josh Martin Mark Rishell SOA Antitrust Disclaimer SOA
Comprehensive Primary Care Payment Calculator User s Guide
 1 Comprehensive Primary Care Payment Calculator User s Guide Prepared by Health Data Decisions August 2017 Disclaimer: Information provided in connection with this calculator by FMAHealth and its contributors
Vermont Medicaid Next Generation Pilot Program 2017 Performance
 State of Vermont Department of Vermont Health Access NOB 1 South, 1 st Floor 280 State Drive Waterbury, Vermont 05671 REPORT TO THE GENERAL ASSEMBLY Vermont Medicaid Next Generation Pilot Program 2017
QPP Other Payer Advanced APMs: CMMI Multi-Payer Model Payer Perspective
 QPP Other Payer Advanced APMs: CMMI Multi-Payer Model Payer Perspective OCTOBER 30, 2017 Crystal Gateway Marriott Hotel Arlington, VA Laura Mortimer Public Health Analyst at Center for Medicare and Medicaid
The Guthrie Clinic Financial Highlights for the Three and Six Months Ended December 31, 2017
 Financial Highlights for the Three and Six Months Ended December 31, 2017 I. Introduction In accordance with the provisions of the Master Indenture relating to the 2011 and 2007 Guthrie Health Bonds, enclosed
Cost-Modeling for CBO Services for Healthcare Partnership Success
 Cost-Modeling for CBO Services for Healthcare Partnership Success Sharon Fusco, M.A., Vice President Business Services Group, Council on Aging of Southwestern Ohio Part of the Aging and Disability Business
MeasureIT Benchmarking Report IT Budgeting Metrics
 MeasureIT Benchmarking Report IT Budgeting Metrics Respondent Name: Sample Health Care Company Name: Info-Tech Email: healthcare@infotech.com Date Completed: Jun 12, 2012 Executive Summary The following
Health Care Reform in the United States
 Health Care Reform in the United States 4 Corners MGMA Conference April 2014 Karl Rebay, MBA, FHFMA Director, Health Care Consulting 1 The material appearing in this presentation is for informational purposes
Value Based Contracting
 Value Based Contracting CONCEPTS FOR THE MEDICAL PRACTICE dhgllp.com/healthcare 225 Peachtree Street NE, Suite 600 Atlanta, GA 30303 Bill Hannah PRINCIPAL Bill.Hannah@dhgllp.com 404.575.8921 Doral Davis-Jacobsen
Medicare Advantage Value-Based Insurance Design: Considerations and implications
 White paper Medicare Advantage Value-Based Insurance Design: Considerations and implications Health plans and providers are slowly moving away from traditional provider payment systems to a more innovative
H 7829 S T A T E O F R H O D E I S L A N D
 LC00 0 -- H S T A T E O F R H O D E I S L A N D IN GENERAL ASSEMBLY JANUARY SESSION, A.D. 0 A N A C T RELATING TO INSURANCE - PRIMARY CARE TRUST ACT Introduced By: Representatives Ranglin-Vassell, and
North Dakota Chapter
 Chapter Scores for CBSC: FY18 Overall High Satisfaction*: 94% FY17 Overall High Satisfaction: 80% Favorable/Unfavorable FY17 to FY18: 14% *FY18 High Satisfaction calculated by summing the total of respondents
Proposed FY 2018 Operating Budget
 Proposed FY 2018 Operating Budget June 27, 2017 HEALTHCARE FINANCE FY 2018 Operating Budget Revenue Assumptions The FY 2017 projected year end actuals include a net decrease of $4.2 million which includes
Formulary Access for Patients with Mental Health Conditions
 Formulary Access for Patients with Mental Health Conditions Background on Avalere s PlanScape and Methodology for Formulary Analysis PlanScape Methodology This analysis reviews formulary coverage in the
CHAPTER 1. Trends in the Overall Health Care Market
 CHAPTER 1 Trends in the Overall Health Care Market Billions Chart 1.1: Total National Health Expenditures, 1980 2016 $4,000 $3,500 $3,000 $2,500 $2,000 $1,500 $1,000 $500 $0 Inflation Adjusted (2) 80 81
HIGHLIGHTS OF THE HEALTH REFORM RECONCILIATION BILL AS OF 3/15/2010
 HIGHLIGHTS OF THE HEALTH REFORM RECONCILIATION BILL AS OF 3/15/2010 Health Insurance Expansion Makes the tax credits for health insurance premiums more generous for individuals and families with incomes
Healthcare Finance Trends and Perspectives
 Healthcare Finance Trends and Perspectives AONE Annual Conference, Fort Worth, TX April 2 nd, 2016 Chuck Alsdurf, MAcc, CPA Director, Healthcare Finance Policy, Operational Initiatives Healthcare Financial
SunTrust Robinson Humphrey 2017 Financial Technology, Business & Government Services Summit
 1 SunTrust Robinson Humphrey 2017 Financial Technology, Business & Government Services Summit December 2017 2017 NAVIGANT CONSULTING, INC. ALL RIGHTS RESERVED DISCLOSURE STATEMENT Statements included in
4 Ways to Drill Down into Bad Debt
 4 Ways to Drill Down into Bad Debt By Craig Kappel and Brett McMillan Conducting this four-step analysis of your hospital s bad debt is the first step to controlling it. Revenue cycle scorecards typically
Bank of America Leverage Finance Conference. November 29, 2016
 Bank of America Leverage Finance Conference November 29, 2016 FORWARD-LOOKING STATEMENTS Certain statements in this presentation constitute forward-looking statements that is, statements that relate to
MEDICARE ADVANTAGE MA Plans. to $28 per month 46% HOW HEALTH SYSTEMS CAN THRIVE WITH. Developing Your Medicare Advantage Strategy PRODUCT
 HOW HEALTH SYSTEMS CAN THRIVE WITH MEDICARE ADVANTAGE The 2019 Medicare Advantage (MA) plan year began on January 1st and once again more Americans enrolled in MA plans than the year before. Fueled by
Workers Compensation Outlook Recap
 Workers Compensation Outlook Recap Evolving Workplace Premium Growth in the Latest Year Underwriting Results Improved Again Frequency Continues to Decline Economic Recovery 2 Property/Casualty (P/C) Results
Quarterly. Paul Masterson at
 GENESISS HEALTHCARE SYSTEM Quarterly Financial Disclosure Statement As of and for the Three Months Ended March 31, 2016 PLEASE NOTE THAT THIS DOCUMENT INCLUDES MANAGEMENT S DISCUSSION AND ANALYSIS, AS
Explaining the State Integrated Care and Financial Alignment Demonstrations for Dual Eligible Beneficiaries
 P O L I C Y B R I E F kaiser commission on medicaid and the uninsured Explaining the State Integrated Care and Financial Alignment Demonstrations for Dual Eligible Beneficiaries October 2012 Over the last
UNIVERSITY HOSPITAL (A Component Unit of the State of New Jersey)
") Basic Financial Statements, Management s Discussion and Analysis and Schedules of Expenditures of Federal and State of New Jersey Awards June 30, 2016 (With Independent Auditors Reports Thereon) Table
Basic Financial Statements, Management s Discussion and Analysis and Schedules of Expenditures of Federal and State of New Jersey Awards June 30, 2016 (With Independent Auditors Reports Thereon) Table
10 Statistics to Analyze a Hospital s Performance
 10 Statistics to Analyze a Hospital s Performance Chicago, Illinois / May 20, 2011 Presented by: Zachary Hafner, Vice President zhafner@kaufmanhall.com DEBT-RELATED FINANCIAL ADVISORY Since 1985, Kaufman
S E C T I O N. National health care and Medicare spending
 S E C T I O N National health care and Medicare spending Chart 6-1. Medicare made up about one-fifth of spending on personal health care in 2002 Total = $1.34 trillion Other private 4% a Medicare 19%
AOA-35 Sept 17-20, 2017 Las Vegas
 AOA-35 Sept 17-20, 2017 Las Vegas Step Up Your Game: Financial Reporting Like a Pro Presented by: Jeff Boomershine, CPA Principal, Somerset CPAs Todd Blum, MHA, MBA, CMPE Chief Executive Officer Ear, Nose
Accounting for State Wrap Around Payments and Other Issues
 Accounting for State Wrap Around Payments and Other Issues Glenn Grigsby, CPA October 15, 2012 Today s Agenda History of Wrap Around Methodology Reconciliation Potential Problem Areas Best Practices Other
10 Statistics to Analyze a Hospital s Performance
 10 Statistics to Analyze a Hospital s Performance Becker s Hospital Review Annual Meeting Chicago, Illinois / May 20, 2011 Presented by: Zachary Hafner, Vice President zhafner@kaufmanhall.com DEBT-RELATED
Surviving The Storm 10/6/2015. Physicians Are Feeling the Pain
 Surviving The Storm REMAINING AN INDEPENDENT PHYSICIAN PRACTICE Physicians Are Feeling the Pain Financially Squeezed Decline in reimbursement and loss of income Overhead, malpractice insurance and working