2017 Social Protection Performance Monitor (SPPM) dashboard results
|
|
|
- Michael Roberts
- 5 years ago
- Views:
Transcription
1 Social Protection Committee SPC/ISG/2018/1/3 FIN 2017 Social Protection Performance Monitor (SPPM) dashboard results (February 2018 update) Table of contents Summary... 2 SPPM dashboard results... 3 Detailed review of the social trends identified in the SPPM dashboard... 5 SPPM methodology Definitions and data sources
2 Summary This summary document provides an overview of recent developments in the social situation in the EU, based on the February 2018 update of the Social Protection Performance Monitor (SPPM) dashboard, a tool which uses a set of key EU social indicators for monitoring developments in the social situation in the European Union. The latest update of the SPPM dashboard is based on the now complete set of 2016 EU- data and the already available 2016 Labour Force Survey data. The latest figures point to a continued general improvement in the social situation. In particular, significant falls in the at-risk-of-povertyor-social-exclusion rate were observed in 12 Member States over , driven by declines in the rate of severe material deprivation and in the share of the population living in (quasi-)jobless households. Nevertheless, with regard to the Europe 2020 poverty and social exclusion target of lifting at least 20 million people from the risk of poverty or social exclusion by 2020, in 2016 there were still around one million more people living at risk of poverty or social exclusion in the EU compared to , with a total of 118 million people or close to 1 in 4 Europeans. For the EU as a whole, the general ongoing improvement in the social situation is evidenced by around two-thirds of the indicators in the SPPM flagging up a noticeably higher number of positive changes than negative ones across Member States. Of particular note, beyond the reduction in the risk of poverty or social exclusion, is the continued improvement in the labour market, with further reductions in long term unemployment and in youth exclusion, as well as continued improvements in the participation of older workers. The related improvement in the employment and financial situation of households, with rises in household disposable income in a large majority of Member States, has resulted in reductions in severe material deprivation and in the share of the population in jobless households. Nevertheless, the following main negative trends, or trends to watch (i.e. where around a third or more of all Member States show a significant deterioration in the given indicator), are identified for the most recent period ( ): Continued deterioration with regard to the depth of poverty in many Member States Rises in the at-risk-of-poverty rates for people residing in (quasi-)jobless households, pointing to continued reduction in the adequacy of social benefits in several countries. At the same time, there are signs of a decline in the relative income and living conditions of the elderly, although to a large extent this just reflects the reversal of the general trend observed in the years following the crisis years in which their situation relative to the rest of the population improved, while now the relative income situation of the working age population is doing better as the labour market situation and incomes from work have improved. 1 The reference year, due to data availability, for the target adopted in


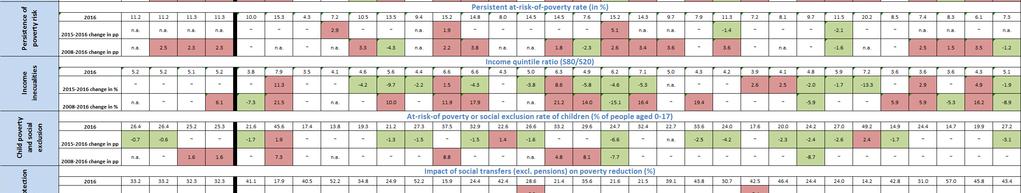
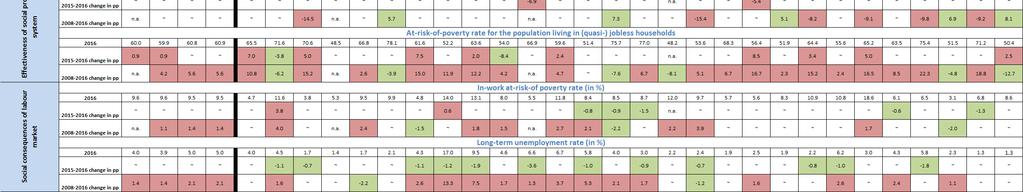
3 SPPM dashboard results 3
 The method used to estimate the statistical significance of the net changes, based on regression and developed by Net-2 (an EU")
; v) For BG, major break in the time series in 2014 for the material deprivation indicators, so for SMD and AROPE the change 2008-2013 is used for the longer")
 For DK, breaks in series for the period 2008-2015 which mainly affect indicators related to incomes and")
 For EE, major break in series in 2014 for variables in EU- due to implementation of a new methodology based on the use of administrative files.")
4 Note: i) Only significant changes have been highlighted in green/red (positive/negative changes). "~" refers to stable performance (i.e. insignificant change), "n.a." refers to data not (yet) being available. See table at end of document for full details of significance tests; ii) The method used to estimate the statistical significance of the net changes, based on regression and developed by Net-2 (an EU funded network consisting of a group of institutions and researchers conducting analysis using EU-) is still under improvement; iii) For AT, break in series in 2011 for persistent poverty risk ("n.a." shown for the period compared to 2008); iv) For BE, major break in 2011 in the self-reported unmet need for medical examination ("n.a." shown for the period compared to 2008); v) For BG, major break in the time series in 2014 for the material deprivation indicators, so for SMD and AROPE the change is used for the longer period compared to Also a break in 2016 for EU- based indicators, but comparison of changes are still valid; vi) For DK, breaks in series for the period which mainly affect indicators related to incomes and to a lesser degree variables highly correlated with incomes ("n.a." shown for the period compared to 2008 for these).; vii) For EE, major break in series in 2014 for variables in EU- due to implementation of a new methodology based on the use of administrative files. Hence change used for the longer period compared to 2008; viii) For HR, no long-term comparison for EU--based indicators compared to 2008 as as no EU- data published by Eurostat before 2010; ix) For LU, major break in series in 2016 for EU- based indicators ("n.a." shown for latest year comparisons, and long-term comparison is for period ); x) For NL, improvement to the definition of income in 2016 has some impact on comparison of income-based indicators over time; xi) For RO, breaks in series in 2010 for LFS-based indicators, so changes shown for longer term change; xii) For SI, break in time series in Healthy Life Years indicator (change of question in 2010) which affects the comparison of change since 2008; xiii) For UK, changes in the EU- survey vehicle and institution in 2012 might have affected the results on trends since 2008 and interpretation of data on the longer-term trend must therefore be particularly cautious; xv) For the healthy life years at 65 indicator the longer term reference period is
5 Detailed review of the social trends identified in the SPPM dashboard It is now over four years since the EU economy started its slow though consistent recovery following a double-dip recession. Increases in employment in the EU progressed gradually in line with economic growth, although with employment growth notably strong relative to the pace of GDP growth over the most recent years. As a result, the employment level in the EU now exceeds the previous 2008 peak, although large disparities remain across countries. However, this employment growth has been accompanied by a lower expansion of hours worked per person employed. The increase in employment has extended to all sub-population groups and unemployment, including youth unemployment, continues to recede in the EU. Household incomes and financial conditions of EU households continue to improve, thanks mainly to higher income from work 2. Nevertheless, despite the gradual improvements, social conditions still remain worse compared to 2008 in many Member States. Figure 1: Evolution of the Europe 2020 poverty and social exclusion target, EU27 3 (figures in 1000s) Source: Eurostat (EU-) Note: AROPE - at-risk-of poverty-or-social-exclusion rate; AROP - at-risk-of-poverty rate; (Quasi-)jobless HHs - share of population living in quasi-jobless households (i.e. very low work intensity (VLWI) households); SMD - severe material deprivation rate. For the at-risk-of-poverty rate, the income reference year is the calendar year prior to the survey year except for the UK (survey year) and Ireland (the 12 months preceding the survey). Similarly, the (quasi-) jobless households rate refers to the previous calendar year while for the SMD rate it is the current survey year. 2 See Chart 30 in the February 2018 edition of the Employment and Social Developments in Europe - Quarterly Review for the decomposition of household income, available on the following site ( 3 Note figures here refer to the EU27 aggregate, since time series for the EU28 aggregate not available back to
6 This latest update of the Social Protection Performance Monitor points to a continued general improvement in the social situation. 12 Member States registered significant falls in the share of the population at risk of poverty or social exclusion in 2016 and only 2 significant rises, with overall figures for the population at risk of poverty or social exclusion pointing to a fall of a million in the EU between 2015 and Underlying the fall in this overall figure are continued strong reductions in the population experiencing severe material deprivation (down around 2.5 million) and to a lesser extent in the number of people living in (quasi-)jobless households (down 0.7 million), although the population at risk of poverty continued to edge up by 0.2 million (Figure 1). Nevertheless, with regard to the Europe 2020 poverty and social exclusion target of lifting at least 20 million people from the risk of poverty or social exclusion, in 2016 there were still around one million more people living at risk of poverty or social exclusion in the EU compared to Main recent trends Changes over the latest annual reference period provide continued signs of a general improvement in the social situation, with most indicators mainly flagging up positive changes across Member States (Figure 2). In particular, strong positive developments in the social situation can be observed in the following areas: rises in real gross household disposable income in 22 MS along with significant reductions in the severe material deprivation rate in 16 MS and in the housing cost overburden rate in 10 MS. This reflects that household incomes and financial conditions of EU households have further improved in the most recent period, benefitting from stronger economic activity and improved labour markets; a reduction in the risk of poverty or social exclusion for the overall population in 12 MS, driven by falls in severe material deprivation and in the share of the population living in (quasi-)jobless households. There are also associated reductions in the share of children at risk of poverty or social exclusion in many Member States (13); further reductions in long term unemployment (in 12 MS) and in youth exclusion, with significant falls the youth unemployment ratio in 18 MS, reflecting improvements in the labour market; continued improvements in the labour market participation of older workers (as evidenced by increases in the employment rate for year olds in 24 MS). In addition, there are signs that the previous rises in the at-risk-of poverty rate may be coming to an end, while the situation with regard to income inequalities is mixed (improving in 12 Member States but deteriorating in 7). Nevertheless, for the EU as a whole the following main negative trends, or trends to watch (i.e. where around a third or more of all Member States show a significant deterioration in the given indicator), can still be identified for the most recent period: 6
7 Deterioration with regard to the depth of poverty risk in 8 MS Rises in the at-risk-of-poverty rates for people residing in (quasi-)jobless households in 9 MS, pointing to a continued reduction in the adequacy of social benefits in several countries. At the same time, there are strong signs of a decline in the relative income and living conditions of the elderly, with rises in the at-risk-of-poverty-or-social-exclusion rate for those aged 65 and over in 11 Member States along with falls in the median relative income ratio of the elderly in 19 countries (although in contrast for the aggregate replacement ratio some 13 MS recorded an improvement). This decline in the situation of the elderly is a reversal of the general trend observed in the years following the crisis, but reflects to a large extent the evolution of the relative income situation of the working age population as the labour market situation and incomes from work have improved. Figure 2: Areas of deterioration (social trends to watch) and improvement for the period * Source: Social Protection Performance Monitor * For EU- based indicators the changes actually refer to for income and household work intensity indicators. 7
8 Figure 3 highlights per country the number of significant improvements or deteriorations that have taken place in the social indicators in the SPPM dashboard over the most recent period. The Member States with the highest number of positive recent changes are Hungary, Latvia, Portugal, Spain and the UK, all recording improvements on more than 10 indicators and with very few indicators showing a deterioration. In contrast, improvements in Austria, France, the Netherlands and Sweden were much more limited, with significant improvements only registered on 4 indicators or less. Almost all Member States recorded a larger number of indicators showing a significant improvement than a deterioration, although Italy and the Netherlands stand out as having a larger number of indicators showing a deterioration (with significant declines on 9 indicators in Italy). These results should be considered in parallel with the longer term situation of Member States with regard to the number of indicators which show a deterioration or improvement compared to 2008 (Figure 6). Figure 3: Number of SPPM key social indicators per Member State with a significant improvement or deterioration from 2015 to 2016* Source: Social Protection Performance Monitor Note: Bars refer to the number of SPPM indicators which have registered a statistically (and substantively, where relevant) significant deterioration or improvement between 2015 and * For EU- based indicators changes actually refer to for income and household work intensity indicators. There is a total of 23 dashboard indicators relevant for this reference period. 8
9 Looking at the longer-term developments since 2008 and the beginning of the Europe 2020 strategy, for many social areas the situation still remains noticeably worse as a result of the economic crisis, despite recent improvements (Figure 4). The areas with the most substantial deterioration compared to 2008 are: increased (long-term) exclusion from the labour market in general (with rises in the longterm unemployment rate and in the share of the population living in (quasi-)jobless households in around half of MS), together with rises in the poverty risk for people living in (quasi-)jobless households in 19 MS; increased income inequality (in 11 MS) and a rise in the prevalence and depth of poverty risk (with the poverty risk gap up in 17 MS) and its persistence (in 11 MS), and also in the risk of in-work poverty (in 9 MS); still strong signs of youth exclusion (with significantly higher NEET rates in 11 MS and youth unemployment ratios in 13 MS; rises in the housing cost overburden rate for households in 10 MS. The dashboard indicators show there have also been a number of improvements, notably in the employment of older workers and in the relative situation of the elderly. The labour market situation of older workers has improved markedly, as evidenced by increases in the employment rate for the age group in almost all Member States. At the same time, compared to 2008, the relative income situation of the elderly (aged 65 and over) also shows clear signs of improvement in around two-thirds of Member States, with decreases in the number of elderly living at risk of poverty or social exclusion in 19 MS as well as an improvement in their income situation with respect to the rest of the population (as evidenced by rises in the aggregate replacement ratio in 19 MS, and the median relative income ratio of elderly people in 17). However, this trend should be correctly interpreted, as it does not necessarily show an improvement in absolute terms. As pension income remained stable during the economic crisis while the working age population suffered from substantial income loss (wage decreases, job loss, and decreases in benefit levels), the relative, but not necessarily the absolute, position of the elderly has improved, highlighting the important role of pension systems. Other areas which have seen an improvement include an increasing number of healthy life years among the population aged over 65 in many Member States, and significant decreases in the number of early school leavers in Europe, with reductions in 20 MS. Overall, there have also been improvements compared to 2008 in gross household disposable income in a large majority of Member States (19) and reductions in severe material deprivation in many (10). 9
10 Figure 4: Areas of deterioration (Social trends to watch) and improvement for the period * Source: Social Protection Performance Monitor Note: i) For AT, break in series in 2011 for persistent poverty risk (so trend not considered for the period compared to 2008); ii) For BE, major break in 2011 in the self-reported unmet need for medical examination (so trend not considered for the period compared to 2008); iii) For 2014 BG registered a major break in the time series for the material deprivation indicator (SMD) and AROPE indicator, so longer-term changes are presented for the period only; iv) For DK, breaks in series for the period which mainly affect indicators related to incomes and to a lesser degree variables highly correlated with incomes (so trends not considered for the period compared to 2008 for these); v) For 2014 EE registered a major break in series for EU- variables, so longer-term changes for these are presented for the period only; vi) For HR, no EU- data published by Eurostat before 2010; vii) For LU, major break in series in 2016 for EU- based indicators, so long-term comparison is for the period ); viii) For NL, improvement to the definition of income in 2016 has some impact on comparison of income-based indicators over time; ix) For RO, breaks in series in 2010 for LFSbased indicators, so changes used for longer term change; x) For UK, changes in the survey vehicle and institution in 2012 might have affected the results on trends since 2008 and interpretation of data on the longer-term trend must therefore be particularly cautious; xi) * For healthy life years at 65 the reference period is Figure 5 shows the number of indicators in the SPPM dashboard for which a given country has registered a significant deterioration or improvement over the period 2008 to The Member States with the most worrisome developments are Cyprus, Greece, Italy and Spain, with deterioration on 13 or more indicators, and with only a few indicators showing an improvement. In contrast, Austria, Belgium, the Czech Republic, Malta and the UK have only registered significant deterioration on 3 or fewer indicators along with improvement on a larger number of indicators. 10
11 Around half of Member States now show a higher number of improvements than declines, most notably Latvia and the UK. Figure 5. Number of SPPM indicators per Member State with a significant deterioration or improvement between 2008 and 2016* Source: Social Protection Performance Monitor Note: i) For AT, break in series in 2011 for persistent poverty risk (so trend not considered for the period compared to 2008); ii) For BE, major break in 2011 in the self-reported unmet need for medical examination (so trend not considered for the period compared to 2008); iii) For 2014 BG registered a major break in the time series for the material deprivation indicator (SMD) and AROPE indicator, so longer-term changes are presented for the period only; iv) For DK, breaks in series for the period which mainly affect indicators related to incomes and to a lesser degree variables highly correlated with incomes (so trends not considered for the period compared to 2008 for these); v) For 2014 EE registered a major break in series for EU- variables, so longer-term changes for these are presented for the period only; vi) For HR, no EU- data published by Eurostat before 2010; vii) For LU, major break in series in 2016 for EU- based indicators, so long-term comparison is for the period ); viii) For NL, improvement to the definition of income in 2016 has some impact on comparison of income-based indicators over time; ix) For RO, breaks in series in 2010 for LFSbased indicators, so changes shown for longer term change; x) For UK, changes in the survey vehicle and institution in 2012 might have affected the results on trends since 2008 and interpretation of data on the longer-term trend must therefore be particularly cautious; xi) * For healthy life years at 65 the reference period is ; xii) The bars refer to the number of SPPM indicators which have registered a statistically (and substantively, where relevant) significant deterioration or improvement between 2008 and 2015/2016; xiii) There are a total number of 25 SPPM dashboard indicators for this reference period. 11
12 Annex SPPM methodology The Council endorsed on 4 October 2012 the main features of a new instrument, proposed by the Social Protection Committee (SPC), called the "Social Protection Performance Monitor" (SPPM) aimed at contributing to strengthening the monitoring of the social situation and the development of social protection policies in the EU, according to the Treaty mandate (art. 160 of TFEU) of the SPC to work in this area. One key element of this is a dashboard of key social indicators. What is the objective? The objective of the SPPM dashboard is to identify annual "social trends to watch" and "positive recent social trends" in the EU, common to several Member States, which can stimulate in-depth review and targeted multilateral surveillance. Given the objective of the dashboard, the focus is on both most recent changes and changes in comparison to 2008, as the base year for monitoring progress for the social aspects of the European 2020 Strategy. What is the basis of the SPPM dashboard? The SPPM makes use of the EU portfolio of social indicators, recognizing effectively the importance of the overarching portfolio as a summary set/first tier of indicators to be used for monitoring the major social trends in EU countries across the relevant social policy areas. How are trends identified? The indicators are monitored on the basis of levels and evolutions. In order to assess the statistical significance of the year-to-year changes and the changes in comparison to the reference year 2008, use is made of accuracy estimates, developed by Eurostat in cooperation with the Second Network for the analysis of EU- (Net- 2, an EU funded network consisting of a group of institutions and researchers conducting analysis using EU-). For certain of the indicators in the dashboard further work to produce estimates of the significance of net changes is ongoing. Similarly, further work on the LFS-based indicators is underway. Where such estimates are not yet available, specific tentative criteria have been agreed, awaiting further statistical developments. For those indicators where statistical estimates are available, a second criterion of substantive significance is applied in most cases to avoid flagging up very small changes in the indicator. The current situation regarding the statistical and substantive significance rules applied for each SPPM indicator is summarised in the following table. A trend needs to be evident in a certain number of Member States in order to qualify as a "social trend to watch" or a "positive recent social trend." The general criterion of at least 1/3 of Member States is used in order to ensure that there is a significant basis for conclusions. However, a certain level of flexibility is kept and if a strong trend is evident in a smaller number of countries or this is the case for a specific group of countries, it could still be considered as a "trend to watch" or a "positive trend." 12

13 How are the SPPM results used? The SPPM results are presented in the SPC annual report and are endorsed by the EPSCO Council. On the basis of the identified social trends to watch, the SPC undertakes thematic in-depth reviews where drivers and policy solutions for the identified challenges are discussed among Member States. Summary table of the current statistical and substantive significance rules applied for the SPPM indicators Notes: i) For the healthy life years at 65 indicators the reference period is ; ii) The method used to estimate the statistical significance of the net changes, based on regression and developed by Net-2 (an EU funded network consisting of a group of institutions and researchers conducting analysis using EU-) is still under improvement; iii) For LFS-based indicators the check for substantive significance in the latest annual change is based on an analysis of the volatility of the time series. 13
14 Definitions and data sources Indicator Definition Data source At risk of poverty or social exclusion rate The sum of persons who are: at-risk-of-poverty or severely materially deprived or living in quasi jobless households (i.e. with very low work intensity) as a share of the total population. At-risk-of-poverty rate Severe material deprivation rate Material deprivation rate Share of population(0-59) in (quasi-) jobless, i.e. very low work intensity (VLWI), households Share of persons aged 0+ with an equivalised disposable income below 60% of the national equivalised median income. Equivalised median income is defined as the household's total disposable income divided by its "equivalent size", to take account of the size and composition of the household, and is attributed to each household member. Equivalisation is made on the basis of the OECD modified scale. Share of population living in households lacking at least 4 items out of the following 9 items: i) to pay rent or utility bills, ii) keep home adequately warm, iii) face unexpected expenses, iv) eat meat, fish or a protein equivalent every second day, v) a week holiday away from home, or could not afford (even if wanted to) vi) a car, vii) a washing machine, viii) a colour TV, or ix) a telephone. Share of population living in households lacking at least 3 items out of the following 9 items: i) to pay rent or utility bills, ii) keep home adequately warm, iii) face unexpected expenses, iv) eat meat, fish or a protein equivalent every second day, v) a week holiday away from home, or could not afford (even if wanted to) vi) a car, vii) a washing machine, viii) a colour TV, or ix) a telephone. People aged 0-59, living in households, where working-age adults (18-59) work 20% or less of their total work potential during the past year. Relative poverty risk gap rate Difference between the median equivalised income of persons aged 0+ below the at-risk-of poverty threshold and the threshold itself, expressed as a percentage of the at-riskof poverty threshold. 14
15 Persistent at-risk-ofpoverty rate Share of persons aged 0+ with an equivalised disposable income below the at-risk-of-poverty threshold in the current year and in at least two of the preceding three years. Income quintile ratio S80/S20 The ratio of total income received by the 20% of the country's population with the highest income (top quintile) to that received by the 20% of the country's population with the lowest income (lowest quintile). Income must be understood as equivalised disposable income. At risk of poverty or social exclusion rate of children The sum of children (0-17) who are: at-risk-of-poverty or severely materially deprived or living in (quasi-)jobless households (i.e. households with very low work intensity (below 20%) as a share of the total population aged Impact of social transfers (excluding pensions) on poverty reduction Reduction in the at-risk-of-poverty rate in % due to social transfers, calculated as the percentage difference between the at-risk-of-poverty rate before and after social transfers At-risk-of-poverty rate for the population living in (quasi-)jobless (i.e. very low work intensity) households In-work at-risk-of-poverty rate Long-term unemployment rate (active population, 15+) Youth unemployment ratio Early leavers from education and training Share of persons aged (0-59) with an equivalised disposable income below 60% of the national equivalised median income who live in households where working-age adults (18-59) worked 20% or less of their total work potential during the past year. Individuals (18-64) who are classified as employed according to their most frequent activity status and are at risk of poverty. The distinction is made between wage and salary employment plus self-employment and wage and salary employment only. Total long-term unemployed population ( 12 months' unemployment; ILO definition) as a proportion of total active population. Total unemployed young people (ILO definition), years, as a share of total population in the same age group (i.e. persons aged who were without work during the reference week, were currently available for work and were either actively seeking work in the past four weeks or had already found a job to start within the next three months as a percentage of the total population in the same age group). Share of persons aged 18 to 24 who have only lower secondary education (their highest level of education or Eurostat LFS Eurostat - LFS Eurostat LFS 15
16 NEETs (15-24) training attained is 0, 1 or 2 according to the 1997 International Standard Classification of Education ISCED 97) and have not received education or training in the four weeks preceding the survey. Share of young people aged not in employment, education or training Eurostat - LFS Employment rate of older workers Persons in employment in age group 55-64, as a proportion of total population in the same age group. Eurostat LFS At risk of poverty or social exclusion rate of the elderly Median relative income ratio of elderly people The sum of elderly (65+) who are: at-risk-of-poverty or severely materially deprived or living in (quasi-)jobless households (i.e. with very low work intensity) as a share of the total population in the same age group. Median equivalised disposable income of people aged 65+ as a ratio of income of people aged Aggregate replacement ratio Housing cost overburden rate Share of the population with self-reported unmet need for medical care Healthy life years at 65 Change in real gross household disposable income (GHDI) Median individual gross pension income of relative to median individual gross earnings of 50-59, excluding other social benefits 4 Percentage of the population living in a household where total housing costs (net of housing allowances) represent more than 40% of the total disposable household income (net of housing allowances). Total self-reported unmet need for medical examination for the following three reasons: financial barriers + waiting times + too far to travel. Number of years that a person at 65 is still expected to live in a healthy condition. To be interpreted jointly with life expectancy (included in the SPPM contextual information). Real growth in gross household disposable income (GHDI). Real GDHI is calculated as nominal GDHI divided by the deflator of household final consumption expenditure. Eurostat Eurostat - National accounts Definition of the in-work at-risk-of-poverty rate Individuals who are classified as employed, defined here as being in work for over half of the year and who are at risk of poverty, i.e. live with an equivalised disposable income after social transfers below 60% of the national median equivalised disposable income. 4 Pension income covers pensions from basic (first pillar) schemes, means-tested welfare schemes; early retirement widow's (first pillar) and other old age-related schemes. Other social benefits includes: unemployment-related benefits; family-related benefits; benefits relating to sickness or invalidity; education-related allowances; any other personal social benefits. Work income includes income from wage and salary employment and income from self-employment. 16
17 In defining in-work (monetary) poverty, the income for people who are employed is calculated for households, but the poverty status is assigned to the individual. This means that in-work poverty, when measured, is influenced by both the total disposable income (including non-wage income) and the household composition. The assumption of equal sharing of resources within households (giving the so-called equivalised income) that underlies the definition of monetary income poverty means that the economic well-being of individuals depends on the total resources contributed by all members of the households. In this respect some income can move from one household member to the other without affecting the actual income of the individual. Hence, measuring attachment to the labour market at the level of households provides a better indicator of the welfare implications associated with labour market status than individual employment rates. Income/disposable income Household income comes from different sources. Employment is generally the main source of income but it is not the only one. Individuals may receive transfers from the state (e.g. unemployment benefits, pensions, etc.); property income (e.g. dividends from financial assets, etc.); and income from other sources (e.g. rental income from property or from the sale of property or goods, etc.). Employed In EU, people are defined as employed based on the self-declared economic status. Working full year/less than full year Working full year corresponds to working during the total number of months for which information on the activity status has been provided. Less than full year corresponds to working for more than half, but less than all, the numbers of the months for which information on activity status is provided. 17
2015 Social Protection Performance Monitor (SPPM) dashboard results
 dashboard results") Social Protection Committee SPC/ISG/2016/02/4 FIN 2015 Social Protection Performance Monitor (SPPM) dashboard results Table of contents Summary... 2 SPPM dashboard... 3 Detailed review of trends identified
Social Protection Committee SPC/ISG/2016/02/4 FIN 2015 Social Protection Performance Monitor (SPPM) dashboard results Table of contents Summary... 2 SPPM dashboard... 3 Detailed review of trends identified
SOCIAL PROTECTION COMMITTEE ANNUAL REPORT 2018
 SOCIAL PROTECTION COMMITTEE ANNUAL REPORT 2018 2018 SPC ANNUAL REVIEW OF THE SOCIAL PROTECTION PERFORMANCE MONITOR (SPPM) AND DEVELOPMENTS IN SOCIAL PROTECTION POLICIES REPORT ON KEY SOCIAL CHALLENGES
SOCIAL PROTECTION COMMITTEE ANNUAL REPORT 2016 REVIEW OF THE SOCIAL PROTECTION PERFORMANCE MONITOR AND DEVELOPMENTS IN SOCIAL PROTECTION POLICIES
 SOCIAL PROTECTION COMMITTEE ANNUAL REPORT 2016 REVIEW OF THE SOCIAL PROTECTION PERFORMANCE MONITOR AND DEVELOPMENTS IN SOCIAL PROTECTION POLICIES SOCIAL PROTECTION COMMITTEE ANNUAL REPORT 2016 REVIEW OF
The key messages which are drawn from this report are contained in doc /16.
 Council of the European Union Brussels, 30 September 2016 (OR. en) 12607/16 SOC 566 EMPL 376 ECOFIN 838 EDUC 303 COVER NOTE From: To: Subject: The Social Protection Committee Permanent Representatives
SPC monitoring of the social situation. Solidar Conference EPSR Achieving upwards convergence with a rights based approach?
 SPC monitoring of the social situation Solidar Conference EPSR Achieving upwards convergence with a rights based approach? 6/12/2016 SPC monitoring tools Portfolio of EU-Social Indicators Social Protection
The Social Protection Committee. Social Europe
 The Protection Committee One of the 4 Advisory Committees: a) i) Economic and Financial Committee (art. 134 TFEU) /LIME indicator sub-group a) ii) Employment Committee (art.150 TFEU)/ IndicatorGroup b)iii)
Economic, employment and social policies in the new EU 2020 strategy
 EUROPEAN COMMISSION DG Employment, Social Affairs and Equal Opportunities Social protection and inclusion policies Walter WOLF Economic, employment and social policies in the new EU 2020 strategy Skopje,
The intergenerational divide in Europe. Guntram Wolff
 The intergenerational divide in Europe Guntram Wolff Outline An overview of key inequality developments The key drivers of intergenerational inequality Macroeconomic policy Orientation and composition
COUNCIL OF THE EUROPEAN UNION. Brussels, 17 November /11 SOC 1008 ECOFIN 781
 COUNCIL OF THE EUROPEAN UNION Brussels, 17 November 2011 17050/11 SOC 1008 ECOFIN 781 COVER NOTE from: Council Secretariat to: Permanent Representatives Committee / Council (EPSCO) Subject: "The Europe
EUROPEAN SEMESTER THEMATIC FACTSHEET SOCIAL INCLUSION
 EUROPEAN SEMESTER THEMATIC FACTSHEET SOCIAL INCLUSION 1. INTRODUCTION Fighting poverty or social exclusion is a key political priority for the European Commission. Since 2010, this has been mainstreamed
Measuring poverty and inequality in Latvia: advantages of harmonising methodology
 Measuring poverty and inequality in Latvia: advantages of harmonising methodology UNITED NATIONS Inter-regional Expert Group Meeting Placing equality at the centre of Agenda 2030 Santiago, Chile 27 28
EUROPEAN SEMESTER THEMATIC FACTSHEET SOCIAL INCLUSION
 EUROPEAN SEMESTER THEMATIC FACTSHEET SOCIAL INCLUSION 1. INTRODUCTION Fighting poverty and social exclusion is a key political priority for the European Commission. Since 2010, this has been included in
COVER NOTE The Employment Committee Permanent Representatives Committee (Part I) / Council EPSCO Employment Performance Monitor - Endorsement
 / Council EPSCO Employment Performance Monitor - Endorsement") COUNCIL OF THE EUROPEAN UNION Brussels, 15 June 2011 10666/1/11 REV 1 SOC 442 ECOFIN 288 EDUC 107 COVER NOTE from: to: Subject: The Employment Committee Permanent Representatives Committee (Part I) / Council
COUNCIL OF THE EUROPEAN UNION Brussels, 15 June 2011 10666/1/11 REV 1 SOC 442 ECOFIN 288 EDUC 107 COVER NOTE from: to: Subject: The Employment Committee Permanent Representatives Committee (Part I) / Council
COUNCIL OF THE EUROPEAN UNION. Brussels, 13 June /1/13 REV 1 SOC 409 ECOFIN 444 EDUC 190
 COUNCIL OF THE EUROPEAN UNION Brussels, 13 June 2013 10373/1/13 REV 1 SOC 409 ECOFIN 444 EDUC 190 COVER NOTE from: to: Subject: The Employment Committee Permanent Representatives Committee (Part I) / Council
Poverty and social inclusion indicators
 Poverty and social inclusion indicators The poverty and social inclusion indicators are part of the common indicators of the European Union used to monitor countries progress in combating poverty and social
Copies can be obtained from the:
 Published by the Stationery Office, Dublin, Ireland. Copies can be obtained from the: Central Statistics Office, Information Section, Skehard Road, Cork, Government Publications Sales Office, Sun Alliance
Social Protection Performance Monitor (SPPM)
") Social Protection Performance Monitor (SPPM) Rudi Van Dam Seminarie SPPM/EPM 6 november 2013 Overzicht Plaats in het proces Componenten van de SPPM Monitoring van de EU-2020 target Dashboard of key social
Social Protection Performance Monitor (SPPM) Rudi Van Dam Seminarie SPPM/EPM 6 november 2013 Overzicht Plaats in het proces Componenten van de SPPM Monitoring van de EU-2020 target Dashboard of key social
DRAFT JOINT EMPLOYMENT REPORT FROM THE COMMISSION AND THE COUNCIL. accompanying the Communication from the Commission on the Annual Growth Survey 2018
 EUROPEAN COMMISSION Brussels, 22.11.2017 COM(2017) 674 final DRAFT JOINT EMPLOYMENT REPORT FROM THE COMMISSION AND THE COUNCIL accompanying the Communication from the Commission on the Annual Growth Survey
THE EVOLUTION OF SOCIAL INDICATORS DEVELOPED AT THE LEVEL OF THE EUROPEAN UNION AND THE NEED TO STIMULATE THE ACTIVITY OF SOCIAL ENTERPRISES
 Scientific Bulletin Economic Sciences, Volume 13/ Issue2 THE EVOLUTION OF SOCIAL INDICATORS DEVELOPED AT THE LEVEL OF THE EUROPEAN UNION AND THE NEED TO STIMULATE THE ACTIVITY OF SOCIAL ENTERPRISES Daniela
Social Protection and Social Inclusion in Europe Key facts and figures
 MEMO/08/625 Brussels, 16 October 2008 Social Protection and Social Inclusion in Europe Key facts and figures What is the report and what are the main highlights? The European Commission today published
Social trends and dynamics of poverty and social exclusion. ESDE conference Brussels 06/02/2013
 Social trends and dynamics of poverty and social exclusion ESDE conference Brussels 06/02/2013 1-in-4 people in the EU at risk of poverty or exclusion 27% of working age population at risk of poverty for
Agenda. Background. The European Union standards for establishing poverty and inequality measures
 Workshop on Computing and Analysing Poverty Measures Budapest, - December The European Union standards for establishing poverty and inequality measures Eva Menesi Senior statistician Living Standard, Employment-
Social Situation Monitor - Glossary
 Social Situation Monitor - Glossary Active labour market policies Measures aimed at improving recipients prospects of finding gainful employment or increasing their earnings capacity or, in the case of
EU Survey on Income and Living Conditions (EU-SILC)
") 16 November 2006 Percentage of persons at-risk-of-poverty classified by age group, EU SILC 2004 and 2005 0-14 15-64 65+ Age group 32.0 28.0 24.0 20.0 16.0 12.0 8.0 4.0 0.0 EU Survey on Income and Living
16 November 2006 Percentage of persons at-risk-of-poverty classified by age group, EU SILC 2004 and 2005 0-14 15-64 65+ Age group 32.0 28.0 24.0 20.0 16.0 12.0 8.0 4.0 0.0 EU Survey on Income and Living
COUNCIL OF THE EUROPEAN UNION. Brussels, 21 May /10 SOC 358
 COUNCIL OF THE EUROPEAN UNION Brussels, 21 May 2010 9964/10 SOC 358 COVER NOTE from: The Social Protection Committee to: Permanent Representatives Committee (Part I) / Council (EPSCO) Subject: Europe 2020
Labour market and social issues in the CR Federico LUCIDI DG Employment, Social Affairs and Inclusion
 Labour market and social issues in the CR 2018 Federico LUCIDI DG Employment, Social Affairs and Inclusion 1. Labour market developments & assessment of CSR2 Q3-2000 Q3-2001 Q3-2002 Q3-2003 Q3-2004 Q3-2005
Research Briefing, January Main findings
 Poverty Dynamics of Social Risk Groups in the EU: An analysis of the EU Statistics on Income and Living Conditions, 2005 to 2014 Dorothy Watson, Bertrand Maître, Raffaele Grotti and Christopher T. Whelan
FSO News. Poverty in Switzerland. 20 Economic and social Situation Neuchâtel, July 2014 of the Population. Results from 2007 to 2012
 Federal Department of Home Affairs FDHA Federal Statistical Office FSO FSO News Embargo: 15.07.2014, 9:15 20 Economic and social Situation Neuchâtel, July 2014 of the Population Poverty in Switzerland
The at-risk-of poverty rate declined to 18.3%
 Income and Living Conditions 2017 (Provisional data) 30 November 2017 The at-risk-of poverty rate declined to 18.3% The Survey on Income and Living Conditions held in 2017 on previous year incomes shows
September With regularly updated data and charts downloadable here. Social Europe EU Employment and Social Situation I Quarterly Review
 September 2015 With regularly updated data and charts downloadable here September 2015 I 1 This Quarterly Review provides in-depth analysis of recent labour market and social developments. It is prepared
NOTE ON EU27 CHILD POVERTY RATES
 NOTE ON EU7 CHILD POVERTY RATES Research note prepared for Child Poverty Action Group Authors: H. Xavier Jara and Chrysa Leventi Institute for Social and Economic Research (ISER) University of Essex The
Multidimensional poverty measurement for EU-SILC countries
 Multidimensional poverty measurement for EU-SILC countries Sabina Alkire, Mauricio Apablaza, Euijin Jung OPHI Seminar, 17 Nov 2014 1. Background 2. Methodology 3. Three possible Measures 4. Results a.
The evolution of the social situation and social protection in Belgium 2018
 The evolution of the social situation and social protection in Belgium 2018 Increasing pressure on social protection adequacy Monitoring the social situation in Belgium and the progress towards the social
Concept note The fiscal compact for social cohesion. European view
 Theme 1: Fiscal compact. EUROPE Concept note The fiscal compact for social cohesion. European view First Latin American Social Cohesion Conference. A strategic priority in the European Union-Latin American
Supplement March Trends in poverty and social exclusion between 2012 and March 2014 I 1
 Supplement March 2014 Trends in poverty and social exclusion between 2012 and 2013 March 2014 I 1 This supplement to the Quarterly Review provides in-depth analysis of recent labour market and social developments.
1. Poverty and social inclusion indicators
 POVERTY AND SOCIAL INCLUSION INDICATORS BASED ON THE EUROPEAN SURVEY ON INCOME AND LIVING CONDITIONS (EU-SILC) IN THE CONTEXT OF THE OPEN METHOD FOR COORDINATION The open method of coordination is an instrument
Delegations will find attached the key messages from the above-mentioned annual report for endorsement by the Council (EPSCO) on 9 March 2015.
 on 9 March 2015.") Council of the European Union Brussels, 24 February 2015 6194/15 SOC 78 COVER NOTE from: to: Subject: The Social Protection Committee Permanent Representatives Committee (Part I) / Council (EPSCO) Social
Council of the European Union Brussels, 24 February 2015 6194/15 SOC 78 COVER NOTE from: to: Subject: The Social Protection Committee Permanent Representatives Committee (Part I) / Council (EPSCO) Social
European Commission. Statistical Annex of Alert Mechanism Report 2017
 European Commission Statistical Annex of Alert Mechanism Report 2017 COMMISSION STAFF WORKING DOCUMENT STATISTICAL ANNEX Accompanying the document REPORT FROM THE COMMISSION TO THE EUROPEAN PARLIAMENT,
Country Health Profiles
 State of Health in the EU Country Health Profiles Brussels, November 2017 1 The Country Health Profiles 1. Highlights 2. Health status 3. Risk Factors 4. Health System (description) 5. Performance of Health
Intra-household inequality and material deprivation and poverty in Europe
 Intra-household inequality and material deprivation and poverty in Europe Tania Burchardt and Eleni Karagiannaki Social Situation Monitor Seminar Multidimensional Poverty in the EU Brussels 12 th March
Special Eurobarometer 418 SOCIAL CLIMATE REPORT
 Special Eurobarometer 418 SOCIAL CLIMATE REPORT Fieldwork: June 2014 Publication: November 2014 This survey has been requested by the European Commission, Directorate-General for Employment, Social Affairs
Growth, competitiveness and jobs: priorities for the European Semester 2013 Presentation of J.M. Barroso,
 Growth, competitiveness and jobs: priorities for the European Semester 213 Presentation of J.M. Barroso, President of the European Commission, to the European Council of 14-1 March 213 Economic recovery
4 Distribution of Income, Earnings and Wealth
 NERI Quarterly Economic Facts Autumn 2014 4 Distribution of Income, Earnings and Wealth Indicator 4.1 Indicator 4.2a Indicator 4.2b Indicator 4.3a Indicator 4.3b Indicator 4.4 Indicator 4.5a Indicator
Investment in France and the EU
 Investment in and the EU Natacha Valla March 2017 22/02/2017 1 Change relative to 2008Q1 % of GDP Slow recovery of investment, and with strong heterogeneity Overall Europe s recovery in investment is slow,
October 2010 Euro area unemployment rate at 10.1% EU27 at 9.6%
 STAT//180 30 November 20 October 20 Euro area unemployment rate at.1% EU27 at 9.6% The euro area 1 (EA16) seasonally-adjusted 2 unemployment rate 3 was.1% in October 20, compared with.0% in September 4.
Themes Income and wages in Europe Wages, productivity and the wage share Working poverty and minimum wage The gender pay gap
 5. W A G E D E V E L O P M E N T S At the ETUC Congress in Seville in 27, wage developments in Europe were among the most debated issues. One of the key problems highlighted in this respect was the need
January 2010 Euro area unemployment rate at 9.9% EU27 at 9.5%
 STAT//29 1 March 20 January 20 Euro area unemployment rate at 9.9% EU27 at 9.5% The euro area 1 (EA16) seasonally-adjusted 2 unemployment rate 3 was 9.9% in January 20, the same as in December 2009 4.
Delegations will find attached the draft Joint Employment Report, as finalised by the Employment Committee.
 Council of the European Union Brussels, 18 February 2016 (OR. en) 6149/16 SOC 65 EMPL 40 ECOFIN 104 EDUC 27 COVER NOTE From: To: Subject: Employment Committee Permanent Representatives Committee / Council
Poverty and Social Exclusion in Bosnia and Herzegovina Insights from the 2011 Extended Household Budget Survey
 Public Disclosure Authorized Public Disclosure Authorized Public Disclosure Authorized Public Disclosure Authorized Poverty and Social Exclusion in Bosnia and Herzegovina Insights from the 2011 Extended
HOW RECESSION REFLECTS IN THE LABOUR MARKET INDICATORS
 REPUBLIC OF SLOVENIA HOW RECESSION REFLECTS IN THE LABOUR MARKET INDICATORS Matej Divjak, Irena Svetin, Darjan Petek, Miran Žavbi, Nuška Brnot ??? What is recession?? Why in Europe???? Why in Slovenia?
European Union Statistics on Income and Living Conditions (EU-SILC)
") European Union Statistics on Income and Living Conditions (EU-SILC) European Union Statistics on Income and Living Conditions (EU-SILC) is a household survey that was launched in 23 on the basis of a gentlemen's
European Union Statistics on Income and Living Conditions (EU-SILC) European Union Statistics on Income and Living Conditions (EU-SILC) is a household survey that was launched in 23 on the basis of a gentlemen's
Joint Report on Social Protection and Social Inclusion 2010
 MEMO/1/62 Brussels, 4 March 1 Joint Report on Social Protection and Social Inclusion 1 What is the Joint Report and what does it cover? The Joint Report reviews the main trends in social protection and
Employment and Social Developments in Europe
 Employment and Social Developments in Europe Quarterly Review February 2018 Social Europe February 2018 With regularly updated data and charts downloadable here February 2018 I 1 The Employment and Social
P R E S S R E L E A S E Risk of poverty
 HELLENIC REPUBLIC HELLENIC STATISTICAL AUTHORITY Piraeus, 23 / 6 / 2017 P R E S S R E L E A S E Risk of poverty 2016 SURVEY ON INCOME AND LIVING CONDITIONS (Income reference period 2015) The Hellenic Statistical
European Semester Country Report for Greece
 European Semester Country Report for Greece European commission IOBE conference: Integrating Greece into the European Semester Policy Framework: Priorities for sustainable growth and competitiveness Wednesday,
Supplement September Towards a better measurement of welfare and inequalities. September 2014 I 1
 Supplement September 214 Towards a better measurement of welfare and inequalities September 214 I 1 Social Europe This supplement to the Quarterly Review provides in-depth analysis of recent labour market
The Northern Ireland labour market is characterised by relatively. population of working age are not active in the labour market at
 INTRODUCTION The Northern Ireland labour market is characterised by relatively high levels of economic inactivity. Around 28 per cent of the population of working age are not active in the labour market
Short Analytical Web Note 2/2016
 Short Analytical Web Note 2/2016 Analysis of the Youth Guarantee in EU Member States This note provides an analytical overview of the labour market outcomes of young people in the EU Member States following
PROGRESS TOWARDS THE LISBON OBJECTIVES 2010 IN EDUCATION AND TRAINING
 PROGRESS TOWARDS THE LISBON OBJECTIVES IN EDUCATION AND TRAINING In 7, reaching the benchmarks for continues to pose a serious challenge for education and training systems in Europe, except for the goal
Gini coefficient
 POVERTY AND SOCIAL INCLUSION INDICATORS (Preliminary results for 2010) 1 Poverty and social inclusion indicators are part of the general EU indicators for tracing the progress in the field of poverty and
Investment and Investment Finance. the EU and the Polish story. Debora Revoltella
 Investment and Investment Finance the EU and the Polish story Debora Revoltella Director - Economics Department EIB Warsaw 27 February 2017 Narodowy Bank Polski European Investment Bank Contents We look
Internationally comparative indicators of material well-being in an age-specific perspective
 Internationally comparative indicators of material well-being in an age-specific perspective 1. Which international indicators in this area are currently available and published? Review of selected recent
Income Indicators for the EU s Social Inclusion Strategy
 Income Indicators for the EU s Social Inclusion Strategy Isabelle Maquet-Engsted Social Protection Committee European Commission David Stanton Social Protection Committee European Commission Abstract This
PROGRESS TOWARDS THE LISBON OBJECTIVES 2010 IN EDUCATION AND TRAINING
 PROGRESS TOWARDS THE LISBON OBJECTIVES IN EDUCATION AND TRAINING In, reaching the benchmarks for continues to pose a serious challenge for education and training systems in Europe, except for the goal
Employment of older workers Research Note no. 5/2015
 Research Note no. 5/2015 E. Őzdemir, T. Ward M. Fuchs, S. Ilinca, O. Lelkes, R. Rodrigues, E. Zolyomi February - 2016 EUROPEAN COMMISSION Directorate-General for Employment, Social Affairs and Inclusion
Securing sustainable and adequate social protection in the EU
 Securing sustainable and adequate social protection in the EU Session on Social Protection & Security IFA 12th Global Conference on Ageing 11 June 2014, HICC Hyderabad India Dr Lieve Fransen European Commission
National Social Target for Poverty Reduction. Social Inclusion Monitor 2011
 National Social Target for Poverty Reduction Social Inclusion Monitor 2011 published by Department of Social Protection Arás Mhic Dhiarmada Store Street Dublin 1 Ireland ISBN: 978-1-908109-17-0 Dublin,
Social exclusion, long term poverty and social transfers in the EU: Evidence from the ECHP
 Panos Tsakloglou Athens University of Economics and Business, IZA & IMOP and Fotis Papadopoulos Athens University of Economics and Business Social exclusion, long term poverty and social transfers in the
ADEQUACY AND SUSTAINABILITY OF PENSIONS
 EUROPEAN SEMESTER THEMATIC FACTSHEET ADEQUACY AND SUSTAINABILITY OF PENSIONS 1. INTRODUCTION Pensions are the main source of income for older people in Europe, coming mostly from 'pay-as-you-go' public
DRAFT JOINT EMPLOYMENT REPORT FROM THE COMMISSION AND THE COUNCIL. accompanying the Communication from the Commission on the Annual Growth Survey 2016
 EUROPEAN COMMISSION Brussels, 26.11.2015 COM(2015) 700 final DRAFT JOINT EMPLOYMENT REPORT FROM THE COMMISSION AND THE COUNCIL accompanying the Communication from the Commission on the Annual Growth Survey
Social Class Variations in Income Poverty, Deprivation and Consistent Poverty: An Analysis of EU-SILC
 Social Class Variations in Income Poverty, Deprivation and Consistent Poverty: An Analysis of EU-SILC Christopher T. Whelan, Dorothy Watson and Bertrand Maitre Comparative EU Statistics on Income and Living
POVERTY AND SOCIAL INCLUSION INDICATORS IN Main poverty indicators
 POVERTY AND SOCIAL INCLUSION INDICATORS IN 2013 Poverty and social inclusion indicators are part of the general EU indicators for tracing the progress in the field of poverty and social exclusion. Main
The EFTA Statistical Office: EEA - the figures and their use
 The EFTA Statistical Office: EEA - the figures and their use EEA Seminar Brussels, 13 September 2012 1 Statistics Comparable, impartial and reliable statistical data are a prerequisite for a democratic
Employment and Social Developments in Europe
 Employment and Social Developments in Europe Quarterly Review December 218 Social Europe December 218 With regularly updated data and charts downloadable here December 218 I 1 The Employment and Social
Live Long and Prosper? Demographic Change and Europe s Pensions Crisis. Dr. Jochen Pimpertz Brussels, 10 November 2015
 Live Long and Prosper? Demographic Change and Europe s Pensions Crisis Dr. Jochen Pimpertz Brussels, 10 November 2015 Old-age-dependency ratio, EU28 45,9 49,4 50,2 39,0 27,5 31,8 2013 2020 2030 2040 2050
PENSIONS IN OECD COUNTRIES: INDICATORS AND DEVELOPMENTS
 PENSIONS IN OECD COUNTRIES: INDICATORS AND DEVELOPMENTS Marius Lüske Directorate for Employment, Labour and Social Affairs, OECD Lisbon, 28.09.2018 Marius.LUSKE@oecd.org www.oecd.org/els OUTLINE Talk based
JOINT EMPLOYMENT REPORT STATISTICAL ANNEX
 ,--~- -._, COMMISSION OF THE EUROPEAN COMMUNITIES Brussels, 6.9.2000 COM(2000) 551 final Volume II JOINT EMPLOYMENT REPORT STATISTICAL ANNEX Definitions, tables and charts (presented by the Commission)
Sustainability and Adequacy of Social Security in the Next Quarter Century:
 Sustainability and Adequacy of Social Security in the Next Quarter Century: Balancing future pensions adequacy and sustainability while facing demographic change Krzysztof Hagemejer (Author) John Woodall
ILO World of Work Report 2013: EU Snapshot
 Greece Spain Ireland Poland Belgium Portugal Eurozone France Slovenia EU-27 Cyprus Denmark Netherlands Italy Bulgaria Slovakia Romania Lithuania Latvia Czech Republic Estonia Finland United Kingdom Sweden
Raising the retirement age is the labour market ready for active ageing: evidence from EB and Eurofound research
 Raising the retirement age is the labour market ready for active ageing: evidence from EB and Eurofound research Robert Anderson, EUROFOUND, Dublin Reforming pension systems in Europe and Central Asia
EXCLUSION. Reduce the number of people at risk of poverty or social exclusion by 1,500,000. Source: National Reform Programme (2015)
") Poland 1 NATIONAL 2020 TARGET FOR THE REDUCTION OF POVERTY AND SOCIAL EXCLUSION Reduce the number of people at risk of poverty or social exclusion by 1,500,000 Source: National Reform Programme (2015)
Poland 1 NATIONAL 2020 TARGET FOR THE REDUCTION OF POVERTY AND SOCIAL EXCLUSION Reduce the number of people at risk of poverty or social exclusion by 1,500,000 Source: National Reform Programme (2015)
Investment in Ireland and the EU
 Investment in and the EU Debora Revoltella Director Economics Department Dublin April 10, 2017 20/04/2017 1 Real investment: IE v EU country groupings Real investment (2008 = 100) 180 160 140 120 100 80
in focus Statistics Contents Labour Mar k et Lat est Tr ends 1st quar t er 2006 dat a Em ploym ent r at e in t he EU: t r end st ill up
 Labour Mar k et Lat est Tr ends 1st quar t er 2006 dat a Em ploym ent r at e in t he EU: t r end st ill up Statistics in focus This publication belongs to a quarterly series presenting the European Union
Income protection of atypical workers in the event of unemployment in Europe
 EM 18/18 Income protection of atypical workers in the event of unemployment in Europe H. Xavier Jara and Alberto Tumino October 2018 Income protection of atypical workers in the event of unemployment in
Fiscal sustainability challenges in Romania
 Preliminary Draft For discussion only Fiscal sustainability challenges in Romania Bucharest, May 10, 2011 Ionut Dumitru Anca Paliu Agenda 1. Main fiscal sustainability challenges 2. Tax collection issues
COMMISSION STAFF WORKING DOCUMENT. accompanying document to the
 EN EN EN EUROPEAN COMMISSION Brussels, xxx SEC(9) yyy final COMMISSION STAFF WORKING DOCUMENT accompanying document to the REPORT FROM THE COMMISSION TO THE COUNCIL, THE EUROPEAN PARLIAMENT, THE EUROPEAN
in focus Statistics T he em ploym ent of senior s in t he Eur opean Union Contents POPULATION AND SOCIAL CONDITIONS 15/2006 Labour market
 T he em ploym ent of senior s in t he Eur opean Union Statistics in focus OULATION AND SOCIAL CONDITIONS 15/2006 Labour market Authors Christel ALIAGA Fabrice ROMANS Contents In 2005, in the EU-25, 22.2
Folia Oeconomica Stetinensia DOI: /foli Progress in Implementing the Sustainable Development
 Folia Oeconomica Stetinensia DOI: 10.1515/foli-2015-0023 Progress in Implementing the Sustainable Development Concept into Socioeconomic Development in Poland Compared to other Member States Ewa Mazur-Wierzbicka,
Working Poor in Europe
 Working Poor in Europe Georg Fischer Director for Analysis, Evaluation, External Relations DG Employment, social affairs and inclusion 29.7.2013 Clarification of definitions and terms Overall social trends
3 Labour Costs. Cost of Employing Labour Across Advanced EU Economies (EU15) Indicator 3.1a
 Indicator 3.1a") 3 Labour Costs Indicator 3.1a Indicator 3.1b Indicator 3.1c Indicator 3.2a Indicator 3.2b Indicator 3.3 Indicator 3.4 Cost of Employing Labour Across Advanced EU Economies (EU15) Cost of Employing Labour
3 Labour Costs Indicator 3.1a Indicator 3.1b Indicator 3.1c Indicator 3.2a Indicator 3.2b Indicator 3.3 Indicator 3.4 Cost of Employing Labour Across Advanced EU Economies (EU15) Cost of Employing Labour
Flash Eurobarometer 398 WORKING CONDITIONS REPORT
 Flash Eurobarometer WORKING CONDITIONS REPORT Fieldwork: April 2014 Publication: April 2014 This survey has been requested by the European Commission, Directorate-General for Employment, Social Affairs
EUROPEAN COMMISSION EUROSTAT
 EUROPEAN COMMISSION EUROSTAT Directorate F: Social statistics Unit F-3: Labour market Doc.: Eurostat/F3/LAMAS/29/14 WORKING GROUP LABOUR MARKET STATISTICS Document for item 3.2.1 of the agenda LCS 2012
II/II. Social Investment Package COMMISSION STAFF WORKING DOCUMENT
 EUROPEAN COMMISSION Brussels, 20.2.2013 SWD(2013) 38 final II/II Social Investment Package COMMISSION STAFF WORKING DOCUMENT Evidence on Demographic and Social Trends Social Policies' Contribution to Inclusion,
POVERTY, SOCIAL EXCLUSION AND LIVING CONDITIONS IN MALTA: AN ANALYSIS USING SILC
 POVERTY, SOCIAL EXCLUSION AND LIVING CONDITIONS IN MALTA: AN ANALYSIS USING SILC Article published in the Quarterly Review 1:, pp. 1-7 POVERTY, SOCIAL EXCLUSION AND LIVING CONDITIONS IN MALTA: AN ANALYSIS
Income Poverty in the EU Situation in 2007 and Trends (based on EU-SILC )
") European Centre Europäisches Zentrum Centre EuropÉen Income Poverty in the EU Situation in 007 and Trends (based on EU-SILC 005-008) by Orsolya Lelkes and Katrin Gasior Orsolya Lelkes and Katrin Gasior
European Centre Europäisches Zentrum Centre EuropÉen Income Poverty in the EU Situation in 007 and Trends (based on EU-SILC 005-008) by Orsolya Lelkes and Katrin Gasior Orsolya Lelkes and Katrin Gasior
The European economy since the start of the millennium
 The European economy since the start of the millennium A STATISTICAL PORTRAIT 2018 edition 1 Since the start of the millennium, the European economy has evolved and statistics can help to better perceive
Background paper. Fund for European Aid to the Most Deprived
 Background paper Fund for European Aid to the Most Deprived August 2018 1 The European Union has 123 million people living in or at risk of poverty or social exclusion. Introduced in 2014, the Fund for
Investment in Germany and the EU
 Investment in Germany and the EU Pedro de Lima Head of the Economics Studies Division Economics Department Berlin 19/12/2016 11/01/2017 1 Slow recovery of investment, with strong heterogeneity Overall
POVERTY AND SOCIAL INCLUSION INDICATORS IN Main poverty indicators
 POVERTY AND SOCIAL INCLUSION INDICATORS IN 2014 Poverty and social inclusion indicators are part of the general EU indicators for tracing the progress in the field of poverty and social exclusion. Main
YOUTH UNEMPLOYMENT IN THE EURO AREA
 YOUTH UNEMPLOYMENT IN THE EURO AREA Ramon Gomez-Salvador and Nadine Leiner-Killinger European Central Bank EKONOMSKI INSTITUT PRAVNE FAKULTETE 14 December 2007 Ljubljana Outline I. Introduction II. Stylised