2015 COMPARATIVE STUDY OF MAJOR PUBLIC EMPLOYEE RETIREMENT SYSTEMS
|
|
|
- Maximilian Cannon
- 5 years ago
- Views:
Transcription
 266-1304 Fax: (608) 266-3830 Email: leg.council@legis.wisconsin.gov http://www.legis.wisconsin.gov/lc")
1 WISCONSIN LEGISLATIVE COUNCIL 2015 COMPARATIVE STUDY OF MAJOR PUBLIC EMPLOYEE RETIREMENT SYSTEMS Prepared by: Daniel Schmidt, Principal Analyst Wisconsin Legislative Council December 2016 One East Main Street, Suite 401 Madison, WI Telephone: (608) Fax: (608)
2 2015 COMPARATIVE STUDY OF MAJOR PUBLIC EMPLOYEE RETIREMENT SYSTEMS Prepared by: Daniel Schmidt, Principal Analyst December 2016 CONTENTS Page Introduction... 3 Part I - Description of Retirement Systems in Report... 4 A. Introduction... 4 B. Number of Participants... 4 C. Categories of Employees Included in Plans... 4 D. Ratio of Active Employees to Retired Employees... 4 E. Social Security Coverage... 4 F. Trends... 5 G. The WRS... 5 Part II - Normal and Early Retirement Provisions A. Introduction B. Normal Retirement C. Early Retirement D. Trends E. The WRS Part III - Contribution Rates and Vesting Requirements A. Introduction B. Employee Contributions C. Employer Contributions D. Vesting E. Trends F. The WRS Part IV - Retirement Benefit Calculations A. Introduction B. Basic Plans in Which Employees Are Not Covered by Social Security C. Coordinated Plans in Which Employees Are Covered by Social Security D. Final Average Salary E. Limitations on Benefits F. Trends G. The WRS Comparative Study
3 Page Part V - Post-Retirement Annuity Increases and Taxes A. Introduction B. Social Security C. Post-Retirement Annuity Cost-of-Living Adjustments D. State Income Taxation of Annuities E. Trends F. The WRS Part VI - Actuarial and Accounting Information A. Introduction B. Actuarial Methods C. Interest Assumption D. Economic Spread E. Funding Ratio F. Trends G. The WRS
4 INTRODUCTION This report compares significant features of major state and local public employee retirement systems in the United States. The report compares retirement benefits provided to general employees and teachers, rather than benefits applicable only to narrower categories of employees such as police, firefighters, or elected officials. Generally, the report has been prepared every two years since 1982 by the Wisconsin Retirement Research Committee staff or the Legislative Council staff. The 2015 Report includes data from the same 87 public employee retirement systems that were compared in the prior report. Although this report does not cover all major public employee retirement systems, it describes at least one statewide plan from each state. The same public employee retirement systems have been covered in previous reports to show long-term trends in public employee retirement systems. The methodology for preparing the Reports differs from that of previous reports. Through the 2000 Report, each public employee retirement system covered by the report was asked to send to the Wisconsin Retirement Research Committee or the Legislative Council all annual reports, employee handbooks, statutes, actuarial reports, and related materials. One issue with this approach was that, in many cases, the published reports, handbooks, and materials were not current with respect to the data included in the report for a given year. In addition, the large volume of material that each plan was asked to send resulted in a relatively inefficient way of gathering and storing the data necessary for the report. For the Reports, the data was gathered, to the extent possible, from the website maintained by each of the plans covered by the report. All information is based on the most recent actuarial valuation available at the time of publishing. For the 2015 Report, most of the data was gathered from 2014 or 2015 actuarial analyses of each of the plans. Where specific data could not be found on plan websites, the Public Plans Data database was occasionally used to supplement plan data. We thank the Center for Retirement Research at Boston College, the Center for State and Local Government Excellence and the National Association of State Retirement Administrators for the use of this valuable tool. In most cases, the public employee retirement systems in this report have features that differ according to when an employee was initially hired or the identity of the employer. Where this situation exists, the report describes the features of the plan applicable to the employees who are most recently hired. One feature of the 2015 Report is a discussion of how retirement benefits and certain other features of the Wisconsin Retirement System (WRS) compare to the other plans in this report. This feature of the report is intended to be useful to Wisconsin legislators and persons interested in comparing the WRS to other plans, while maintaining the structure of prior reports for the convenience of retirement system administrators and policymakers from other states. While attempts were made to ensure the accuracy of the large amount of data in this report, it is inevitable that errors have occurred in both prior and current reports. Please communicate reports of any errors or comments you may have about the report to: Daniel Schmidt, Principal Analyst and Operations Manager; Wisconsin Legislative Council Staff; Suite 401, One East Main Street; Madison, Wisconsin, 53703; or at the following address: dan.schmidt@legis.wisconsin.gov. Any corrections made to the report will be included in the version maintained at the Wisconsin Legislative Council website:
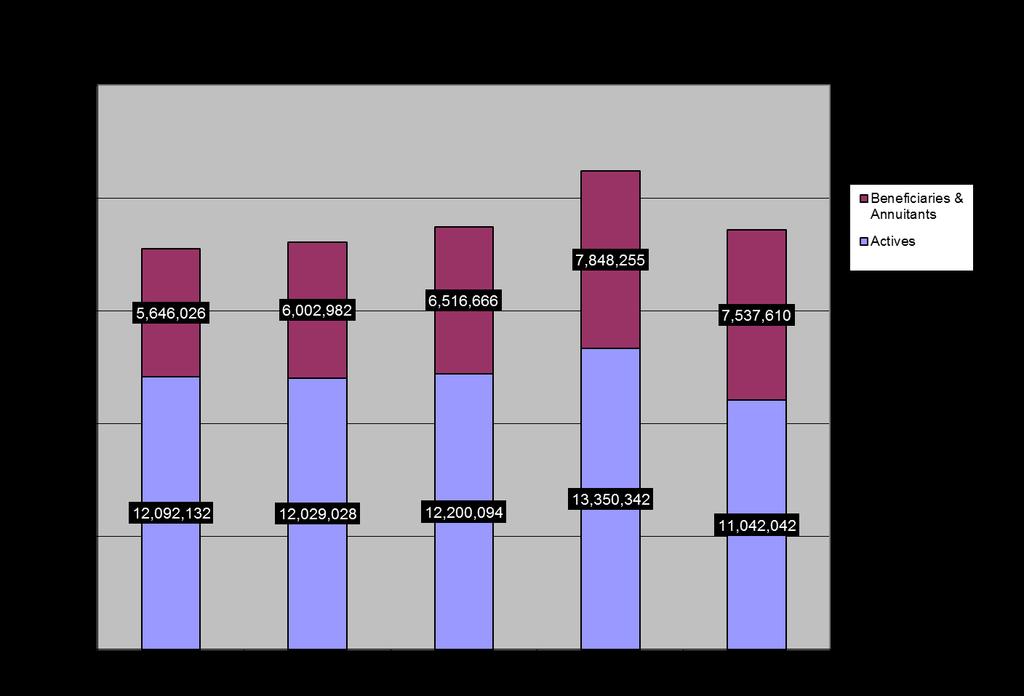
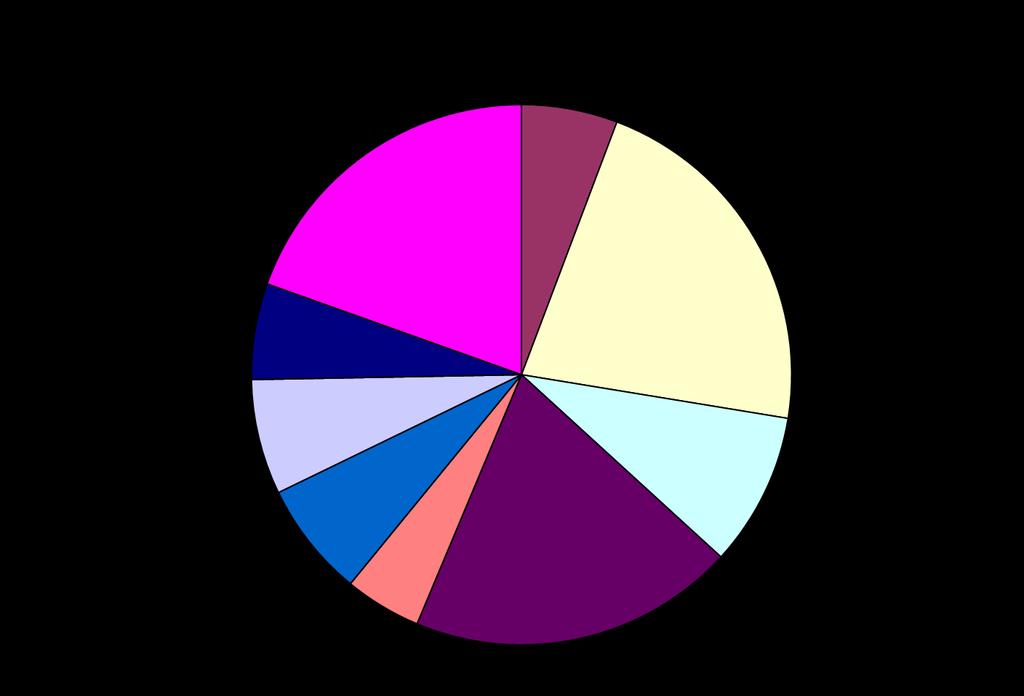
5 PART I DESCRIPTION OF RETIREMENT SYSTEMS IN REPORT A. INTRODUCTION Chart 1, on pages 5 to 7, provides descriptive data pertaining to the public employee retirement systems covered in this report. B. NUMBER OF PARTICIPANTS The 87 plans in the 2015 Report provide pension coverage for 11,042,042 active employees and 7,537,610 retirees and beneficiaries, for a total of 18,579,652 participants. This total is 12% lower than the 21,198,597 participants in the 2012 Report. The number of active participants has decreased between the 2012 and 2015 Reports by 17% while the number of retirees and beneficiaries has decreased by 4% in the same time period. C. CATEGORIES OF EMPLOYEES INCLUDED IN PLANS The column entitled Employee Coverage in Chart 1 shows whether each plan provides pension coverage to state employees ( S ), local employees ( L ), teachers ( T ), or some combination thereof. The 87 plans are categorized as follows: Employee Coverage Number of Plans State employees only 13 Teachers only 26 Local employees only 10 State and local employees 13 State employees and teachers 3 State employees, local employees, and teachers 22 See Figure 1, 2015 Employee Coverage, for a graphical representation of the categories. D. RATIO OF ACTIVE EMPLOYEES TO RETIRED EMPLOYEES Chart 1 also shows the ratio of active employees to retired employees in the 87 systems surveyed. The average ratio has generally declined over prior years, however, 2015 shows a slight increase in the average ratio. For 2015, the average ratio was 1.74 while the comparable figures for the 2012 Report, 2010 Report, the 2008 Report, the 2006 Report, the 2004 Report, and the 2002 Report, respectively, were 1.70, 1.87, 2.00, 2.14, 2.24, and 2.38 (see Figure 2, Participant Growth 2002 to 2015). Eighty of the systems had an active employees to retired employees ratio of less than two, with 12 systems having a ratio of less than one. In the 2000 Report, 17 of the systems had an active employees to retired employees ratio of less than two. E. SOCIAL SECURITY COVERAGE In 70 of the 87 plans, participants are also covered under the federal Social Security program. Of the 17 public employee retirement systems included in this report that do not provide Social Security coverage, 10 represent pension plans covering teachers only. The decision on whether to participate in the Social Security program was at one time elective, rather than mandatory, for public employers. However, for those employers who have elected coverage, future participation is mandatory.
6 F. TRENDS Chart 1 shows a decrease in the total number of participants in the plans surveyed. The number of active employees is decreasing at a significant rate, likely due to reductions in hiring of government employees, while the number of retirees has increased slightly. Ultimately, this has resulted in a general trend toward declining ratios of active to retired participants since 2000, but minor change since the 2012 Report. As compared to the 2012 Report, there has been no change in the number of plans whose participants are covered by the federal Social Security program. G. THE WRS The WRS, in 2015, had 255,014 active employees and 158,240 beneficiaries and annuitants, for a total of 413,254 participants. This total is a decrease of 11,453 total participants and is 2.7% lower than the 424,707 participants in the 2012 Report. The number of active employees covered by the WRS decreased by 2,240 and the number of beneficiaries and annuitants covered by WRS decreased by 9,213 between 2012 and The WRS covers state and local employees and teachers. The ratio of active employees to retired employees in the WRS in 2012 is 1.61, which is an increase from the ratio of 1.54 found in the 2012 Report. The ratio of active employees to retired employees in the WRS for 2015 (1.61) is slightly lower than the average ratio for all plans in the report (1.74). WRS employees are generally covered by Social Security. CHART 1 PUBLIC RETIREMENT SYSTEMS SURVEYED Fund Employee Active Beneficiaries S.S. State Name Coverage¹ Employees & Annuitants Ratio Coverage 1 Alabama ERS S, L 83,979 43, Yes 2 Alabama TRS T 135,230 85, Yes 3 Alaska 2 PERS S, L 17,660 32, No 4 Alaska 2 TRS T 5,502 12, No 5 Arizona SRS S, L, T 203, , Yes 6 Arkansas PERS S, L 45,722 33, Yes 7 Arkansas TRS T 72,919 40, Yes 8 California PERS S, L 772, , Yes 9 California TRS T 429, , No 10 Colorado PERA S, L, T 203, , No 11 Connecticut SERS S 49,976 45, Yes 12 Connecticut TRS T 51,433 34, No 13 Delaware SEPP S, T 35,998 23, Yes 14 Florida FRS S, L, T 512, , Yes 15 Georgia ERS S 60,416 47, Yes 16 Georgia TRS T 213, , Yes 17 Hawaii ERS S, L, T 67,310 44, Yes 18 Idaho PERS S, L, T 67,008 42, Yes 19 Illinois SRS S 63,273 67, Yes 20 Illinois TRS T 159, , No 21 Illinois MRF L 173, , Yes 22 Indiana PERF S, L, T 138,660 79, Yes 23 Indiana TRF 3 S, L, T 52,424 4, Yes - 5 -
7 24 Iowa PERS S, L, T 167, , Yes 25 Kansas PERS S, L, T 152,175 93, Yes 26 Kentucky KERS S 39,056 42, Yes 27 Kentucky CERS L 80,852 52, Yes 28 Kentucky TRS T 72,246 49, No 29 Louisiana SERS S 40,194 47, No 30 Louisiana TRSL T 83,602 75, No 31 Maine PERS S, L, T 40,016 30, No 32 Maryland SRPS S, L, T 193, , Yes 33 Massachusetts SERS S 88,508 57, No 34 Massachusetts TRS T 90,070 62, No 35 Michigan 2 SERS S 13,404 57, Yes 36 Michigan MERS L 35,302 35, Yes 37 Michigan PSERS T 194, , Yes 38 Minnesota MSRS S 49,037 32, Yes 39 Minnesota PERA L 145,650 82, Yes 40 Minnesota TRA T 79,406 57, Yes 41 Mississippi PERS S, L, T 157,215 96, Yes 42 Missouri SERS S 49,980 42, Yes 43 Missouri LAGERS L 33,310 19, Yes 44 Missouri PSRS T 46,835 26, No 45 Montana PERS S, L 28,237 20, Yes 46 Montana TRS T 18,316 14, Yes 47 Nebraska 4 SERS S 13,084 1, Yes 48 Nebraska 4 CERS L 6, Yes 49 Nebraska SPP T 40,994 21, Yes 50 Nevada PERS S, L, T 100,522 55, No 51 New Hampshire NHRS S, L, T 48,307 31, Yes 52 New Jersey PERS S, L 259, , Yes 53 New Jersey TPAF T 140,227 94, Yes 54 New Mexico PERA S, L 49,173 34, Yes 55 New Mexico ERA T 60,998 44, Yes 56 New York ERS S, L 526, , Yes 57 New York TRS T 267, , Yes 58 North Carolina TSERS S, T 307, , Yes 59 North Carolina LGERS L 123,184 60, Yes 60 North Dakota PERS S, L 22,845 10, Yes 61 North Dakota TRF T 10,514 8, Yes 62 Ohio PERS S, L 325, , No 63 Ohio STRS T 164, , No 64 Oklahoma PERS S, L 43,843 32, Yes 65 Oklahoma TRS T 90,388 58, Yes 66 Oregon PERS S, L, T 164, , Yes 67 Pennsylvania SERS S 105, , Yes 68 Pennsylvania PERS T 259, , Yes 69 Rhode Island ERS S, T 24,466 21, Yes 70 South Carolina SCRS S, L, T 187, , Yes 71 South Dakota SRS S, L, T 39,383 25, Yes 72 Tennessee 5 CRS S, L, T 10,926 None N/A Yes - 6 -
8 73 Texas ERS S 142,409 97, Yes 74 Texas TRS T 828, , No 75 Texas MRS L 106,894 56, Yes 76 Utah SRS S, L, T 101,178 56, Yes 77 Vermont SRS S 5,465 6, Yes 78 Vermont TRS T 7,295 8, Yes 79 Virginia SRS S, L, T 340, , Yes 80 Washington PERS S, L 153,297 92, Yes 81 Washington TRS T 68,820 46, Yes 82 West Virginia PERS S, L 36,413 24, Yes 83 West Virginia TRS T 35,593 33, Yes 84 Wyoming WRS S, L, T 36,489 23, Yes 85 Milwaukee City L 10,964 12, Yes 86 Milwaukee County L 3,619 7, Yes 87 Wisconsin WRS S, L, T 255, , Yes Totals: (87 Funds) 11,042,042 1,183, ¹Coverage: S = State; L = Local; T = Teachers 2 New employees are covered under a Defined Contribution Plan. 3 Based on post 1995 account. 4 Cash balance plan. 5 New hybrid plan for employees hired after
9 - 8 -
10 - 10 -
11 PART II NORMAL AND EARLY RETIREMENT PROVISIONS A. INTRODUCTION Chart 2, on pages 14 and 15, shows the normal and early retirement provisions for each of the plans covered in the report. Generally, the plans covered in this report are classified as defined benefit plans in which retirement benefits are calculated by a formula that takes into account years of service and final average salary. Note that some of the defined benefit plans may also contain elements of defined contribution or money purchase plans. These provisions are generally not reflected in Chart 2, which describes the features of each plan that are standard and that apply to employees in general. B. NORMAL RETIREMENT Normal retirement refers to the age, number of years of service, or both, that a person must attain in order to qualify for full retirement benefits without an actuarial reduction in his or her annuity for early retirement. Most plans in this report have adopted multiple combinations of age and service under which a person may qualify for normal retirement. These are shown in the column entitled Normal Retirement in Chart 2. Some retirement plans integrate normal retirement with the age under which a person is entitled to receive retirement benefits under the Social Security system. Age 65 is the age at which a person is entitled to receive full Social Security benefits, but this age is scheduled to increase to 66 and then to 67 over time. Age 62 is the earliest age at which a person can receive Social Security retirement benefits, although the amount of the benefits are reduced to reflect the longer payout period. Chart 2 shows that 69 of the 87 plans allow normal retirement at age 62 or earlier for persons with many years of service. In addition, Chart 2 shows that 33 of the 87 plans permit normal retirement at age 62 or earlier with 10 or less years of service. Fourteen of the plans in this report restrict normal retirement to persons who are at least 65. Some plans that permit persons to retire earlier than age 62 also allow them to elect to increase their annuity prior to age 62 to reflect the amount of Social Security benefits it is estimated that they will receive at that time. The amount of the annuity paid after age 62 is then adjusted to compensate for the earlier payments. Many of the plans in this report have adopted X years and out provisions, which allow employees to retire at any age (or at a minimum age) with normal retirement benefits after X years of service. The most common provision is 30 years of service combined with a minimum age of 55. The following table shows the number of plans that, in 2012, had in effect X years and out provisions and compares these with the number of plans that had in effect X years and out provisions in the 2015 Report:
12 years of service/age 55 or older 5 plans 6 plans 33 years of service/age 55 or older 1 plan 2 plans 30 years of service/age 55 or older 24 plans 23 plans 27 or 28 years of service/age 55 or older 3 plans 3 plans 25 years of service/age 55 or older 7 plans 5 plans 20 years of service/age 55 or older 6 plans 6 plans TOTAL 46 plans 45 plans See Figure 3, 2015 Normal Retirement X Years and Out Provisions, for a graphical representation of the 2012 X years and out provisions. In addition to the X years and out provisions, some plans have adopted Rule of Y provisions under which a person can retire with normal retirement benefits when that person's number of years of service, plus his or her age, equals a specified number. The following table shows the number of plans that, in 2015, had Rule of Y provisions and compares these with the number of plans that had Rule of Y provisions in 2012: Rule of 92 2 plans 2 plans Rule of 90 7 plans 10 plans Rule of 88 1 plan 1 plan Rule of 87 4 plans 4 plans Rule of 85 6 plans 6 plans Rule of 80 5 plans 4 plans TOTAL 25 plans 27 plans See Figure 4, 2015 Normal Retirement Rule of Y Provisions, for a graphical representation. C. EARLY RETIREMENT Eighty of the 87 plans covered in the 2015 Report permit early retirement before the normal age and service requirements of the plans have been met. The annuity of a person who elects early retirement is reduced from the amount that would have been received if the person had reached the normal retirement requirements. The early retirement provisions of each of the plans are shown in the column entitled Early Retirement in Chart 2. The most common minimum age for early retirement is age 55, with some minimum years of service. The second most common minimum age for early retirement is age 60. Sixty-three of the 87 plans in the 2015 Report allow early retirement at a minimum age of 55 or more. Eight of the 87 plans in the report allow early retirement at a minimum age of less than 55. Fifteen of the 87 plans have provisions which allow early retirement at any age with a minimum number of years of employment. Seven of the 87 plans in the report do not allow early retirement. (see Figure 5, 2015 Early Retirement Provisions). The annuity of a person who elects to retire before reaching the minimum age and years of service required for normal retirement is subject to a reduction that is commonly referred to as an actuarial discount. The amount of the reduction for each of the plans is shown in the column entitled Reduction for Early Retirement in Chart 2. In many cases, the column in Chart 2 is not able to
13 show the details of how the amount of the reduction is actually computed, because this amount is frequently different for employees at different ages or with different numbers of years of service or for various classifications of employees. However, the column shows the most common percentage reduction for each of the plans in the report. D. TRENDS The 2015 Report indicates continued reversal of the trend noted in previous reports ( ) that permitted retirement at earlier ages. Between the 2000 and 2004 Reports, nine plans reduced their normal retirement provisions by reducing the minimum age or the number of years of service required, or both. Between the 2004 and 2006 Reports, only two plans did so. Between the 2006 and 2008 Reports, an additional seven plans reduced their normal retirement provisions. Between the 2008 and 2010 Reports, 21 states increased their normal retirement provisions and one decreased its normal retirement provision. Between the 2010 and 2012 Reports, 29 states increased their normal retirement provisions and four decreased their normal retirement provisions. Between 2012 and 2015, nine states increased their normal retirement provisions and no states decreased their normal retirement provisions. In addition, between the 2000 and 2004 Reports, 10 plans reduced their early retirement provisions by reducing the minimum age or the number of years of service required, or both. Between the 2004 and 2006 Reports, only two plans did so. Between the 2006 and 2008 Reports, an additional eight plans reduced their early retirement provisions. Between the 2008 and 2010 Reports, 11 plans increased their early retirement provisions. Between the 2010 and 2012 Reports, 19 states increased their early retirement provisions. Between the 2012 and 2015 Reports, five states increased their early retirement provisions and three states decreased them. E. THE WRS The normal retirement requirement for general employees in the WRS is 65 years of age. However, general employees who are at least 57 years of age and who have at least 30 years of service can retire without an actuarial discount. Also, general employees in the WRS may retire at 55 years of age with an actuarial discount. The amount of actuarial discount for early retirement for general employees in the WRS varies according to the employee s number of years of service
14 CHART 2 NORMAL AND EARLY RETIREMENT REQUIREMENTS Early Fund Normal Retirement Retirement Annual Reduction for State Name Coverage* (Age/Years) (Age/Years) Early Retirement 1 Alabama ERS S, L 62/10 None 2 Alabama TRS T 62/10 None 3 Alaska PERS S, L 60/5; Any 30 55/5 Actuarially determined 4 Alaska TRS T 60/8; Any 20 55/8 Actuarially determined 5 Arizona SRS S, L, T 65; 62/10; 60/25; 55/30 50/5 Table 6 Arkansas PERS S, L 65/5; any/28 55/5; any/25 6% per yr 7 Arkansas TRS T 60/5; any/28 Any/25 5% for each yr < 28 yrs/age 60 8 California PERS S, L 62/5 50/5 Multiplier varies 9 California TRS T 62/5 55/5 6% per yr 10 Colorado PERA S, L, T 65/5; 55/R85; any/35 50/25; 55/20; 60/5 Full Actuarial reduction 11 Connecticut SERS S 63/25; 65/10 58/10 6% per yr 12 Connecticut TRS T 60/20; any/35 Any/25; 3% per yr 55/20; 60/10 13 Delaware SEPP S, T 65/10; 60/20; any/30 55/15; 4.8% per yr any/25 14 Florida FRS S, L, T 65/8; any/33 Any/8 5% per yr 15 Georgia ERS S 60/10; any/30 Any/25 7% per yr 16 Georgia TRS T 60/10; any/30 Any/25 7% per yr 17 Hawaii ERS S, L, T 65/10; 60/30 55/20 5% per yr 18 Idaho PERS S, L, T 65/5 55/5 Table 19 Illinois SRS S 67/10; 60/20 62/10 6% per yr 20 Illinois TRS T 67/10 62/10 6% per yr 21 Illinois MRF L 67/10; 62/35 62/10 6% per yr 22 Indiana PERF S, L, T 65/10; 60/15; 55/R85 50/15 5% per yr to 60; 1.2% per yr age 60 to Indiana TRF S, L, T 65/10; 60/15; 55/R85 50/15 5% per yr to 60; 1.2% per yr age 60 to Iowa PERS S, L, T 65; 62/20; 55/R88 55/4 6% per yr 25 Kansas PERS S, L, T 65/5; 60/30 55/10 35% at age 60; 57.5% at age Kentucky KERS S 65/5; 57/R87 60/10 6.5% 1st 5 yrs; 4.5% next 5 yrs 27 Kentucky CERS L 65/5; 57/R87 60/10 6.5% 1st 5 yrs; 4.5% next 5 yrs 28 Kentucky TRS T 60/5; any/27 55/10 6% per yr 29 Louisiana SERS S 62/5 Any/20 Table 30 Louisiana TRSL T 62/5 Any/20 Table 31 Maine PERS S, L, T 65/5 Any/25 6% per yr 32 Maryland SRPS S, L, T 65/10; R90 60/15 6% per yr 33 Massachusetts SERS S 67/10 60/10.125% per yr, for each yr before Massachusetts TRS T 67/10 60/10.125% per yr, for each yr before Michigan SERS S 60/10; 55/30 55/15 6% per yr 36 Michigan MERS L 60/10; 55/15-30; 50/25 55/15; 50/ % per yr or Michigan PSERS T 60/10; 55/30 55/15 6% per yr 38 Minnesota MSRS S 65/5 55/5 2.5% per yr 39 Minnesota PERA L 65/5; 55/5 3% per yr 40 Minnesota TRA T 66/3 55/3 2.5% per yr 41 Mississippi PERS S, L, T 60/8; any/30 None N/A 42 Missouri SERS S 67/10; 55/R90 62/10 6% per yr
15 43 Missouri LAGERS L 60/5; R80 option 55/5 6% per yr 44 Missouri PSRS T 60/5; R80; any/30 55/5 Actuarially determined 45 Montana PERS S, L 65/5; age 70 55/5 Actuarially determined 46 Montana TRS T 60/5; 55/30 55/5 Actuarially determined 47 Nebraska SERS S 55 N/A Cash balance 48 Nebraska CERS L 55 N/A Cash balance 49 Nebraska SPP T 65; 55/R85 60/5; any/35 3% per yr 50 Nevada PERS S, L, T 65/5; 62/10; any/30 Any/5 6% per yr 51 New Hampshire NHRS S, L, T 65/any 60/30 3% per yr 52 New Jersey PERS S, L 65/any Any/30 3% per yr 53 New Jersey TPAF T 65/any Any/30 3% per yr 54 New Mexico PERA S, L 65/8; R85/8 None N/A 55 New Mexico ERA T 65/5; any/25 R80 Table 56 New York ERS S, L 63/10 55/10 Table 57 New York TRS T 63/10 55/10 6.5% per yr 58 North Carolina TSERS S, T 65/5; 60/25; any/30 60/5; 50/20 3% to 5% per yr 59 North Carolina LGERS L 65/5; 60/25; any/30 60/5; 50/20 3% per yr 60 North Dakota PERS S, L 65/any; 60+R90 55/3 8% per yr 61 North Dakota TRF T 65/5; R90 55/5 6% per yr 62 Ohio PERS S, L 60/5; any/30 57/25 Table 63 Ohio STRS T 60/5 Prior to Age Withdrawal value 60/5 64 Oklahoma PERS S, L 65; 60/R90 55/ % per yr 65 Oklahoma TRS T 65/5; R90 60/5 Table 66 Oregon PERS S, L, T 65; 58/30 55/5 Full actuarial reduction 67 Pennsylvania SERS S 65/3; R92 with 35 yrs Any/10 Table 68 Pennsylvania PERS T 65/3; R92 with 35 yrs 55/25 3% per yr 69 Rhode Island ERS S, T 65/30; 64/31; 63/32; 59/20 7% - 9% a year 62/33 70 South Carolina SCRS S, L, T 65/8; R90 60/8 5% per yr 71 South Dakota SRS S, L, T 65/3 55/3 3% per yr 72 Tennessee CRS S, L, T 65/5; R90 60/5; R80 Actuarially red. from norm. to early 73 Texas ERS S 65/10 R80/5 5% per yr before Texas TRS T 65/5; 62/R80 R80/5 5% per yr 75 Texas MRS L 60/5; any/20 Varies Varies 76 Utah SRS S, L, T 65/4; any/30 Any/25; 3% per yr 60/20; 62/10 77 Vermont SRS S 65/any; R87 55/5 Table 78 Vermont TRS T 65/any; R90 55/5 Full actuarial reduction 79 Virginia SRS S, L, T Social Security normal 60/5 Full actuarial reduction age/5; R90 80 Washington PERS S, L 65/10 55/10 3% per yr or table 81 Washington TRS T 65/10 55/10 3% per yr or table 82 West Virginia PERS S, L 60/5; 55/R80; 55/10; Full actuarial reduction 55/20; Any West Virginia TRS T 60/5; 55/30; any/35 55/30 Full actuarial reduction 84 Wyoming WRS S, L, T 65/4; R85 55/4; any/25 5% per yr 85 Milwaukee City L 65; 60/30 N/A N/A 86 Milwaukee County L 64; 55/30 55/15 5% per yr 87 Wisconsin WRS S, L, T 65/any; 30/R87 55 Varies by service amount *Coverage: S = State; L = Local; T = Teachers; x/y = Age/Service
16 - 16 -
17 - 17 -
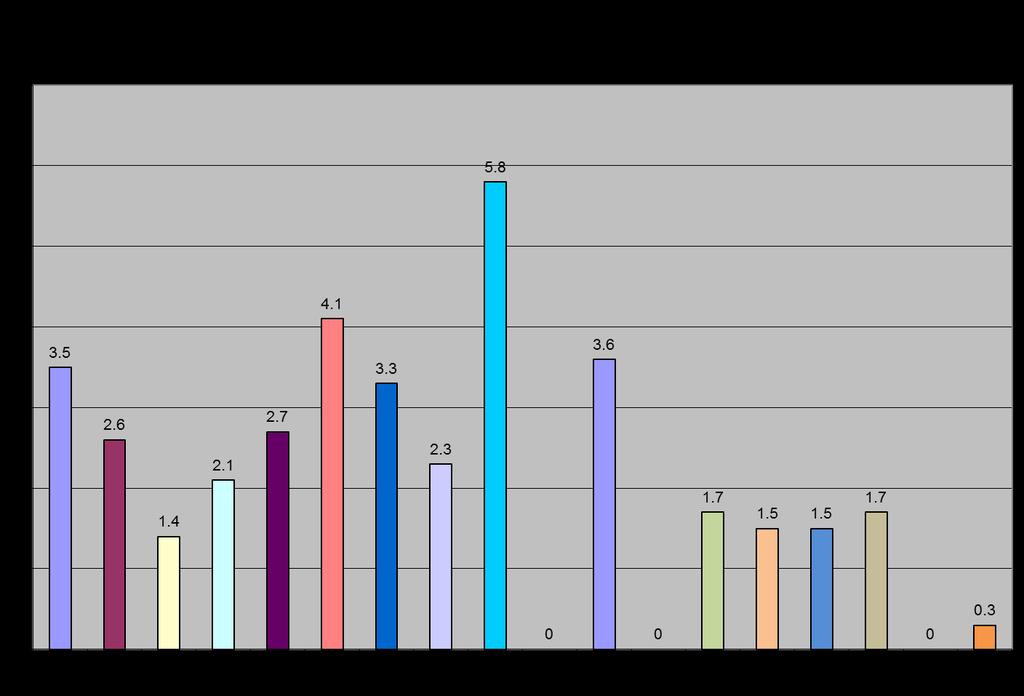
18 PART III CONTRIBUTION RATES AND VESTING REQUIREMENTS A. INTRODUCTION Chart 3, on pages 21 and 22, shows the employee contribution rate, the employer contribution rate, and the vesting period for each of the 87 plans in the report. The contribution rates are shown as a percentage of salary. B. EMPLOYEE CONTRIBUTIONS Large private sector corporations that provide defined benefit pension plans frequently do not require employee contributions to the primary plan, but frequently also provide supplemental profitsharing or savings plans that allow employees to contribute to the plan and receive an employer match to some or all of the contribution. Conversely, most public employee pension plans at least nominally require employees to contribute a certain percentage of their salary to the plan, although some public employee pension plans provide for employer pick-up of the employee contribution. In addition, secondary savings plans for public employees, such as Section 457 deferred compensation plans, are funded totally from employee contributions with no employer match. In plans where amounts designated as employee contributions for accounting purposes are paid by the employer, there are financial advantages to both the employer and the employee if, instead of granting compensation increases, an employer pays the employee contribution to the retirement plan. Compensation payments are subject to old age, survivors and disability insurance payments (Social Security), and Medicare payments while contributions to a retirement plan are not. In addition, the practice may be attractive to employers because employer pick-up of retirement contributions is not added into employee base wages, reducing the amount of future percentagebased salary increases. The column in Chart 3 entitled Employee Contribution shows the employee contribution rates, expressed as a percentage of payroll, for the 87 plans covered in the report. These requirements are compared with employee contributions in the 2012 Report in the following table: Employee Contribution Rates % or less 23 plans 23 plans More than 5% 53 plans 58 plans Rate varies (usually by age or employee classification) 7 plans 5 plans Plan is noncontributory 4 plans 1 plans TOTAL 87 plans 87 plans See Figure 6, 2015 Employee Contribution Rates, for a graphical representation
19 C. EMPLOYER CONTRIBUTIONS As has been noted in previous reports, the employer contribution information in Chart 3 is less reliable than other information found in this report. Employer contributions often vary between categories of employees and change significantly from year to year, particularly if investment returns from pension funds are volatile. In addition, employer costs are often designated under several categories reflecting normal costs, amortization, administrative costs, and unfunded postretirement increases and the designation of these costs may vary from plan to plan. The employer contribution rates shown in Chart 3 are derived from actuarial reports and, where these were not available, by information received from plan administrators. Where possible, the normal cost rate is stated exclusive of accrued liabilities. The statutory rate is used when the employer normal cost is not available. Medical and other nonpension costs are generally not included in employer contributions. In addition, the employer contributions reported in Chart 3 are intended to reflect actual contributions made by the employer. In some plans covered by the report, employers may have paid contributions to the retirement plans at rates less than those that were determined by actuarial valuation as necessary to fully fund the pension plan. D. VESTING The term vesting refers to an employee s right, after satisfying some minimum service requirement, to receive some pension benefits regardless of whether the employee remains in a job covered by the pension plan. Vesting requirements for the plans included in the 2015 Report are displayed in the last column of Chart 3. The following table shows the changes that have occurred between 2012 and 2015 in the plans covered by the report: Immediate or >1 year vesting plan 2 plans Vesting after 3 years 5 plans 7 plans Vesting after 4 years 5 plans 4 plans Vesting after 5 years 45 plans 41 plans Vesting after 6 years 1 plan 0 plans Vesting after 8 years 3 plans 6 plans Vesting after 10 years 26 plans 26 plans Graded or varying 1 plan 1 plan TOTAL 87 plans 87 plans In 2015, a total of 54 plans, or 62% of the 87 plans in the report, require five or less years of service to vest. This is a decrease of two plans since the 2012 Report. The number of plans that require 10 years of service to vest remained the same between 2012 and See Figure 7, 2012 Vesting Rates, for a graphical representation. E. TRENDS The long-term trend in public employee pension plan vesting is generally biased toward vesting periods of five years or less. Longer vesting periods have increased slightly, particularly those vesting after eight years. Thirty-two of the 87 plans covered in the 2015 Report had vesting requirements that were greater than five years. Employee contribution rates were increased in
20 plans and decreased for 10 plans between the 2012 and 2015 Reports. Employer contribution rates (employer normal cost rates) generally fluctuate with investment returns. It is important to note that many of the reported employer normal cost rates are separated from existing accrued liabilities. If accrued liabilities were included, many of these rates would be significantly higher. F. THE WRS No vesting period was required for employees in the WRS prior to Employees who began work on or after July 1, 2011 must accrue five years of creditable service to be vested in the WRS. The employee contribution rate for general employees for 2015 increased slightly to 6.8%. Employees and employers split the annual actuarial cost of maintaining the retirement trust fund by splitting the full cost into equal contributions. Thus, the employer contribution rate for 2015 was also 6.8%
21 CHART 3 CONTRIBUTION AND VESTING REQUIREMENTS Employer Normal Fund Social Employee Cost or Statutory Vesting State Name Security Contribution Contribution Period 1 Alabama ERS Yes 7.50% 0.37% 10 years 2 Alabama TRS Yes 6.00% 0.81% 10 years 3 Alaska PERS No 6.75% 2.94% 5 years 4 Alaska TRS No 8.65% 2.22% 8 years 5 Arizona SRS Yes 11.34% 11.34% Immediate 6 Arkansas PERS Yes 5.00% 6.84% 5 years 7 Arkansas TRS Yes 6.00% 11.76% 5 years 8 California PERS Yes 5-10% 7.70% 5 years 9 California TRS No 8.00% 8.25% 5 years 10 Colorado PERA No 8.00% 2.88% 5 years 11 Connecticut SERS Yes 2.00% 8.00% 10 years 12 Connecticut TRS No 6.00% 9.73% 10 years 13 Delaware SEPP Yes 5.00% above $6, % 10 years 14 Florida FRS Yes 5.56% 2.84% 8 years 15 Georgia ERS Yes 1.25% 5.99% 10 years 16 Georgia TRS Yes 6.00% 6.84% 10 years 17 Hawaii ERS Yes 8.00% 6.02% 5 years 18 Idaho PERS Yes 6.79% 7.35% 5 years 19 Illinois SRS Yes 4.00% 14.70% 6 Months 20 Illinois TRS No 9.40% 8.27% 10 years 21 Illinois MRF Yes 4.50% 6.64% 10 years 22 Indiana PERF Yes 3.00% 3.85% 10 years 23 Indiana TRF Yes 3.00% 5.45% 10 years 24 Iowa PERS Yes 5.95% 8.93% 4 years 25 Kansas PERS Yes 6.00% 8.31% 5 years 26 Kentucky KERS Yes 5.00% 2.96% 5 years 27 Kentucky CERS Yes 5.00% 3.05% 5 years 28 Kentucky TRS No 9.11% 16.11% 5 years 29 Louisiana SERS No 8.00% 4.00% 5 years 30 Louisiana TRSL No 8.00% 4.17% 5 years 31 Maine PERS No 7.65% 3.95% 5 years 32 Maryland SRPS Yes 6.72% (avg.) 5.25% 10 years 33 Massachusetts SERS No 9.00% 4.30% 10 years 34 Massachusetts TRS No 9.00% 2.90% 10 years 35 Michigan SERS Yes 4.00% 3.38% 10 years 36 Michigan MERS Yes Varies by plan (0 to Varies by plan 5 to 10 years 10.00%) 37 Michigan PSERS Yes 4.00% 3.60% 10 years 38 Minnesota MSRS Yes 5.50% 5.50% 5 years 39 Minnesota PERA Yes 7.50% 7.50% 3 years 40 Minnesota TRA Yes 7.50% 7.70% 3 years 41 Mississippi PERS Yes 9.00% 2.13% 8 years 42 Missouri SERS Yes 4.00% 6.67% 10 years 43 Missouri LAGERS Yes 4.00% 9.40% 5 years 44 Missouri PSRS No 5.49% 5.49% 5 years 45 Montana PERS Yes 7.90% 8.27% 5 years 46 Montana TRS Yes 8.15% 1.06% 5 years
22 47 Nebraska SERS Yes 4.80% 7.49% 3 years 48 Nebraska CERS Yes 4.50% 6.75% 3 years 49 Nebraska SPP Yes 9.78% 9.88% 5 years 50 Nevada PERS No 17.83% 16.87% 5 years 51 New Hampshire NHRS Yes 7.67% 12.43% 1 10 years 52 New Jersey PERS Yes 7.50% % 10 years 53 New Jersey TPAF Yes 7.06% 3.45% 10 years 54 New Mexico PERA Yes 8.92% 16.99% 8 years 55 New Mexico ERA Yes 10.70% 2.28% 5 years 56 New York ERS Yes 3.00% to 6.00% 12.8% 1 10 years 57 New York TRS Yes 3.00% to 6.00% 11.31% 10 years 58 North Carolina TSERS Yes 6.00% 5.21% 5 years 59 North Carolina LGERS Yes 6.00% 6.39% 5 years 60 North Dakota PERS Yes 6.00% 5.37% 3 years 61 North Dakota TRF Yes 11.75% 7.75% 3 years 62 Ohio PERS No 9.79% 3.38% 5 years 63 Ohio STRS No 12.67% -1.54% 5 years 64 Oklahoma PERS Yes 3.50% 9.52% 8 years 65 Oklahoma TRS Yes 7.00% 6.93% 5 years 66 Oregon PERS Yes None 15.38% 5 years 67 Pennsylvania SERS Yes 6.25% 4.52% 10 years 68 Pennsylvania PERS Yes 7.52% 8.31% 10 years 69 Rhode Island ERS Yes 3.75% 4.21% (4.25% 5 years teachers) 70 South Carolina SCRS Yes 8.19% 9.83% 8 years 71 South Dakota SRS Yes 6.00% 4.45% 3 years 72 Tennessee CRS Yes 5% 0.95% 5 years 73 Texas ERS Yes 9.50% 2.77% 5 years 74 Texas TRS No 7.70% 2.33% 5 years 75 Texas MRS Yes 5.00, 6.00, or 7.00% 8.41% 5 years 76 Utah SRS Yes 6.00% 5.12% 2 4 years 77 Vermont SRS Yes 5.10% 2.93% 5 years 78 Vermont TRS Yes 6.00% 1.35% 5 years 79 Virginia SRS Yes 4.00% 4.90% 2 5 years 80 Washington PERS Yes 7.92% 8.03% 10 years 81 Washington TRS Yes 7.48% 8.25% 10 years 82 West Virginia PERS Yes 4.50% 5.60% 5 years 83 West Virginia TRS Yes 6.00% 4.50% 5 years 84 Wyoming WRS Yes 8.25% 3.71% 4 years 85 Milwaukee City Yes 4.00% 8.48% 4 years 86 Milwaukee County Yes 4.00% 8.90% 5 years 87 Wisconsin WRS Yes 6.80% 6.80% 5 years 1 Average of all S/L contributions. 2 Average of S/T contributions
23 - 23 -
24 A. INTRODUCTION PART IV RETIREMENT BENEFIT CALCULATIONS Chart 4, on pages 27 and 28, shows the retirement benefit formulas in effect for 2012 for each of the plans. The formulas are those used to calculate the benefits of general employees and teachers and may not apply to other categories of employees. For example, elected officials and employees who are classified as protective employees generally have higher formula benefit multipliers and earlier normal retirement dates. In addition, many of the plans in the report have different tiers of formula benefits that apply to employees depending upon when they were hired. In Chart 4, the data presented for each plan refers to the most recent category of newly hired employees. As is shown in Chart 4, all but seven of the current plans in the report are defined benefit plans in which an employee s retirement benefits are generally calculated by multiplying the employee s number of years of service by a formula multiplier and multiplying the product of this calculation by the employee s final average salary: Years of Service x Formula Multiplier x Final Average Salary = Retirement Annuity In effect, the formula multiplier is the annualized percentage of the final average salary that an employee earns as a retirement annuity for each year of service. Some of the defined benefit plans in the report also include money purchase elements. The remaining plans are defined contribution or cash balance plans where the value of contributions plus interest equals the retirement benefit. B. BASIC PLANS IN WHICH EMPLOYEES ARE NOT COVERED BY SOCIAL SECURITY Employees of 17 of the 87 plans are not covered by Social Security (see Chart 1). The plans in which employees are not covered by Social Security frequently have a higher formula multiplier to compensate for the lack of Social Security coverage. The 17 plans in which employees are not covered by Social Security generally have formula multipliers ranging between 2% and 2.5% for each year of service. C. COORDINATED PLANS IN WHICH EMPLOYEES ARE COVERED BY SOCIAL SECURITY Seventy of the 87 plans in this report are coordinated with the Social Security system, meaning that employees earn Social Security benefits for their employment. There are a wide range of formula multipliers in effect for these 70 plans, which sometimes vary by number of years of service, by date of employment, or by age at retirement. For 2015, the formula multiplier for the coordinated plans that are not money purchase plans, defined contribution plans, or plans in which the employer determines the formula multiplier generally fall into a range between 1% and 2.5%. This number may actually be somewhat higher because a number of plans increase their multiplier rates following a certain number of years of service, generally 15, 25, or 30 years, or have other returns (defined contribution or money purchase) associated with the core multiplier. The formula benefits for 2015, as shown in Chart 4, are summarized and compared with the data found in the 2012 Report in the following table:
25 Formula Multiplier % to 1.3% 1 plan 0 plans Over 1.3% to 1.5% 1 plan 5 plans Over 1.5% to 1.7% 22 plans 19 plans Over 1.7% to 1.9% 11 plans 8 plans Over 1.9% to 2.1% 21 plans 17 plans Over 2.1% 4 plans 4 plans Employer determined (varies) 2 plans 6 plans Formula benefit plus money purchase 4 plans 6 plans Cash balance or money purchase plan 4 plans 5 plans TOTAL 70 plans 70 plans See Figure 8, 2015 Formula Multipliers, for a graphical representation. D. FINAL AVERAGE SALARY Defined benefit plans base the amount of a retirement annuity on the employee s final average salary. The final average salary is generally the employee s highest earnings over a specified number of years or months, which are sometimes required to be consecutive years or months. Typically, an employee s highest salary will be the amount of salary he or she earned immediately prior to retirement. Since the 2012 Report, six plans have increased the number of years required to calculate final average salary. The most common method is now to use a five-year average, which may require calculation of consecutive years or of years that fall within a given period. (For example, the five highest years within a 10-year period.) Forty-four of the 87 plans in the report use a five-year final average salary. The next most prevalent calculation of final average salary is a three-year period- -26 of the 87 plans used a three-year period in See Figure 9, 2015 Final Average Salary Period, for a graphical representation. E. LIMITATIONS ON BENEFITS The last column of Chart 4 shows the plans that have established a limit on the amount of pension benefits that may be received by a retiree. This limitation may be expressed as a maximum percentage of final average salary, as a maximum number of years that may be credited, or as a maximum percentage of highest salary. The majority of plans surveyed in the report indicate no maximum benefit limitation. They are followed by those with a limit of 100% of final average salary. F. TRENDS The current trend continues toward lower multipliers. Between 2012 and 2015, nine plans decreased their formula multipliers and three plans increased their multipliers. As noted in Section D., there has been a slight increase in the number of years required to calculate final average salary figures. Plan caps are moderately trending toward lower limits with a number of states adopting maximums for new employees in the last few years. G. THE WRS The WRS is primarily a defined benefit plan. However, it also has a money purchase feature that computes an employee s retirement benefits by the amount of an annuity that can be purchased
26 with moneys in the employee s retirement account. The employee receives the higher of either the formula-based defined benefit annuity or the money purchase annuity. The formula multiplier for general employees in the WRS is 1.6%. Final average salary under the WRS is an average of the three highest years of an employee s salary. Annuities for general employees are capped at 70% of final average salary
27 CHART 4 FINAL AVERAGE SALARY PERIODS-FORMULAS-LIMITATIONS State Fund Name FAS Period 1 Formula Multiplier Limitation 1 Alabama ERS 5 H/ % 80% 2 Alabama TRS 5 H/ % 80% 3 Alaska PERS 5 HC 2.0% (1st 10 yrs); 2.25% (next 10 yrs); None 2.5% (rem. yrs) 4 Alaska TRS 3 H 2.0% (1st 20 yrs); 2.5% (rem. yrs) None 5 Arizona SRS 5 HC 2.1% (1st 20 yrs); 2.15% (next 5); 2.2% 80% FAS (next 5); 2.3% 30+ yrs 6 Arkansas PERS 3 H 2% +.5% for yrs of service over 28 yrs 100% FAS 7 Arkansas TRS 3 H 2.15% 120% of final salary 8 California PERS 3 H 2% at 62; 2.1% at 63+ None 9 California TRS 1 H 2% at 62; 2.1% at % Of SS wage base 10 Colorado PERA 4 H 2.5% 100% FAS 11 Connecticut SERS 5 H (130% 1.33% +.5% over Social Security None cap) breakpoint; 1.625% 35+ yr 12 Connecticut TRS 3 H 2% 75% FAS 13 Delaware SEPP 3 H 1.85% None 14 Florida FRS 8 H 1.6% to 1.68% (age and yrs of service) 100% FAS 15 Georgia ERS 2 HC 2% None 16 Georgia TRS 2 HC 2% 40 yrs max 17 Hawaii ERS 5 H 1.75% None 18 Idaho PERS 3 1/2 HC 2% 100% FAS 19 Illinois SRS Last % May not exceed $106,800+CPI 20 Illinois TRS 8 HC/ /1st 10; 1.9/10 to 20; 2.1/20 to 30; 75% FAS 2.3/ Illinois MRF 8 HC/ % (1st 15 yrs); 2% (added yrs) 75% FAS 22 Indiana PERF 5 H 1.1% + money purchase annuity None 23 Indiana TRF 5 H 1.1% + money purchase annuity None 24 Iowa PERS 5 H 2% (1st 30 yrs); 1% (next 5 yrs) 65% FAS 25 Kansas PERS 5 H 1.85% None 26 Kentucky KERS N/A All contributions + interest credits None 27 Kentucky CERS N/A All contributions + interest credits None 28 Kentucky TRS 5 H; 3 H w/ % depending on yrs service None yr 29 Louisiana SERS 3 HC 2.5% 100% FAS 30 Louisiana TRSL 5 HC 2.5% 100% FAS 31 Maine PERS 3 H 2% None 32 Maryland SRPS 5 H 1.5% 100% FAS 33 Massachusetts SERS 5 HC.5 to 2.5% (age-related) 80% FAS 34 Massachusetts TRS 5 HC.5% to 2.5% (age-related) 80% FAS 35 Michigan SERS 3 HC 1.5% None 36 Michigan MERS 5/3 HC 1.0% to 2.5% (employer option) 80% FAS 37 Michigan PSERS 5 HC 1.5% None 38 Minnesota MSRS 5 HC 1.7% None 39 Minnesota PERA 5 HC 1.9% None 40 Minnesota TRA 5 HC 1.7% None 41 Mississippi PERS 4 H 2% (1st 30 yrs); 2.5% (added yrs) None 42 Missouri SERS 3 HC 1.7% (and.8% to age 62 if R90 met) None 43 Missouri LAGERS 5 HC 1-2.5% (varies by employer option) None 44 Missouri PSRS 3 HC % None 2 45 Montana PERS 5 HC 1.7% to 1.85% None
28 46 Montana TRS 5 HC 1.85% None 47 Nebraska SERS Cash balance None 48 Nebraska CERS Cash balance None 49 Nebraska SPP 5 H 2% None 50 Nevada PERS 3 HC 2.5% 75% FAS 51 New Hampshire NHRS 5 H 1.52% 85% or $120, New Jersey PERS 5 HC 1.67% None 53 New Jersey TPAF 5 HC 1.67% None 54 New Mexico PERA 5 HC 2.5% 90% FAS 55 New Mexico ERA 5 HC 2.35% None 56 New York ERS 5 HC (10% 1.67% (under 20 yrs); 20 yrs; None cap) 2% (over 20 yrs) 57 New York TRS 5 HC 1.67% (under 25 yrs); 20 yrs; None 35% + 2.5% (20+ yrs) 58 North Carolina TSERS 4 HC 1.82% None 59 North Carolina LGERS 4 HC 1.85% None 60 North Dakota PERS 3 H/last 15 2% None 61 North Dakota TRF 5 H 2% None 62 Ohio PERS 3 H 2.2% (1st 35 yrs); 2.5% (added yrs) 100% FAS 63 Ohio STRS 3 H 1% + Value of Defined Contribution Acct None 64 Oklahoma PERS 3 H/10 2% 100% FAS 65 Oklahoma TRS 5 H 2% None 66 Oregon PERS 3 H 1.50% None 67 Pennsylvania SERS 3 H 2-2.5% 100% high yr 68 Pennsylvania PERS 5 HC 2-2.5% 100% FAS 69 Rhode Island ERS 5 HC 1-2% 75% - 80% FAS 70 South Carolina SCRS 5 HC 1.82% None 71 South Dakota SRS 3 HC/ % None 72 Tennessee CRS 5 HC 1.0% + defined contrib. benefit 90% FAS 73 Texas ERS 5 H 2.3% 100% AMC 74 Texas TRS 5 H 2.3% None 75 Texas MRS N/A Money purchase None 76 Utah SRS 5 HC 2% None 77 Vermont SRS 3 HC 1.67% 60% FAS 78 Vermont TRS 3 HC 1.67% 1st 20 yrs; 2% 20+ yrs 60% FAS 79 Virginia SRS 5 HC 1% + defined contribution return Member's contributions + interest 80 Washington PERS 5 HC 1% + defined contribution return None 81 Washington TRS 5 HC 1% + defined contribution return None 82 West Virginia PERS 3 HC/Last 15 2% None 83 West Virginia TRS 5 H/Last 15 2% None 84 Wyoming WRS 5 HC 2% None 85 Milwaukee City 3 H 1.6% 70% FAS 86 Milwaukee County 3 HC 1.6% 80% FAS 87 Wisconsin WRS 3 H 1.6% 70% FAS 1 FAS = final average salary H = highest HC = highest consecutive 2 Future COLA increases may not exceed 80% of original benefit
29 - 29 -
30 PART V POST-RETIREMENT ANNUITY INCREASES AND TAXES A. INTRODUCTION Chart 5, on pages 33 and 34, shows the provisions of each plan for increasing retirement annuities after an employee has retired. Chart 5 also shows how annuity payments from each plan are treated under that state's income tax laws. In addition, benefit adjustments in the Social Security program over the last 10 years and income taxation of Social Security benefits are also discussed in this part. B. SOCIAL SECURITY Pension designers are concerned with the adequacy of benefits at the time of retirement and also with the continuing purchasing power of those benefits during retirement as affected by inflation. Since 1975, Social Security benefits have been automatically adjusted each year by the percentage increase in the consumer price index (CPI). The increases in Social Security benefits for each of the last 10 years are shown below and displayed in Figure 10, Social Security CPI % Adjustments 2000 to 2017: CPI Year Date on Which First Payable Percentage Increase /1/ % /1/ % /1/ % /1/ % /1/ % /1/ % /1/ % /1/ % /1/ % /1/ % /1/ % /1/ % /1/ % /1/2014 1/1/2015 1/1/2016 1/1/2017 1/1/ % 1.5% 1.7% 0.0% 0.3% For those employees in the 70 of the 87 plans in this report (80%) that are also covered by the Social Security program, the portion of their total retirement income that is received from Social Security automatically keeps pace with inflation. Under federal law, up to 50% of Social Security benefits are subject to income taxation if the taxpayer s adjusted gross income is between $25,000 and $34,000 for single taxpayers or between
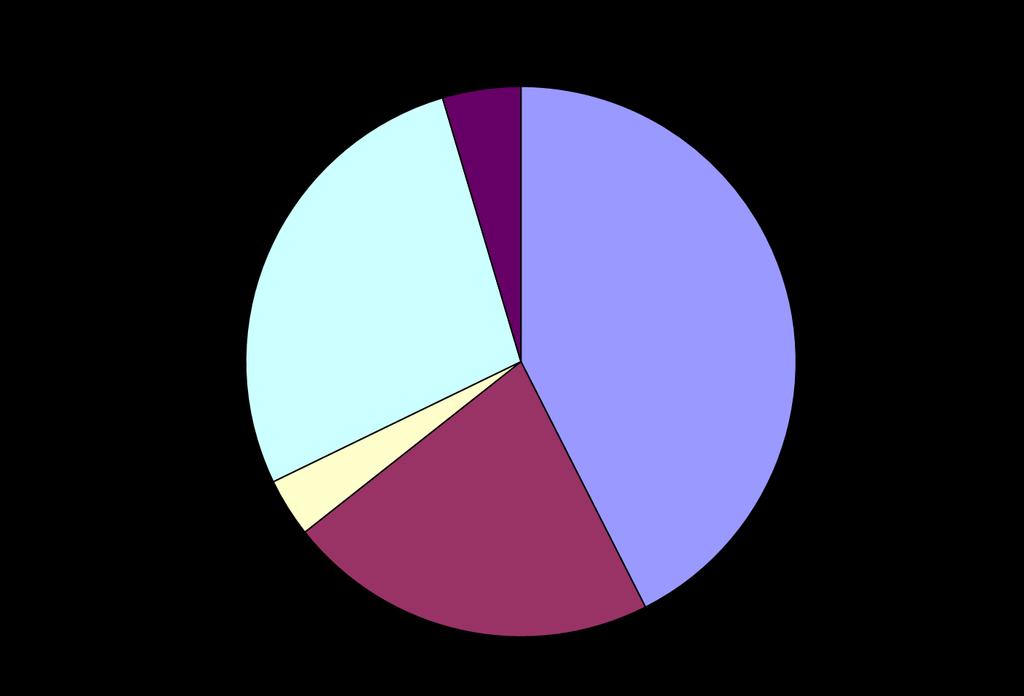
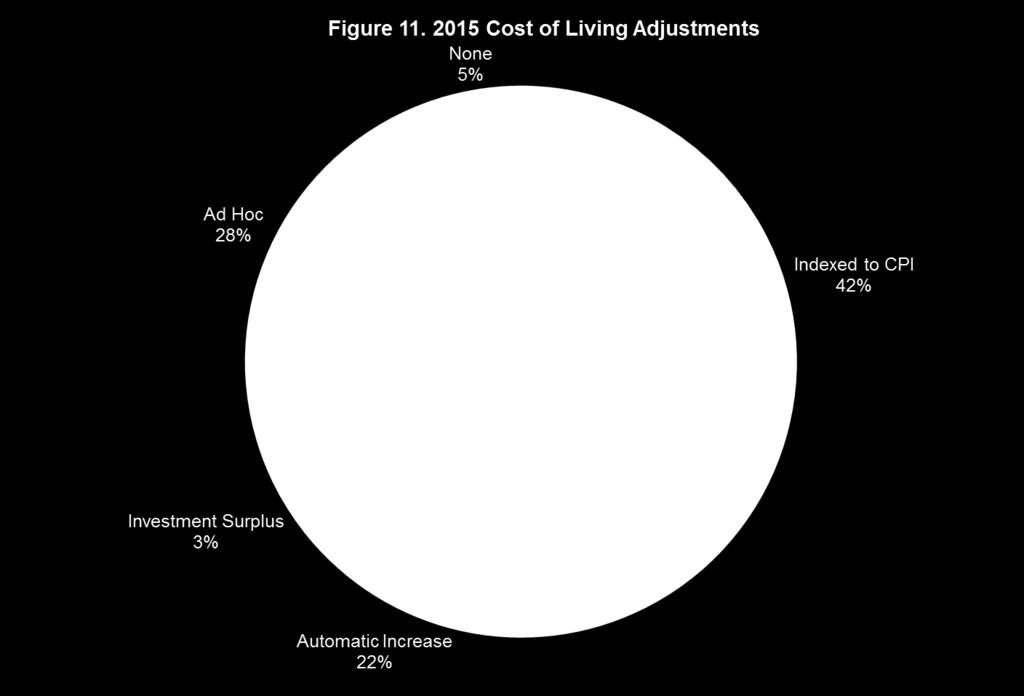
31 $32,000 and $44,000 for married taxpayers filing a joint income tax return. If a taxpayer s income exceeds these levels, then 85% of his or her Social Security benefits are subject to federal income taxation. State income taxation of Social Security benefits varies. Thirty-seven states exempt Social Security benefits from income taxation, or have no personal income tax or very limited income tax that does not affect Social Security payments. Thirteen states impose income taxes on some portion of Social Security benefits. C. POST-RETIREMENT ANNUITY COST-OF-LIVING ADJUSTMENTS Most of the plans in this report have provisions for post-retirement annuity adjustments to protect the purchasing power of annuities against inflation. The provisions of each of the plans are described in the fourth column of Chart 5. The following table summarizes and compares the postretirement annuity adjustment provisions found in the 2012 Report against those found in the 2016 Report: Adjustments indexed to CPI 30 plans 37 plans Automatic percentage increase 24 plans 19 plans Investment surplus 5 plans 3 plans Ad hoc (any increase must be authorized by Legislature or a decision-making board) or money purchase 21 plans 24 plans No increase 7 plans 4 plans TOTAL 87 plans 87 plans Note that, as shown in Chart 5, many of the plans in which post-retirement annuity increases are indexed to the CPI also include a cap on the total percentage adjustment that may be made within any given year. Also, many of the plans in which post-retirement annuity increases are indexed to the CPI or are automatic include provisions for additional annuity adjustments if there are investment surpluses in the retirement fund. Twenty-four of the 87 plans are either money purchase plans or provide post-retirement annuity increases only on an ad hoc basis, where either the Legislature or a decision-making board determines whether, and when, a post-retirement annuity increase is granted. See Figure 11, 2015 Cost-of-Living Adjustments, for a graphical representation. D. STATE INCOME TAXATION OF ANNUITIES The last column of Chart 5 shows the treatment of pension benefits under each of the plans by the state income tax laws in effect in that state. In 18 of the 87 plans, pension benefits are subject to state income taxation and no specific amount of retirement benefits is tax exempt. In 18 of the 87 plans, pension benefits are totally exempt from state income taxation. Eleven of the plans are in states with no income taxation. Caution must be used in interpreting the information in the last column of Chart 5. In many of the states in which pension income is fully taxable, other provisions of state income tax laws may ameliorate or completely eliminate the effect of the state income tax laws on retirees. For example, some state income tax laws have a level of exemptions, deductions, or tax credits that substantially reduce or eliminate state income taxation for persons at certain income levels. In addition, some of these exemptions, deductions, or tax credits may be increased for taxpayers who have reached
32 a certain age. In these states, the level of income taxation on retirees may be equal to or less than that in states where public employee pension income is exempt from state income taxation. E. TRENDS Most of the plans in this report have adopted provisions in which retirement annuities are annually increased, either by a set percentage or in response to changes in the CPI. These provisions were mostly adopted in the 1970s and 1980s in response to the high inflation that occurred in those years. Recent trends show an increase in the number of states basing cost-of-living adjustments (COLAs) on changes in CPI and a decrease in automatic annual COLA increases. F. THE WRS Retirees in the WRS whose annuities are paid from the core fund receive annual annuity adjustments tied to whether reserve surpluses in the fund, as adjusted by a formula, are sufficient to generate an increase. In addition, the annual adjustment may result in a reduction of annuities if investment losses are severe, particularly if investment losses occur over a number of consecutive years. However, annuities paid from the core fund may not be reduced below the level initially paid to a retiree. For annuities paid in 2015, the annuity adjustment in the core fund was 0.5%. WRS retirement benefits are subject to state income taxation except for certain payments made with respect to persons who were employees prior to 1964 or who had retired prior to Income from Social Security is exempt from Wisconsin income taxes. In addition, up to $5,000 per year of income from qualified retirement plans is exempt from Wisconsin income taxes for taxpayers with an adjusted gross income of $15,000 or less ($30,000 for married joint filers) who are 65 or older
33 CHART 5 POST-RETIREMENT INCREASES AND STATE TAX PROVISIONS Fund Social Annual State Taxation of State Name Security Post-Retirement Increases PERS Benefits 1 Alabama ERS Yes Ad hoc Benefits exempt 2 Alabama TRS Yes Ad hoc Benefits exempt 3 Alaska PERS No 50-75% of CPI No income tax 4 Alaska TRS No 50-75% of CPI No income tax 5 Arizona SRS Yes Excess earnings - 4% cap Exempt to $2,500 6 Arkansas PERS Yes 3% Exempt to $6,000 7 Arkansas TRS Yes 3% Exempt to $6,000 8 California PERS Yes 2% max based on CPI Benefits taxable 9 California TRS No 2% Benefits taxable 10 Colorado PERA No 2%; Lesser of 2% or CPI-W, if Exempt to $20,000/$24,000 neg. return 11 Connecticut SERS Yes 60% of CPI up to 6%, 2.0% Benefits taxable min; 7.5% max 12 Connecticut TRS No 1-5% Max. based on Soc. Sec. Benefits taxable benefit adj. 13 Delaware SEPP Yes Ad hoc Exempt to $12, Florida FRS Yes None No income tax 15 Georgia ERS Yes Ad hoc Exempt to $35,000/$60, Georgia TRS Yes 1.5% max in any 6 mo. Period, Exempt to $35,000/$60,000 based on CPI 17 Hawaii ERS Yes 1.5% Benefits exempt 18 Idaho PERS Yes CPI - 1% minimum to 6% max Benefits taxable 19 Illinois SRS Yes 3% or 1/2 of CPI Benefits exempt 20 Illinois TRS No 3% or 1/2 of CPI Benefits exempt 21 Illinois MRF Yes 3% or 1/2 of CPI Benefits exempt 22 Indiana PERF Yes Ad hoc Benefits taxable 23 Indiana TRF Yes Ad hoc Benefits taxable 24 Iowa PERS Yes Excess earnings - CPI; 3% cap Exempt to $6,000/$12, Kansas PERS Yes None Benefits exempt 26 Kentucky KERS Yes Ad hoc Exempt to $41, Kentucky CERS Yes Ad hoc Exempt to $41, Kentucky TRS No 1.5% Exempt to $41, Louisiana SERS No Ad Hoc Exempt to $6000/$12, Louisiana TRSL No Ad Hoc Exempt to $6000/$12, Maine PERS No CPI - 3% cap Exempt to $10, Maryland SRPS Yes CPI - 3% cap Exempt to $27, Massachusetts SERS No CPI - on 1st $13,000- Benefits exempt conditional, 3% cap 34 Massachusetts TRS No CPI - on 1st $13,000- Benefits exempt conditional, 3% cap 35 Michigan SERS Yes 3% Benefits exempt 36 Michigan MERS Yes Varies depending on employer agreement Benefits exempt 37 Michigan PSERS Yes Investment earnings in excess Benefits exempt of 8% 38 Minnesota MSRS Yes 2% - 2.5% Benefits taxable 39 Minnesota PERA Yes 1% - 2.5% Benefits taxable 40 Minnesota TRA Yes 2% - 2.5% Benefits taxable 41 Mississippi PERS Yes 3% Benefits exempt 42 Missouri SERS Yes 80% CPI - 5% cap Exempt to $36,
34 43 Missouri LAGERS Yes CPI - 4% cap Exempt to $36, Missouri PSRS No CPI - 2% or 5% cap Exempt to $36, Montana PERS Yes 1.5% Exempt to $3,600/$7,200 married 46 Montana TRS Yes 1.5% Exempt to $3,600/$7,200 married 47 Nebraska SERS Yes 2.5% Annuity option Benefits taxable 48 Nebraska CERS Yes 2.5% Annuity option Benefits taxable 49 Nebraska SPP Yes CPI - 1.0% cap Benefits taxable 50 Nevada PERS No CPI - 2 to 4% max No income tax 51 New Hampshire NHRS Yes Ad hoc Benefits exempt 52 New Jersey PERS Yes None Exempt to $15,000/$20, New Jersey TPAF Yes None Exempt to $15,000/$20, New Mexico PERA Yes 2.0% Exempt to $ New Mexico ERA Yes 50% of CPI - 2% min; 4% cap Exempt to $ New York ERS Yes 50% of CPI, max 3% on 1st Benefits exempt $18, New York TRS Yes 50% of CPI, max 3% on 1st Benefits exempt $18, North Carolina TSERS Yes Ad hoc Exclusion min. $4, North Carolina LGERS Yes Ad hoc Exclusion min. $4, North Dakota PERS Yes Ad hoc Up to $5000 excluded 61 North Dakota TRF Yes Ad hoc Up to $5000 excluded 62 Ohio PERS No CPI - 3% cap Benefits taxable ($50 credit) 63 Ohio STRS No CPI - 2% cap Benefits taxable ($50 credit) 64 Oklahoma PERS Yes Ad hoc Exclude up to $10, Oklahoma TRS Yes Ad hoc Exclude up to $10, Oregon PERS Yes 1.25% on 1st $60, % Benefits taxable on $60, Pennsylvania SERS Yes Ad hoc Benefits exempt 68 Pennsylvania PERS Yes Ad hoc Benefits exempt 69 Rhode Island ERS Yes CPI - 3% cap Benefits taxable 70 South Carolina SCRS Yes Lesser of 1% or $500 $15,000 deduction 71 South Dakota SRS Yes 2.1% to 3.1% based on CPI No income tax 72 Tennessee CRS Yes CPI - 3% cap Exempt to $26,200/$37, Texas ERS Yes Ad hoc No income tax 74 Texas TRS No Ad hoc No income tax 75 Texas MRS Yes Up to 70% of CPI (employer No income tax option) 76 Utah SRS Yes CPI - 4% cap tax credit up to $450/$ Vermont SRS Yes CPI - 5% cap Benefits taxable 78 Vermont TRS Yes 50% of CPI - 5% cap Benefits taxable 79 Virginia SRS Yes CPI - 3% cap Deduction up to $12, Washington PERS Yes CPI - 3% cap No income tax 81 Washington TRS Yes CPI - 3% cap No income tax 82 West Virginia PERS Yes Ad hoc Exempt to $2,000; Exclusions for $8000/$ West Virginia TRS Yes Ad hoc Exempt to $2,000; Exclusions for $8000/$ Wyoming WRS Yes Ad hoc No income tax 85 Milwaukee City Yes Varies Limited exemptions 86 Milwaukee County Yes 2% Limited exemptions 87 Wisconsin WRS Yes Investment earnings; reductions possible Limited exemptions
35 - 35 -
36 - 36 -
37 A. INTRODUCTION PART VI ACTUARIAL AND ACCOUNTING INFORMATION Chart 6, on pages 39 and 40, provides selected actuarial and accounting information about each of the plans in the report. This part of the report discusses the actuarial method used by each of the plans, provides the interest assumption, wage inflation assumption, and economic spread for each of the plans, and provides the Governmental Accounting Standards Board (GASB) 25 funding ratio for each of the plans in B. ACTUARIAL METHODS The third column in Chart 6 lists the actuarial methods used by each of the 87 plans. An actuarial method is a procedure for determining the present value of pension benefits that will be paid in the future and allocating that value and the cost of the benefits to specific time periods. There are a number of accepted actuarial methods that presumably will reach the goal of fully funding all pension obligations as they become due, but they allocate costs in different ways during the period of employment of participants in the plan. Seventy-five, or 86%, of the 87 plans use the entry age actuarial method; eight, or 9%, of the 87 plans use the unit credit method; four, or 5%, of the 87 plans use the aggregate cost method or other methods. C. INTEREST ASSUMPTION The interest assumption, which is also sometimes referred to as the earnings assumption, is one of the key economic assumptions in determining the level of contribution rates. The fourth column in Chart 6 provides the interest assumption for each of the 87 plans in the report. This information is compared with previous reports in the following table: Interest Assumption From 5% to 7% 1 plan 1 plan 4 plans 4 plans 6 plans Over 7% to 8% 61 plans 63 plans 65 plans 72 plans 78 plans Over 8% 23 plans 21 plans 16 plans 8 plans 3 plans Not determined or not applicable 0 plans 2 plans 2 plans 3 plans 0 plans TOTAL 85 plans 87 plans 87 plans 87 plans 87 plans See Figure 12, 2015 Plan Interest Assumptions, for a graphical representation of current data. D. ECONOMIC SPREAD Another key economic assumption in pension planning is the assumption of the wage inflation rate or general salary increases in excess of those provided for merit or seniority. The difference between the wage inflation assumption and the interest assumption is often referred to as the economic spread, which is the assumed real rate of return on invested assets above the wage inflation rate. The fifth and sixth columns of Chart 6 show the wage inflation assumptions and the resultant economic spread for each of the plans in the report
38 E. FUNDING RATIO Until 1995, the GASB required public pension plans to disclose the pension benefit obligation, which is a measure of the present value of pension benefits, adjusted for the affects of projected salary increases. The pension benefits were estimated only on service earned by employees up to the date of the estimate. GASB 25, issued in November 1994, requires that, beginning with periods after June 15, 1996, funding disclosures be based upon regular actuarial valuations. Included in the requirements under GASB 25 is a schedule funding progress that reports the actuarial value of assets, the actuarial accrued liability and the relationship between the two over time. The following table summarizes the funding ratios for each of the plans in the 2015 Report and compares them with the 2012, 2010, 2008, and 2006 Reports. Funding Ratio More than 100% 7 plans 10 plans 4 plans 0 plans 3 plans 90% to 100% 21 plans 19 plans 11 plans 11 plans 11 plans 80%, but less than 90% 20 plans 18 plans 23 plans 17 plans 15 plans 70%, but less than 80% 17 plans 24 plans 16 plans 18 plans 22 plans 60%, but less than 70% 11 plans 6 plans 17 plans 21 plans 23 plans 50%, but less than 60% 3 plans 6 plans 7 plans 12 plans 9 plans Less than 50% 3 plans 2 plans 7 plans 5 plans 4 plans Not determined 3 plans 2 plans 2 plans 3 plans 0 plans TOTAL 85 plans 87 plans 87 plans 87 plans 87 plans See Figure 13, 2015 Plan Funding Ratios, for a graphical representation of current data. F. TRENDS Funding ratios of more than 100% have generally decreased since the 2006 Report. Seven plans had funding ratios in excess of 100% in Three plans have a funding ratio in excess of 100% in Overall funding has also decreased. 32% of the plans studied had funding ratios of 90% or more in In 2015, that percentage was 26%. The entry age method remains the predominant method used by the plans studied. G. THE WRS The actuarial method used by the WRS is entry age. The interest assumption for unretired employees remains 7.2% and the economic spread is currently 4.0%. For 2015, the funding ratio for the WRS was 99.97%
39 CHART 6 ACTUARIAL AND ACCOUNTING PROVISIONS Fund Actuarial Interest Wage Economic State Name Method Assumption Inflation 1 Spread Funded Ratio 1 Alabama ERS Entry age 8.00% 3.00% 5.00% 67.15% 2 Alabama TRS Entry age 8.00% 3.00% 5.00% 67.50% 3 Alaska PERS Entry age 8.00% 3.12% 4.88% 78.00% 4 Alaska TRS Entry age 8.00% 3.12% 4.88% 83.00% 5 Arizona SRS Unit credit 8.00% 3.00% 5.00% 77.50% 6 Arkansas PERS Entry age 7.50% 3.25% 4.25% 79.00% 7 Arkansas TRS Entry age 8.00% 3.25% 4.75% 80.00% 8 California PERS Entry age 7.50% 3.00% 4.50% 72.10% 9 California TRS Entry age 7.50% 3.00% 4.50% 68.50% 10 Colorado PERA Entry age 7.50% 2.80% 4.70% 70.16% 11 Connecticut SERS Unit credit 8.00% 3.00% 5.00% 43.30% 12 Connecticut TRS Entry age 8.50% 3.00% 5.50% 59.00% 13 Delaware SEPP Entry age 7.20% 3.00% 4.20% 91.60% 14 Florida FRS Entry age 7.65% 2.60% 5.05% 86.50% 15 Georgia ERS Entry age 7.50% 3.25% 4.25% 74.10% 16 Georgia TRS Entry age 7.50% 3.25% 4.25% 79.10% 17 Hawaii ERS Entry age 7.65% 3.00% 4.65% 62.20% 18 Idaho PERS Entry age 7.50% 3.25% 4.25% 90.00% 19 Illinois SRS Unit credit 7.25% 3.00% 4.25% 36.18% 20 Illinois TRS Unit credit 7.50% 3.00% 4.50% 42.00% 21 Illinois MRF Entry age 7.50% 3.50% 4.00% 88.40% 22 Indiana PERF Entry age 6.75% 2.25% 4.50% 78.60% 23 Indiana TRF Entry age 6.75% 2.25% 4.50% 92.50% 24 Iowa PERS Entry age 7.50% 3.00% 4.50% 82.70% 25 Kansas PERS Entry age 8.00% 3.00% 5.00% 67.00% 26 Kentucky KERS Entry age 7.50% 3.25% 4.25% 19.00% 27 Kentucky CERS Entry age 7.50% 3.25% 4.25% 60.30% 28 Kentucky TRS Entry age 7.50% 4.00% 3.50% 55.30% 29 Louisiana SERS Entry age 7.75% 3.00% 4.75% 62.10% 30 Louisiana TRSL Entry age 7.75% 2.50% 5.75% 60.90% 31 Maine PERS Entry age 7.25% 3.50% 3.75% 88.10% 32 Maryland SRPS Entry age 7.55% 3.20% 4.35% 69.66% 33 Massachusetts SERS Entry age 7.75% 3.50% 4.25% 67.50% 34 Massachusetts TRS Entry age 7.75% 3.50% 4.25% 54.30% 35 Michigan SERS Entry age 8.00% 3.50% 4.50% 64.20% 36 Michigan MERS Entry age 8.00% 4.50% 3.50% 78.00% 37 Michigan PSERS Entry age 8.00% 3.50% 4.50% 60.50% 38 Minnesota MSRS Entry age 8.00% 3.50% 4.50% 85.72% 39 Minnesota PERA Entry age 8.00% 3.50% 4.50% 79.87% 40 Minnesota TRA Entry age 8.44% 3.75% 4.69% 77.05% 41 Mississippi PERS Entry age 7.75% 3.75% 4.00% 60.40% 42 Missouri SERS Entry age 8.00% 3.00% 5.00% 75.00% 43 Missouri LAGERS Entry age 7.25% 3.50% 3.75% 94.40% 44 Missouri PSRS Entry age 8.00% 3.75% 4.25% 86.80% 45 Montana PERS Entry age 7.75% 4.00% 3.75% 76.10% 46 Montana TRS Entry age 7.75% 4.00% 3.75% 67.46% 47 Nebraska SERS Entry age 7.75% 3.25% 4.50% % 48 Nebraska CERS Entry age 7.75% 3.25% 4.50% %
40 49 Nebraska SPP Entry age 8.00% 3.25% 4.75% 88.01% 50 Nevada PERS Entry age 8.00% 3.50% 4.50% 71.50% 51 New Hampshire NHRS Entry age 7.75% 3.75% 4.00% 60.70% 52 New Jersey PERS Unit credit 7.90% 4.00% 3.90% 59.50% 53 New Jersey TPAF Unit credit 7.90% 3.33% 4.57% 51.10% 54 New Mexico PERA Entry age 7.75% 3.50% 4.25% 74.90% 55 New Mexico ERA Entry age 7.75% 3.75% 4.00% 63.70% 56 New York ERS Aggregate 7.00% 3.80% 3.20% 83.60% 57 New York TRS Aggregate 7.50% 2.50% 5.00% 94.20% 58 North Carolina TSERS Entry age 7.25% 3.00% 4.25% 95.60% 59 North Carolina LGERS Entry age 7.25% 3.00% 4.25% 99.80% 60 North Dakota PERS Entry age 8.00% 4.50% 3.50% 68.60% 61 North Dakota TRF Entry age 7.75% 3.25% 4.25% 61.60% 62 Ohio PERS Entry age 8.00% 3.75% 4.25% 82.40% 63 Ohio STRS Entry age 7.75% 3.50% 4.25% 69.30% 64 Oklahoma PERS Entry age 7.50% 4.00% 3.50% 96.00% 65 Oklahoma TRS Entry age 8.00% 3.75% 4.25% 66.60% 66 Oregon PERS Unit credit 7.50% 3.50% 4.00% 66.00% 67 Pennsylvania SERS Entry age 7.50% 3.05% 4.45% 58.00% 68 Pennsylvania PERS Entry age 7.50% 3.00% 4.50% 60.60% 69 Rhode Island ERS Entry age 7.50% 3.50% 4.00% 57.70% 70 South Carolina SCRS Entry age 7.50% 2.75% 4.75% 62.00% 71 South Dakota SRS Entry age 7.25% 3.25% 4.00% % 72 Tennessee CRS Entry age 7.50% 3.00% 4.50% % 73 Texas ERS Entry age 8.00% 3.50% 4.50% 76.30% 74 Texas TRS Entry age 8.00% 3.50% 4.50% 80.20% 75 Texas MRS Entry age 6.75% 3.00% 3.75% 85.80% 76 Utah SRS Entry age 7.50% 3.25% 4.25% 85.50% 77 Vermont SRS Entry age 7.95% 3.25% 4.70% 75.10% 78 Vermont TRS Entry age 7.95% 3.25% 4.70% 58.60% 79 Virginia SRS Entry age 7.00% 3.00% 4.00% 73.30% 80 Washington PERS Hybrid 7.70% 3.75% 3.95% 73.00% 81 Washington TRS Hybrid 7.70% 3.75% 3.95% 78.00% 82 West Virginia PERS Entry age 7.50% 3.00% 4.50% 83.10% 83 West Virginia TRS Entry age 7.50% 3.00% 4.50% 57.90% 84 Wyoming WRS Entry age 7.75% 4.25% 3.50% 79.71% 85 Milwaukee City Unit credit 8.25% 3.00% 5.25% 94.80% 86 Milwaukee County Entry age 8.00% 3.00% 5.00% 78.10% 87 Wisconsin WRS Entry age-fil 7.20% 3.20% 4.00% 99.97% 1 Where no specific wage inflation or payroll growth figure was given, the price inflation assumption was used
41 - 41 -
COMPARATIVE STUDY
 WISCONSIN LEGISLATIVE COUNCIL 2017-18 COMPARATIVE STUDY OF MAJOR PUBLIC EMPLOYEE RETIREMENT SYSTEMS Prepared by: Daniel Schmidt, Principal Analyst Wisconsin Legislative Council February 2019 One East Main
10 yrs. The benefit is capped at 80% of FAS. An elected official may. 2% (first 10 yrs.); or 2.25% (second 10 yrs.); or 2.5% over 20 yrs.
; or 2.25% (second 10 yrs.); or 2.5% over 20 yrs.") Table 3.13 STATE LEGISLATIVE RETIREMENT BENEFITS Alabama... Alaska... Age 60 with 10 yrs. Employee 6.75% 2% (first 10 yrs.); or 2.25% (second 10 yrs.); or 2.5% over 20 yrs. x average salary over 5 highest
Table 3.13 STATE LEGISLATIVE RETIREMENT BENEFITS Alabama... Alaska... Age 60 with 10 yrs. Employee 6.75% 2% (first 10 yrs.); or 2.25% (second 10 yrs.); or 2.5% over 20 yrs. x average salary over 5 highest
Selected Approved Changes to State Public Pensions to Restore or Preserve Plan Sustainability
 Retirement Systems of Alabama Arizona Public Safety Personnel Retirement System Arizona State Retirement System Decreased contribution rates for new employees as follows: general state employees and teachers,
Checkpoint Payroll Sources All Payroll Sources
 Checkpoint Payroll Sources All Payroll Sources Alabama Alaska Announcements Arizona Arkansas California Colorado Connecticut Source Foreign Account Tax Compliance Act ( FATCA ) Under Chapter 4 of the Code
HOUSE SELECT COMMITTEE ON LEGACY COSTS FOR THE STATE'S OBLIGATIONS FOR PENSIONS, RETIREE HEALTH BENEFITS, STATE HEALTH PLAN, AND UNEMPLOYMENT BENEFITS
 N O R T H C A R O L I N A G E N E R A L A S S E M B L Y HOUSE SELECT COMMITTEE ON LEGACY COSTS FOR THE STATE'S OBLIGATIONS FOR PENSIONS, RETIREE HEALTH BENEFITS, STATE HEALTH PLAN, AND UNEMPLOYMENT BENEFITS
Kentucky , ,349 55,446 95,337 91,006 2,427 1, ,349, ,306,236 5,176,360 2,867,000 1,462
 TABLE B MEMBERSHIP AND BENEFIT OPERATIONS OF STATE-ADMINISTERED EMPLOYEE RETIREMENT SYSTEMS, LAST MONTH OF FISCAL YEAR: MARCH 2003 Beneficiaries receiving periodic benefit payments Periodic benefit payments
State Individual Income Taxes: Personal Exemptions/Credits, 2011
 Individual Income Taxes: Personal Exemptions/s, 2011 Elderly Handicapped Blind Deaf Disabled FEDERAL Exemption $3,700 $7,400 $3,700 $7,400 $0 $3,700 $0 $0 $0 $0 Alabama Exemption $1,500 $3,000 $1,500 $3,000
NASRA ISSUE BRIEF: Cost-of-Living Adjustments
 NASRA ISSUE BRIEF: Cost-of-Living Adjustments February 2014 Cost-of-living adjustments (COLAs) in some form are provided on most state and local government pensions. The purpose of a COLA is to offset
Income from U.S. Government Obligations
 Baird s ----------------------------------------------------------------------------------------------------------------------------- --------------- Enclosed is the 2017 Tax Form for your account with
Annual Costs Cost of Care. Home Health Care
 2017 Cost of Care Home Health Care USA National $18,304 $47,934 $114,400 3% $18,304 $49,192 $125,748 3% Alaska $33,176 $59,488 $73,216 1% $36,608 $63,492 $73,216 2% Alabama $29,744 $38,553 $52,624 1% $29,744
ATHENE Performance Elite Series of Fixed Index Annuities
 Rates Effective August 8, 05 ATHE Performance Elite Series of Fixed Index Annuities State Availability Alabama Alaska Arizona Arkansas Product Montana Nebraska Nevada New Hampshire California PE New Jersey
Motor Vehicle Sales/Use, Tax Reciprocity and Rate Chart-2005
 The following is a Motor Vehicle Sales/Use Tax Reciprocity and Rate Chart which you may find helpful in determining the Sales/Use Tax liability of your customers who either purchase vehicles outside of
Federal Rates and Limits
 Federal s and Limits FICA Social Security (OASDI) Base $118,500 Medicare (HI) Base No Limit Social Security (OASDI) Percentage 6.20% Medicare (HI) Percentage Maximum Employee Social Security (OASDI) Withholding
State Income Tax Tables
 ALABAMA 1 st $1,000... 2% Next 5,000... 4% Over 6,000... 5% ALASKA... 0% ARIZONA 1 1 st $10,000... 2.87% Next 15,000... 3.2% Next 25,000... 3.74% Next 100,000... 4.72% Over 150,000... 5.04% ARKANSAS 1
Termination Final Pay Requirements
 State Involuntary Termination Voluntary Resignation Vacation Payout Requirement Alabama No specific regulations currently exist. No specific regulations currently exist. if the employer s policy provides
MEDICAID BUY-IN PROGRAMS
 MEDICAID BUY-IN PROGRAMS Under federal law, states have the option of creating Medicaid buy-in programs that enable employed individuals with disabilities who make more than what is allowed under Section
Sales Tax Return Filing Thresholds by State
 Thanks to R&M Consulting for assistance in putting this together Sales Tax Return Filing Thresholds by State State Alabama Alaska Arizona Arkansas California Colorado Connecticut Delaware Filing Thresholds
Understanding Oregon s Throwback Rule for Apportioning Corporate Income
 Understanding Oregon s Throwback Rule for Apportioning Corporate Income Senate Interim Committee on Finance and Revenue January 12, 2018 2 Apportioning Corporate Income Apportionment is a method of dividing
Pay Frequency and Final Pay Provisions
 Pay Frequency and Final Pay Provisions State Pay Frequency Minimum Final Pay Resign Final Pay Terminated Alabama Bi-weekly or semi-monthly No Provision No Provision Alaska Semi-monthly or monthly Next
State Tax Treatment of Social Security, Pension Income
 State Tax Treatment of Social Security, Pension Income The following chart Provides a general overview of how states treat income from Social Security and pensions for the 2016 tax year unless otherwise
State Social Security Income Pension Income State computation not based on federal. Social Security benefits excluded from taxable income.
 State Tax Treatment of Social Security, Pension Income The following CCH analysisi provides a general overview of how states treat income from Social Security and pensions for the 2013 tax year unless
State Corporate Income Tax Collections Decline Sharply
 Corporate Income Tax Collections Decline Sharply Nicholas W. Jenny and Donald J. Boyd The Rockefeller Institute Fiscal News: Vol. 1, No. 3 July 26, 2001 According to a report from the Congressional Budget
Undocumented Immigrants are:
 Immigrants are: Current vs. Full Legal Status for All Immigrants Appendix 1: Detailed State and Local Tax Contributions of Total Immigrant Population Current vs. Full Legal Status for All Immigrants
2012 RUN Powered by ADP Tax Changes
 2012 RUN Powered by ADP Tax Changes Dear Valued ADP Client, Beginning with your first payroll with checks dated in 2012, you and your employees may notice changes in your paychecks due to updated 2012
AIG Benefit Solutions Producer Licensing and Appointment Requirements by State
 3600 Route 66, Mail Stop 4J, Neptune, NJ 07754 AIG Benefit Solutions Producer Licensing and Appointment Requirements by State As an industry leader in the group insurance benefits market, AIG is firmly
The Costs and Benefits of Half a Loaf: The Economic Effects of Recent Regulation of Debit Card Interchange Fees. Robert J. Shapiro
 The Costs and Benefits of Half a Loaf: The Economic Effects of Recent Regulation of Debit Card Interchange Fees Robert J. Shapiro October 1, 2013 The Costs and Benefits of Half a Loaf: The Economic Effects
Union Members in New York and New Jersey 2018
 For Release: Friday, March 29, 2019 19-528-NEW NEW YORK NEW JERSEY INFORMATION OFFICE: New York City, N.Y. Technical information: (646) 264-3600 BLSinfoNY@bls.gov www.bls.gov/regions/new-york-new-jersey
State Retirement Systems: Rhode Island Versus the Nation
 HELIN Consortium HELIN Digital Commons Library Archive HELIN State Law Library 1993 State Retirement Systems: Rhode Island Versus the Nation Follow this and additional works at: http://helindigitalcommons.org/lawarchive
8, ADP,
 2013 Tax Changes Beginning with your first payroll with checks dated in 2013, employees may notice changes in their paychecks due to updated 2013 federal and state tax requirements. This document will
DFA INVESTMENT DIMENSIONS GROUP INC. DIMENSIONAL INVESTMENT GROUP INC. Institutional Class Shares January 2018
 DFA INVESTMENT DIMENSIONS GROUP INC. DIMENSIONAL INVESTMENT GROUP INC. Institutional Class Shares January 2018 Supplementary Tax Information 2017 The following supplementary information may be useful in
The table below reflects state minimum wages in effect for 2014, as well as future increases. State Wage Tied to Federal Minimum Wage *
 State Minimum Wages The table below reflects state minimum wages in effect for 2014, as well as future increases. Summary: As of Jan. 1, 2014, 21 states and D.C. have minimum wages above the federal minimum
Ability-to-Repay Statutes
 Ability-to-Repay Statutes FEDERAL ALABAMA ALASKA ARIZONA ARKANSAS CALIFORNIA STATUTE Truth in Lending, Regulation Z Consumer Credit Secure and Fair Enforcement for Bankers, Brokers, and Loan Originators
The Effect of the Federal Cigarette Tax Increase on State Revenue
 FISCAL April 2009 No. 166 FACT The Effect of the Federal Cigarette Tax Increase on State Revenue By Patrick Fleenor Today the federal cigarette tax will rise from 39 cents to $1.01 per pack. The proceeds
Fingerprint, Biographical Affidavit and Third-Party Verification Reports Requirements
 Updates to the State Specific Information Fingerprint, Biographical Affidavit and Third-Party Verification Reports Requirements State Requirements For Licensure Requirements After Licensure (Non-Domestic)
Taxes and Economic Competitiveness. Dale Craymer President, Texas Taxpayers and Research Association (512)
") Taxes and Economic Competitiveness Dale Craymer President, Texas Taxpayers and Research Association (512) 472-8838 dcraymer@ttara.org www.ttara.org Presented to the Committee on Economic Competitiveness
Taxes and Economic Competitiveness Dale Craymer President, Texas Taxpayers and Research Association (512) 472-8838 dcraymer@ttara.org www.ttara.org Presented to the Committee on Economic Competitiveness
Sustaining State Retirement Benefits: Recent State Legislation Affecting Public Retirement Plans, Ronald Snell January 2010
 Sustaining State Retirement Benefits: Recent State Legislation Affecting Public Retirement Plans, 2005-2009 Ronald Snell January 2010 INTRODUCTION Since 2007, investment losses and the weakness of state
How Much Would a State Earned Income Tax Credit Cost in Fiscal Year 2018?
 820 First Street NE, Suite 510 Washington, DC 20002 Tel: 202-408-1080 Fax: 202-408-1056 center@cbpp.org www.cbpp.org Updated February 8, 2017 How Much Would a State Earned Income Tax Cost in Fiscal Year?
Impacts of Prepayment Penalties and Balloon Loans on Foreclosure Starts, in Selected States: Supplemental Tables
 THE UNIVERSITY NORTH CAROLINA at CHAPEL HILL T H E F R A N K H A W K I N S K E N A N I N S T I T U T E DR. MICHAEL A. STEGMAN, DIRECTOR T 919-962-8201 OF PRIVATE ENTERPRISE CENTER FOR COMMUNITY CAPITALISM
TA X FACTS NORTHERN FUNDS 2O17
 TA X FACTS 2O17 Northern Funds Tax Facts provides specific information about your Northern Funds investment income and capital gain distributions for 2017. If you have any questions about how to apply
PAY STATEMENT REQUIREMENTS
 PAY MENT 2017 PAY MENT Alabama Alaska Arizona Arkansas California Colorado Connecticut Delaware District of Columbia Florida Georgia No generally applicable wage payment law for private employers. Rate
Metrics and Measurements for State Pension Plans. November 17, 2016 Greg Mennis
 Metrics and Measurements for State Pension Plans November 17, 2016 Greg Mennis Fiscal Sustainability Metrics Net Amortization Measures whether contributions are sufficient to reduce pension debt if plan
State Unemployment Insurance Tax Survey
 444 N. Capitol Street NW, Suite 142, Washington, DC 20001 202-434-8020 fax 202-434-8033 www.workforceatm.org State Unemployment Insurance Tax Survey NATIONAL ASSOCIATION OF STATE WORKFORCE AGENCIES April
Fingerprint and Biographical Affidavit Requirements
 Updates to the State-Specific Information Fingerprint and Biographical Affidavit Requirements State Requirements For Licensure Requirements After Licensure (Non-Domestic) Alabama NAIC biographical affidavit
STATE MINIMUM WAGES 2017 MINIMUM WAGE BY STATE
 STATE MINIMUM WAGES 2017 MINIMUM WAGE BY STATE The table below, created by the National Conference of State Legislatures (NCSL), reflects current state minimum wages in effect as of January 1, 2017, as
Providing Subprime Consumers with Access to Credit: Helpful or Harmful? James R. Barth Auburn University
 Providing Subprime Consumers with Access to Credit: Helpful or Harmful? James R. Barth Auburn University FICO Scores: Identifying Subprime Consumers Category FICO Score Range Super-prime 740 and Higher
MainStay Funds Income Tax Information Notice
 MainStay Funds Income Tax Information Notice The information contained in this brochure is being furnished to shareholders of the MainStay Funds for informational purposes only. Please consult your own
Exhibit 1. Morningstar, State of North Carolina Pension Overview (Nov. 20, 2013).
.") Exhibit 1 Morningstar, Pension Overview (Nov. 20, 2013). Also available at https://www.nctreasurer.com/ret/documents/morningstarncpensionreport.pdf Morningstar Pension Report Release Date: 20 Nov 2013
Exhibit 1 Morningstar, Pension Overview (Nov. 20, 2013). Also available at https://www.nctreasurer.com/ret/documents/morningstarncpensionreport.pdf Morningstar Pension Report Release Date: 20 Nov 2013
Q Homeowner Confidence Survey Results. May 20, 2010
 Q1 2010 Homeowner Confidence Survey Results May 20, 2010 The Zillow Homeowner Confidence Survey is fielded quarterly to determine the confidence level of American homeowners when it comes to the value
Required Training Completion Date. Asset Protection Reciprocity
 Completion Alabama Alaska Arizona Arkansas California State Certification: must complete initial 16 hours (8 hrs of general LTC CE and 8 hrs of classroom-only CE specifically on the CA for LTC prior to
Aetna Individual Direct Pay Commissions Schedule
 Aetna Individual Direct Pay Commissions Schedule Cards Issued Broker Rate Broker Tier Per Year 1st Yr 2nd Yr 3+ Yrs Levels 11-Jan 4.00% 4.00% 3.00% Bronze 24-Dec 6.00% 4.00% 3.00% Silver 25-49 8.00% 4.00%
Federal Employees Retirement System: Summary of Recent Trends
 Federal Employees Retirement System: Summary of Recent Trends Katelin P. Isaacs Analyst in Income Security January 11, 2011 Congressional Research Service CRS Report for Congress Prepared for Members and
Overview of Sales Tax Exemptions for Agricultural Producers in the United States
 Overview of Sales Tax Exemptions for Agricultural Producers in the United States Dr. Wayne P. Miller Tyler R. Knapp November 2017 Draft Not for publication or quotation The University of Arkansas System
Recourse for Employees Misclassified as Independent Contractors Department for Professional Employees, AFL-CIO
 Recourse for Employees Misclassified as Independent Contractors Department for Professional Employees, AFL-CIO State Relevant Agency Contact Information Online Resources Online Filing Alabama Department
The Starting Portfolio is divided into the following account types based on the proportions in your accounts. Cash accounts are considered taxable.
 Overview Our Retirement Planner runs 5,000 Monte Carlo simulations to deliver a robust, personalized retirement projection. The simulations incorporate expected return and volatility, annual savings, income,
Mapping the geography of retirement savings
 of savings A comparative analysis of retirement savings data by state based on information gathered from over 60,000 individuals who have used the VoyaCompareMe online tool. Mapping the geography of retirement
NASRA Issue Brief: Employee Contributions to Public Pension Plans
 NASRA Issue Brief: Employee Contributions to Public Pension Plans September 2017 Unlike in the private sector, nearly all employees of state and local government are required to share in the cost of their
Nation s Uninsured Rate for Children Drops to Another Historic Low in 2016
 Nation s Rate for Children Drops to Another Historic Low in 2016 by Joan Alker and Olivia Pham The number of uninsured children nationwide dropped to another historic low in 2016 with approximately 250,000
NCSL Midwest States Fiscal Leaders Forum. March 10, 2017
 NCSL Midwest States Fiscal Leaders Forum March 10, 2017 Public Pensions: 50-State Overview David Draine, Senior Officer Public Sector Retirement Systems Project The Pew Charitable Trusts More than 40 active,
Minimum Wage Laws in the States - April 3, 2006
 1 of 15 Wage Laws in the States - April 3, 2006 Note: Where Federal and state law have different minimum wage rates, the higher standard applies. Wage and Overtime Standards Applicable to Nonsupervisory
IMPORTANT TAX INFORMATION
 IMPORTANT TAX INFORMATION The following information about your enclosed 1099-DIV from s should be used when preparing your 2017 tax return. Form 1099-DIV reports dividends, exempt-interest dividends, capital
FHA Manual Underwriting Exceeding 31% / 43% DTI Eligibility Quick Reference
 Credit Score/ Compensating Factor(s)* No Compensating Factor One Compensating Factor Two Compensating Factors No Discretionary Debt Maximum DTI 31% / 43% 37% / 47% 40% / 50% 40% / 40% *Acceptable compensating
NOTICE TO MEMBERS CANADIAN DERIVATIVES CORPORATION CANADIENNE DE. Trading by U.S. Residents
 NOTICE TO MEMBERS CANADIAN DERIVATIVES CORPORATION CANADIENNE DE CLEARING CORPORATION COMPENSATION DE PRODUITS DÉRIVÉS NOTICE TO MEMBERS No. 2002-013 January 28, 2002 Trading by U.S. Residents This is
Mutual Fund Tax Information
 Mutual Fund Tax Information We have provided this information as a service to our shareholders. Thornburg Investment Management cannot and does not give tax or accounting advice. If you have further questions
State Individual Income Tax Rates for Retirement Income as of January 31, 2015 Presented by Timothy Weller
 State Individual Income Tax Rates for as of January 31, 2015 Presented by Timothy Weller State Low High Low High Alabama 2.0 5.0 $500 $3,000 Social security, as well as military, civil service, state/local
EBRI Databook on Employee Benefits Chapter 6: Employment-Based Retirement Plan Participation
 EBRI Databook on Employee Benefits Chapter 6: Employment-Based Retirement Plan Participation UPDATED July 2014 This chapter looks at the percentage of American workers who work for an employer who sponsors
Federal Registry. NMLS Federal Registry Quarterly Report Quarter I
 Federal Registry NMLS Federal Registry Quarterly Report 2012 Quarter I Updated June 6, 2012 Conference of State Bank Supervisors 1129 20 th Street, NW, 9 th Floor Washington, D.C. 20036-4307 NMLS Federal
CRS Report for Congress
 Order Code RS20853 Updated February 22, 2005 CRS Report for Congress Received through the CRS Web State Estate and Gift Tax Revenue Steven Maguire Economic Analyst Government and Finance Division Summary
Do you charge an expedite fee for online filings?
 Topic: Expedite Fees and Online Filings Question by: Allison A. DeSantis : Ohio Date: March 14, 2012 Manitoba Corporations Canada Alabama Alaska Arizona Yes. The expedite fee is $35. We currently offer
# of Credit Unions As of March 31, 2011
 # of Credit Unions # of Credit Unins # of Credit Unions As of March 31, 2011 8,600 8,400 8,200 8,000 8,478 8,215 7,800 7,909 7,600 7,400 7,651 7,442 7,200 7,000 6,800 # of Credit Unions -Trend By Asset-Based
Year-End Tax Tables Applicable to Form 1099-DIV Page 2 Qualified Dividend Income
 Year-End Tax Tables This document contains general information to assist you in completing your 2016 tax returns. You should consult your tax advisor to determine the appropriate use of these tables. This
FAPRI Analysis of Dairy Policy Options for the 2002 Farm Bill Conference
 FAPRI Analysis of Dairy Policy Options for the 2002 Farm Bill Conference FAPRI-UMC Report #04-02 April 11, 2002 Food and Agricultural Policy Research Institute University of Missouri 101 South Fifth Street
Residual Income Requirements
 Residual Income Requirements ytzhxrnmwlzh Ch. 4, 9-e: Item 44, Balance Available for Family Support (04/10/09) Enter the appropriate residual income amount from the following tables in the guideline box.
ADDITIONAL REQUIRED TRAINING before proceeding. Annuity Carrier Specific Product Training
 Reliance Standard REQUIRED CARRIER SPECIFIC TRAINING (CST) INSTRUCTIONS Annuity Carrier Specific Product Training and state mandated NAIC Annuity Training (see STATE ANNUITY SUITABILITY TRAINING REQUIREMENT
Employer-Funded Individual Health Insurance
 Employer-Funded Individual Health Insurance ANNUAL REPORT 2016 1 EXECUTIVE SUMMARY This 2016 Annual Report is intended to provide a detailed, nationwide profile of how employers and employees are using
Media Alert. First American CoreLogic Releases Q3 Negative Equity Data
 Contact Information Below Media Alert First American CoreLogic Releases Q3 Negative Equity Data First American CoreLogic, the first company to develop a national, state and city-level negative equity report,
State Estate Taxes BECAUSE YOU ASKED ADVANCED MARKETS
 ADVANCED MARKETS State Estate Taxes In 2001, President George W. Bush signed the Economic Growth and Tax Reconciliation Act (EGTRRA) into law. This legislation began a phaseout of the federal estate tax,
Property Taxation of Business Personal Property
 Taxation of Business Personal Evaluate the property tax as it applies to business personal property and the current $500 exemption. Quantify the economic effect of taxing business personal property and
STATE AND FEDERAL MINIMUM WAGES
 2017 STATE AND FEDERAL MINIMUM WAGES STATE AND FEDERAL MINIMUM WAGES The federal Fair Labor Standards Act (FLSA) establishes minimum wage and overtime requirements for most employers in the private sector
If the foreign survivor of the merger is on the record what do you require?
 Topic: Question by: : Foreign Mergers Tracy M. Sebranek Maine Date: December 17, 2013 Manitoba Corporations Canada Alabama Alaska Arizona We require only a certified copy of the merger documents, as long
Total state and local business taxes
 Total state and local business taxes State-by-state estimates for fiscal year 2016 August 2017 Executive summary This study presents detailed state-by-state estimates of the state and local taxes paid
2014 STATE AND FEDERAL MINIMUM WAGES HR COMPLIANCE CENTER
 2014 STATE AND FEDERAL MINIMUM WAGES HR COMPLIANCE CENTER The federal Fair Labor Standards Act (FLSA), which applies to most employers, establishes minimum wage and overtime requirements for the private
Mutual Fund Tax Information
 2008 Mutual Fund Tax Information We have provided this information as a service to our shareholders. Thornburg Investment Management cannot and does not give tax or accounting advice. If you have further
MINIMUM WAGE WORKERS IN TEXAS 2016
 For release: Thursday, May 4, 2017 17-488-DAL SOUTHWEST INFORMATION OFFICE: Dallas, Texas Contact Information: (972) 850-4800 BLSInfoDallas@bls.gov www.bls.gov/regions/southwest MINIMUM WAGE WORKERS IN
White Paper 2018 STATE AND FEDERAL MINIMUM WAGES
 White Paper STATE AND FEDERAL S White Paper STATE AND FEDERAL S The federal Fair Labor Standards Act (FLSA) establishes minimum wage and overtime requirements for most employers in the private sector and
CLMS BRIEF 2 - Estimate of SUI Revenue, State-by-State
 CLMS BRIEF 2 - Estimate of SUI Revenue, State-by-State Estimating the Annual Amounts of Unemployment Insurance Tax Collections From Individual States for Financing Adult Basic Education/ Job Training Programs
J.P. Morgan Funds 2018 Distribution Notice
 J.P. Morgan Funds 2018 Distribution Notice To assist you in preparing your 2018 Tax returns, we re pleased to provide this distribution notice for your J.P.Morgan Fund investment. If you are unclear about
WikiLeaks Document Release
 WikiLeaks Document Release February 2, 2009 Congressional Research Service Report 98-972 Federal Employee Retirement Programs: Summary of Recent Trends Patrick J. Purcell, Domestic Social Policy Division
Chapter D State and Local Governments
 Chapter D State and Local Governments State and Local Governments contains detailed information on the taxes, revenues, and expenditures of states and localities. The public finances of these two levels
SECTION 109 HOST STATE LOAN-TO-DEPOSIT RATIOS. The Board of Governors of the Federal Reserve System, the Federal Deposit Insurance
 SECTION 109 HOST STATE LOAN-TO-DEPOSIT RATIOS The Board of Governors of the Federal Reserve System, the Federal Deposit Insurance Corporation, and the Office of the Comptroller of the Currency (the agencies)
Introduction to the U.S. K-12 Instructional Materials Industry
 Introduction to the U.S. K-12 Instructional Materials Industry Objective For the benefit of creditors of McGraw-Hill School Education, we have prepared a primer on the U.S. K-12 Instructional Materials
Insurer Participation on ACA Marketplaces,
 November 2018 Issue Brief Insurer Participation on ACA Marketplaces, 2014-2019 Rachel Fehr, Cynthia Cox, Larry Levitt Since the Affordable Care Act health insurance marketplaces opened in 2014, there have
A d j u s t e r C r e d i t C E I n f o r m a t i o n S T A T E. DRI Will Submit Credit For You To Your State Agency. (hours ethics included)
") A d j u s t e r C r e d i t C E I n f o r m a t i o n INSURANCE COVERAGE AND CLAIMS INSTITUTE APRIL 3 5, 2019 CHICAGO, IL Delaware Georgia Louisiana Mississippi New Hampshire North Carolina (hours ethics
A d j u s t e r C r e d i t C E I n f o r m a t i o n INSURANCE COVERAGE AND CLAIMS INSTITUTE APRIL 3 5, 2019 CHICAGO, IL Delaware Georgia Louisiana Mississippi New Hampshire North Carolina (hours ethics
Total state and local business taxes
 Total state and local business taxes State-by-state estimates for fiscal year 2017 November 2018 Executive summary This study presents detailed state-by-state estimates of the state and local taxes paid
Q209 NATIONAL DELINQUENCY SURVEY FROM THE MORTGAGE BANKERS ASSOCIATION. Data as of June 30, 2009
 NATIONAL DELINQUENCY SURVEY FROM THE MORTGAGE BANKERS ASSOCIATION Q209 Data as of June 30, 2009 2009 Mortgage Bankers Association (MBA). All rights reserved, except as explicitly granted. Data are from
Child Care Assistance Spending and Participation in 2016
 Policy solutions that work for low-income people Child Care Assistance Spending and Participation in 2016 i Background The Child Care and Development Block Grant (CCDBG) is the primary federal funding
Total state and local business taxes
 Total state and local business taxes State-by-state estimates for fiscal year 2014 October 2015 Executive summary This report presents detailed state-by-state estimates of the state and local taxes paid
THE STATE OF THE STATES IN DEVELOPMENTAL DISABILITIES
 THE STATE OF THE STATES IN DEVELOPMENTAL DISABILITIES Richard Hemp, Mary Kay Rizzolo, Shea Tanis, & David Braddock Universities of Colorado and Illinois-Chicago REINVENTING QUALITY CONFERENCE BALTIMORE,
Workers Compensation Coverage: Technical Note on Estimates
 Workers Compensation October 2002 No. 2 Data Fact Sheet NATIONAL ACADEMY OF SOCIAL INSURANCE Workers Compensation Coverage: Technical Note on Estimates Prepared for the International Association of Industrial
State Retiree Health Care Liabilities: An Update Increased obligations in 2015 mirrored rise in overall health care costs
 A brief from Sept 207 State Retiree Health Care Liabilities: An Update Increased obligations in 205 mirrored rise in overall health care costs Overview States paid a total of $20.8 billion in 205 for nonpension
DATA AS OF SEPTEMBER 30, 2010
 NATIONAL DELINQUENCY SURVEY Q3 2010 DATA AS OF SEPTEMBER 30, 2010 2010 Mortgage Bankers Association (MBA). All rights reserved, except as explicitly granted. Data are from a proprietary paid subscription