BASIC STATISTICS ECOE 1323
|
|
|
- Constance McDaniel
- 5 years ago
- Views:
Transcription
1 BASIC STATISTICS ECOE 33 SPRING 007 FINAL EXAM NAME: ID NUMBER: INSTRUCTIONS:. Write your ame ad studet ID.. You have hours 3. This eam must be your ow work etirely. You caot talk to or share iformatio with ayoe. 4. Show all your work. Partial credit will oly be give where sufficiet uderstadig of the problem has bee demostrated ad work is show. DON'T WRITE ON THIS TABLE QUESTION # # #3 #4 BONUS TOTAL POINTS
2 SECTION : MULTIPLE-CHOICE Questio # For each questio i this sectio, circle the correct aswer. (Problem is worth pts.). The distictio betwee descriptive ad iferetial statistics is that a) descriptive statistics are umeric, iferetial statistics are graphic. b) descriptive statistics are mea-based, iferetial statistics are media-based. c) descriptive statistics describe data sets, iferetial statistics ivolve geeralizig to populatios. d) descriptive statistics are used i social sciece, iferetial statistics are used i physical scieces. e) Noe of these.. For which of the followig statistics would oe ot eed to put the data i order from smallest to largest? a) the iterquartile rage b) the trimmed mea c) the media d) the rage e) the variace 3. Suppose that for a set of umeric data, where the umbers are ot all differet, the stadard deviatio is less tha.0. The it must be true that a) the variace < the stadard deviatio. b) the variace the stadard deviatio. c) the variace = the stadard deviatio. d) the stadard deviatio e) the stadard deviatio the variace. < the variace. 4. Which of the followig idicates that a associatio betwee ad y is positive? a) A positive coefficiet of determiatio b) A positive stadard deviatio about the least squares lie c) A positive itercept of the least squares lie d) A positive Pearso s correlatio coefficiet e) A positive residual sum of squares 5. The slope of the regressio lie ad the correlatio betwee two variables is related i the followig way: a) The slope is always greater i absolute value tha the correlatio. b) The slope ad correlatio must be of the same sig. c) The slope ad correlatio must be of differet sig. d) The slope is always less i absolute value tha the correlatio. e) Noe of (a) - (d) is ecessarily true.
3 6. Of the properties below, which is NOT a basic property of probability? ( ) a) For ay evet E, 0 P E. ( ) b) If S is the sample space for a eperimet, P S =. c) If two evets E ad F are disjoit, the ( ) = ( ) + ( ) P E or F P E P F. d) For ay evet E, P ( E ) P ( ot E ) + = e) For ay two DISJOINT evets, E ad F, ( ) P ( E or F ) P E ad F 7. The evet, ot A is called the of evet A. a) egatio b) complemet c) uio d) itersectio e) cojuctio For questios 8-9, let deote the umber of accidets i a give moth at a certai high school parkig lot. Suppose that the probability distributio of is: P() What is the probability that there are fewer tha 3 accidets i a give moth? a).0 b).4 c).585 d).799 e) Noe of these 9. What is the probability that to 4 (iclusive) accidets occur i a give moth? a).6 b).34 c).394 d).608 e) Noe of these 0. Which of the followig statemets about ormal curves is false? a) Every ormal curve is symmetric. b) Every ormal curve is symmetric about 0. c) Every ormal curve is bell-shaped. d) Every ormal curve is cetered at its mea. e) About 0.68 of the area uder a ormal curve is withi stadard deviatio of its mea.
4 . The proportio of values i a ormal populatio distributio that fall withi stadard deviatios of the mea is: a) 0.08 b) c) d) e) Which of the followig is ot a property of a biomial eperimet? a) It cosists of a fied umber of trials,. b) Outcomes of differet trials are idepedet. c) Each trial ca result i oe of several differet outcomes. d) Observatios cosist of the umber of successes for each trial of the eperimet. e) The probability of success is costat for each trial. 3. If is a biomial radom variable with = 0 ad p = 0.5, the a) σ =.875 b) σ =.5 c) σ =.875 d) σ =.5 e) Noe of (a) - (d) 4. Suppose that has a probability distributio with desity fuctio c, if 6 < < 8 f ( ) = 0 otherwise. The the value of c is: a) 0.5 b) 0.6 c) 0.7 d) 0.8 e) Whe costructig a 95% cofidece iterval, the cofidece level is: a) 0.95 b) c) d) e) Caot be determied 6. Which of the followig is ot a statistical hypothesis? a) > 00 b) µ = 00 c) µ > 00 σ = d) 5 e) P.5 3
5 7. A type I error is made by a) rejectig H 0 whe it is true. b) rejectig H 0 whe it is false. c) failig to reject H 0 whe it is true. d) failig to reject H 0 whe it is false. 8. The P-value for a z test of H : P=.5 vs. H : P<.5, where z=.36 is: 0 0 ( > ) b) P( z<.36) P( z> ) ( z> 6 ) e) P(.36 < z ad z>.36) a) P z.36 c).36 d) P.3 9. Suppose you take a simple radom sample from a populatio kow to be ormally distributed, but the value of σ is ukow. Your sample size is = 0. Which formula below should be used to fid the 90% cofidece iterval for the mea? a) ±.645 s σ b) ± d) ±.8 σ σ e) ± c) ±.833 s 0 0. The degrees of freedom of a paired t test based o = 0 pairs is a) 9 b) 0 c) 9 d) 0 e) Noe of these 4
6 Questio () (I) A reporter for a studet ewspaper is writig a article o the cost of attedig college. A portio of the article deals with the cost of off-campus housig. A sample of 0 oe-bedroom uits withi oe-half mile of campus resulted i a sample mea of $350 per moth ad a sample stadard deviatio of $30, assumig that the populatio is ormally distributed. (a) [5 Poits] Provide a 95% cofidece iterval estimate of the populatio mea. (b) [8 Poits] The college ewspaper claims that mea cost per moth for oe-bedroom uits withi oe-half mile of campus is less tha $370. Test this claim at 0.05 level of sigificace. 5
7 (II) [7 Poits] To estimate the proportio of traffic deaths i Florida last year that were alcohol related, determie the ecessary sample size for the estimate to be accurate to withi.05 with probability.99. Based o results of a previous study, we epect the proportio to be about.35. 6
8 Questio (3) (I) [0 Poits] I 990, 5.8% of job applicats who were tested for drugs failed the test. At the 0.0 level, test the claim that the failure rate is ow lower if a radom sample of 50 curret job applicats results i 58 failures. H o : H a : Test Statistic: P-value: Coclusio: (a) State H 0 ad H a. H 0: p=0.058 H a: p<0.058 (b) Calculate the test statistic. z = 50, = ˆp p SE ˆp 0 = = 58 58, ˆp = = , = 3. 3 SE ˆp = p0( p) 0 = ( )( 0. 94) 50 = (c) Fid the P-value or give the rejectio regio. P-value=P(Z<-3.3)=ormalcdf(-E99,-3.3)= (d) State your coclusio. Coclusio: We reject H 0 ad coclude that the failure rate is ow lower tha 5.8%. 7
9 (II) [0 Poits] How large a sample size is eeded to estimate the mea aual icome of Native Americas correct to withi $000 with probability.99? Suppose there is o prior iformatio about the stadard deviatio of aual icome of Native Americas, but we guess that about 68% of their icomes are betwee $0000 ad $40,000 ad that this distributio of icomes is approimately moud shaped. 8
10 Questio (4) (I) [0 Poits] The Motaa Highway Patrol is iterested i determiig whether Motaa residets or oresidets drive faster o a particular stretch of Iterstate 90. Idepedet radom samples of the speeds of cars havig Motaa licese plates ad cars licesed i other states results i the summary data listed below. Group Sample size Sample Mea Sample stadard deviatio Motaa Others Assume the populatio variaces are the same. At 0.05 level of sigificace, is there sufficiet evidece to coclude that oresidets drive faster o this stretch of Iterstate 90 tha residets of Motaa? H o : H a : Test Statistic: P-value Coclusio: 9
11 (II) [0 Poits] A article reports that (4.0, 5.6) is a 95% cofidece iterval for the mea legth of stay, i days, of patiets i hospital for a particular operatio. The article reports the sample size of 50, but ot the sample mea or stadard deviatio. Fid them. 0
12 إضافي Bous: (I) [3 Poits] For a ormally distributed variable, verify that the probability betwee µ +. 67σ equals.50 µ 67σ. ad (II) [3 Poits] Fid the b-value such that the iterval probability for a ormal distributio. µ bσ ad µ + bσ cotais 98% of the (III) A fast food chai sells hamburger that they claim has sodium cotet of 650 milligrams. A simple radom sample of 35 hamburgers was aalyzed for sodium cotet. A 99% cofidece iterval for the populatio mea sodium cotet, µ, of such hamburgers is (65, 67). Aswer the followig questios with yes, o or ca't tell. Give a eplaatio for your aswer. (a) [ Poit] Does the populatio mea lie i the iterval (65, 67)? (b) [ Poit] If we were to use the precedig data to test the hypotheses H o : µ =650 versus H a : µ 650. At a % sigificace level, would we reject the ull hypothesis? Eplai.
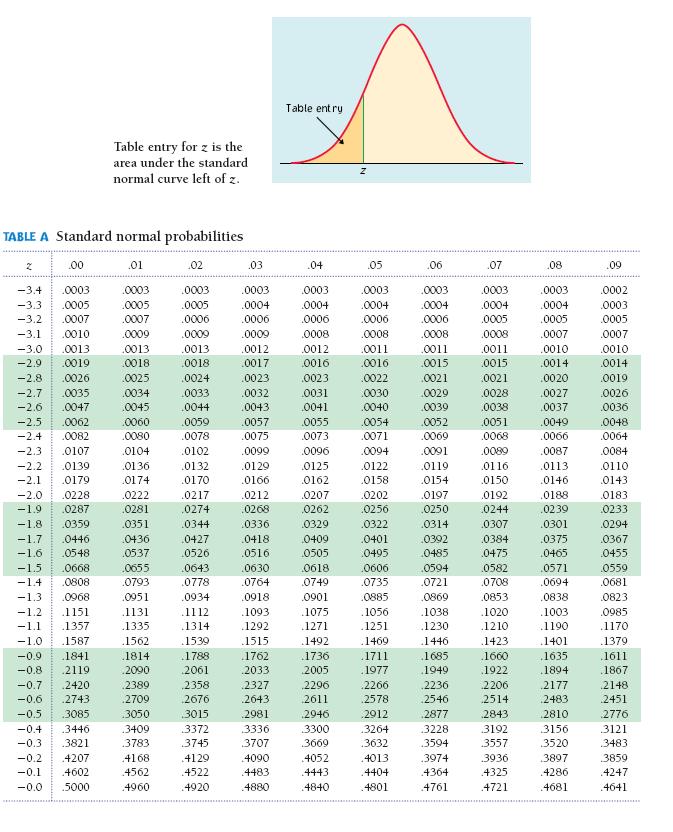
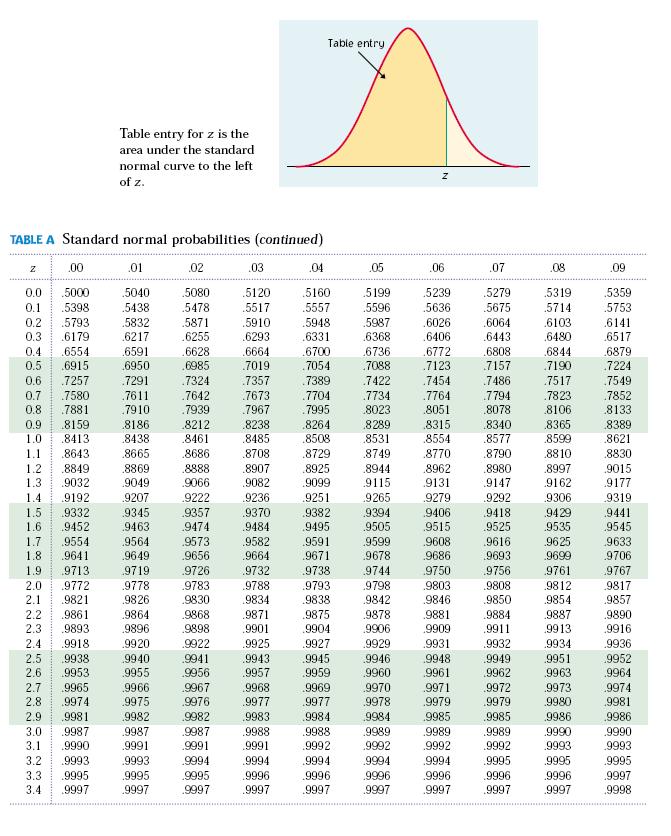
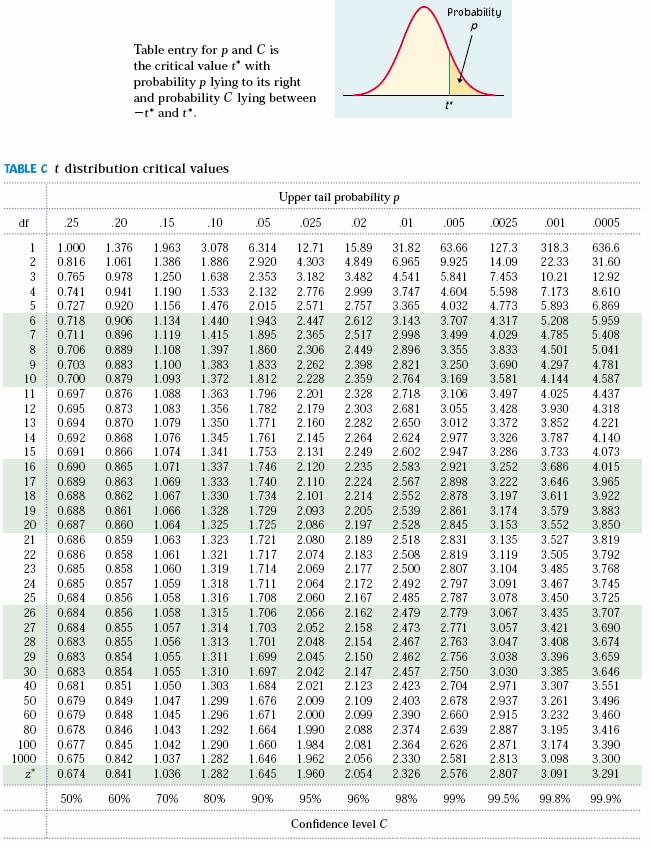
13 Formulas: i i = IQR = Q3 Q, =, S = i i = ( ) i y i y S y i = yˆ = a + b, b = r, a = y b r = S i y i y i = i = k k! P ( X = k ) = p ( p ), k = 0,,,, =,! = ( ) 3.., µ = p, σ = p p k k k!( k )! Populatio mea (s) Level C cofidece iterval Hypothesis test Large sample Oe-sample z test Use s ifσ is ukow Small sample ad σ ukow Oe-sample t test Large samples Two-sample z test Use s ad s if σ, σ are ukow Pooled two-sample t test ( ) s + ( ) s s p = ( + ) σ, ukow & equal σ Two-sample t test σ ± z σ s ± t df = ( ) σ, ukow & uequal ( ) Matched pairs t-test Oe-Proportio z test Computig P-values Sample size for desired margi of error m Oe-sample z iterval: z σ = m ± z σ + σ µ z = σ t ( ) µ =, df = s z = σ σ + ( ) ± t sp + t = sp + df = + df = + s s ± t + t = s + s ( ) df = mi, df = mi, t =, =, df = s p~( p~) p p p~ ± z z = + 4 p ( p ) where Wilso Estimate where the Sample proportio + p~ = p ˆ = + 4 Use z -table for z tests ad t-table for t tests Reject H if P-value < α Oe-proportio z iterval: z + 4 = p p m ( ) ( ) ( ), 4 z + = m ( )
14 3
15 4
16 5
Inferential Statistics and Probability a Holistic Approach. Inference Process. Inference Process. Chapter 8 Slides. Maurice Geraghty,
 Iferetial Statistics ad Probability a Holistic Approach Chapter 8 Poit Estimatio ad Cofidece Itervals This Course Material by Maurice Geraghty is licesed uder a Creative Commos Attributio-ShareAlike 4.0
point estimator a random variable (like P or X) whose values are used to estimate a population parameter
 whose values are used to estimate a population parameter") Estimatio We have oted that the pollig problem which attempts to estimate the proportio p of Successes i some populatio ad the measuremet problem which attempts to estimate the mea value µ of some quatity
Estimatio We have oted that the pollig problem which attempts to estimate the proportio p of Successes i some populatio ad the measuremet problem which attempts to estimate the mea value µ of some quatity
Chapter 8. Confidence Interval Estimation. Copyright 2015, 2012, 2009 Pearson Education, Inc. Chapter 8, Slide 1
 Chapter 8 Cofidece Iterval Estimatio Copyright 2015, 2012, 2009 Pearso Educatio, Ic. Chapter 8, Slide 1 Learig Objectives I this chapter, you lear: To costruct ad iterpret cofidece iterval estimates for
Introduction to Probability and Statistics Chapter 7
 Itroductio to Probability ad Statistics Chapter 7 Ammar M. Sarha, asarha@mathstat.dal.ca Departmet of Mathematics ad Statistics, Dalhousie Uiversity Fall Semester 008 Chapter 7 Statistical Itervals Based
A point estimate is the value of a statistic that estimates the value of a parameter.
 Chapter 9 Estimatig the Value of a Parameter Chapter 9.1 Estimatig a Populatio Proportio Objective A : Poit Estimate A poit estimate is the value of a statistic that estimates the value of a parameter.
1 Random Variables and Key Statistics
 Review of Statistics 1 Radom Variables ad Key Statistics Radom Variable: A radom variable is a variable that takes o differet umerical values from a sample space determied by chace (probability distributio,
ST 305: Exam 2 Fall 2014
 ST 305: Exam Fall 014 By hadig i this completed exam, I state that I have either give or received assistace from aother perso durig the exam period. I have used o resources other tha the exam itself ad
Statistics for Economics & Business
 Statistics for Ecoomics & Busiess Cofidece Iterval Estimatio Learig Objectives I this chapter, you lear: To costruct ad iterpret cofidece iterval estimates for the mea ad the proportio How to determie
Chapter 10 - Lecture 2 The independent two sample t-test and. confidence interval
 Assumptios Idepedet Samples - ukow σ 1, σ - 30 or m 30 - Upooled case Idepedet Samples - ukow σ 1, σ - 30 or m 30 - Pooled case Idepedet samples - Pooled variace - Large samples Chapter 10 - Lecture The
. (The calculated sample mean is symbolized by x.)
") Stat 40, sectio 5.4 The Cetral Limit Theorem otes by Tim Pilachowski If you have t doe it yet, go to the Stat 40 page ad dowload the hadout 5.4 supplemet Cetral Limit Theorem. The homework (both practice
Stat 40, sectio 5.4 The Cetral Limit Theorem otes by Tim Pilachowski If you have t doe it yet, go to the Stat 40 page ad dowload the hadout 5.4 supplemet Cetral Limit Theorem. The homework (both practice
Chapter 8: Estimation of Mean & Proportion. Introduction
 Chapter 8: Estimatio of Mea & Proportio 8.1 Estimatio, Poit Estimate, ad Iterval Estimate 8.2 Estimatio of a Populatio Mea: σ Kow 8.3 Estimatio of a Populatio Mea: σ Not Kow 8.4 Estimatio of a Populatio
B = A x z
 114 Block 3 Erdeky == Begi 6.3 ============================================================== 1 / 8 / 2008 1 Correspodig Areas uder a ormal curve ad the stadard ormal curve are equal. Below: Area B = Area
1. Find the area under the standard normal curve between z = 0 and z = 3. (a) (b) (c) (d)
 (b) (c) (d)") STA 2023 Practice 3 You may receive assistace from the Math Ceter. These problems are iteded to provide supplemetary problems i preparatio for test 3. This packet does ot ecessarily reflect the umber,
STA 2023 Practice 3 You may receive assistace from the Math Ceter. These problems are iteded to provide supplemetary problems i preparatio for test 3. This packet does ot ecessarily reflect the umber,
CHAPTER 8 Estimating with Confidence
 CHAPTER 8 Estimatig with Cofidece 8.2 Estimatig a Populatio Proportio The Practice of Statistics, 5th Editio Stares, Tabor, Yates, Moore Bedford Freema Worth Publishers Estimatig a Populatio Proportio
Sampling Distributions and Estimation
 Samplig Distributios ad Estimatio T O P I C # Populatio Proportios, π π the proportio of the populatio havig some characteristic Sample proportio ( p ) provides a estimate of π : x p umber of successes
Basic formula for confidence intervals. Formulas for estimating population variance Normal Uniform Proportion
 Basic formula for the Chi-square test (Observed - Expected ) Expected Basic formula for cofidece itervals sˆ x ± Z ' Sample size adjustmet for fiite populatio (N * ) (N + - 1) Formulas for estimatig populatio
Lecture 4: Probability (continued)
") Lecture 4: Probability (cotiued) Desity Curves We ve defied probabilities for discrete variables (such as coi tossig). Probabilities for cotiuous or measuremet variables also are evaluated usig relative
Lecture 4: Probability (cotiued) Desity Curves We ve defied probabilities for discrete variables (such as coi tossig). Probabilities for cotiuous or measuremet variables also are evaluated usig relative
Estimating Proportions with Confidence
 Aoucemets: Discussio today is review for midterm, o credit. You may atted more tha oe discussio sectio. Brig sheets of otes ad calculator to midterm. We will provide Scatro form. Homework: (Due Wed Chapter
Statistics for Business and Economics
 Statistics for Busiess ad Ecoomics Chapter 8 Estimatio: Additioal Topics Copright 010 Pearso Educatio, Ic. Publishig as Pretice Hall Ch. 8-1 8. Differece Betwee Two Meas: Idepedet Samples Populatio meas,
ii. Interval estimation:
 1 Types of estimatio: i. Poit estimatio: Example (1) Cosider the sample observatios 17,3,5,1,18,6,16,10 X 8 X i i1 8 17 3 5 118 6 16 10 8 116 8 14.5 14.5 is a poit estimate for usig the estimator X ad
Topic-7. Large Sample Estimation
 Topic-7 Large Sample Estimatio TYPES OF INFERENCE Ò Estimatio: É Estimatig or predictig the value of the parameter É What is (are) the most likely values of m or p? Ò Hypothesis Testig: É Decidig about
Today: Finish Chapter 9 (Sections 9.6 to 9.8 and 9.9 Lesson 3)
") Today: Fiish Chapter 9 (Sectios 9.6 to 9.8 ad 9.9 Lesso 3) ANNOUNCEMENTS: Quiz #7 begis after class today, eds Moday at 3pm. Quiz #8 will begi ext Friday ad ed at 10am Moday (day of fial). There will be
Today: Fiish Chapter 9 (Sectios 9.6 to 9.8 ad 9.9 Lesso 3) ANNOUNCEMENTS: Quiz #7 begis after class today, eds Moday at 3pm. Quiz #8 will begi ext Friday ad ed at 10am Moday (day of fial). There will be
Exam 2. Instructor: Cynthia Rudin TA: Dimitrios Bisias. October 25, 2011
 15.075 Exam 2 Istructor: Cythia Rudi TA: Dimitrios Bisias October 25, 2011 Gradig is based o demostratio of coceptual uderstadig, so you eed to show all of your work. Problem 1 You are i charge of a study
CHAPTER 8: CONFIDENCE INTERVAL ESTIMATES for Means and Proportions
 CHAPTER 8: CONFIDENCE INTERVAL ESTIMATES for Meas ad Proportios Itroductio: We wat to kow the value of a parameter for a populatio. We do t kow the value of this parameter for the etire populatio because
CHAPTER 8: CONFIDENCE INTERVAL ESTIMATES for Means and Proportions
 CHAPTER 8: CONFIDENCE INTERVAL ESTIMATES for Meas ad Proportios Itroductio: I this chapter we wat to fid out the value of a parameter for a populatio. We do t kow the value of this parameter for the etire
Confidence Intervals. CI for a population mean (σ is known and n > 30 or the variable is normally distributed in the.
 Cofidece Itervals A cofidece iterval is a iterval whose purpose is to estimate a parameter (a umber that could, i theory, be calculated from the populatio, if measuremets were available for the whole populatio).
Chapter 8 Interval Estimation. Estimation Concepts. General Form of a Confidence Interval
 Chapter 8 Iterval Estimatio Estimatio Cocepts Usually ca't take a cesus, so we must make decisios based o sample data It imperative that we take the risk of samplig error ito accout whe we iterpret sample
Standard Deviations for Normal Sampling Distributions are: For proportions For means _
 Sectio 9.2 Cofidece Itervals for Proportios We will lear to use a sample to say somethig about the world at large. This process (statistical iferece) is based o our uderstadig of samplig models, ad will
AY Term 2 Mock Examination
 AY 206-7 Term 2 Mock Examiatio Date / Start Time Course Group Istructor 24 March 207 / 2 PM to 3:00 PM QF302 Ivestmet ad Fiacial Data Aalysis G Christopher Tig INSTRUCTIONS TO STUDENTS. This mock examiatio
18.S096 Problem Set 5 Fall 2013 Volatility Modeling Due Date: 10/29/2013
 18.S096 Problem Set 5 Fall 2013 Volatility Modelig Due Date: 10/29/2013 1. Sample Estimators of Diffusio Process Volatility ad Drift Let {X t } be the price of a fiacial security that follows a geometric
A random variable is a variable whose value is a numerical outcome of a random phenomenon.
 The Practice of Statistics, d ed ates, Moore, ad Stares Itroductio We are ofte more iterested i the umber of times a give outcome ca occur tha i the possible outcomes themselves For example, if we toss
1. Suppose X is a variable that follows the normal distribution with known standard deviation σ = 0.3 but unknown mean µ.
 Chapter 9 Exercises Suppose X is a variable that follows the ormal distributio with kow stadard deviatio σ = 03 but ukow mea µ (a) Costruct a 95% cofidece iterval for µ if a radom sample of = 6 observatios
Sampling Distributions & Estimators
 API-209 TF Sessio 2 Teddy Svoroos September 18, 2015 Samplig Distributios & Estimators I. Estimators The Importace of Samplig Radomly Three Properties of Estimators 1. Ubiased 2. Cosistet 3. Efficiet I
NOTES ON ESTIMATION AND CONFIDENCE INTERVALS. 1. Estimation
 NOTES ON ESTIMATION AND CONFIDENCE INTERVALS MICHAEL N. KATEHAKIS 1. Estimatio Estimatio is a brach of statistics that deals with estimatig the values of parameters of a uderlyig distributio based o observed/empirical
Confidence Intervals Introduction
 Cofidece Itervals Itroductio A poit estimate provides o iformatio about the precisio ad reliability of estimatio. For example, the sample mea X is a poit estimate of the populatio mea μ but because of
Math 124: Lecture for Week 10 of 17
 What we will do toight 1 Lecture for of 17 David Meredith Departmet of Mathematics Sa Fracisco State Uiversity 2 3 4 April 8, 2008 5 6 II Take the midterm. At the ed aswer the followig questio: To be revealed
4.5 Generalized likelihood ratio test
 4.5 Geeralized likelihood ratio test A assumptio that is used i the Athlete Biological Passport is that haemoglobi varies equally i all athletes. We wish to test this assumptio o a sample of k athletes.
5. Best Unbiased Estimators
 Best Ubiased Estimators http://www.math.uah.edu/stat/poit/ubiased.xhtml 1 of 7 7/16/2009 6:13 AM Virtual Laboratories > 7. Poit Estimatio > 1 2 3 4 5 6 5. Best Ubiased Estimators Basic Theory Cosider agai
Introduction to Statistical Inference
 Itroductio to Statistical Iferece Fial Review CH1: Picturig Distributios With Graphs 1. Types of Variable -Categorical -Quatitative 2. Represetatios of Distributios (a) Categorical -Pie Chart -Bar Graph
SCHOOL OF ACCOUNTING AND BUSINESS BSc. (APPLIED ACCOUNTING) GENERAL / SPECIAL DEGREE PROGRAMME
 GENERAL / SPECIAL DEGREE PROGRAMME") All Right Reserved No. of Pages - 10 No of Questios - 08 SCHOOL OF ACCOUNTING AND BUSINESS BSc. (APPLIED ACCOUNTING) GENERAL / SPECIAL DEGREE PROGRAMME YEAR I SEMESTER I (Group B) END SEMESTER EXAMINATION
All Right Reserved No. of Pages - 10 No of Questios - 08 SCHOOL OF ACCOUNTING AND BUSINESS BSc. (APPLIED ACCOUNTING) GENERAL / SPECIAL DEGREE PROGRAMME YEAR I SEMESTER I (Group B) END SEMESTER EXAMINATION
Lecture 5 Point Es/mator and Sampling Distribu/on
 Lecture 5 Poit Es/mator ad Samplig Distribu/o Fall 03 Prof. Yao Xie, yao.xie@isye.gatech.edu H. Milto Stewart School of Idustrial Systems & Egieerig Georgia Tech Road map Poit Es/ma/o Cofidece Iterval
Quantitative Analysis
 EduPristie www.edupristie.com Modellig Mea Variace Skewess Kurtosis Mea: X i = i Mode: Value that occurs most frequetly Media: Midpoit of data arraged i ascedig/ descedig order s Avg. of squared deviatios
Parametric Density Estimation: Maximum Likelihood Estimation
 Parametric Desity stimatio: Maimum Likelihood stimatio C6 Today Itroductio to desity estimatio Maimum Likelihood stimatio Itroducto Bayesia Decisio Theory i previous lectures tells us how to desig a optimal
Sampling Distributions and Estimation
 Cotets 40 Samplig Distributios ad Estimatio 40.1 Samplig Distributios 40. Iterval Estimatio for the Variace 13 Learig outcomes You will lear about the distributios which are created whe a populatio is
Research Article The Probability That a Measurement Falls within a Range of n Standard Deviations from an Estimate of the Mean
 Iteratioal Scholarly Research Network ISRN Applied Mathematics Volume 0, Article ID 70806, 8 pages doi:0.540/0/70806 Research Article The Probability That a Measuremet Falls withi a Rage of Stadard Deviatios
Lecture 4: Parameter Estimation and Confidence Intervals. GENOME 560 Doug Fowler, GS
 Lecture 4: Parameter Estimatio ad Cofidece Itervals GENOME 560 Doug Fowler, GS (dfowler@uw.edu) 1 Review: Probability Distributios Discrete: Biomial distributio Hypergeometric distributio Poisso distributio
CAPITAL ASSET PRICING MODEL
 CAPITAL ASSET PRICING MODEL RETURN. Retur i respect of a observatio is give by the followig formula R = (P P 0 ) + D P 0 Where R = Retur from the ivestmet durig this period P 0 = Curret market price P
Online appendices from Counterparty Risk and Credit Value Adjustment a continuing challenge for global financial markets by Jon Gregory
 Olie appedices from Couterparty Risk ad Credit Value Adjustmet a APPENDIX 8A: Formulas for EE, PFE ad EPE for a ormal distributio Cosider a ormal distributio with mea (expected future value) ad stadard
Lecture 5: Sampling Distribution
 Lecture 5: Samplig Distributio Readigs: Sectios 5.5, 5.6 Itroductio Parameter: describes populatio Statistic: describes the sample; samplig variability Samplig distributio of a statistic: A probability
 Twitter: @Owe134866 www.mathsfreeresourcelibrary.com Prior Kowledge Check 1) State whether each variable is qualitative or quatitative: a) Car colour Qualitative b) Miles travelled by a cyclist c) Favourite
BIOSTATS 540 Fall Estimation Page 1 of 72. Unit 6. Estimation. Use at least twelve observations in constructing a confidence interval
 BIOSTATS 540 Fall 015 6. Estimatio Page 1 of 7 Uit 6. Estimatio Use at least twelve observatios i costructig a cofidece iterval - Gerald va Belle What is the mea of the blood pressures of all the studets
CHAPTER 8 CONFIDENCE INTERVALS
 CHAPTER 8 CONFIDENCE INTERVALS Cofidece Itervals is our first topic i iferetial statistics. I this chapter, we use sample data to estimate a ukow populatio parameter: either populatio mea (µ) or populatio
x satisfying all regularity conditions. Then
 AMS570.01 Practice Midterm Exam Sprig, 018 Name: ID: Sigature: Istructio: This is a close book exam. You are allowed oe-page 8x11 formula sheet (-sided). No cellphoe or calculator or computer is allowed.
14.30 Introduction to Statistical Methods in Economics Spring 2009
 MIT OpeCourseWare http://ocwmitedu 430 Itroductio to Statistical Methods i Ecoomics Sprig 009 For iformatio about citig these materials or our Terms of Use, visit: http://ocwmitedu/terms 430 Itroductio
2. Find the annual percentage yield (APY), to the nearest hundredth of a %, for an account with an APR of 12% with daily compounding.
, to the nearest hundredth of a %, for an account with an APR of 12% with daily compounding.") 1. Suppose that you ivest $4,000 i a accout that ears iterest at a of 5%, compouded mothly, for 58 years. `Show the formula that you would use to determie the accumulated balace, ad determie the accumulated
1. Suppose that you ivest $4,000 i a accout that ears iterest at a of 5%, compouded mothly, for 58 years. `Show the formula that you would use to determie the accumulated balace, ad determie the accumulated
Outline. Populations. Defs: A (finite) population is a (finite) set P of elements e. A variable is a function v : P IR. Population and Characteristics
 population is a (finite) set P of elements e. A variable is a function v : P IR. Population and Characteristics") Outlie Populatio Characteristics Types of Samples Sample Characterstics Sample Aalogue Estimatio Populatios Defs: A (fiite) populatio is a (fiite) set P of elemets e. A variable is a fuctio v : P IR. Examples
Outlie Populatio Characteristics Types of Samples Sample Characterstics Sample Aalogue Estimatio Populatios Defs: A (fiite) populatio is a (fiite) set P of elemets e. A variable is a fuctio v : P IR. Examples
Exam 1 Spring 2015 Statistics for Applications 3/5/2015
 8.443 Exam Sprig 05 Statistics for Applicatios 3/5/05. Log Normal Distributio: A radom variable X follows a Logormal(θ, σ ) distributio if l(x) follows a Normal(θ, σ ) distributio. For the ormal radom
Chapter 10 Statistical Inference About Means and Proportions With Two Populations. Learning objectives
 Chater 0 Statistical Iferece About Meas ad Proortios With Two Poulatios Slide Learig objectives. Uderstad ifereces About the Differece Betwee Two Poulatio Meas: σ ad σ Kow. Uderstad Ifereces About the
Chpt 5. Discrete Probability Distributions. 5-3 Mean, Variance, Standard Deviation, and Expectation
 Chpt 5 Discrete Probability Distributios 5-3 Mea, Variace, Stadard Deviatio, ad Expectatio 1/23 Homework p252 Applyig the Cocepts Exercises p253 1-19 2/23 Objective Fid the mea, variace, stadard deviatio,
The Idea of a Confidence Interval
 AP Statistics Ch. 8 Notes Estimatig with Cofidece I the last chapter, we aswered questios about what samples should look like assumig that we kew the true values of populatio parameters (like μ, σ, ad
5 Statistical Inference
 5 Statistical Iferece 5.1 Trasitio from Probability Theory to Statistical Iferece 1. We have ow more or less fiished the probability sectio of the course - we ow tur attetio to statistical iferece. I statistical
MATH : EXAM 2 REVIEW. A = P 1 + AP R ) ny
 ny") MATH 1030-008: EXAM 2 REVIEW Origially, I was havig you all memorize the basic compoud iterest formula. I ow wat you to memorize the geeral compoud iterest formula. This formula, whe = 1, is the same as
MATH 1030-008: EXAM 2 REVIEW Origially, I was havig you all memorize the basic compoud iterest formula. I ow wat you to memorize the geeral compoud iterest formula. This formula, whe = 1, is the same as
Non-Inferiority Logrank Tests
 Chapter 706 No-Iferiority Lograk Tests Itroductio This module computes the sample size ad power for o-iferiority tests uder the assumptio of proportioal hazards. Accrual time ad follow-up time are icluded
1 Estimating the uncertainty attached to a sample mean: s 2 vs.
 Political Sciece 100a/200a Fall 2001 Cofidece itervals ad hypothesis testig, Part I 1 1 Estimatig the ucertaity attached to a sample mea: s 2 vs. σ 2 Recall the problem of descriptive iferece: We wat to
Combining imperfect data, and an introduction to data assimilation Ross Bannister, NCEO, September 2010
 Combiig imperfect data, ad a itroductio to data assimilatio Ross Baister, NCEO, September 00 rbaister@readigacuk The probability desity fuctio (PDF prob that x lies betwee x ad x + dx p (x restrictio o
DOWLING COLLEGE: School of Education Department of Educational Administration, Leadership, and Technology
 1. Doe 2. Doe 3. Doe 4. Doe DOWLING COLLEGE: School of Educatio Departmet of Educatioal Admiistratio, Leadership, ad Techology 5. Calculate meas ad stadard deviatios for per capita icome ad total reveues
These characteristics are expressed in terms of statistical properties which are estimated from the sample data.
 0. Key Statistical Measures of Data Four pricipal features which characterize a set of observatios o a radom variable are: (i) the cetral tedecy or the value aroud which all other values are buched, (ii)
Bayes Estimator for Coefficient of Variation and Inverse Coefficient of Variation for the Normal Distribution
 Iteratioal Joural of Statistics ad Systems ISSN 0973-675 Volume, Number 4 (07, pp. 7-73 Research Idia Publicatios http://www.ripublicatio.com Bayes Estimator for Coefficiet of Variatio ad Iverse Coefficiet
FOUNDATION ACTED COURSE (FAC)
") FOUNDATION ACTED COURSE (FAC) What is the Foudatio ActEd Course (FAC)? FAC is desiged to help studets improve their mathematical skills i preparatio for the Core Techical subjects. It is a referece documet
FOUNDATION ACTED COURSE (FAC) What is the Foudatio ActEd Course (FAC)? FAC is desiged to help studets improve their mathematical skills i preparatio for the Core Techical subjects. It is a referece documet
SOLUTION QUANTITATIVE TOOLS IN BUSINESS NOV 2011
 SOLUTION QUANTITATIVE TOOLS IN BUSINESS NOV 0 (i) Populatio: Collectio of all possible idividual uits (persos, objects, experimetal outcome whose characteristics are to be studied) Sample: A part of populatio
Question 1 (4 points) A restaurant manager is developing a clientele profile. Some of the information for the profile follows:
 A restaurant manager is developing a clientele profile. Some of the information for the profile follows:") QUATITATIVE METHODS Marti Huard September 30, 004 Mid-term Eam Part SOLUTIOS You are to awer all quetio o the eam quetioaire itelf. For quetio requirig calculatio, a complete olutio i epected i the pace
QUATITATIVE METHODS Marti Huard September 30, 004 Mid-term Eam Part SOLUTIOS You are to awer all quetio o the eam quetioaire itelf. For quetio requirig calculatio, a complete olutio i epected i the pace
Dr. Maddah ENMG 624 Financial Eng g I 03/22/06. Chapter 6 Mean-Variance Portfolio Theory
 Dr Maddah ENMG 64 Fiacial Eg g I 03//06 Chapter 6 Mea-Variace Portfolio Theory Sigle Period Ivestmets Typically, i a ivestmet the iitial outlay of capital is kow but the retur is ucertai A sigle-period
Elementary Statistics and Inference. Elementary Statistics and Inference. Chapter 20 Chance Errors in Sampling (cont.) 22S:025 or 7P:025.
 22S:025 or 7P:025.") Elemetary Statistics ad Iferece 22S:025 or 7P:025 Lecture 27 1 Elemetary Statistics ad Iferece 22S:025 or 7P:025 Chapter 20 2 D. The Correctio Factor - (page 367) 1992 Presidetial Campaig Texas 12.5 x
Elemetary Statistics ad Iferece 22S:025 or 7P:025 Lecture 27 1 Elemetary Statistics ad Iferece 22S:025 or 7P:025 Chapter 20 2 D. The Correctio Factor - (page 367) 1992 Presidetial Campaig Texas 12.5 x
Quantitative Analysis
 EduPristie FRM I \ Quatitative Aalysis EduPristie www.edupristie.com Momets distributio Samplig Testig Correlatio & Regressio Estimatio Simulatio Modellig EduPristie FRM I \ Quatitative Aalysis 2 Momets
Monetary Economics: Problem Set #5 Solutions
 Moetary Ecoomics oblem Set #5 Moetary Ecoomics: oblem Set #5 Solutios This problem set is marked out of 1 poits. The weight give to each part is idicated below. Please cotact me asap if you have ay questios.
NPTEL DEPARTMENT OF INDUSTRIAL AND MANAGEMENT ENGINEERING IIT KANPUR QUANTITATIVE FINANCE END-TERM EXAMINATION (2015 JULY-AUG ONLINE COURSE)
") NPTEL DEPARTMENT OF INDUSTRIAL AND MANAGEMENT ENGINEERING IIT KANPUR QUANTITATIVE FINANCE END-TERM EXAMINATION (2015 JULY-AUG ONLINE COURSE) READ THE INSTRUCTIONS VERY CAREFULLY 1) Time duratio is 2 hours
NPTEL DEPARTMENT OF INDUSTRIAL AND MANAGEMENT ENGINEERING IIT KANPUR QUANTITATIVE FINANCE END-TERM EXAMINATION (2015 JULY-AUG ONLINE COURSE) READ THE INSTRUCTIONS VERY CAREFULLY 1) Time duratio is 2 hours
I. Measures of Central Tendency: -Allow us to summarize an entire data set with a single value (the midpoint).
.") I. Meaure of Cetral Tedecy: -Allow u to ummarize a etire data et with a igle value (the midpoit.. Mode : The value (core that occur mot ofte i a data et. -Mo x Sample mode -Mo Populatio mode. Media : the
I. Meaure of Cetral Tedecy: -Allow u to ummarize a etire data et with a igle value (the midpoit.. Mode : The value (core that occur mot ofte i a data et. -Mo x Sample mode -Mo Populatio mode. Media : the
APPLIED STATISTICS Complementary Course of BSc Mathematics - IV Semester CUCBCSS Admn onwards Question Bank
 Prepared by: Prof (Dr) K.X. Joseph Multiple Choice Questios 1. Statistical populatio may cosists of (a) a ifiite umber of items (b) a fiite umber of items (c) either of (a) or (b) Module - I (d) oe of
A Bayesian perspective on estimating mean, variance, and standard-deviation from data
 Brigham Youg Uiversity BYU ScholarsArchive All Faculty Publicatios 006--05 A Bayesia perspective o estimatig mea, variace, ad stadard-deviatio from data Travis E. Oliphat Follow this ad additioal works
TUSCULUM COLLEGE. Group Number:
 The Guardia Life Isurace Compay of America, New York, NY 10004 Group Number: 00498351 TUSCULUM COLLEGE Here you'll fid iformatio about your followig employee beefit(s). Be sure to review the eclosed -
Topic 14: Maximum Likelihood Estimation
 Toic 4: November, 009 As before, we begi with a samle X = (X,, X of radom variables chose accordig to oe of a family of robabilities P θ I additio, f(x θ, x = (x,, x will be used to deote the desity fuctio
ECON 5350 Class Notes Maximum Likelihood Estimation
 ECON 5350 Class Notes Maximum Likelihood Estimatio 1 Maximum Likelihood Estimatio Example #1. Cosider the radom sample {X 1 = 0.5, X 2 = 2.0, X 3 = 10.0, X 4 = 1.5, X 5 = 7.0} geerated from a expoetial
ISBN Copyright 2015 The Continental Press, Inc.
 TABLE OF CONTENTS Itroductio 3 Format of Books 4 Suggestios for Use 7 Aotated Aswer Key ad Extesio Activities 9 Reproducible Tool Set 183 ISBN 978-0-8454-7897-4 Copyright 2015 The Cotietal Press, Ic. Exceptig
An Empirical Study of the Behaviour of the Sample Kurtosis in Samples from Symmetric Stable Distributions
 A Empirical Study of the Behaviour of the Sample Kurtosis i Samples from Symmetric Stable Distributios J. Marti va Zyl Departmet of Actuarial Sciece ad Mathematical Statistics, Uiversity of the Free State,
Maximum Empirical Likelihood Estimation (MELE)
") Maximum Empirical Likelihood Estimatio (MELE Natha Smooha Abstract Estimatio of Stadard Liear Model - Maximum Empirical Likelihood Estimator: Combiatio of the idea of imum likelihood method of momets,
Maximum Empirical Likelihood Estimatio (MELE Natha Smooha Abstract Estimatio of Stadard Liear Model - Maximum Empirical Likelihood Estimator: Combiatio of the idea of imum likelihood method of momets,
STRAND: FINANCE. Unit 3 Loans and Mortgages TEXT. Contents. Section. 3.1 Annual Percentage Rate (APR) 3.2 APR for Repayment of Loans
 3.2 APR for Repayment of Loans") CMM Subject Support Strad: FINANCE Uit 3 Loas ad Mortgages: Text m e p STRAND: FINANCE Uit 3 Loas ad Mortgages TEXT Cotets Sectio 3.1 Aual Percetage Rate (APR) 3.2 APR for Repaymet of Loas 3.3 Credit Purchases
CMM Subject Support Strad: FINANCE Uit 3 Loas ad Mortgages: Text m e p STRAND: FINANCE Uit 3 Loas ad Mortgages TEXT Cotets Sectio 3.1 Aual Percetage Rate (APR) 3.2 APR for Repaymet of Loas 3.3 Credit Purchases
r i = a i + b i f b i = Cov[r i, f] The only parameters to be estimated for this model are a i 's, b i 's, σe 2 i
![r i = a i + b i f b i = Cov[r i, f] The only parameters to be estimated for this model are a i 's, b i 's, σe 2 i](/thumbs/77/75183590.jpg "r i = a i + b i f b i = Cov[r i, f] The only parameters to be estimated for this model are a i 's, b i 's, σe 2 i") The iformatio required by the mea-variace approach is substatial whe the umber of assets is large; there are mea values, variaces, ad )/2 covariaces - a total of 2 + )/2 parameters. Sigle-factor model:
The iformatio required by the mea-variace approach is substatial whe the umber of assets is large; there are mea values, variaces, ad )/2 covariaces - a total of 2 + )/2 parameters. Sigle-factor model:
CHAPTER 2 PRICING OF BONDS
 CHAPTER 2 PRICING OF BONDS CHAPTER SUARY This chapter will focus o the time value of moey ad how to calculate the price of a bod. Whe pricig a bod it is ecessary to estimate the expected cash flows ad
STAT 135 Solutions to Homework 3: 30 points
 STAT 35 Solutios to Homework 3: 30 poits Sprig 205 The objective of this Problem Set is to study the Stei Pheomeo 955. Suppose that θ θ, θ 2,..., θ cosists of ukow parameters, with 3. We wish to estimate
CHANGE POINT TREND ANALYSIS OF GNI PER CAPITA IN SELECTED EUROPEAN COUNTRIES AND ISRAEL
 The 9 th Iteratioal Days of Statistics ad Ecoomics, Prague, September 0-, 05 CHANGE POINT TREND ANALYSIS OF GNI PER CAPITA IN SELECTED EUROPEAN COUNTRIES AND ISRAEL Lia Alatawa Yossi Yacu Gregory Gurevich
Unbiased estimators Estimators
 19 Ubiased estimators I Chapter 17 we saw that a dataset ca be modeled as a realizatio of a radom sample from a probability distributio ad that quatities of iterest correspod to features of the model distributio.
Department of Mathematics, S.R.K.R. Engineering College, Bhimavaram, A.P., India 2
 Skewess Corrected Cotrol charts for two Iverted Models R. Subba Rao* 1, Pushpa Latha Mamidi 2, M.S. Ravi Kumar 3 1 Departmet of Mathematics, S.R.K.R. Egieerig College, Bhimavaram, A.P., Idia 2 Departmet
Osborne Books Update. Financial Statements of Limited Companies Tutorial
 Osbore Books Update Fiacial Statemets of Limited Compaies Tutorial Website update otes September 2018 2 f i a c i a l s t a t e m e t s o f l i m i t e d c o m p a i e s I N T R O D U C T I O N The followig
Data Analysis and Statistical Methods Statistics 651
 Data Aalyi ad Statitical Method Statitic 65 http://www.tat.tamu.edu/~uhaii/teachig.html Lecture 9 Suhaii Subba Rao Tetig o far We have looked at oe ample hypothei tet of the form H 0 : µ = µ 0 agait H
= α e ; x 0. Such a random variable is said to have an exponential distribution, with parameter α. [Here, view X as time-to-failure.
 1 Homewor 1 AERE 573 Fall 018 DUE 8/9 (W) Name ***NOTE: A wor MUST be placed directly beeath the associated part of a give problem.*** PROBEM 1. (5pts) [Boo 3 rd ed. 1.1 / 4 th ed. 1.13] et ~Uiform[0,].
Confidence Intervals based on Absolute Deviation for Population Mean of a Positively Skewed Distribution
 Iteratioal Joural of Computatioal ad Theoretical Statistics ISSN (220-59) It. J. Comp. Theo. Stat. 5, No. (May-208) http://dx.doi.org/0.2785/ijcts/0500 Cofidece Itervals based o Absolute Deviatio for Populatio
Current Year Income Assessment Form 2017/18
 Curret Year Icome Assessmet Form 2017/18 Persoal details Your Customer Referece Number Your Customer Referece Number Name Name Date of birth Address / / Date of birth / / Address Postcode Postcode If you
MA Lesson 11 Section 1.3. Solving Applied Problems with Linear Equations of one Variable
 MA 15200 Lesso 11 Sectio 1. I Solvig Applied Problems with Liear Equatios of oe Variable 1. After readig the problem, let a variable represet the ukow (or oe of the ukows). Represet ay other ukow usig
FINM6900 Finance Theory How Is Asymmetric Information Reflected in Asset Prices?
 FINM6900 Fiace Theory How Is Asymmetric Iformatio Reflected i Asset Prices? February 3, 2012 Referece S. Grossma, O the Efficiecy of Competitive Stock Markets where Traders Have Diverse iformatio, Joural
Models of Asset Pricing
 4 Appedix 1 to Chapter Models of Asset Pricig I this appedix, we first examie why diversificatio, the holdig of may risky assets i a portfolio, reduces the overall risk a ivestor faces. The we will see