continuous rv Note for a legitimate pdf, we have f (x) 0 and f (x)dx = 1. For a continuous rv, P(X = c) = c f (x)dx = 0, hence
|
|
|
- Sarah Tiffany Dorsey
- 5 years ago
- Views:
Transcription
1 continuous rv Let X be a continuous rv. Then a probability distribution or probability density function (pdf) of X is a function f(x) such that for any two numbers a and b with a b, P(a X b) = b a f (x)dx. Note for a legitimate pdf, we have f (x) 0 and f (x)dx = 1. For a continuous rv, P(X = c) = c c f (x)dx = 0, hence P(a X b) = P(a X < b) = P(a < X b) = P(a < X < b).
2 example: The waiting time X (in minutes) for bus route 4 has the pdf given by { 1 f (x) = 10, 0 x 10 0, otherwise Then the probability of waiting between 2 and 5 minutes is P(2 X 5) = dx = x 10 x=5 x=2 = 0.3 A continuous rv is said to have a uniform distribution on the interval [A, B] if the pdf of X is f (x; A, B) = { 1 B A, A x B 0, otherwise.
3 The cdf F(x) of a continuous rv X is defined for any number x by F (x) = P(X x) = x f (y)dy. use cdf to compute probabilities: P(X < a) = F (a), P(X > a) = 1 F (a), P(a X b) = F (b) F (a) Obtain f(x) from F(x): proposition: If X is a continuous rv with pdf f(x) and cdf F(x), then at every x at which the derivative F (x) exists, F (x) = f (x).
4 example For X with a uniform density f (x) = 1 F (x) = x f (y)dy = x 1 A B A dy = Hence F (x) = Obtain f (x) from F (x): F (x) = d dx ( x A B A ) = 1 f (x) = 0, otherwise. B A B A, A x B, we have y B A y=x y=a = x A B A, A x B. 0, x < A x A B A, A x B 1, x B = f (x), fora < x < B, and
5 exercise Suppose a continuous rv X has pdf f (x) = 2x, 0 x 1. Find F (x), P(X 0.8), P(0.5 X 1).
6 percentiles Let p be a number between 0 and 1. The (100p)th percentile of the distribution of a continuous rv, denoted by η(p), is defined by p = F [η(p)] = η(p) f (y)dy. The median of a continuous distribution, denoted by µ, is the 50th percentile.
7 expected value The expected value or the mean of a continuous rv X with pdf f (x) is µ x = E(X ) = xf (x)dx. Expected value of E(h(X )) : E(h(X )) = h(x)f (x)dx. The variance of a continuous rv X with pdf f(x) and mean µ is σx 2 = V (X ) = E(X µ)2 = (x µ)2 f (x)dx = E(X 2 ) µ 2 = x 2 f (x)dx µ 2. The standard deviation of X is σ x = V (X ).
8 example The pdf of weekly gravel sales X was { 3 f (x) = 2 (1 x 2 ), 0 x 1 0, otherwise. E(X ) = xf (x)dx = 1 0 x 3 2 (1 x 2 )dx = ( x2 2 x4 4 ) x=1 x=0 = (x x 3 )dx = E(X 2 ) = x 2 f (x)dx = 1 0 x (1 x 2 )dx = (x 2 x 4 )dx = 1 5. so V (X ) = 1 5 ( 3 8 )2 = and σ X = =
9 The normal distribution A continuous rv is said to have a normal distribution with parameters µ and σ where < µ < and σ > 0, if the pdf of X is f (x; µ, σ) = 1 2πσ e (x µ)2 /2σ 2, < x <. Often abbreviated as X N(µ, σ 2 ). X has a standard normal distribution if µ = 0 and σ = 1, often denoted Z N(0, 1). f (z) = 1 2π e z2 /2. its cdf is Φ(z) = P(Z z) = z f (t)dt
10 Find probabilities How to find P(a X b) if X N(µ, σ 2 ). First, find P(a Z b). examples: P(Z 1.25) = Φ(1.25) = P(Z > 1.25) = 1 P(z 1.25) = = P( 0.38 Z 1.25) = Φ(1.25) Φ( 0.38) = = percentiles of the standard normal distribution: 99th percentile, z= th percentile, z=1.64 or 1.65 or th percentile, z=1.28 z α notation: z 0.01 = 2.33, z 0.05 = 1.645, z = α : right tail probability
11 Nonstandard normal distribution X N(µ, σ 2 ). Z = X µ σ. P(a X b) = P( a µ σ Z b µ σ ). e.g. adult female heights in North America have approximately a normal distribution with a µ = 65 inches and σ = 3.5 inches. The probability that X falls below 70 inches: P(X < 70) = P(Z ) = P(Z < 1.43) = The probability that X falls between 60 and 70 inches is = i.e., about 85% of the heights are between 60 and 70 inches. P(60 < X < 70) = P( Z ) = P( 1.43 < Z < 1.43) = P(Z < 1.43) P(Z < 1.43) = =
12 exercise Suppose the test scores follow a normal distribution with µ = 82 and σ = 4. Find the probabilities that a randomly selected test score a). falls below 88, b). falls below 75, c). falls between 75 and 88.
13 answer: P(X < 88) = P(Z < ) = P(Z < 1.50) = , P(X < 75) = P(Z < 1.75) = P(75 < X < 88) = =
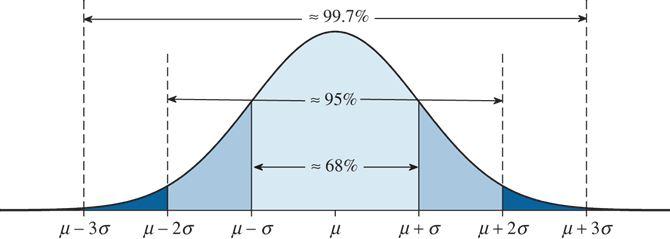
14 empirical rule If X N(µ, σ 2 ), then P(X is within one standard deviation of its mean) = P(µ σ X µ + σ) = P( µ σ µ σ Z µ+σ µ σ ) = P( 1.00 Z 1.00) = Φ(1.00) Φ( 1.00) = , similarly, we can find P(X is within 2 standard deviations of its mean) = P(X is within 3 standard deviations of its mean) = Empirical rule: If the population distribution of a random variable is (approximately) normal, then 1. Roughly 68% of the values are within 1 SD of its mean. 2. Roughly 95% of the values are within 2 SDs of its mean. 3. Roughly 99.7% of the values are within 3 SDs of its mean.
15 example Adult female heights in North America have approximately a normal distribution with a µ = 65 inches and σ = 3.5 inches, then About 68% of the heights fall between [ , ] = [61.5, 68.5] inches. About 95% of the heights fall between [ , ] = [58, 72] inches. And almost all the heights fall between [ , ] = [54.5, 75.5] inches.
16
17 percentiles of normal distribution the 2.5th percentile of Z is z=-1.96, i.e., 2.5% of the values are below z = Example continued: find a height such that 2.5% of the heights are below this values, i.e., find the 2.5th percentile. x = µ + zσ = = 58.1 inches. Final exam scores have approximately normal distribution with mean 76 and standard deviation 8. Find the 75th percentile of test scores, i.e., 75% of the test scores are below this value.
18 note P(Z < 0.67) = 0.75, so x = µ + zσ = =
19 Approximate the binomial distribution X binomial(n, p), if np 10, n(1 p) 10, then approximately X N(np, np(1 p)). So P(X a) P(Z a np ) np(1 p) better approximated by P(Z a+0.5 np ). np(1 p) Example: X binomial(50, 0.25). P(X 10) P(Z ) = P(Z 0.65) = The exact probability is
20 The exponential distribution X is said to have an exponential distribution with parameter (λ) > 0 if the pdf of X is { λe f (x; λ) = λx, x 0 0, otherwise E(X ) = 1 λ, V (X ) = 1, F (x) = 1 e λx, x 0. λ 2 example: The response time X (in seconds) at a computer terminal has an exponential distribution with λ = 0.2. The probability that the response time is at most 10 seconds is P(X 10) = F (10) = 1 e = The probability that the response time is between 5 and 10 sec is P(5 X 10) = e 0.2x dx = e 0.2x x=10 x=5 =
21 gamma distribution A continuous rv X is said to have a gamma distribution if its pdf is given by f (x; α, β) = 1 β α Γ(α) x α 1 e x/β, x 0, α > 0, β > 0. Gamma function: For α > 0, Γ(α) = 0 x α 1 e x dx. Note for α > 1, Γ(α) = (α 1)Γ(α 1). For any positive integer, Γ(n) = (n 1)! E(X ) = αβ, V (X ) = αβ 2.
22 the chi-squared distribution The chi-squared distribution is a gamma distribution with α = ν 2 and β = 2. 1 f (x; ν) = ν 2 ν/2 Γ( ν )x 2 1 e x/2, x 0. 2 ν : degrees of freedom. X χ 2 (ν).
23 1. Suppose the proportion of gas sold at a gas station in a week, X, has pdf given by f (x) = 6x(1 x), 0 x 1. a. Find P(X 0.5), the probability that it sells at least half of its gas in a week. b. Find E(X 2 ). 2. If adult female heights are normally distributed, find the probability that the height of a randomly selected women is within 0.67 SDs of the mean. 3. It is known that 30% of vehicles on I 81 are trucks. If you take a random sample of 50 vehicles, use the normal approximation to find the probability that at most 15 of them are trucks.
24 Solutions 1. a. P(X > 0.5) = x(1 x)dx = (6x 6x 2 )dx = (3x 2 2x 3 ) = 0.5. b. E(X 2 ) = 1 0 x 2 6x(1 x)dx = ( 6x4 4 6x5 5 ) 1 0 = P(µ 0.67σ X µ σ) = P( 0.67 Z 0.67) = = P(X 15) = P(Z ) = P(Z < ) = The exact binomial probability is R code to get the cumulative binomial probability P(X 15): > pbinom(15,50,0.3)
The Normal Distribution
 The Normal Distribution The normal distribution plays a central role in probability theory and in statistics. It is often used as a model for the distribution of continuous random variables. Like all models,
Lecture 23. STAT 225 Introduction to Probability Models April 4, Whitney Huang Purdue University. Normal approximation to Binomial
 Lecture 23 STAT 225 Introduction to Probability Models April 4, 2014 approximation Whitney Huang Purdue University 23.1 Agenda 1 approximation 2 approximation 23.2 Characteristics of the random variable:
What was in the last lecture?
 What was in the last lecture? Normal distribution A continuous rv with bell-shaped density curve The pdf is given by f(x) = 1 2πσ e (x µ)2 2σ 2, < x < If X N(µ, σ 2 ), E(X) = µ and V (X) = σ 2 Standard
Normal Distribution. Notes. Normal Distribution. Standard Normal. Sums of Normal Random Variables. Normal. approximation of Binomial.
 Lecture 21,22, 23 Text: A Course in Probability by Weiss 8.5 STAT 225 Introduction to Probability Models March 31, 2014 Standard Sums of Whitney Huang Purdue University 21,22, 23.1 Agenda 1 2 Standard
UQ, STAT2201, 2017, Lectures 3 and 4 Unit 3 Probability Distributions.
 UQ, STAT2201, 2017, Lectures 3 and 4 Unit 3 Probability Distributions. Random Variables 2 A random variable X is a numerical (integer, real, complex, vector etc.) summary of the outcome of the random experiment.
Normal Distribution. Definition A continuous rv X is said to have a normal distribution with. the pdf of X is
 Normal Distribution Normal Distribution Definition A continuous rv X is said to have a normal distribution with parameter µ and σ (µ and σ 2 ), where < µ < and σ > 0, if the pdf of X is f (x; µ, σ) = 1
Homework: Due Wed, Feb 20 th. Chapter 8, # 60a + 62a (count together as 1), 74, 82
, 74, 82") Announcements: Week 5 quiz begins at 4pm today and ends at 3pm on Wed If you take more than 20 minutes to complete your quiz, you will only receive partial credit. (It doesn t cut you off.) Today: Sections
Announcements: Week 5 quiz begins at 4pm today and ends at 3pm on Wed If you take more than 20 minutes to complete your quiz, you will only receive partial credit. (It doesn t cut you off.) Today: Sections
Random Variables Handout. Xavier Vilà
 Random Variables Handout Xavier Vilà Course 2004-2005 1 Discrete Random Variables. 1.1 Introduction 1.1.1 Definition of Random Variable A random variable X is a function that maps each possible outcome
Statistical Tables Compiled by Alan J. Terry
 Statistical Tables Compiled by Alan J. Terry School of Science and Sport University of the West of Scotland Paisley, Scotland Contents Table 1: Cumulative binomial probabilities Page 1 Table 2: Cumulative
Homework: Due Wed, Nov 3 rd Chapter 8, # 48a, 55c and 56 (count as 1), 67a
, 67a") Homework: Due Wed, Nov 3 rd Chapter 8, # 48a, 55c and 56 (count as 1), 67a Announcements: There are some office hour changes for Nov 5, 8, 9 on website Week 5 quiz begins after class today and ends at
Homework: Due Wed, Nov 3 rd Chapter 8, # 48a, 55c and 56 (count as 1), 67a Announcements: There are some office hour changes for Nov 5, 8, 9 on website Week 5 quiz begins after class today and ends at
ECE 340 Probabilistic Methods in Engineering M/W 3-4:15. Lecture 10: Continuous RV Families. Prof. Vince Calhoun
 ECE 340 Probabilistic Methods in Engineering M/W 3-4:15 Lecture 10: Continuous RV Families Prof. Vince Calhoun 1 Reading This class: Section 4.4-4.5 Next class: Section 4.6-4.7 2 Homework 3.9, 3.49, 4.5,
The Normal Distribution. (Ch 4.3)
") 5 The Normal Distribution (Ch 4.3) The Normal Distribution The normal distribution is probably the most important distribution in all of probability and statistics. Many populations have distributions
5 The Normal Distribution (Ch 4.3) The Normal Distribution The normal distribution is probably the most important distribution in all of probability and statistics. Many populations have distributions
Statistics for Business and Economics
 Statistics for Business and Economics Chapter 5 Continuous Random Variables and Probability Distributions Ch. 5-1 Probability Distributions Probability Distributions Ch. 4 Discrete Continuous Ch. 5 Probability
Probability Theory and Simulation Methods. April 9th, Lecture 20: Special distributions
 April 9th, 2018 Lecture 20: Special distributions Week 1 Chapter 1: Axioms of probability Week 2 Chapter 3: Conditional probability and independence Week 4 Chapters 4, 6: Random variables Week 9 Chapter
. 13. The maximum error (margin of error) of the estimate for μ (based on known σ) is:
 of the estimate for μ (based on known σ) is:") Statistics Sample Exam 3 Solution Chapters 6 & 7: Normal Probability Distributions & Estimates 1. What percent of normally distributed data value lie within 2 standard deviations to either side of the
Statistics Sample Exam 3 Solution Chapters 6 & 7: Normal Probability Distributions & Estimates 1. What percent of normally distributed data value lie within 2 standard deviations to either side of the
Density curves. (James Madison University) February 4, / 20
 February 4, / 20") Density curves Figure 6.2 p 230. A density curve is always on or above the horizontal axis, and has area exactly 1 underneath it. A density curve describes the overall pattern of a distribution. Example
Density curves Figure 6.2 p 230. A density curve is always on or above the horizontal axis, and has area exactly 1 underneath it. A density curve describes the overall pattern of a distribution. Example
STATISTICS and PROBABILITY
 Introduction to Statistics Atatürk University STATISTICS and PROBABILITY LECTURE: PROBABILITY DISTRIBUTIONS Prof. Dr. İrfan KAYMAZ Atatürk University Engineering Faculty Department of Mechanical Engineering
Version A. Problem 1. Let X be the continuous random variable defined by the following pdf: 1 x/2 when 0 x 2, f(x) = 0 otherwise.
 = 0 otherwise.") Math 224 Q Exam 3A Fall 217 Tues Dec 12 Version A Problem 1. Let X be the continuous random variable defined by the following pdf: { 1 x/2 when x 2, f(x) otherwise. (a) Compute the mean µ E[X]. E[X] x
Math 224 Q Exam 3A Fall 217 Tues Dec 12 Version A Problem 1. Let X be the continuous random variable defined by the following pdf: { 1 x/2 when x 2, f(x) otherwise. (a) Compute the mean µ E[X]. E[X] x
Commonly Used Distributions
 Chapter 4: Commonly Used Distributions 1 Introduction Statistical inference involves drawing a sample from a population and analyzing the sample data to learn about the population. We often have some knowledge
Topic 6 - Continuous Distributions I. Discrete RVs. Probability Density. Continuous RVs. Background Reading. Recall the discrete distributions
 Topic 6 - Continuous Distributions I Discrete RVs Recall the discrete distributions STAT 511 Professor Bruce Craig Binomial - X= number of successes (x =, 1,...,n) Geometric - X= number of trials (x =,...)
ME3620. Theory of Engineering Experimentation. Spring Chapter III. Random Variables and Probability Distributions.
 ME3620 Theory of Engineering Experimentation Chapter III. Random Variables and Probability Distributions Chapter III 1 3.2 Random Variables In an experiment, a measurement is usually denoted by a variable
Central Limit Theorem, Joint Distributions Spring 2018
 Central Limit Theorem, Joint Distributions 18.5 Spring 218.5.4.3.2.1-4 -3-2 -1 1 2 3 4 Exam next Wednesday Exam 1 on Wednesday March 7, regular room and time. Designed for 1 hour. You will have the full
NORMAL RANDOM VARIABLES (Normal or gaussian distribution)
") NORMAL RANDOM VARIABLES (Normal or gaussian distribution) Many variables, as pregnancy lengths, foot sizes etc.. exhibit a normal distribution. The shape of the distribution is a symmetric bell shape.
NORMAL RANDOM VARIABLES (Normal or gaussian distribution) Many variables, as pregnancy lengths, foot sizes etc.. exhibit a normal distribution. The shape of the distribution is a symmetric bell shape.
Chapter 8. Variables. Copyright 2004 Brooks/Cole, a division of Thomson Learning, Inc.
 Chapter 8 Random Variables Copyright 2004 Brooks/Cole, a division of Thomson Learning, Inc. 8.1 What is a Random Variable? Random Variable: assigns a number to each outcome of a random circumstance, or,
Business Statistics 41000: Probability 3
 Business Statistics 41000: Probability 3 Drew D. Creal University of Chicago, Booth School of Business February 7 and 8, 2014 1 Class information Drew D. Creal Email: dcreal@chicagobooth.edu Office: 404
No, because np = 100(0.02) = 2. The value of np must be greater than or equal to 5 to use the normal approximation.
 = 2. The value of np must be greater than or equal to 5 to use the normal approximation.") 1) If n 100 and p 0.02 in a binomial experiment, does this satisfy the rule for a normal approximation? Why or why not? No, because np 100(0.02) 2. The value of np must be greater than or equal to 5 to
1) If n 100 and p 0.02 in a binomial experiment, does this satisfy the rule for a normal approximation? Why or why not? No, because np 100(0.02) 2. The value of np must be greater than or equal to 5 to
INDIAN INSTITUTE OF SCIENCE STOCHASTIC HYDROLOGY. Lecture -5 Course Instructor : Prof. P. P. MUJUMDAR Department of Civil Engg., IISc.
 INDIAN INSTITUTE OF SCIENCE STOCHASTIC HYDROLOGY Lecture -5 Course Instructor : Prof. P. P. MUJUMDAR Department of Civil Engg., IISc. Summary of the previous lecture Moments of a distribubon Measures of
Chapter 4 Continuous Random Variables and Probability Distributions
 Chapter 4 Continuous Random Variables and Probability Distributions Part 2: More on Continuous Random Variables Section 4.5 Continuous Uniform Distribution Section 4.6 Normal Distribution 1 / 27 Continuous
Random variables. Contents
 Random variables Contents 1 Random Variable 2 1.1 Discrete Random Variable............................ 3 1.2 Continuous Random Variable........................... 5 1.3 Measures of Location...............................
2. The sum of all the probabilities in the sample space must add up to 1
 Continuous Random Variables and Continuous Probability Distributions Continuous Random Variable: A variable X that can take values on an interval; key feature remember is that the values of the variable
Continuous Distributions
 Quantitative Methods 2013 Continuous Distributions 1 The most important probability distribution in statistics is the normal distribution. Carl Friedrich Gauss (1777 1855) Normal curve A normal distribution
Chapter 5. Continuous Random Variables and Probability Distributions. 5.1 Continuous Random Variables
 Chapter 5 Continuous Random Variables and Probability Distributions 5.1 Continuous Random Variables 1 2CHAPTER 5. CONTINUOUS RANDOM VARIABLES AND PROBABILITY DISTRIBUTIONS Probability Distributions Probability
IEOR 165 Lecture 1 Probability Review
 IEOR 165 Lecture 1 Probability Review 1 Definitions in Probability and Their Consequences 1.1 Defining Probability A probability space (Ω, F, P) consists of three elements: A sample space Ω is the set
Chapter 4 Continuous Random Variables and Probability Distributions
 Chapter 4 Continuous Random Variables and Probability Distributions Part 2: More on Continuous Random Variables Section 4.5 Continuous Uniform Distribution Section 4.6 Normal Distribution 1 / 28 One more
ECON 214 Elements of Statistics for Economists 2016/2017
 ECON 214 Elements of Statistics for Economists 2016/2017 Topic The Normal Distribution Lecturer: Dr. Bernardin Senadza, Dept. of Economics bsenadza@ug.edu.gh College of Education School of Continuing and
Lecture 12. Some Useful Continuous Distributions. The most important continuous probability distribution in entire field of statistics.
 ENM 207 Lecture 12 Some Useful Continuous Distributions Normal Distribution The most important continuous probability distribution in entire field of statistics. Its graph, called the normal curve, is
Review for Final Exam Spring 2014 Jeremy Orloff and Jonathan Bloom
 Review for Final Exam 18.05 Spring 2014 Jeremy Orloff and Jonathan Bloom THANK YOU!!!! JON!! PETER!! RUTHI!! ERIKA!! ALL OF YOU!!!! Probability Counting Sets Inclusion-exclusion principle Rule of product
Lecture Stat 302 Introduction to Probability - Slides 15
 Lecture Stat 30 Introduction to Probability - Slides 15 AD March 010 AD () March 010 1 / 18 Continuous Random Variable Let X a (real-valued) continuous r.v.. It is characterized by its pdf f : R! [0, )
Sampling Distribution
 MAT 2379 (Spring 2012) Sampling Distribution Definition : Let X 1,..., X n be a collection of random variables. We say that they are identically distributed if they have a common distribution. Definition
4-1. Chapter 4. Commonly Used Distributions by The McGraw-Hill Companies, Inc. All rights reserved.
 4-1 Chapter 4 Commonly Used Distributions 2014 by The Companies, Inc. All rights reserved. Section 4.1: The Bernoulli Distribution 4-2 We use the Bernoulli distribution when we have an experiment which
Two hours. To be supplied by the Examinations Office: Mathematical Formula Tables and Statistical Tables THE UNIVERSITY OF MANCHESTER
 Two hours MATH20802 To be supplied by the Examinations Office: Mathematical Formula Tables and Statistical Tables THE UNIVERSITY OF MANCHESTER STATISTICAL METHODS Answer any FOUR of the SIX questions.
6. Continous Distributions
 6. Continous Distributions Chris Piech and Mehran Sahami May 17 So far, all random variables we have seen have been discrete. In all the cases we have seen in CS19 this meant that our RVs could only take
Exam 2 Spring 2015 Statistics for Applications 4/9/2015
 18.443 Exam 2 Spring 2015 Statistics for Applications 4/9/2015 1. True or False (and state why). (a). The significance level of a statistical test is not equal to the probability that the null hypothesis
Chapter 3 Common Families of Distributions. Definition 3.4.1: A family of pmfs or pdfs is called exponential family if it can be expressed as
 Lecture 0 on BST 63: Statistical Theory I Kui Zhang, 09/9/008 Review for the previous lecture Definition: Several continuous distributions, including uniform, gamma, normal, Beta, Cauchy, double exponential
Department of Quantitative Methods & Information Systems. Business Statistics. Chapter 6 Normal Probability Distribution QMIS 120. Dr.
 Department of Quantitative Methods & Information Systems Business Statistics Chapter 6 Normal Probability Distribution QMIS 120 Dr. Mohammad Zainal Chapter Goals After completing this chapter, you should
INSTITUTE AND FACULTY OF ACTUARIES. Curriculum 2019 SPECIMEN EXAMINATION
 INSTITUTE AND FACULTY OF ACTUARIES Curriculum 2019 SPECIMEN EXAMINATION Subject CS1A Actuarial Statistics Time allowed: Three hours and fifteen minutes INSTRUCTIONS TO THE CANDIDATE 1. Enter all the candidate
χ 2 distributions and confidence intervals for population variance
 χ 2 distributions and confidence intervals for population variance Let Z be a standard Normal random variable, i.e., Z N(0, 1). Define Y = Z 2. Y is a non-negative random variable. Its distribution is
In a binomial experiment of n trials, where p = probability of success and q = probability of failure. mean variance standard deviation
 Name In a binomial experiment of n trials, where p = probability of success and q = probability of failure mean variance standard deviation µ = n p σ = n p q σ = n p q Notation X ~ B(n, p) The probability
MATH 3200 Exam 3 Dr. Syring
 . Suppose n eligible voters are polled (randomly sampled) from a population of size N. The poll asks voters whether they support or do not support increasing local taxes to fund public parks. Let M be
AMS7: WEEK 4. CLASS 3
 AMS7: WEEK 4. CLASS 3 Sampling distributions and estimators. Central Limit Theorem Normal Approximation to the Binomial Distribution Friday April 24th, 2015 Sampling distributions and estimators REMEMBER:
Chapter 6 Continuous Probability Distributions. Learning objectives
 Chapter 6 Continuous s Slide 1 Learning objectives 1. Understand continuous probability distributions 2. Understand Uniform distribution 3. Understand Normal distribution 3.1. Understand Standard normal
ECO220Y Continuous Probability Distributions: Normal Readings: Chapter 9, section 9.10
 ECO220Y Continuous Probability Distributions: Normal Readings: Chapter 9, section 9.10 Fall 2011 Lecture 8 Part 2 (Fall 2011) Probability Distributions Lecture 8 Part 2 1 / 23 Normal Density Function f
2011 Pearson Education, Inc
 Statistics for Business and Economics Chapter 4 Random Variables & Probability Distributions Content 1. Two Types of Random Variables 2. Probability Distributions for Discrete Random Variables 3. The Binomial
Tutorial 11: Limit Theorems. Baoxiang Wang & Yihan Zhang bxwang, April 10, 2017
 Tutorial 11: Limit Theorems Baoxiang Wang & Yihan Zhang bxwang, yhzhang@cse.cuhk.edu.hk April 10, 2017 1 Outline The Central Limit Theorem (CLT) Normal Approximation Based on CLT De Moivre-Laplace Approximation
4.3 Normal distribution
 43 Normal distribution Prof Tesler Math 186 Winter 216 Prof Tesler 43 Normal distribution Math 186 / Winter 216 1 / 4 Normal distribution aka Bell curve and Gaussian distribution The normal distribution
Chapter 7 1. Random Variables
 Chapter 7 1 Random Variables random variable numerical variable whose value depends on the outcome of a chance experiment - discrete if its possible values are isolated points on a number line - continuous
14.30 Introduction to Statistical Methods in Economics Spring 2009
 MIT OpenCourseWare http://ocw.mit.edu 4.30 Introduction to Statistical Methods in Economics Spring 2009 For information about citing these materials or our Terms of Use, visit: http://ocw.mit.edu/terms.
Chapter 6: Random Variables and Probability Distributions
 Chapter 6: Random Variables and Distributions These notes reflect material from our text, Statistics, Learning from Data, First Edition, by Roxy Pec, published by CENGAGE Learning, 2015. Random variables
Normal distribution Approximating binomial distribution by normal 2.10 Central Limit Theorem
 1.1.2 Normal distribution 1.1.3 Approimating binomial distribution by normal 2.1 Central Limit Theorem Prof. Tesler Math 283 Fall 216 Prof. Tesler 1.1.2-3, 2.1 Normal distribution Math 283 / Fall 216 1
Discrete Random Variables
 Discrete Random Variables In this chapter, we introduce a new concept that of a random variable or RV. A random variable is a model to help us describe the state of the world around us. Roughly, a RV can
Statistics and Their Distributions
 Statistics and Their Distributions Deriving Sampling Distributions Example A certain system consists of two identical components. The life time of each component is supposed to have an expentional distribution
Normal distribution. We say that a random variable X follows the normal distribution if the probability density function of X is given by
 Normal distribution The normal distribution is the most important distribution. It describes well the distribution of random variables that arise in practice, such as the heights or weights of people,
STAT Chapter 5: Continuous Distributions. Probability distributions are used a bit differently for continuous r.v. s than for discrete r.v. s.
 STAT 515 -- Chapter 5: Continuous Distributions Probability distributions are used a bit differently for continuous r.v. s than for discrete r.v. s. Continuous distributions typically are represented by
MAS187/AEF258. University of Newcastle upon Tyne
 MAS187/AEF258 University of Newcastle upon Tyne 2005-6 Contents 1 Collecting and Presenting Data 5 1.1 Introduction...................................... 5 1.1.1 Examples...................................
Review. Binomial random variable
 Review Discrete RV s: prob y fctn: p(x) = Pr(X = x) cdf: F(x) = Pr(X x) E(X) = x x p(x) SD(X) = E { (X - E X) 2 } Binomial(n,p): no. successes in n indep. trials where Pr(success) = p in each trial If
Chapter 6. The Normal Probability Distributions
 Chapter 6 The Normal Probability Distributions 1 Chapter 6 Overview Introduction 6-1 Normal Probability Distributions 6-2 The Standard Normal Distribution 6-3 Applications of the Normal Distribution 6-5
Problems from 9th edition of Probability and Statistical Inference by Hogg, Tanis and Zimmerman:
 Math 224 Fall 207 Homework 5 Drew Armstrong Problems from 9th edition of Probability and Statistical Inference by Hogg, Tanis and Zimmerman: Section 3., Exercises 3, 0. Section 3.3, Exercises 2, 3, 0,.
Homework Assignments
 Homework Assignments Week 1 (p. 57) #4.1, 4., 4.3 Week (pp 58 6) #4.5, 4.6, 4.8(a), 4.13, 4.0, 4.6(b), 4.8, 4.31, 4.34 Week 3 (pp 15 19) #1.9, 1.1, 1.13, 1.15, 1.18 (pp 9 31) #.,.6,.9 Week 4 (pp 36 37)
**BEGINNING OF EXAMINATION** A random sample of five observations from a population is:
 **BEGINNING OF EXAMINATION** 1. You are given: (i) A random sample of five observations from a population is: 0.2 0.7 0.9 1.1 1.3 (ii) You use the Kolmogorov-Smirnov test for testing the null hypothesis,
Expectations. Definition Let X be a discrete rv with set of possible values D and pmf p(x). The expected value or mean value of X, denoted by E(X ) or
. The expected value or mean value of X, denoted by E(X ) or") Definition Let X be a discrete rv with set of possible values D and pmf p(x). The expected value or mean value of X, denoted by E(X ) or µ X, is E(X ) = µ X = x D x p(x) Definition Let X be a discrete
Definition Let X be a discrete rv with set of possible values D and pmf p(x). The expected value or mean value of X, denoted by E(X ) or µ X, is E(X ) = µ X = x D x p(x) Definition Let X be a discrete
STA258H5. Al Nosedal and Alison Weir. Winter Al Nosedal and Alison Weir STA258H5 Winter / 41
 STA258H5 Al Nosedal and Alison Weir Winter 2017 Al Nosedal and Alison Weir STA258H5 Winter 2017 1 / 41 NORMAL APPROXIMATION TO THE BINOMIAL DISTRIBUTION. Al Nosedal and Alison Weir STA258H5 Winter 2017
Continuous random variables
 Continuous random variables probability density function (f(x)) the probability distribution function of a continuous random variable (analogous to the probability mass function for a discrete random variable),
Probability Distributions for Discrete RV
 Probability Distributions for Discrete RV Probability Distributions for Discrete RV Definition The probability distribution or probability mass function (pmf) of a discrete rv is defined for every number
X = x p(x) 1 / 6 1 / 6 1 / 6 1 / 6 1 / 6 1 / 6. x = 1 x = 2 x = 3 x = 4 x = 5 x = 6 values for the random variable X
 1 / 6 1 / 6 1 / 6 1 / 6 1 / 6 1 / 6. x = 1 x = 2 x = 3 x = 4 x = 5 x = 6 values for the random variable X") Calculus II MAT 146 Integration Applications: Probability Calculating probabilities for discrete cases typically involves comparing the number of ways a chosen event can occur to the number of ways all
Calculus II MAT 146 Integration Applications: Probability Calculating probabilities for discrete cases typically involves comparing the number of ways a chosen event can occur to the number of ways all
Normal Probability Distributions
 Normal Probability Distributions Properties of Normal Distributions The most important probability distribution in statistics is the normal distribution. Normal curve A normal distribution is a continuous
MATH 104 CHAPTER 5 page 1 NORMAL DISTRIBUTION
 MATH 104 CHAPTER 5 page 1 NORMAL DISTRIBUTION We have examined discrete random variables, those random variables for which we can list the possible values. We will now look at continuous random variables.
Unit 5: Sampling Distributions of Statistics
 Unit 5: Sampling Distributions of Statistics Statistics 571: Statistical Methods Ramón V. León 6/12/2004 Unit 5 - Stat 571 - Ramon V. Leon 1 Definitions and Key Concepts A sample statistic used to estimate
Unit 5: Sampling Distributions of Statistics
 Unit 5: Sampling Distributions of Statistics Statistics 571: Statistical Methods Ramón V. León 6/12/2004 Unit 5 - Stat 571 - Ramon V. Leon 1 Definitions and Key Concepts A sample statistic used to estimate
Chapter 2. Random variables. 2.3 Expectation
 Random processes - Chapter 2. Random variables 1 Random processes Chapter 2. Random variables 2.3 Expectation 2.3 Expectation Random processes - Chapter 2. Random variables 2 Among the parameters representing
Lecture 6: Chapter 6
 Lecture 6: Chapter 6 C C Moxley UAB Mathematics 3 October 16 6.1 Continuous Probability Distributions Last week, we discussed the binomial probability distribution, which was discrete. 6.1 Continuous Probability
SYSM 6304 Risk and Decision Analysis Lecture 2: Fitting Distributions to Data
 SYSM 6304 Risk and Decision Analysis Lecture 2: Fitting Distributions to Data M. Vidyasagar Cecil & Ida Green Chair The University of Texas at Dallas Email: M.Vidyasagar@utdallas.edu September 5, 2015
Bus 701: Advanced Statistics. Harald Schmidbauer
 Bus 701: Advanced Statistics Harald Schmidbauer c Harald Schmidbauer & Angi Rösch, 2008 About These Slides The present slides are not self-contained; they need to be explained and discussed. They contain
Chapter 4: Commonly Used Distributions. Statistics for Engineers and Scientists Fourth Edition William Navidi
 Chapter 4: Commonly Used Distributions Statistics for Engineers and Scientists Fourth Edition William Navidi 2014 by Education. This is proprietary material solely for authorized instructor use. Not authorized
Section Introduction to Normal Distributions
 Section 6.1-6.2 Introduction to Normal Distributions 2012 Pearson Education, Inc. All rights reserved. 1 of 105 Section 6.1-6.2 Objectives Interpret graphs of normal probability distributions Find areas
Central limit theorems
 Chapter 6 Central limit theorems 6.1 Overview Recall that a random variable Z is said to have a standard normal distribution, denoted by N(0, 1), if it has a continuous distribution with density φ(z) =
Introduction to Business Statistics QM 120 Chapter 6
 DEPARTMENT OF QUANTITATIVE METHODS & INFORMATION SYSTEMS Introduction to Business Statistics QM 120 Chapter 6 Spring 2008 Chapter 6: Continuous Probability Distribution 2 When a RV x is discrete, we can
Lecture 10: Point Estimation
 Lecture 10: Point Estimation MSU-STT-351-Sum-17B (P. Vellaisamy: MSU-STT-351-Sum-17B) Probability & Statistics for Engineers 1 / 31 Basic Concepts of Point Estimation A point estimate of a parameter θ,
King Saud University Academic Year (G) College of Sciences Academic Year (H) Solutions of Homework 1 : Selected problems P exam
 College of Sciences Academic Year (H) Solutions of Homework 1 : Selected problems P exam") King Saud University Academic Year (G) 6 7 College of Sciences Academic Year (H) 437 438 Mathematics Department Bachelor AFM: M. Eddahbi Solutions of Homework : Selected problems P exam Problem : An auto
King Saud University Academic Year (G) 6 7 College of Sciences Academic Year (H) 437 438 Mathematics Department Bachelor AFM: M. Eddahbi Solutions of Homework : Selected problems P exam Problem : An auto
Random Variable: Definition
 Random Variables Random Variable: Definition A Random Variable is a numerical description of the outcome of an experiment Experiment Roll a die 10 times Inspect a shipment of 100 parts Open a gas station
Statistics and Probability
 Statistics and Probability Continuous RVs (Normal); Confidence Intervals Outline Continuous random variables Normal distribution CLT Point estimation Confidence intervals http://www.isrec.isb-sib.ch/~darlene/geneve/
Engineering Statistics ECIV 2305
 Engineering Statistics ECIV 2305 Section 5.3 Approximating Distributions with the Normal Distribution Introduction A very useful property of the normal distribution is that it provides good approximations
STAT 111 Recitation 4
 STAT 111 Recitation 4 Linjun Zhang http://stat.wharton.upenn.edu/~linjunz/ September 29, 2017 Misc. Mid-term exam time: 6-8 pm, Wednesday, Oct. 11 The mid-term break is Oct. 5-8 The next recitation class
Week 7. Texas A& M University. Department of Mathematics Texas A& M University, College Station Section 3.2, 3.3 and 3.4
 Week 7 Oğuz Gezmiş Texas A& M University Department of Mathematics Texas A& M University, College Station Section 3.2, 3.3 and 3.4 Oğuz Gezmiş (TAMU) Topics in Contemporary Mathematics II Week7 1 / 19
Probability Distributions II
 Probability Distributions II Summer 2017 Summer Institutes 63 Multinomial Distribution - Motivation Suppose we modified assumption (1) of the binomial distribution to allow for more than two outcomes.
Statistics for Business and Economics: Random Variables:Continuous
 Statistics for Business and Economics: Random Variables:Continuous STT 315: Section 107 Acknowledgement: I d like to thank Dr. Ashoke Sinha for allowing me to use and edit the slides. Murray Bourne (interactive
Business Statistics 41000: Probability 4
 Business Statistics 41000: Probability 4 Drew D. Creal University of Chicago, Booth School of Business February 14 and 15, 2014 1 Class information Drew D. Creal Email: dcreal@chicagobooth.edu Office:
VI. Continuous Probability Distributions
 VI. Continuous Proaility Distriutions A. An Important Definition (reminder) Continuous Random Variale - a numerical description of the outcome of an experiment whose outcome can assume any numerical value
CHAPTERS 5 & 6: CONTINUOUS RANDOM VARIABLES
 CHAPTERS 5 & 6: CONTINUOUS RANDOM VARIABLES DISCRETE RANDOM VARIABLE: Variable can take on only certain specified values. There are gaps between possible data values. Values may be counting numbers or
Reliability and Risk Analysis. Survival and Reliability Function
 Reliability and Risk Analysis Survival function We consider a non-negative random variable X which indicates the waiting time for the risk event (eg failure of the monitored equipment, etc.). The probability
The Bernoulli distribution
 This work is licensed under a Creative Commons Attribution-NonCommercial-ShareAlike License. Your use of this material constitutes acceptance of that license and the conditions of use of materials on this