Pzena Funds Annual report For the year ended 30 June 2018
|
|
|
- Bertram O’Neal’
- 5 years ago
- Views:
Transcription
1 Annual report For the year ended These financial reports cover the following Pzena Funds: Pzena Emerging Markets Value Fund ARSN Pzena Global Expanded Value Fund ARSN
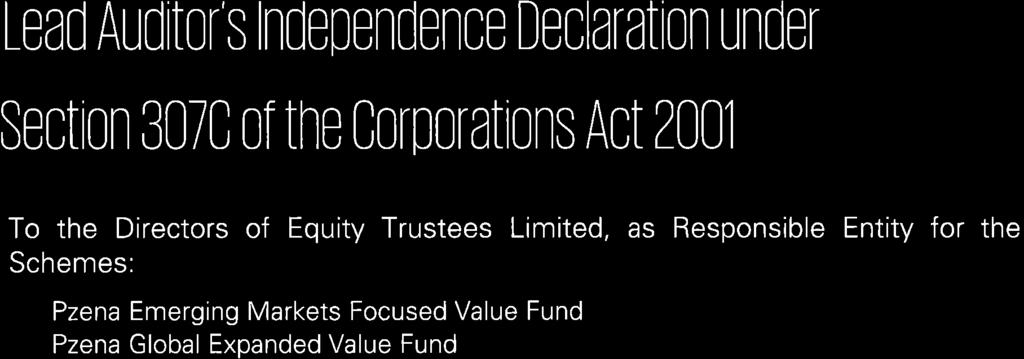
2 Annual report For the year ended Contents Directors report Auditor s independence declaration Statements of comprehensive income Statements of financial position Statements of changes in equity Statements of cash flows Directors declaration Independent auditor s report to the unit holders of Pzena Funds This annual report covers the following Funds as individual entities: Pzena Emerging Markets Value Fund Pzena Global Expanded Value Fund The Responsible Entity of the Pzena Funds is Equity Trustees Limited (ABN ) (AFSL ). The Responsible Entity s registered office is: Level 1, 575 Bourke Street Melbourne, VIC 3000.
3 Directors report Directors report The directors of Equity Trustees Limited, the Responsible Entity of the Pzena Funds (the Funds ), present their report together with the financial statements of the Funds for the year ended. Pzena Emerging Markets Value Fund Pzena Global Expanded Value Fund The Funds are collectively known as Pzena Funds. Principal activities The principal activity of each Fund is to invest in accordance with the investment objective and guidelines as set out in the Funds current Product Disclosure Statements and their Constitutions. The Funds did not have any employees during the year. The Pzena Global Expanded Value Fund has remained dormant since it was constituted on 10 June There were no significant changes in the nature of the Funds activities during the year. The various service providers for the Funds are detailed below: Service Responsible Entity Investment Manager Custodian and Administrator Statuory Auditor Providers Equity Trustees Limited Pzena Investment Management, LLC The Northern Trust Company KPMG Directors The following persons held office as directors of Equity Trustees Limited during or since the end of the reporting period and up to the date of this report: Philip D Gentry Chairman Harvey H Kalman Ian C Westley Michael J O Brien (appointed 11 July ) Review and results of operations During the year, the Funds continued to invest funds in accordance with their Product Disclosure Statement and the provisions of the Funds Constitutions. The Funds performance and the Funds benchmark returns for the year ended were as follows: Fund name Benchmark Net return (net of fees) Benchmark return Pzena Emerging Markets Value Fund MSCI Emerging Market Index 6.17% 12.33% Pzena Global Expanded Value Fund MSCI All Country World Index
4 Directors report Directors report The performance of the Funds, as represented by the results of its operations, were as follows: Pzena Emerging Markets Value Fund Pzena Global Expanded Value Fund to to Operating profit/(loss) for the year ($ 000) 6,403 13, Distributions paid and payable ($ 000) 7,627 2, Distributions (cents per unit) Significant changes in the state of affairs In the opinion of the directors, there were no significant changes in the state of affairs of the Funds that occurred during the financial year. Matters subsequent to the end of the reporting year Michael J O Brien was appointed as a director of Equity Trustees Limited on 11 July. No other matter or circumstance has arisen since that has significantly affected, or may have a significant effect on: (i) (ii) (iii) the operations of the Funds in future financial years; the results of those operations in future financial years; or the state of affairs of the Funds in future financial years. Likely developments and expected results of operations The Funds will continue to be managed in accordance with the investment objectives and guidelines as set out in the Product Disclosure Statement and the provisions of the Funds Constitutions. The results of the Funds operations will be affected by a number of factors, including the performance of investment markets in which the Funds invest. Investment performance is not guaranteed and future returns may differ from past returns. As investment conditions change over time, past returns should not be used to predict future returns. Indemnification and insurance of officers No insurance premiums are paid for out of the assets of the Funds in regards to insurance cover provided to the officers of Equity Trustees Limited. So long as the officers of Equity Trustees Limited act in accordance with the Funds Constitutions and the Law, the officers remain indemnified out of the assets of the Funds against losses incurred while acting on behalf of the Funds. Indemnification of auditor The auditor of the Funds is in no way indemnified out of the assets of the Funds. Fees paid to and interests held in the Funds by the Responsible Entity and its associates Fees paid to the Responsible Entity and its associates out of the Funds property during the year are disclosed in Note 14 to the financial statements. No fees were paid out of the Funds property to the directors of the Responsible Entity during the year. The number of interests in the Funds held by the Responsible Entity or its associates as at the end of the financial year are disclosed in Note 14 to the financial statements. Interests in the Funds The movement in units on issue in the Funds during the year is disclosed in Note 7 to the financial statements. The value of the Funds assets and liabilities is disclosed in the statements of financial position and derived using the basis set out in Note 2 to the financial statements. -2-
5 Directors report Directors report Environmental regulation The operations of the Funds are not subject to any particular or significant environmental regulations under Commonwealth, State or Territory law. Rounding of amounts to the nearest thousand dollars Amounts in the Directors report have been rounded to the nearest thousand dollars in accordance with ASIC Corporations (Rounding in Financial/Directors Reports) Instrument 2016/191, unless otherwise indicated. Financial statements presentation The Funds are entities of the kind referred to in ASIC Corporations (Related Scheme Reports) Instrument 2015/839 and in accordance with that Instrument, Funds with a common Responsible Entity (or related Responsible Entities) can include their financial reports in adjacent columns in a single set of financial reports. Auditor s independence declaration A copy of the Auditor s independence declaration as required under section 307C of the Corporations Act 2001 is set out on page 4. This report is made in accordance with a resolution of the directors of Equity Trustees Limited through a delegated authority given by the Equity Trustees Limited s Board. Philip D Gentry Chairman Melbourne 26 September -3-

6
7 Statements of comprehensive income For the year ended Statements of comprehensive income Pzena Emerging Markets Value Fund to Pzena Global Expanded Value Fund to Note $ 000 $ 000 $ 000 $ 000 Investment income Interest income Dividend income 3,096 1, Net foreign exchange gain/(loss) (39) Net gains/(losses) on financial instruments held at fair value through profit or loss 5 4,443 12, Total investment income/ (loss) 7,500 14, Expenses Management fees Custody and administration fees Transaction costs Other expenses Total expenses 1, Operating profit/(loss) for the year 6,403 13, Finance costs attributable to unit holders Distributions to unit holders 8 (7,627) (2,526) - - (Increase)/decrease in net assets attributable to unit holders 7 1,224 (11,076) - - Profit/(loss) for the year Other comprehensive income Total comprehensive income for the year The above statements of comprehensive income should be read in conjunction with the accompanying notes. -5-
8 Statements of financial position As at Statements of financial position Pzena Emerging Markets Value Fund Pzena Global Expanded Value Fund As at As at Note $ 000 $ 000 $ 000 $ 000 Assets Cash and cash equivalents 9 3,167 3, Receivables Due from brokers receivable for securities sold Financial assets held at fair value through profit or loss 6 107,738 96, Total assets 111,671 99, Liabilities Distributions payable 8 7,627 2, Payables Due to brokers payable for securities purchased Total liabilities (excluding net assets attributable to unit holders) 8,029 2, Net assets attributable to unit holders - liability 7 103,642 97, The above statements of financial position should be read in conjunction with the accompanying notes. -6-
9 Statements of changes in equity For the year ended Statements of changes in equity Pzena Emerging Markets Value Fund Pzena Global Expanded Value Fund to to $ 000 $ 000 $ 000 $ 000 Total equity at the beginning of the financial year Profit/(loss) for the year Other comprehensive income Total comprehensive income Transactions with owners in their capacity as owners Total equity at the end of the financial year Under Australian Accounting Standards, net assets attributable to unit holders are classified as a liability rather than equity. As a result, there was no equity at the start or end of the financial year. The above statements of changes in equity should be read in conjunction with the accompanying notes. -7-
10 Statements of cash flows For the year ended Statements of cash flows Pzena Emerging Markets Value Fund to Pzena Global Expanded Value Fund to Note $ 000 $ 000 $ 000 $ 000 Cash flows from operating activities Proceeds from sale of financial instruments held at fair value through profit or loss 14,782 8, Purchase of financial instruments held at fair value through profit or loss (21,725) (92,074) - - Net foreign gain/(loss) (41) Dividends received 2, Management fees paid (582) (200) - - Custody and administration fees paid (143) (20) - - Transaction costs paid (68) (213) - - Other expenses paid (55) (27) - - Net cash inflow/(outflow) from operating activities 10(a) (4,836) (82,990) - - Cash flows from financing activities Proceeds from applications by unit holders 5,000 86, Payments for redemptions by unitholders Distributions paid to unit holders Net cash inflow/(outflow) from financing activities 5,000 86, Net increase/(decrease) in cash and cash equivalents 164 3, Cash and cash equivalents at the beginning of the year 3, Effects of foreign currency exchange rate changes on cash and cash equivalents 2 (9) - - Cash and cash equivalents at the end of the year 9 3,167 3, Non-cash operating and financing activities 10(b) 2, The above statements of cash flows should be read in conjunction with the accompanying notes. -8-
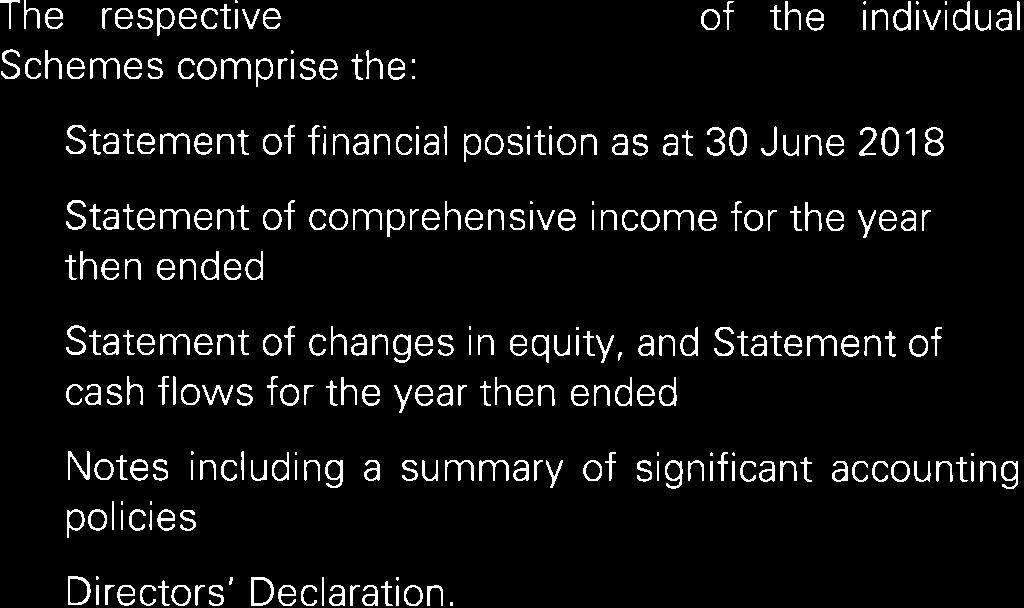
11 For the year ended Contents 1 General information 2 Summary of significant accounting policies 3 Financial risk management 4 Fair value measurement 5 Net gains/(losses) on financial instruments held at fair value through profit or loss 6 Financial assets held at fair value through profit or loss 7 Net assets attributable to unit holders 8 Distributions to unit holders 9 Cash and cash equivalents 10 Reconciliation of profit/(loss) to net cash inflow/(outflow) from operating activities 11 Receivables 12 Payables 13 Remuneration of auditor 14 Related party transactions 15 Events occurring after the reporting period 16 Contingent assets and liabilities and commitments -9-
12 For the year ended 1 General information These financial statements cover the below Funds, (the Funds ) as individual entities. The Funds are Australian registered managed investment schemes which were constituted on the dates in the below table and will terminate in accordance with the provisions of the Funds Constitutions or by Law. Pzena Emerging Markets Value Fund 10 June 2016 Pzena Global Expanded Value Fund 10 June 2016 The Responsible Entity of the Funds is Equity Trustees Limited (ABN ) (AFSL ) (the Responsible Entity ). The Responsible Entity s registered office is Level 1, 575 Bourke Street, Melbourne, VIC The financial statements are presented in the Australian currency unless otherwise noted. The principal activity of each Fund is to invest in accordance with the investment objective and guidelines as set out in the Funds current Product Disclosure Statements and their Constitutions. The financial statements were authorised for issue by the directors on the date the Directors declaration was signed. The directors of the Responsible Entity have the power to amend and reissue the financial statements. 2 Summary of significant accounting policies The principal accounting policies applied in the preparation of these financial statements are set out below. These policies have been consistently applied to all years presented, unless otherwise stated in the following text. (a) Basis of preparation These general purpose financial statements have been prepared in accordance with Australian Accounting Standards and Interpretations issued by the Australian Accounting Standards Board (AASB) and the Corporations Act 2001 in Australia. The Funds are for-profit entities for the purpose of preparing the financial statements. The financial statements are prepared on the basis of fair value measurement of assets and liabilities except where otherwise stated. The statements of financial position are presented on a liquidity basis. Assets and liabilities are presented in decreasing order of liquidity and do not distinguish between current and non-current. All balances are expected to be recovered or settled within 12 months, except for investments in financial assets and liabilities and net assets attributable to unit holders. The Funds manage financial assets at fair value through profit or loss based on the economic circumstances at any given point in time, as well as to meet any liquidity requirements. As such, it is expected that a portion of the portfolio will be realised within 12 months, however, an estimate of that amount cannot be determined as at the reporting date. In the case of net assets attributable to unit holders, the units are redeemable on demand at the unit holder s option. However, holders of these instruments typically retain them for the medium to long term. As such, the amount expected to be settled within 12 months cannot be reliably determined. (i) Compliance with International Financial Reporting Standards (IFRS) The financial statements of the Funds also comply with IFRS as issued by the International Accounting Standards Board (IASB). (ii) New and amended standards adopted by the Funds There are no standards, interpretations or amendments to existing standards that are effective for the first time for the financial year beginning 1 July that have a material impact on the amounts recognised in the prior periods or will affect the current or future periods. (iii) New standards and interpretations not yet adopted Certain new accounting standards and interpretations have been published that are not mandatory for the reporting period and have not been early adopted by the Funds. The directors assessment of the impact of these new standards (to the extent relevant to the Funds) and interpretations are set out below: -10-
13 For the year ended 2 Summary of significant accounting policies (a) Basis of preparation (iii) New standards and interpretations not yet adopted AASB 9 Financial Instruments (and applicable amendments) (effective from 1 January ) AASB 9 addresses the recognition, classification, measurement and derecognition of financial assets and financial liabilities. It has now also introduced revised rules around hedge accounting and impairment. The standard is not applicable until 1 January but is available for early adoption. The directors do not expect this to have a significant impact on the recognition, classification and measurement of the Funds financial instruments as they are carried at fair value through profit or loss. The derecognition rules have not changed from the previous requirements, and the Funds do not apply hedge accounting. AASB 9 introduces a new impairment model. However, as the Funds investments are all held at fair value through profit or loss, the change in impairment rules will not materially impact the Funds. AASB 15 Revenue from Contracts with Customers (effective from 1 January ) AASB 15 will replace AASB 118 Revenue which covers contracts for goods and services and AASB 111 Construction Contracts which covers construction contracts. AASB 15 is based on the principle that revenue is recognised when control of a good or service transfers to a customer so the notion of control replaces the existing notion of risks and rewards. The Funds main sources of income are interest, dividends, distributions and gains on financial instruments held at fair value. All of these are outside the scope of the new revenue standard. As a consequence, the directors do not expect the adoption of AASB 15 to have a significant impact on the Funds accounting policies or the amounts recognised in the financial statements. There are no other standards that are not yet effective and that are expected to have a material impact on the Funds in the current or future reporting periods and on foreseeable future transactions. (b) Financial instruments (i) Classification The Funds investments are classified as held at fair value through profit or loss. They comprise of: Financial instruments held for trading These are investments in derivative financial instruments such as forward currency contracts. The Funds does not designate any derivatives as hedges in a hedging relationship. Financial instruments designated at fair value through profit or loss upon initial recognition These include financial assets and liabilities that are not held for trading purposes and which may be sold. These are investments in global exchange traded equity securities. Financial assets and liabilities designated at fair value through profit or loss at inception are those that are managed and their performance evaluated on a fair value basis in accordance with the Funds documented investment strategy as outlined in the Product Disclosure Statement. The Funds policy is for the Investment Manager to evaluate information about these financial instruments on a fair value basis together with other related financial information. (ii) Recognition and derecognition The Funds recognise financial assets and financial liabilities on the date they become party to the contractual agreement (trade date) and recognise changes in fair value of the financial assets and financial liabilities from this date. Financial assets are derecognised when the rights to receive cash flows from the financial assets have expired or the Funds have transferred substantially all the risks and rewards of ownership. Financial liabilities are derecognised when the obligation under the liabilities are discharged. (iii) Measurement Financial instruments held at fair value through profit or loss At initial recognition, the Funds measure a financial asset at its fair value. Transaction costs of financial assets carried at fair value through profit or loss are expensed in the statements of comprehensive income. -11-
14 For the year ended 2 Summary of significant accounting policies (b) Financial instruments (iii) Measurement Subsequent to initial recognition, all financial assets and liabilities at fair value through profit or loss are measured at fair value. Gains and losses arising from changes in the fair value of financial assets or liabilities at fair value through profit or loss category are presented in the statements of comprehensive income in the period in which they arise. For further details on how the fair value of financial instruments is determined please see Note 4 to the financial statements. (iv) Offsetting financial instruments Financial assets and liabilities are offset and the net amount is reported in the statements of financial position when the Funds have a legally enforceable right to offset the recognised amounts, and there is an intention to settle on a net basis or realise the asset and settle the liability simultaneously. As at the end of the reporting period, there are no financial assets or liabilities offset or with the right to offset in the statements of financial position. (c) Net assets attributable to unit holders Units are redeemable at the unit holders option; however, applications and redemptions may be suspended by the Responsible Entity if it is in the best interests of the unit holders. The units are classified as financial liabilities as the Funds are required to distribute their distributable income in accordance with the Funds Constitutions. The units can be put back to the Funds at any time for cash based on the redemption price. The units are carried at the redemption amount that is payable at the reporting date if the holder exercises the right to put the units back to the Funds. (d) Cash and cash equivalents For the purpose of presentation in the statements of cash flows, cash and cash equivalents includes cash on hand, deposits held at call with financial institutions, and other short term, highly liquid investments with original maturities of three months or less that are readily convertible to known amounts of cash and which are subject to an insignificant risk of changes in value. Payments and receipts relating to the purchase and sale of investment securities are classified as cash flows from operating activities, as trading of these securities represent the Funds main income generating activity. (e) Investment income (i) Interest income Interest income on cash and cash equivalents is recognised in the statements of comprehensive income on an accruals basis. Other changes in fair value of such financial instruments are recorded in accordance with the policies described in Note 2(b) to the financial statements. (ii) Dividends Dividend income is recognised on the ex-dividend date. The Funds currently incur withholding tax imposed by certain countries on investment income. Such income is recorded net of withholding tax in the statements of comprehensive income. Trust distributions are recognised on an entitlement basis. (f) Expenses All expenses are recognised in the statements of comprehensive income on an accruals basis. (g) Income tax Under current legislation, the Funds are not subject to income tax as unit holders are presently entitled to the income of the Funds. The benefits of any imputation credits and foreign tax paid are passed on to unit holders. -12-
15 For the year ended 2 Summary of significant accounting policies (h) Distributions The Funds distribute their distributable income, in accordance with the Funds Constitutions, to unit holders by cash or reinvestment. The distributions are recognised in the statement of comprehensive income as finance costs attributable to unit holders. (i) Increase/decrease in net assets attributable to unit holders Income not distributed is included in net assets attributable to unit holders. Where the Funds units are classified as financial liabilities, movements in net assets attributable to unit holders are recognised in the statements of comprehensive income as finance costs. (j) Foreign currency translation (i) Functional and presentation currency Balances included in the Funds financial statements are measured using the currency of the primary economic environment in which they operate (the functional currency ). This is the Australian dollar which reflects the currency of the economy in which the Funds compete for funds and are regulated. The Australian dollar is also the Funds presentation currency. (ii) Transactions and balances Foreign currency transactions are translated into the functional currency using the exchange rates prevailing at the dates of the transactions. Foreign exchange gains and losses resulting from the settlement of such transactions and from the translations at year end exchange rates of monetary assets and liabilities denominated in foreign currencies are recognised in the statements of comprehensive income. The Funds do not isolate that portion of unrealised gains or losses on financial instruments that are measured at fair value through profit or loss and which is due to changes in foreign exchange rates. Such fluctuations are included within the net gains/(losses) on financial instruments at fair value through profit or loss. (k) Due from/to brokers Amounts due from/to brokers represent receivables for securities sold and payables for securities purchased that have been contracted for but not yet delivered by year end. Trades are recorded on trade date, and normally settled within two business days. A provision for impairment of amounts due from brokers is established when there is objective evidence that the Funds will not be able to collect all amounts due from the relevant broker. Indicators that the amount due from brokers is impaired include significant financial difficulties of the broker, and the probability that the broker will enter into bankruptcy or financial reorganisation and default in payments. (l) Receivables Receivables may include amounts for dividends, trust distributions and interest. Dividends and trust distributions are accrued when the right to receive payment is established. Where applicable, interest is accrued on a daily basis. Amounts are generally received within 30 days of being recorded as receivables. Collectability of receivables is reviewed on an ongoing basis. Receivables which are known to be uncollectable are written off by reducing the carrying amount directly. The amount of the impairment loss is recognised in the statements of comprehensive income within other expenses. Subsequent recoveries of amounts previously written off are credited against other expenses in the statements of comprehensive income. (m) Payables Payables include liabilities, accrued expenses owed by the Funds and any distributions declared which are unpaid as at the end of the reporting period. As the Funds have a contractual obligation to distribute their distributable income, a separate distribution payable is recognised in the statements of financial position as at the end of each reporting period where this amount remains unpaid as at the end of the reporting period. Distributions declared effective in relation to unit holders who have previously elected to reinvest distributions are recognised as reinvested effective 1 July of the following financial year. (n) Applications and redemptions Applications received for units in the Funds are recorded net of any entry fees payable prior to the issue of units in the Funds. Redemptions from the Funds are recorded gross of any exit fees payable after the cancellation of units redeemed. -13-
16 For the year ended 2 Summary of significant accounting policies (o) Goods and services tax (GST) The GST incurred on the costs of various services provided to the Funds by third parties such as management, administration and custodian services where applicable, have been passed on to the Funds. The Funds qualify for Reduced Input Tax Credits (RITC) at a rate of at least 55%. Hence, fees for these services and any other expenses have been recognised in the statements of comprehensive income net of the amount of GST recoverable from the Australian Taxation Office (ATO). Amounts payable are inclusive of GST. The net amount of GST recoverable from the ATO is included in receivables in the statements of financial position. Cash flows relating to GST are included in the statements of cash flows on a gross basis. (p) Use of estimates The Funds make estimates and assumptions that affect the reported amounts of assets and liabilities within the current and next financial year. Estimates are continually evaluated and are based on historical experience and other factors, including expectations of future events that are believed to be reasonable under the circumstances. For the majority of the Funds financial instruments, quoted market prices are readily available. However, certain financial instruments, for example over-the-counter derivatives or unquoted securities, are fair valued using valuation techniques. Where valuation techniques (for example, pricing models) are used to determine fair values, they are validated and periodically reviewed by experienced personnel of the Investment Manager. Models use observable data, to the extent practicable. However, areas such as credit risk (both own and counter party), volatilities and correlations, require management to make estimates. Changes in assumptions about these factors could affect the reported fair value of financial instruments. For more information on how fair value is calculated refer to Note 4 to the financial statements. (q) Rounding of amounts The Funds are entities of a kind referred to in ASIC Corporations (Rounding in Financial/Directors Reports) Instrument 2016/191 relating to the rounding off of amounts in the financial statements. Amounts in the financial statements have been rounded to the nearest thousand dollars, unless otherwise indicated. (r) Comparative revisions Comparative information has been revised where appropriate to enhance comparability. Where necessary, comparative figures have been adjusted to conform with changes in presentation in the current year. 3 Financial risk management The Funds activities expose them to a variety of financial risks including market risk (which incorporates price risk, foreign exchange risk and interest rate risk), credit risk and liquidity risk. The Funds overall risk management programme focuses on ensuring compliance with the Funds Product Disclosure Statements and the investment guidelines of the Funds. It also seeks to maximise the returns derived for the level of risk to which the Funds are exposed and seeks to minimise potential effects on the Funds financial performance. The Funds policy allows them to use derivative financial instruments in managing their financial risks. All securities investments present a risk of loss of capital. The maximum loss on long equity securities is limited to the fair value of those positions. The maximum loss on capital on forward currency contracts is limited to the notional contract values of those positions. The investments of the Funds, and the associated risks, are managed by a specialist Investment Manager, Pzena Investment Managment, LLC, under an Investment Management Agreement ( IMA ) approved by the Responsible Entity, and containing the investment strategy and guidelines of the Funds, consistent with those stated in the Product Disclosure Statements. The Pzena Global Expanded Value Fund has not held any financial instruments since its inception on 10 June As a result, the Fund does not have any exposure to market risk (which incorporates price risk, foreign exchange risk and interest rate risk), credit risk and liquidity risk and will not appear in tables in Note 3. The Funds use different methods to measure different types of risk to which they are exposed. These methods are explained below. -14-
17 For the year ended 3 Financial risk management (a) Market risk (i) Price risk The Funds are exposed to price risk on equity securities listed or quoted on recognised securities exchanges and derivatives. Price risk arises from investments held by the Funds for which prices in the future are uncertain. Where non-monetary financial instruments are denominated in currencies other than the Australian dollar, the price in the future will also fluctuate because of changes in foreign exchange rates which are considered a component of price risk. The Investment Manager employs portfolio construction techniques within a risk management framework to control both overall portfolio risk and unintended concentration of risk due to factors that the portfolio may be sensitive to. For risk managment purposes risk is determined on an active basis; that is, with reference to the behaviour of the indexes to which the Funds are benchmarked for performance purposes. Risk management is employed both to avoid excessive risk and to ensure the Funds are taking sufficient risk to enable them to meet their investment objectives. The table at Note 3(b) summarises the sensitivities of the Funds assets and liabilities to price risk. The analysis is based on the assumption that the markets in which the Funds invest move by +/- 10% (: +/- 10%). (ii) Foreign exchange risk The Funds operate internationally and hold both monetary and non-monetary assets denominated in currencies other than the Australian dollar. Foreign exchange risk arises as the value of monetary securities denominated in other currencies fluctuate due to changes in exchange rates. The foreign exchange risk relating to non-monetary assets and liabilities is a component of price risk and not foreign exchange risk. However, the Investment Manager monitors the exposure of all foreign currency denominated assets and liabilities. Pzena Emerging Markets Value Fund As at US Dollars A$ 000 Hong Kong Dollars A$ 000 Korean Won A$ 000 All other foreign currencies A$ 000 Cash and cash equivalents Dividends receivable Due from brokers receivable for securities sold Financial assets held at fair value through profit or loss 24,963 20,231 22,539 40,123 Due to brokers - payable for securities purchased - (118) - - Net exposure 25,152 20,431 22,611 40,926 As at US Dollars A$ 000 Hong Kong Dollars A$ 000 Korean Won A$ 000 All other foreign currencies A$ 000 Cash and cash equivalents Dividends receivable Due from brokers - receivable for securities sold Financial assets held at fair value through profit or loss 20,246 18,678 20,981 36,312 Due to brokers - payable for securities purchased (29) Net exposure 20,445 19,169 21,052 36,723 The table at Note 3(b) summarises the sensitivities of the Funds monetary assets and liabilities to foreign exchange risk. The analysis is based on the assumption that the Australian dollar weakened and strengthened by 10% (: 10%) against the material foreign currencies to which the Funds are exposed. (iii) Interest rate risk Interest rate risk management is undertaken by maintaining as close to a fully invested position as possible, thus limiting the exposure of the Funds to interest rate risk. -15-
18 For the year ended 3 Financial risk management (b) Summarised sensitivity analysis The following tables summarise the sensitivity of the Funds operating profit and net assets attributable to unit holders to market risks. The reasonably possible movements in the risk variables have been determined based on management s best estimate, having regard to a number of factors, including historical levels of changes in foreign exchange rates, interest rates and the historical correlation of the Funds investments with the relevant benchmark and market volatility. However, actual movements in the risk variables may be greater or less than anticipated due to a number of factors, including unusually large market movements resulting from changes in the performance of, and/or correlation between, the performances of the economies, markets and securities in which the Funds invest. As a result, historic variations in risk variables should not be used to predict future variances in the risk variables. Impact on operating profit/net assets attributable to unit holders Price risk Foreign exchange risk Pzena Emerging Markets Value Fund -10% +10% -10% +10% $ 000 $ 000 $ 000 $ 000 As at (10,774) 10, (126) As at (9,622) 9, (113) The sensitivity factors for were +/-10% for price risk and +/-10% for foreign exchange risk (: +/-10% and +/-10%). (c) Credit risk The Funds are exposed to credit risk, which is the risk that a counterparty will be unable to pay its obligations in full when they fall due, causing a financial loss to the Funds. The Funds do not have a significant concentration of credit risk that arises from an exposure to a single counterparty or group of counterparties having similar characteristics. The main concentration of credit risk, to which the Funds are exposed, arises from cash and cash equivalents and amounts due from brokers balances. None of these assets are impaired nor past their due date as at the end of the reporting period. The maximum exposure to credit risk at the reporting date is the carrying amount of cash and cash equivalents and amounts due from brokers. (d) Liquidity risk Liquidity risk is the risk that the Funds may not be able to generate sufficient cash resources to settle their obligations in full as they fall due or can only do so on terms that are materially disadvantageous. Exposure to liquidity risk for the Funds may arise from the requirement to meet daily unit holder redemption requests or to fund foreign exchange related cash flow requirements. Liquidity risk is managed by holding assets that are actively priced and can be readily disposed of. In order to manage the Funds overall liquidity, the Responsible Entity has the discretion to reject an application for units and to defer or adjust redemption of units if the exercise of such discretion is in the best interests of unit holders. The Funds did not reject or withhold any redemptions during the financial period. (i) Maturities of non-derivative financial liabilities The tables below analyse the Funds non-derivative financial liabilities into relevant maturity groupings based on the remaining period at reporting date to the contractual maturity date. The amounts in the table are the contractual undiscounted cash flows. Units are redeemed on demand at the unit holder s option. However, the Responsible Entity does not envisage that the contractual maturity disclosed in the table below will be representative of the actual cash outflows, as holders of these instruments typically retain them for the medium to long term. -16-
19 For the year ended 3 Financial risk management (d) Liquidity risk (i) Maturities of non-derivative financial liabilities Pzena Emerging Markets Value Fund As at Less than 1 month 1to6 months 6to12 months Over 12 months Total $ 000 $ 000 $ 000 $ 000 $ 000 Distributions payable 7, ,627 Payables Due to brokers - payable for securities purchased Net assets attributable to unit holders 103, ,642 Contractual cash flows (excluding derivatives) 111, ,671 Less than 1 1to6 6to12 Over 12 Total month months months months As at $ $ $ $ $ Distributions payable 2, ,526 Payables Due to brokers - payable for securities purchased Net assets attributable to unit holders 97, ,129 Contractual cash flows (excluding derivatives) 99, ,940 4 Fair value measurement The Funds measure and recognise financial assets and liabilities held at fair value through profit or loss on a recurring basis. The Funds have no assets or liabilities measured at fair value on a non-recurring basis in the current reporting period. AASB 13 Fair Value Measurement requires disclosure of fair value measurements by level of the following fair value measurement hierarchy: Quoted prices (unadjusted) in active markets for identical assets or liabilities (level 1); Inputs other than quoted prices included within level 1 that are observable for the asset or liability, either directly or indirectly (level 2); and Inputs for the asset or liability that are not based on observable market data (unobservable inputs) (level 3). The Funds value their investments in accordance with the accounting policies set out in Note 2 to the financial statements. For the majority of their investments, the Funds rely on information provided by independent pricing services for the valuation of their investments. (a) Fair value in an active market (level 1) The fair value of financial assets and liabilities traded in active markets are based on quoted market prices at the close of trading at the end of the reporting period without any deduction for estimated future selling costs. The quoted market price used for financial assets held by the Funds is the current bid price; the quoted market price for financial liabilities is the current asking price. A financial instrument is regarded as quoted in an active market if quoted prices are readily and regularly available from an exchange, dealer, broker, industry group, pricing service, or regulatory agency, and those prices represent actual and regularly occurring market transactions on an arm s length basis. An active market is a market in which transactions for the asset or liability take place with sufficient frequency and volume to provide pricing information on an ongoing basis. -17-
20 For the year ended 4 Fair value measurement (b) Recognised fair value measurements The table below presents the Funds financial assets and liabilities measured and recognised at fair value as at. Pzena Emerging Markets Value Fund Level 1 Level 2 Level 3 Total As at $ 000 $ 000 $ 000 $ 000 Financial assets Financial assets designated at fair value through profit or loss: Listed equity securities 107, ,738 Total financial assets 107, ,738 Level 1 Level 2 Level 3 Total As at $ 000 $ 000 $ 000 $ 000 Financial assets Financial assets designated at fair value through profit or loss: Listed equity securities 96, ,217 Total financial assets 96, ,217 The Pzena Global Expanded Value Fund remains dormant since it was constituted and does not hold any financial instruments. (c) Transfer between levels Management s policy is to recognise transfers into and transfers out of fair value hierarchy levels as at the end of the reporting period. There were no transfers between levels in the fair value hierarchy at the end of the reporting period. (d) Financial instruments not carried at fair value The carrying value of receivables and payables are assumed to approximate their fair values. Net assets attributable to unit holders carrying value differ from its fair value (deemed to be redemption price for individual units) due to differences in valuation inputs. This difference is not material in the current or prior year. -18-
21 For the year ended 5 Net gains/(losses) on financial instruments held at fair value through profit or loss Net gains/(losses) recognised in relation to financial assets and liabilities held at fair value through profit or loss: Pzena Emerging Markets Value Fund Pzena Global Expanded Value Fund to to $ 000 $ 000 $ 000 $ 000 Financial assets Net gain/(loss) on financial assets designated as at fair value through profit or loss 4,443 12, Net gains/(losses) on financial assets held at fair value through profit or loss 4,443 12, Net realised gain/(loss) on financial assets held at fair value through profit or loss 2,803 2, Net unrealised gain/(loss) on financial assets held at fair value through profit or loss 1,640 10, Net gains/(losses) on financial assets held at fair value through profit or loss 4,443 12, Total net gains/(losses) on financial instruments held at fair value through profit or loss 4,443 12, Financial assets held at fair value through profit or loss Pzena Emerging Markets Value Fund Pzena Global Expanded Value Fund As at As at $ 000 $ 000 $ 000 $ 000 Designated at fair value through profit or loss Listed equity securities 107,738 96, Total designated at fair value through profit or loss 107,738 96, Total financial assets held at fair value through profit or loss 107,738 96,
22 For the year ended 7 Net assets attributable to unit holders Movements in the number of units and net assets attributable to unit holders during the year were as follows: Pzena Emerging Markets Value Fund to Units to Units 000 $ $ 000 Opening balance 83,897 97, Applications 4,438 5,211 83,897 97,129 Redemptions Reinvestment of distributions 2,182 2, Increase/(decrease) in net assets attributable to unit holders - (1,224) - - Closing balance 90, ,642 83,897 97,129 Pzena Global Expanded Value Fund to Units to Units 000 $ $ 000 Opening balance Applications Redemptions Reinvestment of distributions Increae/(decrease) in net assets attributable to unit holders Closing balance As stipulated within the Funds Constitutions, each unit represents a right to an individual share in the Funds and does not extend to a right in the underlying assets of the Funds. There are no separate classes of units and each unit has the same rights attaching to it as all other units of the Funds. Units are redeemed on demand at the unit holder s option. However, holders of these instruments typically retain them for the medium to long term. As such, the amount expected to be settled within twelve months after the end of the reporting period cannot be reliably determined. Capital risk management The Funds consider their net assets attributable to unit holders as capital, notwithstanding that net assets attributable to unit holders are classified as a liability. The amount of net assets attributable to unit holders can change significantly on a daily basis as the Funds are subject to daily applications and redemptions at the discretion of unit holders. Daily applications and redemptions are reviewed relative to the liquidity of the Funds underlying assets on a daily basis by the Responsible Entity. Under the terms of the Funds Constitution, the Responsible Entity has the discretion to reject an application for units and to defer or adjust redemption of units if the exercise of such discretion is in the best interests of unit holders. -20-
23 For the year ended 8 Distributions to unit holders The distributions declared during the year were as follows: Pzena Emerging Markets Value Fund to to $ 000 CPU $ 000 CPU Distributions June (payable) 7, , Total distributions 7, , There were no distributions declared for the year ended (: Nil) for Pzena Global Expanded Value Fund. 9 Cash and cash equivalents Pzena Emerging Markets Value Fund Pzena Global Expanded Value Fund As at As at $ 000 $ 000 $ 000 $ 000 Cash at bank 3,167 3, Total cash and cash equivalents 3,167 3, These accounts are earning a floating interest rate of between 0.00% and 0.016% as at (: 0.00% and 0.30%) -21-
24 For the year ended 10 Reconciliation of profit/(loss) to net cash inflow/(outflow) from operating activities Pzena Emerging Markets Value Fund Pzena Global Expanded Value Fund to to $ 000 $ 000 $ 000 $ 000 (a) Reconcilation of profit/(loss) to net cash inflow/(outflow) from operating activities Profit/(loss) for the year Increase/(decrease) in net assets attributable to unit holders (1,224) 11, Distributions to unit holders 7,627 2, Proceeds from sale of financial instruments held at fair value through profit or loss 14,782 8, Purchase of financial instruments held at fair value through profit or loss (21,725) (92,074) - - Net (gains)/losses on financial instruments held at fair value through profit or loss (4,443) (12,746) - - Net foreign exchange (gain)/loss (2) Management fee payments satisfied by issued units Net change in receivables (90) (676) - - Net change in payables Net cash inflow/(outflow) from operating activities (4,836) (82,990) - - (b) Non-cash operating and financing activities The following management fee payments were satisfied by the issue of units under the differential fee arrangement The following distribution payments to unit holders were satisfied by the issue of units under the distribution reinvestment plan 2, Total non-cash operating and financing activities 2, As described in Note 2(i), income not distributed is included in net assets attributable to unit holders. The change in this amount for the year (as reported in (a) above) represents a non-cash financing cost as it is not settled in cash until such time as it becomes distributable. 11 Receivables Pzena Emerging Markets Value Fund Pzena Global Expanded Value Fund As at As at $ 000 $ 000 $ 000 $ 000 Dividends receivable GST receivable Total receivables
25 For the year ended 12 Payables Pzena Emerging Markets Value Fund Pzena Global Expanded Value Fund As at As at $ 000 $ 000 $ 000 $ 000 Custody fees payable Audit and taxation fees payable Management fees payable Total payables Remuneration of auditor During the year the following fees were paid or payable for services provided by the auditor of the Funds: Pzena Emerging Markets Value Fund Pzena Global Expanded Value Fund to to $ $ $ $ KPMG Audit and other assurance services Audit of financial statements 10,000 10,000 2,000 2,000 Audit of compliance plan 3,750 3,750 3,750 3,750 Total remuneration for audit and other assurance services 13,750 13,750 5,750 5,750 Taxation services Tax compliance services 7,455 12, Total remuneration for taxation services 7,455 12, Total remuneration of KPMG 21,205 25,850 5,750 5,750 For Pzena Emerging Markets Value Fund, the auditor s remuneration is borne by the Fund. For Pzena Global Expanded Value Fund, the auditor s remuneration is paid directly by the Investment Manager. Fees are stated exclusive of GST. 14 Related party transactions The Responsible Entity of Pzena Funds is Equity Trustees Limited (ABN ) (AFSL ). Accordingly, transactions with entities related to Equity Trustees Limited are disclosed below. The Responsible Entity has contracted services to Pzena Investment Management, LLC, to act as Investment Manager for the Funds and The Northern Trust Company, to act as Custodian and Administrator for the Funds. The contracts are on normal commercial terms and conditions. (a) Key management personnel (i) Directors Key management personnel include persons who were directors of Equity Trustees Limited at any time during or since the end of the reporting period and up to the date of this report. -23-
26 For the year ended 14 Related party transactions (a) Key management personnel Philip D Gentry Chairman Harvey H Kalman Ian C Westley Michael J O Brien (appointed 11 July ) (ii) Other key management personnel There were no other key management personnel with responsibility for planning, directing and controlling activities of the Funds, directly or indirectly during the reporting period. (b) Transactions with key management personnel There were no transactions with key management personnel during the year. (c) Key management personnel unit holdings Key management personnel did not hold units in the Funds as at (: Nil). (d) Key management personnel compensation Key management personnel are paid by EQT Services Pty Ltd. Payments made from the Funds to Equity Trustees Limited do not include any amounts directly attributable to the compensation of key management personnel. (e) Key management personnel loans The Funds have not made, guaranteed or secured, directly or indirectly, any loans to key management personnel or their personally related entities at any time during the reporting period. (f) Other transactions within the Funds Apart from those details disclosed in this note, no key management personnel have entered into a material contract with the Funds during the reporting period and there were no material contracts involving management personnel s interests existing at year end. (g) Responsible Entity and Investment Manager s fees and other transactions Under the terms of the Funds Constitutions and Product Disclosure Statement for the Funds, the Responsible Entity and the Investment Manager are entitled to receive management fees. The transactions during the year and amounts payable as at year end between the Funds, the Responsible Entity and the Investment Manager were as follows: Pzena Emerging Markets Value Fund Pzena Global Expanded Value Fund $ $ $ $ Investment management fees for the year 800, , Total fees payable to the Investment Manager at year end 208, , Responsible Entity Fees for the year 50,225 33, Total fees payable to the Responsible Entity at year end 25,112 4, During the year the Investment Manager waived $135,000 in Pzena Emerging Markets Value Fund s investment management fees (: Nil). For information on how management fees are calculated please refer to the Funds Product Disclosure Statements. -24-
27 For the year ended 14 Related party transactions (h) Related party unit holdings Parties related to the Funds (including Equity Trustees Limited, its related parties and other schemes managed by Equity Trustees Limited and the Investment Manager) held no units in the Funds as at (: Nil). (i) Investments The Funds did not hold any investments in Equity Trustees Limited or its related parties during the year (: Nil). 15 Events occurring after the reporting period No significant events have occurred since the end of the year which would impact on the financial position of the Funds as disclosed in the statements of financial position as at or on the results and cash flows of the Funds for the year ended on that date. 16 Contingent assets and liabilities and commitments There are no outstanding contingent assets, liabilities or commitments as at and. -25-
 (ii) complying with Australian Accounting Standards, the Corporations Regulations 2001 and other mandatory professional reporting requirements; and giving a true")
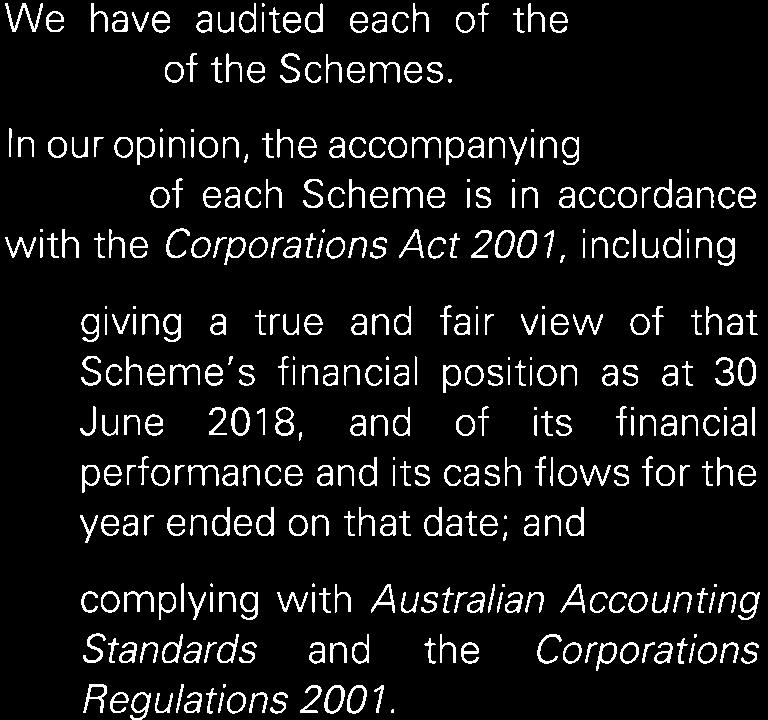
28 Directors declaration Directors declaration In the opinion of the directors of the Responsible Entity: (a) The financial statements and notes set out on pages 5 to 25 are in accordance with the Corporations Act 2001, including: (i) (ii) complying with Australian Accounting Standards, the Corporations Regulations 2001 and other mandatory professional reporting requirements; and giving a true and fair view of the Funds financial position as at and of their performance for the financial year ended on that date. (b) (c) There are reasonable grounds to believe that the Funds will be able to pay their debts as and when they become due and payable. Note 2(a) confirms that the financial statements also comply with the International Financial Reporting Standards as issued by the International Accounting Standards Board. This declaration is made in accordance with a resolution of the directors of Equity Trustees Limited through a delegated authority given by the Equity Trustees Limited s Board. Philip D Gentry Chairman Melbourne 26 September -26-

29
30


31
GQG Partners Funds Annual report For the year ended 30 June 2018
 Annual report For the year ended These financial reports cover the following GQG Partners Funds: ARSN 616 385 838 GQG Partners Emerging Markets Equity Fund ARSN 616 386 344 Annual report For the year ended
Copper Rock Capital Global Small Cap Fund ARSN Annual report For the year ended 30 June 2017
 ARSN 146 874 820 Annual report For the year ended 2017 ARSN 146 874 820 Annual report For the year ended 2017 Contents Directors report Auditor s independence declaration Statement of comprehensive income
BNP Paribas Environmental Equity Trust ARSN Annual report For the year ended 30 June 2018
 ARSN 615 479 662 Annual report For the year ended 2018 ARSN 615 479 662 Annual report For the year ended 2018 Contents Directors' report Auditor's independence declaration Statement of comprehensive income
Grant Samuel Tribeca Australian Smaller Companies Fund ARSN Annual report For the year ended 30 June 2018
 ARSN 114 913 003 Annual report For the year ended ARSN 114 913 003 Annual report For the year ended Contents Directors' report Auditor's independence declaration Statement of comprehensive income Statement
T. Rowe Price Australian Equity Fund ARSN Annual report For the year ended 30 June 2018
 ARSN 155 367 481 Annual report For the year ended ARSN 155 367 481 Annual report For the year ended Contents Directors report Auditor s independence declaration Statement of comprehensive income Statement
Eaton Vance (Australia) Hexavest All-Country Global Equity Fund ARSN Annual report For the year ended 30 June 2017
 Hexavest All-Country Global Equity Fund ARSN Annual report For the year ended 30 June 2017") Eaton Vance (Australia) Hexavest All-Country Global Equity Fund ARSN 160 970 972 Annual report For the year ended Eaton Vance (Australia) Hexavest All-Country Global Equity Fund ARSN 160 970 972 Annual
Eaton Vance (Australia) Hexavest All-Country Global Equity Fund ARSN 160 970 972 Annual report For the year ended Eaton Vance (Australia) Hexavest All-Country Global Equity Fund ARSN 160 970 972 Annual
Paradice Global Small Mid Cap Fund ARSN Annual report For the year ended 30 June 2017
 ARSN 161 493 456 Annual report ARSN 161 493 456 Annual report Contents Directors' report Auditor's independence declaration Statement of comprehensive income Statement of financial position Statement of
Loftus Peak Global Disruption Fund (formerly known as "EQT Valu-Trac Equity Income Generation Fund") ARSN Annual report For the year
 ARSN Annual report For the year") (formerly known as "EQT Valu-Trac Equity Income Generation Fund") ARSN 098 764 080 Annual report (formerly known as "EQT Valu-Trac Equity Income Generation Fund") ARSN 098 764 080 Annual report Contents
(formerly known as "EQT Valu-Trac Equity Income Generation Fund") ARSN 098 764 080 Annual report (formerly known as "EQT Valu-Trac Equity Income Generation Fund") ARSN 098 764 080 Annual report Contents
Alpha Australian Small Companies Fund ARSN Annual report For the year ended 30 June 2017
 ARSN 124 204 084 Annual report For the year ended ARSN 124 204 084 Annual report For the year ended Contents Directors report Auditor s independence declaration Statement of comprehensive income Statement
Lincoln Australian Growth Fund
 ARSN 111 734 279 Annual report For the year ended ARSN 111 734 279 Annual report For the year ended Contents Directors' report Auditor's independence declaration Statement of comprehensive income Statement
Neuberger Berman Systematic Global Equity Trust ARSN Annual report For the year ended 30 June 2017
 ARSN 096 008 703 Annual report ARSN 096 008 703 Annual report Contents Directors report Auditor s independence declaration Statement of comprehensive income Statement of financial position Statement of
MFS Global Equity Trust ARSN Annual report For the year ended 30 June 2017
 ARSN 093 197 221 Annual report For the year ended ARSN 093 197 221 Annual report For the year ended Contents Directors report Auditor s independence declaration Statement of comprehensive income Statement
Paradice Global Small Mid Cap Fund ARSN Annual report For the year ended 30 June 2018
 ARSN 161 493 456 Annual report ARSN 161 493 456 Annual report Contents Directors' report Auditor's independence declaration Statement of comprehensive income Statement of financial position Statement of
8IP Australian Small Companies Fund ARSN Annual report For the year ended 30 June 2017
 ARSN 143 454 013 Annual report For the year ended ARSN 143 454 013 Annual report For the year ended Contents Directors' report Auditor's independence declaration Statement of comprehensive income Statement
MFS Funds Annual report For the year ended 30 June 2018
 Annual report For the year ended This financial report covers the following MFS Funds: MFS Concentrated Global ARSN 130 718 188 MFS Blended Research Global ARSN 168 190 154 MFS Low Volatility Global ARSN
Alpha Funds Annual report For the year ended 30 June 2018
 Annual report This financial report covers the following : Alpha Australian Blue Chip Fund ARSN 124 204 217 Alpha Global Opportunities Fund ARSN 124 204 299 Alpha Property Securities Fund ARSN 124 203
Atlantic Pacific Australian Equity Fund ARSN Annual report For the year ended 30 June 2017
 ARSN 158 861 155 Annual report ARSN 158 861 155 Annual report Contents Directors' report Auditor's independence declaration Statement of comprehensive income Statement of financial position Statement of
MCG Endowment Strategy Fund ARSN Annual report For the year ended 30 June 2017
 ARSN 124 225 734 Annual report For the year ended ARSN 124 225 734 Annual report For the year ended Contents Directors' report Auditor's independence declaration Statement of comprehensive income Statement
Standard Life Investments Global Equity Unconstrained Trust ARSN Annual report For the period 27 September 2016 to 30 June 2017
 Standard Life Investments Global Equity Unconstrained Trust ARSN 614 785 367 Annual report Standard Life Investments Global Equity Unconstrained Trust ARSN 614 785 367 Annual report Contents Directors
C Worldwide Global Equity Trust (formerly known as "Carnegie Worldwide Equity Trust") ARSN Annual report For the year ended 30 June 2017
 ARSN Annual report For the year ended 30 June 2017") (formerly known as "Carnegie Worldwide Equity Trust") ARSN 087 585 368 Annual report For the year ended (formerly known as "Carnegie Worldwide Equity Trust") ARSN 087 585 368 Annual report For the year
(formerly known as "Carnegie Worldwide Equity Trust") ARSN 087 585 368 Annual report For the year ended (formerly known as "Carnegie Worldwide Equity Trust") ARSN 087 585 368 Annual report For the year
Somerset Emerging Markets Dividend Growth Fund ARSN Annual report For the year ended 30 June 2017
 ARSN 159 702 360 Annual report ARSN 159 702 360 Annual report Contents Directors' report Auditor's independence declaration Statement of comprehensive income Statement of financial position Statement of
Paradice Large Cap Fund (formerly known as "Paradice Emerging Markets Equity Fund") Annual report For the period 9 March 2017 to 30 June 2018
 Annual report For the period 9 March 2017 to 30 June 2018") (formerly known as "Paradice Emerging Markets Equity Fund") ARSN 617 679 071 Annual report ARSN 617 679 071 Annual report Contents Directors' report Auditor's independence declaration Statement of comprehensive
(formerly known as "Paradice Emerging Markets Equity Fund") ARSN 617 679 071 Annual report ARSN 617 679 071 Annual report Contents Directors' report Auditor's independence declaration Statement of comprehensive
T. Rowe Price Funds Annual report For the year ended 30 June 2018
 Annual report For the year ended This financial report covers the following T. Rowe Price s: T. Rowe Price Global Equity ARSN 121 250 691 T. Rowe Price Global Equity (Hedged) ARSN 153 990 044 T. Rowe Price
All Star IAM Australian Share Fund ARSN Annual report For the year ended 30 June 2016
 ARSN 126 274 762 Annual report ARSN 126 274 762 Annual report Contents Directors' report Auditor's independence declaration Statement of comprehensive income Statement of financial position Statement of
T. Rowe Price Asia ex-japan Fund ARSN Annual report For the year ended 30 June 2017
 ARSN 128 842 080 Annual report For the year ended ARSN 128 842 080 Annual report For the year ended Contents Directors' report Auditor's independence declaration Statement of comprehensive income Statement
Robeco Emerging Conservative Equity Fund (AUD) ARSN Annual report For the year ended 30 June 2017
 ARSN Annual report For the year ended 30 June 2017") Robeco Emerging Conservative Equity Fund (AUD) ARSN 165 582 543 Annual report For the year ended Robeco Emerging Conservative Equity Fund (AUD) ARSN 165 582 543 Annual report For the year ended Contents
Robeco Emerging Conservative Equity Fund (AUD) ARSN 165 582 543 Annual report For the year ended Robeco Emerging Conservative Equity Fund (AUD) ARSN 165 582 543 Annual report For the year ended Contents
Barrow Hanley Global Equity Trust ARSN Annual report For the year ended 30 June 2018
 ARSN 603 923 682 Annual report For the year ended ARSN 603 923 682 Annual report For the year ended Contents Directors' report Auditor's independence declaration Statement of comprehensive income Statement
Standard Life Investments Global Corporate Bond Trust ARSN Annual report For the year ended 30 June 2017
 Standard Life Investments Global Corporate Bond Trust ARSN 125 896 184 Annual report For the year ended 2017 Standard Life Investments Global Corporate Bond Trust ARSN 125 896 184 Annual report For the
Macro Thematic Fund (formerly known as Altair Macro Thematic Fund ) ARSN Annual report For the year ended 30 June 2017
 ARSN Annual report For the year ended 30 June 2017") (formerly known as Altair Macro Thematic Fund ) ARSN 609 004 186 Annual report (formerly known as Altair Macro Thematic Fund ) ARSN 609 004 186 Annual report Contents Directors report Auditor s independence
(formerly known as Altair Macro Thematic Fund ) ARSN 609 004 186 Annual report (formerly known as Altair Macro Thematic Fund ) ARSN 609 004 186 Annual report Contents Directors report Auditor s independence
Partners Group Global Value Fund (AUD) ARSN Annual report For the year ended 30 June 2018
 ARSN Annual report For the year ended 30 June 2018") ARSN 151 215 342 Annual report ARSN 151 215 342 Annual report Contents Directors' report Auditor's independence declaration Statement of comprehensive income Statement of financial position Statement of
ARSN 151 215 342 Annual report ARSN 151 215 342 Annual report Contents Directors' report Auditor's independence declaration Statement of comprehensive income Statement of financial position Statement of
Spire USA ROC Seniors Housing and Medical Properties Fund (AUD) ARSN Annual report For the year ended 30 June 2017
 ARSN Annual report For the year ended 30 June 2017") Spire USA ROC Seniors Housing and Medical Properties Fund (AUD) ARSN 169 358 196 Annual report For the year ended Spire USA ROC Seniors Housing and Medical Properties Fund (AUD) ARSN 169 358 196 Annual
Spire USA ROC Seniors Housing and Medical Properties Fund (AUD) ARSN 169 358 196 Annual report For the year ended Spire USA ROC Seniors Housing and Medical Properties Fund (AUD) ARSN 169 358 196 Annual
GAM Absolute Return Bond Fund (AU) ARSN Annual report For the year ended 30 June 2017
 ARSN Annual report For the year ended 30 June 2017") ARSN 128 809 174 Annual report For the year ended ARSN 128 809 174 Annual report For the year ended Contents Directors report Auditor s independence declaration Statement of comprehensive income Statement
ARSN 128 809 174 Annual report For the year ended ARSN 128 809 174 Annual report For the year ended Contents Directors report Auditor s independence declaration Statement of comprehensive income Statement
L1 Capital UK Residential Property Fund ARSN Annual report For the period 25 July 2017 to 30 June 2018
 ARSN 620 381 704 Annual report ARSN 620 381 704 Annual report Contents Directors report Auditor s independence declaration Statement of comprehensive income Statement of financial position Statement of
Orbis Global Equity LE Fund (Australia Registered) ARSN Annual report For the year ended 30 June 2018
 ARSN Annual report For the year ended 30 June 2018") ARSN 613 753 030 Annual report ARSN 613 753 030 Annual report Contents Directors' report Auditor's independence declaration Statement of comprehensive income Statement of financial position Statement of
ARSN 613 753 030 Annual report ARSN 613 753 030 Annual report Contents Directors' report Auditor's independence declaration Statement of comprehensive income Statement of financial position Statement of
Partners Group Global Real Estate Fund (AUD) ARSN Annual report For the period 30 March 2016 to 30 June 2017
 ARSN Annual report For the period 30 March 2016 to 30 June 2017") Partners Group Global Real Estate Fund (AUD) ARSN 611 351 627 Annual report ARSN 611 351 627 Annual report Contents Directors' report Auditor's independence declaration Statement of comprehensive income
Partners Group Global Real Estate Fund (AUD) ARSN 611 351 627 Annual report ARSN 611 351 627 Annual report Contents Directors' report Auditor's independence declaration Statement of comprehensive income
EQT SGH Wholesale Emerging Companies Fund (formerly known as EQT SGH Wholesale Small Companies Fund ) ARSN Annual report For the year
 ARSN Annual report For the year") (formerly known as EQT SGH Wholesale Small Companies Fund ) ARSN 098 375 798 Annual report (formerly known as EQT SGH Wholesale Small Companies Fund ) ARSN 098 375 798 Annual report Contents Directors
(formerly known as EQT SGH Wholesale Small Companies Fund ) ARSN 098 375 798 Annual report (formerly known as EQT SGH Wholesale Small Companies Fund ) ARSN 098 375 798 Annual report Contents Directors
Orbis Global Equity Fund (Australia Registered)
") ARSN 147 222 535 Annual report ARSN 147 222 535 Annual report Contents Directors' report Auditor's independence declaration Statement of comprehensive income Statement of financial position Statement of
ARSN 147 222 535 Annual report ARSN 147 222 535 Annual report Contents Directors' report Auditor's independence declaration Statement of comprehensive income Statement of financial position Statement of
Orbis Global Equity LE Fund (Australia Registered) ARSN Annual report For the period 2 August 2016 to 30 June 2017
 ARSN Annual report For the period 2 August 2016 to 30 June 2017") ARSN 613 753 030 Annual report to ARSN 613 753 030 Annual report to Contents Directors' report Auditor's independence declaration Statement of comprehensive income Statement of financial position Statement
ARSN 613 753 030 Annual report to ARSN 613 753 030 Annual report to Contents Directors' report Auditor's independence declaration Statement of comprehensive income Statement of financial position Statement
GAM Absolute Return Bond Fund (AU) ARSN Annual report For the year ended 30 June 2018
 ARSN Annual report For the year ended 30 June 2018") ARSN 128 809 174 Annual report For the year ended ARSN 128 809 174 Annual report For the year ended Contents Directors report Auditor s independence declaration Statement of comprehensive income Statement
ARSN 128 809 174 Annual report For the year ended ARSN 128 809 174 Annual report For the year ended Contents Directors report Auditor s independence declaration Statement of comprehensive income Statement
AMS Moderately Conservative Fund
 Annual Financial Report ARSN: 169 105 319 For the year ended Responsible Entity: Ironbark Asset Management (Fund Services) Limited ABN 63 116 232 154 AFSL 298 626 ARSN 169 105 319 Annual financial report
Ironbark Global (ex-australia) Property Securities Fund
 Property Securities Fund") Ironbark Global (ex-australia) Property Securities Fund ARSN 110 908 793 Annual Financial Report For the year ended 2018 Responsible Entity Ironbark Asset Management (Fund Serviced) Ltd ABN: 63 116 232
Ironbark Global (ex-australia) Property Securities Fund ARSN 110 908 793 Annual Financial Report For the year ended 2018 Responsible Entity Ironbark Asset Management (Fund Serviced) Ltd ABN: 63 116 232
Sestante Diversified Fund
 ARSN 613 157 387 Annual Financial Report Responsible Entity AZ Sestante Limited ABN: 94 106 888 662 AFSL: 284442 ARSN 613 157 387 Annual financial report Contents Page Directors report 2 Auditor s independence
Solaris Australian Equity Fund (Total Return) ARSN Annual Financial Statements for the year ended 30 June 2017
 ARSN Annual Financial Statements for the year ended 30 June 2017") ARSN 167 220 546 Annual Financial Statements for the year ended 30 June 2017 ARSN 167 220 546 Annual Financial Statements for the year ended 30 June 2017 Contents Page Directors' report 2 Auditor's independence
ARSN 167 220 546 Annual Financial Statements for the year ended 30 June 2017 ARSN 167 220 546 Annual Financial Statements for the year ended 30 June 2017 Contents Page Directors' report 2 Auditor's independence
THREADNEEDLE GLOBAL EQUITY INCOME FUND (UNHEDGED) ARSN
 ARSN") THREADNEEDLE GLOBAL EQUITY INCOME FUND (UNHEDGED) ARSN 161 086 497 ANNUAL FINANCIAL REPORT FOR THE YEAR ENDED 30 JUNE Threadneedle Global Equity Income Fund (Unhedged) ARSN 161 086 497 Annual financial
THREADNEEDLE GLOBAL EQUITY INCOME FUND (UNHEDGED) ARSN 161 086 497 ANNUAL FINANCIAL REPORT FOR THE YEAR ENDED 30 JUNE Threadneedle Global Equity Income Fund (Unhedged) ARSN 161 086 497 Annual financial
GAM Absolute Return Bond Defensive Fund (AU) ARSN Annual report For the year ended 30 June 2018
 ARSN Annual report For the year ended 30 June 2018") ARSN 167 091 474 Annual report For the year ended 2018 ARSN 167 091 474 Annual report For the year ended 2018 Contents Directors report Auditor s independence declaration Statement of comprehensive income
ARSN 167 091 474 Annual report For the year ended 2018 ARSN 167 091 474 Annual report For the year ended 2018 Contents Directors report Auditor s independence declaration Statement of comprehensive income
i Capital International Value Fund ARSN Financial statements For the year ended 30 June 2016
 ARSN 134 578 180 Financial statements For the year ended 2016 ARSN 134 578 180 Financial statements For the year ended 2016 Contents Page Directors' report 2 Auditor's independence declaration 5 Statement
Bell Global Emerging Companies Fund
 Bell Global Emerging Companies Fund Annual Financial Report For the year ended 30 June 2018 ARSN 160 079 541 Bell Asset Management Limited ABN 84 092 278 647 This page has been intentionally left blank.
For personal use only
 Aberdeen Actively Hedged International Equities Fund ARSN 088 905 033 Annual financial report Aberdeen Actively Hedged International Equities Fund ARSN 088 905 033 Annual financial report Contents Page
For personal use only
 VanEck Vectors MSCI World ex Australia Quality ETF (ASX Code: QUAL) ARSN 601 798 172 Financial report For the year ended 2018 VanEck Vectors MSCI World ex Australia Quality ETF (ASX Code: QUAL) ARSN 601
Walter Scott Emerging Markets Fund ARSN Annual report - 30 June 2013
 ARSN 140 355 719 Annual report - 30 June 2013 ARSN 140 355 719 Annual report - 30 June 2013 Contents Page Directors' Report 1 Auditor's Independence Declaration 4 Statement of Comprehensive Income 5 Statement
IAM Small Companies Fund ARSN Special purpose financial report For the year ended 30 June 2016
 ARSN 134 111 890 Special purpose financial report For the year ended 2016 ARSN 134 111 890 Special purpose financial report For the year ended 2016 Contents Directors' report Auditor's independence declaration
Wellington Management Portfolios (Australia) Global Value Equity Portfolio ARSN Annual report - 30 June 2013
 Global Value Equity Portfolio ARSN Annual report - 30 June 2013") Wellington Management Portfolios (Australia) Global Value Equity Portfolio ARSN 133 267 115 Annual report - 30 June 2013 ARSN 133 267 115 Annual report - 30 June 2013 Contents Page Directors' Report 1
Wellington Management Portfolios (Australia) Global Value Equity Portfolio ARSN 133 267 115 Annual report - 30 June 2013 ARSN 133 267 115 Annual report - 30 June 2013 Contents Page Directors' Report 1
Bell Global Emerging Companies Fund
 Bell Global Emerging Companies Fund Annual Financial Report For the year ended 30 June 2017 ARSN 160 079 541 Bell Asset Management Limited ABN 84 092 278 647 Contents Directors' report 2 Auditor's independence
Polaris Global Equity Fund ARSN Annual report - 30 June 2017
 ARSN 169 928 232 Annual report - 30 June 2017 ARSN 169 928 232 Annual report - 30 June 2017 Contents Page Directors' Report 1 Auditor's Independence Declaration 4 Statement of Comprehensive Income 5 Statement
Separately Managed Accounts
 ARSN: 114 818 530 Annual Financial Report 30 June 2017 Praemium Australia Limited ABN 92 117 611 784 Australian Financial Services Licence No 297956 Annual Financial Report - 30 June 2017 Contents Page
Colchester Global Government Bond Fund ARSN Annual report For the year ended 30 June 2017
 ARSN 168 909 671 Annual report ARSN 168 909 671 Annual report Contents Directors' report Auditor s independence declaration Statement of comprehensive income Statement of financial position Statement of
Solaris Core Australian Equity Fund. ARSN Annual financial statements for the year ended 30 June 2017
 ARSN 128 859 898 Annual financial statements for the year ended 30 June 2017 ARSN 128 859 898 Annual financial statements for the year ended 30 June 2017 Contents Page Directors' report 2 Auditor's independence
Macquarie Wholesale Australian Equities Fund ARSN Annual report - 30 June 2013
 Macquarie Wholesale Australian Equities Fund ARSN 096 152 911 Annual report - 30 June ARSN 096 152 911 Annual report - 30 June Contents Page Directors' Report 1 Auditor's Independence Declaration 4 Statement
For personal use only
 VanEck Vectors FTSE Global Infrastructure (Hedged) ETF (ASX Code: IFRA) ARSN 611 369 058 Financial report VanEck Vectors FTSE Global Infrastructure (Hedged) ETF (ASX Code: IFRA) ARSN 611 369 058 Financial
CC JCB Active Bond Fund ARSN Annual Financial Statements for the period from 3 August 2016 to 30 June 2017
 ARSN 610 435 302 Annual Financial Statements for the period from 3 August 2016 to 30 June 2017 ARSN 610 435 302 Annual Financial Statements for the period from 3 August 2016 to 30 June 2017 Contents Page
P/E Global FX Alpha Fund ARSN Annual report - For the period 21 February 2017 to 30 June 2017
 ARSN 617 261 186 Annual report - For the period 21 February 2017 to 30 June 2017 ARSN 617 261 186 Annual report - For the period 21 February 2017 to 30 June 2017 Contents Page Directors' Report 1 Auditor's
Separately Managed Accounts
 ARSN: 114 818 530 Annual Financial Report 30 June 2016 Praemium Australia Limited ABN 92 117 611 784 Australian Financial Services Licence No 297956 Annual Financial Report - 30 June 2016 Contents Page
PERPETUAL WEALTHFOCUS INVESTMENT FUNDS
 PERPETUAL WEALTHFOCUS INVESTMENT FUNDS ANNUAL FINANCIAL REPORT 30 JUNE Perpetual Investment Management Limited ABN 18 000 866 535 AFSL 234426 Annual Financial Report Contents Page Directors' report 2 Lead
21 September ASX Limited Market Announcements Office ANNUAL FINANCIAL REPORT [FOR RELEASE UNDER EACH ASX CODE LISTED BELOW]
![21 September ASX Limited Market Announcements Office ANNUAL FINANCIAL REPORT [FOR RELEASE UNDER EACH ASX CODE LISTED BELOW]](/thumbs/88/115046498.jpg "21 September ASX Limited Market Announcements Office ANNUAL FINANCIAL REPORT [FOR RELEASE UNDER EACH ASX CODE LISTED BELOW]") Investments Limited ABN 22 146 596 116, AFSL 416755 Aurora Place, Level 4 88 Phillip Street, Sydney NSW 2000 www.vaneck.com.au 21 September ASX Limited Market Announcements Office ANNUAL FINANCIAL REPORT
Investments Limited ABN 22 146 596 116, AFSL 416755 Aurora Place, Level 4 88 Phillip Street, Sydney NSW 2000 www.vaneck.com.au 21 September ASX Limited Market Announcements Office ANNUAL FINANCIAL REPORT
i Capital International Value Fund ARSN Annual report For the year ended 30 June 2017
 ARSN 134 578 180 Annual report For the year ended 2017 ARSN 134 578 180 Annual report For the year ended 2017 Contents Page Directors' report 2 Auditor's independence declaration 5 Statement of comprehensive
Annual Financial Report. 30 June 2016
 BetaShares (ARSN 169 907 313) BetaShares Agriculture - Currency Hedged (ARSN 609 246 611) BetaShares Healthcare ETF - Currency Hedged (ARSN 609 155 124) BetaShares Gold Miners ETF - Currency Hedged (ARSN
Pendal Australian Share Fund (formerly known as BT Wholesale Core Australian Share Fund) ARSN Annual report - for the year ended 30 June
 ARSN Annual report - for the year ended 30 June") (formerly known as BT Wholesale Core Australian Share Fund) ARSN 089 935 964 Annual report - for the year ended (formerly known as BT Wholesale Core Australian Share Fund) ARSN 089 935 964 Annual report
(formerly known as BT Wholesale Core Australian Share Fund) ARSN 089 935 964 Annual report - for the year ended (formerly known as BT Wholesale Core Australian Share Fund) ARSN 089 935 964 Annual report
Polaris Global Equity Fund. ARSN Annual report - 30 June 2016
 ARSN 169 928 232 Annual report - ARSN 169 928 232 Annual report - Contents Page Directors' Report 1 Auditor's Independence Declaration 4 Statement of Comprehensive Income 5 Statement of Financial Position
Morgan Stanley Global Property Securities Fund. ARSN Annual report - 30 June 2014
 Morgan Stanley Global Property Securities Fund ARSN 115 314 979 Annual report - 30 June 2014 ARSN 115 314 979 Annual report - 30 June 2014 Contents Page Directors' Report 1 Auditor's Independence Declaration
Macquarie Global Multi-Sector Fixed Income Fund ARSN Annual report - 30 June 2013
 Macquarie Global Multi-Sector Fixed Income Fund ARSN 154 703 474 Annual report - 30 June 2013 ARSN 154 703 474 Annual report - 30 June 2013 Contents Page Directors' Report 1 Auditor's Independence Declaration
Macquarie Investment Grade Bond Fund ARSN Annual report - 30 June 2013
 Macquarie Investment Grade Bond Fund ARSN 094 159 476 Annual report - 30 June 2013 ARSN 094 159 476 Annual report - 30 June 2013 Contents Page Directors' Report 1 Auditor's Independence Declaration 4 Statement
Vanguard Wholesale Funds
 Annual Report Wholesale Funds Diversified Funds Investments Australia Ltd ABN 72 072 881 086 AFSL 227263 funds covered in this annual report Conservative ARSN 101 565 351 ABN 24 396 176 911 Balanced ARSN
Australian Unity High Yield Mortgage Trust ARSN Annual financial statements for the reporting period ended 30 June 2012
 High Yield Mortgage Trust ARSN 113 151 705 Annual financial statements for the reporting period ended 30 June 2012 ARSN 113 151 705 Annual financial statements for the reporting period ended 30 June 2012
van Eyk Blueprint Global Emerging Markets Fund ARSN Annual report - 30 June 2013
 van Eyk Blueprint Global Emerging Markets Fund ARSN 133 494 461 Annual report - 30 June ARSN 133 494 461 Annual report - 30 June Contents Page Directors' Report 1 Auditor's Independence Declaration 4 Statement
Macquarie High Yield Bond Fund ARSN Annual report - 30 June 2017
 ARSN 094 159 501 Annual report - 30 June 2017 ARSN 094 159 501 Annual report - 30 June 2017 Contents Page Directors' Report 1 Auditor's Independence Declaration 4 Statement of Comprehensive Income 5 Statement
Macquarie High Yield Bond Fund ARSN Annual report - 30 June 2013
 ARSN 094 159 501 Annual report - 30 June 2013 ARSN 094 159 501 Annual report - 30 June 2013 Contents Page Directors' Report 1 Auditor's Independence Declaration 4 Statement of Comprehensive Income 5 Statement
Walter Scott Global Equity Fund ARSN Annual report - 30 June 2017
 ARSN 112 828 136 Annual report - 30 June 2017 ARSN 112 828 136 Annual report - 30 June 2017 Contents Page Directors' Report 1 Auditor's Independence Declaration 4 Statement of Comprehensive Income 5 Statement
Analytic Global Managed Volatility Fund ARSN Annual report - 30 June 2017
 Analytic Global Managed Volatility Fund ARSN 140 358 774 Annual report - 30 June 2017 ARSN 140 358 774 Annual report - 30 June 2017 Contents Page Directors' Report 1 Auditor's Independence Declaration
For personal use only
 ARSN 605 618 577 Annual Financial Report - 30 June 2018 ARSN 605 618 577 Annual Financial Report - 30 June 2018 Contents Page Directors' Report 1 Auditor's Independence Declaration 5 Statement of Profit
Touchstone Index Unaware Fund ARSN
 ARSN 610 756 413 Contents Page Directors Report 3 Auditor's Independence Declaration 6 Statement of Profit or Loss and Other Comprehensive Income 7 Statement of Financial Position 8 Statement of Changes
Macquarie Asia New Stars No. 1 Fund. ARSN Annual report - 30 June 2015
 Macquarie Asia New Stars No. 1 Fund ARSN 134 226 387 Annual report - 30 June ARSN 134 226 387 Annual report - 30 June Contents Page Directors' Report 1 Auditor's Independence Declaration 4 Statement of
IPM Global Macro Fund ARSN Annual report - For the period 21 February 2017 to 30 June 2017
 ARSN 617 257 717 Annual report - For the period 21 February 2017 to 30 June 2017 ARSN 617 257 717 Annual report - For the period 21 February 2017 to 30 June 2017 Contents Page Directors' Report 1 Auditor's
van Eyk Blueprint High Growth Fund ARSN Annual report - 30 June 2013
 ARSN 103 447 141 Annual report - 30 June ARSN 103 447 141 Annual report - 30 June Contents Page Directors' Report 1 Auditor's Independence Declaration 4 Statement of Comprehensive Income 5 Statement of
Australian Unity Investments Strategic Fixed Interest Trust ARSN Annual financial statements for the reporting period ended 30 June 2012
 Investments Strategic Fixed Interest Trust ARSN 116 735 703 Annual financial statements for the reporting period ended 30 June 2012 Investments Strategic Fixed Interest Trust ARSN 116 735 703 Annual financial
Henderson Global Equity Fund ARSN Financial report For the period ended 30 June 2014
 ARSN 166 791 760 Financial report For the period ended ARSN 166791 760 Financial report For the period ended Contents Directors' report Auditor's independence declaration Statement of comprehensive income
For personal use only
 ARSN 616 755 652 Annual Financial Report - 30 June 2018 ARSN 616 755 652 Annual Financial Report - 30 June 2018 Contents Page Directors' Report 1 Auditor's Independence Declaration 5 Statement of Profit
Arrowstreet Emerging Markets Fund ARSN Annual report - 30 June 2017
 ARSN 122 035 910 Annual report - 30 June 2017 ARSN 122 035 910 Annual report - 30 June 2017 Contents Page Directors' Report 1 Auditor's Independence Declaration 4 Statement of Comprehensive Income 5 Statement
Australian Unity Conservative Growth Portfolio ARSN Annual financial statements for the reporting period ended 30 June 2014
 Australian Unity Conservative Growth Portfolio ARSN 090 032 965 Annual financial statements for the reporting period ended 30 June 2014 Australian Unity Conservative Growth Portfolio ARSN 090 032 965 Annual
Investors Mutual Limited Managed Investment Schemes Financial reports for the year ended 30 June 2017
 Financial reports for the year ended 2017 2017 Contents Page Directors' report Auditor's independence declaration Statements of comprehensive income Statements of financial position Statements of changes
Macquarie True Index Emerging Markets Fund. ARSN Report for the period ended 31 March 2015
 Macquarie True Index Emerging Markets Fund ARSN 164 557 386 Report for the period ended 31 March 2015 ARSN 164 557 386 Report for the period ended 31 March 2015 Contents Page Directors' Report 1 Auditor's
Macquarie Asia New Stars No. 1 Fund. ARSN Annual report - 30 June 2014
 Macquarie Asia New Stars No. 1 Fund ARSN 134 226 387 Annual report - 30 June Macquarie Asia New Stars No.1 Fund ARSN 134 226 387 Annual report - 30 June Contents Page Directors' Report 1 Auditor's Independence
Macquarie Australian Diversified Income (A) Fund (formerly Macquarie Diversified Treasury (A) Fund) ARSN Annual report - 30 June 2013
 Fund (formerly Macquarie Diversified Treasury (A) Fund) ARSN Annual report - 30 June 2013") Macquarie Australian Diversified Income (A) Fund (formerly Macquarie Diversified Treasury ARSN 094 593 790 Annual report - 30 June 2013 ARSN 094 593 790 Annual report - 30 June 2013 Contents Page Directors'
Macquarie Australian Diversified Income (A) Fund (formerly Macquarie Diversified Treasury ARSN 094 593 790 Annual report - 30 June 2013 ARSN 094 593 790 Annual report - 30 June 2013 Contents Page Directors'
Walter Scott Global Equity Fund (Hedged) ARSN Annual report - 30 June 2013
 ARSN Annual report - 30 June 2013") Walter Scott Global Equity Fund (Hedged) ARSN 129 574 447 Annual report - 30 June 2013 ARSN 129 574 447 Annual report - 30 June 2013 Contents Page Directors' Report 1 Auditor's Independence Declaration
Walter Scott Global Equity Fund (Hedged) ARSN 129 574 447 Annual report - 30 June 2013 ARSN 129 574 447 Annual report - 30 June 2013 Contents Page Directors' Report 1 Auditor's Independence Declaration
Walter Scott Emerging Markets Fund. ARSN Annual report - 30 June 2014
 ARSN 140 355 719 Annual report - 30 June 2014 ARSN 140 355 719 Annual report - 30 June 2014 Contents Page Directors' Report 1 Auditor's Independence Declaration 4 Statement of Comprehensive Income 5 Statement
Vanguard Wholesale Funds
 Annual Report 2017 Vanguard Wholesale Funds Vanguard Managed Payout Fund Vanguard Investments Australia Ltd ABN 72 072 881 086 AFSL 227263 Vanguard funds covered in this annual report Vanguard Managed
Wellington Management Portfolios (Australia) Global Value Equity Portfolio
 Global Value Equity Portfolio") Wellington Management Portfolios (Australia) Global Value Equity Portfolio ARSN 133 267 115 Annual report - 30 June 2015 ARSN 133 267 115 Annual report - 30 June 2015 Contents Page Directors' Report 1
Wellington Management Portfolios (Australia) Global Value Equity Portfolio ARSN 133 267 115 Annual report - 30 June 2015 ARSN 133 267 115 Annual report - 30 June 2015 Contents Page Directors' Report 1
Macquarie Australian Pure Indexed Equities Fund. ARSN Annual report - 31 December 2013
 Macquarie Australian Pure Indexed Equities Fund ARSN 096 257 224 Annual report - 31 December ARSN 096 257 224 Annual report - 31 December Contents Page Directors' Report 1 Auditor's Independence Declaration
Kaplan Master Trust - Income Fund Annual financial statements for the year ended 30 June 2018
 Annual financial statements for the year ended 30 June 2018 Annual financial statements for the year ended 30 June 2018 Contents Page Directors' report 1 Statement of comprehensive income 3 Statement of
Investors Mutual Limited Managed Investment Schemes Financial reports for the year ended 30 June 2016
 Financial reports for the year ended 30 June 2016 30 June 2016 Contents Page Directors' report 3 Auditor's independence declaration 6 Statements of comprehensive income 7 Statements of financial position
Macquarie Inflation Linked Bond Fund ARSN Annual report - 30 June 2013
 Macquarie Inflation Linked Bond Fund ARSN 091 491 039 Annual report - 30 June 2013 ARSN 091 491 039 Annual report - 30 June 2013 Contents Page Directors' Report 1 Auditor's Independence Declaration 4 Statement