Corporate Profile. Table of Contents. Unit Corporation is a diversified energy company engaged
|
|
|
- Job Bruce
- 5 years ago
- Views:
Transcription
1


2 Corporate Profile Unit Corporation is a diversified energy company engaged through its subsidiaries in the exploration for and production of oil, natural gas, and natural gas liquids, the contract drilling of onshore oil and natural gas wells, and the gathering and processing of natural gas. Operations are principally located in the Mid-Continent region, including the Anadarko and Arkoma Basins, with additional activity in the Permian, Rocky Mountain, Appalachia, and Gulf Coast Basins. Table of Contents Areas of Operations Year Financials...1 Letter to Shareholders...2 Operational Highlights...5 Segment Highlights...6 Form 10-K...11 Corporate Information...Inside Back Cover
 2013 2012 2011 2010 2009 Total Revenues $ 1,351,850 $ 1,315,123 $ 1,207,503 $ 870,671 $ 707,188 Capital")

3 Casper Office MISSISSIPPIAN BASIN ANADARKO BASIN Tulsa Headquarters ARKOMA BASIN Oklahoma City Office PERMIAN BASIN Contract Drilling Oil & Natural Gas Midstream Houston Office GULF COAST BASIN OVERVIEW of Operations 5-Year Financial Information Year Ended December 31, ($ in thousands) Total Revenues $ 1,351,850 $ 1,315,123 $ 1,207,503 $ 870,671 $ 707,188 Capital Expenditures 1 $ 703,984 $ 1,360,866 $ 778,564 $ 576,309 $ 316,660 Total Assets $ 4,022,390 $ 3,761,120 $ 3,256,720 $ 2,669,240 $ 2,228,399 Long-Term Debt $ 645,696 $ 716,359 $ 300,000 $ 163,000 $ 30,000 Shareholders Equity $ 2,173,392 $ 1,974,301 $ 1,947,017 $ 1,710,617 $ 1,565,810 Total Capitalization $ 2,819,088 $ 2,690,660 $ 2,247,017 $ 1,873,617 $ 1,595,810 1 Capital expenditures (cash basis) including acquisitions. UNIT CORPORATION 1

4 TO OUR SHAREHOLDERS During 2013, we celebrated our 50 year anniversary, a milestone event in the energy industry. We continue to be driven by the long-term outlook for our business. We are focused on corporate goals geared to position us for many more years of consistent growth and strong performance all to the end of adding value for our shareholders. Each of our three business segments are executing on strategies for sustainable growth. Our oil and natural gas segment is positioned in resource plays where we have experience and expertise. Among our core areas, we have identified many years worth of potential drilling locations thus enabling us to achieve consistent growth and commodity mix objectives. Our contract drilling segment has designed a new 1,500 horsepower A/C drilling rig of proprietary design, the BOSS rig (Box on Box Self-Rising Substructure), which we believe will set a new standard as the energy industry continues to transition into the development stage. Before the completion of our first BOSS drilling rig, we have received commitments for two additional BOSS rigs both to be delivered mid As the BOSS drilling rigs are deployed, we are optimistic that the design and capabilities of this drilling rig will be quickly adopted by new customers and result in the recapture of market share. We have made substantial investments in our midstream segment over the last few years, positioning that segment for significant growth. We have also focused on increasing its feebased contract mix to reduce commodity price exposure and to provide a more stable, sustainable cash flow growth trajectory. All in all, the strategic initiatives that we have been focusing on have moved our company in a direction that will become increasingly evident in the years to come. We have and will continue to position the company for sustainable growth YEAR IN REVIEW 2013 was an active year for our oil and natural gas segment as we integrated additional Granite Wash acreage and nearly 600 possible drilling locations, which we acquired in 2012, into our overall operations program. Likewise, we also spent a great deal of time and effort understanding, delineating and creating a multi-pay zone exploration and development program for our Wilcox play in South Texas. Together these two areas were the primary focus of our 2013 operations, complimented by our Marmaton oil projects and our continuing exploration work in the Mississippian Lime play. The strength of our exploration and production asset base is illustrated by the 18% growth in our production for the year. Mid-year, we raised our production guidance range to between 15% to 18%, and we were able to achieve the upper-end of that range even though we spent less capital in 2013 than in I think this result highlights both the experience and expertise of our oil and natural gas segment personnel and, equally important, the strength of our asset base. For our contract drilling segment, the market has been challenging for the past several years, a result of lower natural gas prices from The past few years have forced operators to seek out lower cost, higher efficiency drilling solutions. These efficiencies have reduced the overall number of drilling rigs operating in the United States. Although we have not been immune to these effects, we were able to maintain an average per day operating margin of $7,796, before the elimination of intercompany drilling rig profit, during In addition, during the past year we sold five of our idle drilling rigs for $32.4 million and retired one drilling rig, bringing our fleet at year end to 121. After year end, we sold ANNUAL REPORT
5 BY THE NUMBERS Proved Reserves (MBoe) Oil & Natural Gas Segment Production (MBoe) Wells Drilled 180, , , , ,000 80,000 60,000 40,000 20,000 18,000 16,000 14,000 12,000 10,000 8,000 6,000 4,000 2, Contract Drilling Segment Total Footage Drilled (000 s) Midstream Segment Volume of Natural Gas Processed (Mcf/Day) Consolidated Total Revenue ($000 s) 12, ,000 1,500,000 10, , ,000 1,200,000 8, , ,000 6,000 80,000 4,000 60, ,000 2,000 40,000 20, , UNIT CORPORATION 3
6 four additional drilling rigs, bringing our current fleet to 117. The drilling rigs sold were those we had identified as not well suited for future market demand. During 2013, we finished designing and started building our new BOSS rig, which is a purpose-built, 1,500 horsepower AC drilling rig designed from the ground up by our engineers. Our concept is to combine the best technological innovations from recent high-tech drilling rig designs into a single unique drilling rig that meets the demands of today s market, such as the need to have a quick assembly substructure which can be moved in smaller, lighter loads, reducing the number of permits needed to move the drilling rig to a new location. Our goal was to design an AC drilling rig that would contribute to our customers efficiencies in a number of ways, and we believe we have an industry-leading design to offer to our customers. The first BOSS rig will begin operating in the Granite Wash for our oil and natural gas segment during the first quarter of As excited as we are about the BOSS rig for the future of our company, we still operate and maintain one of the largest land rig drilling fleets in the United States, and are active in each of the major producing basins. We believe the area of greatest potential in the current horizontal drilling rig market is in the 750 horsepower to 1,700 horsepower drilling rig category. Drilling rigs in this category comprised 70% of our total rig fleet at year end, so we are very well-positioned to continue to capitalize on the trend in the industry of drilling horizontal wells almost exclusively. However, as we deploy the BOSS rigs in to our fleet, we will continue to evaluate the make-up of our fleet with the objective of maximizing our rig utilization. Our midstream segment and wholly-owned subsidiary, Superior Pipeline Company, increased its per day gas gathered volumes by 24% in 2013, an indication of the strong performance from this segment. We anticipate that the effort spent over the past several years building the infrastructure of this operation has positioned it well for future growth. We are continuing our initiative to increase the percentage of feebased contract volumes and margins in order to continue the trajectory of moving to more stable and higher cash flows. a rising tide raises all boats, and we have positioned each of Unit Corporation s three business segments to contribute to continuing corporate growth in 2014 and beyond. We have planned a 2014 operating capital expenditure program of $928 million, 33% higher than in 2013, with 78% allocated to exploration and production, 14% to contract drilling and 8% to our midstream operations. The bulk of our 2014 capital program will be funded with internally-generated cash flows based upon budgeted realized prices of $90.08 per barrel oil, $29.45 per barrel of natural gas liquids, and $3.77 per Mcf natural gas. The combination of attractive high-working interest drilling projects, coupled with a potential increase in rig fleet demand, and increasing capacity in our midstream segment, reflects great growth opportunities in the future. As energy investors are well aware, the independent oil and gas sector has faced many challenges since 2009 ranging from the capital markets crisis to consistently lower commodity prices to a fundamentally more challenging regulatory environment. We have endured these challenges and consistently delivered growth in our production and reserves, while increasing cash flows and maintaining a disciplined and conservative financial structure. In closing, I believe that the longevity and success of our company over the decades has come down to the skills of our people and our focus on delivering results. I believe we have once again delivered strong, positive results in 2013, and we are working diligently every day on behalf of our shareholders to grow our business in 2014 and beyond. Larry D. Pinkston President and Chief Executive Officer February 25, 2014 LOOKING AHEAD Moving ahead, I think 2014 will be a bellwether year in that I believe oil prices will remain consistent within their current pricing bands, and we are beginning to see evidence of sustained increases in natural gas prices. As the saying goes, ANNUAL REPORT
7 Operational Highlights Year Ended December 31, ($ in thousands except average price amounts) Oil And Natural Gas Operations Data: Proved Oil And Natural Gas Reserves Discounted at 10% (Before Income Taxes) $ 1,791,903 $ 1,475,792 $ 1,578,422 $ 1,284,925 $ 775,358 Proved Oil And Natural Gas Reserves Discounted at 10% (After Income Taxes) $ 1,225,976 $ 1,079,956 $ 1,087,909 $ 855,086 $ 546,335 Total Estimated Proved Reserves: Natural Gas (MMcf) 581, , , , ,061 Oil (MBbl) 21,765 21,998 20,255 17,494 11,669 Natural Gas Liquids (MBbl) 41,205 35,166 22,087 16,117 14,653 Equivalent (MBoe) 159, , , ,692 96,165 Production: Natural Gas (MMcf) 56,757 48,930 44,104 40,756 44,063 Oil (MBbl) 3,360 3,279 2,511 1,521 1,286 Natural Gas Liquids (MBbl) 3,914 2,796 2,239 1,549 1,488 Equivalent (MBoe) 16,734 14,230 12,101 9,863 10,118 Average Price: Natural Gas (Per Mcf) $ 3.32 $ 3.37 $ 4.26 $ 5.62 $ 5.59 Oil (Per Bbl) $ $ $ $ $ Natural Gas Liquids (Per Bbl) $ $ $ $ $ Equivalent (Boe) $ $ $ $ $ Well Data: Wells Drilled Wells Completed Success Rate 96% 99% 90% 90% 94% Producing Well Count: Gross Net Gross Net Gross Net Gross Net Gross Net Natural Gas 6,705 2,182 6,986 2,213 5,915 1,541 5,180 1,225 5,048 1,161 Oil 2, , , , , Total 9,696 2,781 9,923 2,777 8,674 2,001 7,836 1,641 7,703 1,570 Year Ended December 31, ($ in thousands except average price amounts) Contract Drilling Operations Data: Number of Drilling Rigs at Year End Wells Drilled Total Footage Drilled (Feet In 1,000 s) 10,578 10,551 9,749 7,961 4,627 Average Number of Drilling Rigs Utilized Average Utilization 52% 58% 61% 50% 30% Mid-Stream Operations Data: Natural Gas Gathered (Mcf/Day) 309, , , , ,991 Natural Gas Processed (Mcf/Day) 140, ,987 92,940 65,740 60,726 Liquids Sold (Gallons/Day) 543, , , , ,492 UNIT CORPORATION 5
, and 61% natural gas.")


8 SEGMENT HIGHLIGHTS OIL AND NATURAL GAS SEGMENT At the end of 2013, our total proved reserves were 160 MMBoe, or 960 Bcfe, a 7% increase over We replaced approximately 161% of our 2013 production. Estimated proved reserves were 13% oil, 26% natural gas liquids (NGLs), and 61% natural gas. Our strategy of drilling oil or NGLs rich wells is evident in our production results. Liquids production for the fourth quarter of 2013 increased 178% since the first quarter of 2009 when we began focusing almost entirely on increasing our liquids production. Total production for all of 2013 was 16.7 MMBoe, an increase of 18% over the 14.2 MMBoe produced during Our production guidance for 2014 is approximately 19.2 to 19.7 MMBoe, an increase of 15% to 18% over Our 2013 oil and natural gas revenues increased 14% to $649.7 million. The price we received for our natural gas averaged $3.32 per Mcf, a decrease of 1% from 2012, while our average oil price received increased 3% to $95.06 per barrel. Our NGLs price received averaged $31.79 per barrel, up 1% from In the Texas Panhandle District, which consists primarily of Granite Wash (GW) wells and to a lesser degree Cleveland wells, production for 2013 increased approximately 28% over We had first sales on 23 horizontal GW wells, having an average peak 30 day IP rate of 5.2 MMcfe per day and an average working interest of 85%. We also had first sales on three Cleveland wells with an average peak 30 day rate of 3.9 MMcfe per day at an average working interest of 80%. We recently completed drilling operations on three separate well pads located in different sections of the Buffalo Wallow GW field. Each pad has three wells resulting in nine total wells that will target five different GW sand intervals. Six of the wells have been fracture stimulated and the remaining three wells are scheduled to be fracture stimulated in the first quarter We plan to monitor production from these three pads for approximately 90 days prior to resuming pad drilling in the field. At the conclusion of the testing phase, we will report the results from all nine wells. We plan to run three to five Unit rigs in the GW play and one Unit rig in the Cleveland play during The Wilcox play in southeast Texas continues to deliver strong results. Production for 2013 increased 21% as compared to For 2013, we completed six vertical and one horizontal liquids rich Wilcox gas wells and drilled one dry hole. We own 100% working interest in all eight wells. Our first horizontal Wilcox well was completed in late November 2013 at an initial rate of approximately 4.4 MMcf per day and 73 barrels of condensate per day from approximately 1,500 feet of Basal Wilcox lateral. The initial results are encouraging, but additional production data is needed to better estimate the ultimate reserves of this well. There are currently two Unit rigs drilling in our Wilcox play with plans to add a third rig in the second half of the year, which should result in approximately 10 to 12 vertical wells and two to four horizontal wells drilled in this play in In our Mississippian play in south central Kansas, production for 2013 increased 218% as compared to We had first sales on eight Mississippian wells during 2013 with an average 30 day IP rate of 222 Boe per day consisting of an average of approximately 53% oil, 11% NGLs, and 36% natural gas with a 100% average working interest. The last four wells completed in the fourth quarter of 2013 had a significantly higher liquids cut consisting of approximately 79% oil, 6% NGLs, and 15% natural gas with an average 30 day IP rate of approximately 231 Boe per day. We are currently considering altering our drilling program in this play in 2014 to drill extended lateral wells and ANNUAL REPORT
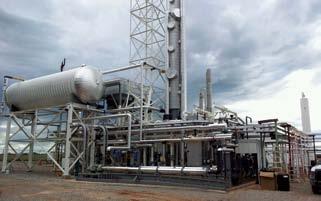
9 to test different fracture stimulation designs. We are currently running two Unit rigs in the play. In the Marmaton horizontal oil play in Beaver County, Oklahoma, we had first sales on 41 horizontal wells during 2013 with an average 30 day IP rate of 371 Boe per day with an approximate average working interest of 75%. Two additional potential horizontal targets in the play are scheduled to be tested in We had two Unit rigs drilling in the play and plan to continue with this two rig drilling program. During 2013, we completed sales of certain non-core oil and natural gas assets, with total proceeds of $78.8 million with the most significant portion coming from the sale of the majority of our non-operated Bakken assets. CONTRACT DRILLING SEGMENT Our contract drilling segment operated in a soft drilling market throughout 2013; however, the market is showing some improvement into During 2013, we maintained consistent utilization and drilling rig rates throughout the year. We initiated a comprehensive evaluation of our drilling rig fleet that included a review regarding the possible realignment of our fleet s capabilities and efficiencies. In view of the current demand for drilling rigs using new technologies, we determined to sell several of our older and larger drilling rigs that have not worked for some time. During the year, we sold four idle 2,000 horsepower drilling rigs, one idle 3,000 horsepower drilling rig, and retired one 700 horsepower drilling rig, bringing our fleet s year-end total to 121 drilling rigs. Proceeds from the sale of the drilling rigs totaled $32.4 million. The sale of four additional idle 3,000 horsepower drilling rigs was completed after year end. The proceeds from these sales will be used in our new drilling rig program, a program we launched to design and build a new proprietary drilling rig, the BOSS rig. We anticipate this drilling rig, coupled with continued enhancements to our existing fleet, will position us to continue to meet the demands of our existing customers as well as allowing us to compete for the work of new customers. Our first BOSS drilling rig will go to work for our oil and natural gas segment during the first quarter of In 2013, our drilling revenues decreased 22% to $414.8 million, while average day rates for the year decreased 2% to $19,646. For 2013, we averaged 65.0 drilling rigs working, a decrease of 12% from 73.9 drilling rigs working during As the industry has shifted its focus from dry natural gas exploration to oil and liquids-rich gas exploration, we have responded to this shift by refurbishing our drilling rig fleet to accommodate horizontal drilling to reach these resources. Since 2009, we have refurbished or upgraded 48 drillings rigs in our fleet to meet our customer demand. Currently, 97% of our contracted drilling rigs are drilling horizontal wells. Unit ended the year with 121 drilling rigs. With the recent sale of four additional drilling rigs, our fleet s total is currently 117, 69 of which are contracted. Long-term contracts (contracts with original terms ranging from six months to three years in length) are in place for 23 of those 69 drilling rigs. Of these contracts, seven are up for renewal during the first quarter of 2014, 10 during the second quarter of 2014, five during the fourth quarter of 2014, and one in We have 32 drilling rigs in our Rocky Mountain operations, 71 in our Anadarko Basin operations, three drilling rigs in the Permian Basin and 11 in our Gulf Coast operations. Our new BOSS rig will be operational in the first quarter of 2014, and two additional BOSS drilling rigs are contracted to third party operators and are anticipated to be placed into service by the end of MIDSTREAM SEGMENT Our midstream operations serve a strong customer base of mostly independent producers located in Oklahoma, Texas, Kansas, Pennsylvania and West Virginia. We operate three natural gas treatment plants, 15 natural gas processing plants, 38 active gathering systems and approximately 1,500 miles of pipeline. Revenues for our midstream operations increased 32% in 2013 to $287.4 million. For 2013, processing volumes increased 5% to 140,584 Mcf per day, while gathering volumes increased 24% to 309,554 Mcf per day. Liquids sold volumes remained relatively unchanged at 543,602 gallons per day. After relocating two processing plants from our Hemphill County, Texas facility to our new Reno County, Kansas facility, we now have the capacity to process 135 MMcf per day of our own and third party Granite Wash natural gas production at our Hemphill facility. We completed two pipeline extension projects for a total cost of approximately $5.7 million in the fourth quarter of 2013, which will allow us to connect additional production from our oil and natural gas segment to this system. We have completed construction of a new gathering and processing facility in Reno County, Kansas. This new system consists of approximately 20 miles of gathering pipeline and two processing plants that were relocated from our Hemphill facility which included a five MMcf per UNIT CORPORATION 7


10 day refrigerated JT plant skid and a 20 MMcf per day turbo expander plant skid. We began gathering gas at this facility during the second quarter of 2013 and processing gas in the third quarter of In the Mississippian play in north central Oklahoma, our Bellmon system consists of approximately 185 miles of pipeline, which includes a 26-mile extension to connect our existing Remington facility, a 20-mile NGL line and two owned natural gas processing plants. In the first quarter of 2013, we completed the installation of a 30 MMcf per day cryogenic processing plant. Due to anticipated increased volumes, we also completed the installation of a new 60 MMcf per day processing plant in the first quarter of We now have capacity to process 90 MMcf per day at this facility. In the Appalachian region, construction on the first phase of our Pittsburgh Mills gathering facility in Allegheny and Butler Counties, Pennsylvania is complete and consists of approximately 14 miles of gathering pipeline. In the first quarter of 2013, the related compressor station was completed and operational. We currently have 19 wells connected to this gathering system with plans to continue to add wells as they are drilled. Preliminary activity is underway for the planned expansion of this pipeline into Butler County, Pennsylvania scheduled to begin in the second quarter of This expansion is expected to be completed by the end of We completed the construction of the Brookfield gathering system, a new gathering system in north central Pennsylvania. It became operational in the second quarter of Our midstream segment has seen solid volume growth over the past nine years. We believe we are well positioned to take advantage of growth opportunities in all areas of these operations. MEET THE NEW BOSS ANNUAL REPORT

11 In February we celebrated the completion of our first BOSS drilling rig at our Oklahoma City Yard. Customers, friends and employees attended this event on a cold Oklahoma day, but the weather did not matter. Everyone was excited and interested to tour this newly designed drilling rig that we believe will set a new standard in the industry. We would like to thank everyone who joined with us as we proudly commissioned it into service. UNIT CORPORATION 9


12 ANNUAL REPORT FORM 10-K
13 UNITED STATES SECURITIES AND EXCHANGE COMMISSION WASHINGTON, D.C FORM 10-K ANNUAL REPORT PURSUANT TO SECTION 13 OR 15(d) OF THE SECURITIES EXCHANGE ACT OF 1934 For the fiscal year ended December 31, 2013 OR TRANSITION REPORT PURSUANT TO SECTION 13 OR 15(d) OF THE SECURITIES EXCHANGE ACT OF 1934 For the transition period from Commission file number: UNIT CORPORATION (Exact name of registrant as specified in its charter) Delaware (State or other jurisdiction of incorporation or organization) (I.R.S. Employer Identification No.) 7130 South Lewis, Suite 1000 Tulsa, Oklahoma (Address of principal executive offices) (Zip Code) (Registrant s telephone number, including area code) (918) Securities registered pursuant to Section 12(b) of the Act: Title of each class Common Stock, par value $.20 per share Rights to Purchase Series A Participating Cumulative Preferred Stock Securities registered pursuant to Section 12(g) of the Act: None to Name of each exchange on which registered NYSE NYSE Indicate by check mark if the registrant is a well-known seasoned issuer, as defined in Rule 405 of the Securities Act. Yes [x] No [ ] Indicate by check mark if the registrant is not required to file reports pursuant to Section 13 or Section 15(d) of the Exchange Act. Yes [ ] No [x] Indicate by check mark whether the registrant (1) has filed all reports required to be filed by Section 13 or 15(d) of the Securities Exchange Act of 1934 during the preceding 12 months (or for such shorter period that the registrant was required to file such reports), and (2) has been subject to such filing requirements for the past 90 days. Yes [x] No [ ] Indicate by check mark whether the registrant has submitted electronically and posted on its corporate Web site, if any, every Interactive Data File required to be submitted and posted pursuant to Rule 405 of Regulation S-T ( of this chapter) during the preceding 12 months (or for such shorter period that the registrant was required to submit and post such files). Yes [x] No [ ] Indicate by check mark if disclosure of delinquent filers pursuant to Item 405 of Regulation S-K is not contained herein, and will not be contained, to the best of registrant s knowledge, in definitive proxy or information statements incorporated by reference in Part III of this Form 10-K or any amendment to this Form 10-K. [x] Indicate by check mark whether the registrant is a large accelerated filer, an accelerated filer, a non-accelerated filer, or a smaller reporting company. See the definitions of large accelerated filer, accelerated filer and smaller reporting company in Rule 12b-2 of the Exchange Act. Large accelerated filer [x] Accelerated filer [ ] Non-accelerated filer [ ] Smaller reporting company [ ] Indicate by check mark whether the registrant is a shell company (as defined in Rule 12b-2 of the Exchange Act). Yes [ ] No [x] As of June 30, 2013, the aggregate market value of the voting and non-voting common equity (based on the closing price of the stock on the NYSE on June 30, 2013) held by non-affiliates was approximately $1,080,689,810 Determination of stock ownership by non-affiliates was made solely for the purpose of this requirement, and the registrant is not bound by these determinations for any other purpose. Indicate the number of shares outstanding of each of the issuer s classes of common stock, as of the latest practicable date. Class Outstanding at February 14, 2014 Common Stock, $0.20 par value per share... 49,232,860 shares DOCUMENTS INCORPORATED BY REFERENCE Document Portions of the registrant s definitive proxy statement (the Proxy Statement ) with respect to its annual meeting of shareholders scheduled to be held on May 7, The Proxy Statement shall be filed within 120 days after the end of the fiscal year to which this report relates. Exhibit Index See Page 119 Parts Into Which Incorporated Part III
14 FORM 10-K UNIT CORPORATION TABLE OF CONTENTS Page PART I Item 1. Item 1A. Item 1B. Item 2. Item 3. Item 4. Business... 1 Risk Factors Unresolved Staff Comments Properties Legal Proceedings Mine Safety Disclosures PART II Item 5. Item 6. Item 7. Item 7A. Item 8. Item 9. Item 9A. Item 9B. Market for the Registrant s Common Equity, Related Stockholder Matters, and Issuer Purchases of Equity Securities Selected Financial Data Management s Discussion and Analysis of Financial Condition and Results of Operation Quantitative and Qualitative Disclosures about Market Risk Financial Statements and Supplementary Data Changes in and Disagreements with Accountants on Accounting and Financial Disclosure Controls and Procedures Other Information PART III Item 10. Item 11. Item 12. Item 13. Item 14. Directors, Executive Officers, and Corporate Governance Executive Compensation Security Ownership of Certain Beneficial Owners and Management and Related Stockholder Matters Certain Relationships and Related Transactions, and Director Independence Principal Accountant Fees and Services PART IV Item 15. Exhibits and Financial Statement Schedules Signatures Exhibit Index
15 DEFINITIONS The following are explanations of some of the terms used in this report. ARO Asset retirement obligations. ASC FASB Accounting Standards Codification. ASU Accounting Standards Update. Bcf Billion cubic feet of natural gas. Bcfe Billion cubic feet of natural gas equivalent. Determined using the ratio of one barrel of crude oil or NGLs to six Mcf of natural gas. Bbl Barrel, or 42 U.S. gallons liquid volume. Boe Barrel of oil equivalent. Determined using the ratio of six Mcf of natural gas to one barrel of crude oil or NGLs. BOKF Bank of Oklahoma Financial Corporation. Btu British thermal unit, used in terms of gas volumes. Btu is used to refer to the amount of natural gas required to raise the temperature of one pound of water by one degree Fahrenheit at one atmospheric pressure. Development drilling The drilling of a well within the proved area of an oil or gas reservoir to the depth of a stratigraphic horizon known to be productive. DD&A Depreciation, depletion, and amortization. FASB Financial and Accounting Standards Board. Finding and development costs Costs associated with acquiring and developing proved natural gas and oil reserves which are capitalized under generally accepted accounting principles, including any capitalized general and administrative expenses. Gross acres or gross wells The total acres or wells in which a working interest is owned. IF Inside FERC (U.S. Federal Energy Regulatory Commission). LIBOR London Interbank Offered Rate. MBbls Thousand barrels of crude oil or other liquid hydrocarbons. Mcf Thousand cubic feet of natural gas. Mcfe Thousand cubic feet of natural gas equivalent. Determined using the ratio of one barrel of crude oil or NGLs to six Mcf of natural gas. MMBbls Million barrels of crude oil or other liquid hydrocarbons. MMBoe Million barrels of oil equivalents. MMBtu Million Btu s. MMcf Million cubic feet of natural gas. MMcfe Million cubic feet of natural gas equivalent. Determined using the ratio of one barrel of crude oil or NGLs to six Mcf of natural gas. Net acres or net wells The sum of the fractional working interests owned in gross acres or gross wells. NGLs Natural gas liquids. NGPL-TXOK Natural Gas Pipeline Co. of America/Texok zone.
16 DEFINITIONS (Continued) NYMEX The New York Mercantile Exchange. OPIS Oil Price Information Service. PEPL Panhandle East Pipeline Co. Play A term applied by geologists and geophysicists identifying an area with potential oil and gas reserves. Producing property A natural gas or oil property with existing production. Proved developed reserves Reserves that can be expected to be recovered through existing wells with existing equipment and operating methods or in which the cost of the required equipment is relatively minor compared to the cost of a new well; and through installed extraction equipment and infrastructure operational at the time of the reserves estimate. For additional information, see the SEC s definition in Rule 4-10(a)(3) of Regulation S-X. Proved reserves Proved oil and gas reserves are those quantities of oil and gas, which, by analysis of geosciences and engineering data, can be estimated with reasonable certainty to be economically producible from a given date forward, from known reservoirs and under existing economic conditions, operating methods, and government regulations prior to the time at which contracts providing the right to operate expire, unless evidence indicates that renewal is reasonably certain, regardless of whether deterministic or probabilistic methods are used for the estimation. The project to extract the hydrocarbons must have commenced or the operator must be reasonably certain that it will commence the project within a reasonable time. For additional information, see the SEC s definition in Rule 4-10(a)(2)(i) through (iii) of Regulation S-X. Proved undeveloped reserves Proved reserves that are expected to be recovered from new wells on undrilled acreage, or from existing wells where a relatively major expenditure is required for recompletion. For additional information, see the SEC s definition in Rule 4-10(a)(4) of Regulation S-X. Reasonable certainty (in regards to reserves) If deterministic methods are used, reasonable certainty means a high degree of confidence that the quantities will be recovered. If probabilistic methods are used, there should be at least a 90% probability that the quantities actually recovered will equal or exceed the estimate. Reliable technology A grouping of one or more technologies (including computational methods) that has been field tested and has been demonstrated to provide reasonably certain results with consistency and repeatability in the formation being evaluated or in an analogous formation. SARs Stock appreciation rights. Unconventional play Plays targeting tight sand, carbonates, coal bed, or oil and gas shale reservoirs. The reservoirs tend to cover large areas and lack the readily apparent traps, seals, and discrete hydrocarbon-water boundaries that typically define conventional reservoirs. These reservoirs generally require horizontal wells and fracture stimulation treatments or other special recovery processes in order to produce economically. Undeveloped acreage Lease acreage on which wells have not been drilled or completed to a point that would permit the production of economic quantities of natural gas or oil regardless of whether the acreage contains proved reserves. Well spacing The regulation of the number and location of wells over an oil or gas reservoir, as a conservation measure. Well spacing is normally accomplished by order of the appropriate regulatory conservation commission. Workovers Operations on a producing well to restore or increase production. WTI West Texas Intermediate, the benchmark crude oil in the United States.
17 UNIT CORPORATION Annual Report For The Year Ended December 31, 2013 PART I Item 1. Business Unless otherwise indicated or required by the context, the terms Company, Unit, us, our, we, and its refer to Unit Corporation and, as appropriate, one or more of Unit Corporation and its subsidiaries. Our executive offices are at 7130 South Lewis, Suite 1000, Tulsa, Oklahoma 74136; our telephone number is (918) Information regarding our annual reports on Form 10-K, quarterly reports on Form 10-Q, current reports on Form 8-K, and any amendments to these reports, will be made available in print, free of charge, to any shareholders who request them. They are also available on our internet website at as soon as reasonably practicable after we electronically file these reports with or furnish them to the Securities and Exchange Commission (SEC). Materials we file with the SEC may be read and copied at the SEC s Public Reference Room at 100 F. Street, N.E. Room 1580, N.W., Washington, D.C Information on the operation of the Public Reference Room may be obtained by calling the SEC at SEC The SEC also maintains an Internet website at that contains reports, proxy and information statements, and other information regarding our company that we file electronically with the SEC. In addition, we post on our Internet website, copies of our corporate governance documents. Our corporate governance guidelines and code of ethics, and the charters of our Board s Audit, Compensation, and Nominating and Governance Committees, are available free of charge on our website or in print to any shareholder who requests them. We may from time to time provide important disclosures to investors by posting them in the investor information section of our website, as allowed by SEC rules. GENERAL We were founded in 1963 as an oil and natural gas contract drilling company. Today, in addition to our drilling operations, we have operations in the exploration and production and mid-stream areas. We operate, manage, and analyze our results of operations through our three principal business segments: Oil and Natural Gas carried out by our subsidiary Unit Petroleum Company. This segment explores, develops, acquires, and produces oil and natural gas properties for our own account. Contract Drilling carried out by our subsidiary Unit Drilling Company and its subsidiaries. This segment contracts to drill onshore oil and natural gas wells for others, and for our own account. Mid-Stream carried out by our subsidiary Superior Pipeline Company, L.L.C. and its subsidiaries. This segment buys, sells, gathers, processes, and treats natural gas for third parties and for our own account. Each of these companies may conduct operations through subsidiaries of their own. The following table provides certain information about us as of February 14, 2014: Completed gross wells in which we own an interest... 9,842 Number of drilling rigs we own Number of natural gas treatment plants we own... 3 Number of processing plants we own Number of natural gas gathering systems we own
18 2013 SEGMENT OPERATIONS HIGHLIGHTS Oil and Natural Gas Attained net proved oil, NGLs, and natural gas reserves of million barrels of oil equivalents (MMBoe), a 7% increase over 2012 reserves. Increased net proved oil and NGLs reserves by 10% over Total production of 16.7 MMBoe or an 18% increase over Participated in the drilling of 149 wells. Sold non-core assets with proceeds of $78.8 million for the year. Contract Drilling Sold five 2,000-3,000 horsepower electric drilling rigs to unaffiliated third-parties. Launched our new drilling program to design and build new proprietary 1,500 horsepower AC electric drilling rigs, called the BOSS drilling rig. The first BOSS drilling rig is expected to be completed and put into service for our oil and natural gas segment during the first quarter of Moved two rigs into the Permian Basin of West Texas. Mid-Stream Gas gathered increased from 250,290 Mcf per day in 2012 to 309,554 Mcf per day in 2013, a 24% increase. Gas processed increased from 133,987 Mcf per day in 2012 to 140,584 Mcf per day in 2013, a 5% increase. Added 155 miles of pipeline (approximately a 12% increase) and connected 150 new wells to our various gathering systems. Completed construction of a new gathering and processing facility in south central Kansas, known as the Reno system, and the related installation of two gas processing plants which provide 25 MMcf per day total processing capacity. Completed the installation of a 30 MMcf per day plant at our Bellmon facility increasing our total processing capacity to 55 MMcf per day. Purchased a new 60 MMcf per day gas processing plant for our Bellmon system and began installation of this plant which was completed in February Completed the installation and upgrade of the Dove Creek processing plant at our Perkins facility increasing our processing capacity by 8 MMcf per day. Completed construction of a new gathering system in north-central Pennsylvania, known as the Brookfield system. Increased the contract mix as a percent of volume for fee-based contracts to 62% in 2013 from 39% in FINANCIAL INFORMATION ABOUT SEGMENTS See Note 17 of our Notes to Consolidated Financial Statements in Item 8 of this report for information with respect to each of our segment s revenues, profits or losses, and total assets. 2
19 OIL AND NATURAL GAS General. We began to develop our exploration and production operations in Today, our wholly owned subsidiary, Unit Petroleum Company, conducts our exploration and production activities. Our producing oil and natural gas properties, unproved properties, and related assets are in the following locations: Division West division... East division... Central division... Location Western and Southern Texas, Colorado, Wyoming, Montana, North Dakota, New Mexico, Southern Louisiana, and Mississippi East Texas, Eastern Oklahoma, Pennsylvania, Arkansas, and Northern Louisiana Western Oklahoma, Texas Panhandle and Kansas When we are the operator of a property, we generally attempt to use a drilling rig owned by our contract drilling segment, and we use our mid-stream segment to gather our gas if it is economical for us to develop a system in the area. The following table presents certain information regarding our oil and natural gas operations as of December 31, 2013: Our Divisions/Area Number of Gross Wells Number of Net Wells Number of Gross Wells in Process Number of Net Wells in Process Natural Gas (Mcf) 2013 Average Net Daily Production West division... 3, ,787 1,889 2,720 East division... 1, , Central division... 5,238 1, ,956 7,273 7,937 Total... 9,841 2, ,498 9,207 10,723 Oil (Bbls) NGLs (Bbls) As of December 31, 2013, we did not have any significant water floods, pressure maintenance operations, or any other material operations that were in process. Description and Location of Our Core Operations West division. In our Wilcox play, located primarily in Polk, Tyler, and Hardin Counties, Texas, we operated and completed eight gross wells in 2013 with an average working interest of 100% and a success rate of 88%. Five of the eight wells were completed in our Gilly Basal Wilcox field bringing the total number of wells completed in that field to ten at year end Production for 2013 increased 21% as compared to Our first horizontal Wilcox well was completed in the fourth quarter of 2013 at an initial daily rate of approximately 4.4 MMcf per day and 73 barrels of condensate per day from approximately 1,500 feet of Basal Wilcox lateral. There are currently two Unit rigs drilling in our Wilcox play with plans to add a third rig in the second half of the year, which should result in approximately 10 to 12 gross vertical wells and two to four horizontal wells at an approximate net cost of $112 million for East division. Over the last several years, activity in our East Division has been limited due to low gas prices since this area does not generally have oil or NGLs associated with the gas. Central division. In our Mississippian play in south central Kansas, the average daily production for 2013 increased approximately 218% as compared to We had first sales on eight Mississippian wells during 2013 with an average 30 day IP rate of 222 Boe per day consisting of an average of approximately 53% oil, 11% NGLs, and 36% natural gas with a 100% average working interest. The last four wells completed in the fourth quarter of 2013 had a significantly higher liquids cut consisting of approximately 79% oil, 6% NGLs, and 15% natural gas with an average 30 day IP rate of approximately 231 Boe per day. Two potential enhancements we may make to wells drilled in the play during 2014 are drilling extended lateral wells and testing different fracture stimulation designs. We have leased approximately 143,000 net acres in the play and are currently running two Unit drilling rigs and expect to spend approximately $111 million in
20 In the Marmaton horizontal oil play in Beaver County, Oklahoma, we had first sales on 41 horizontal wells during 2013 with an average 30 day IP rate of 371 Boe per day with an approximate average working interest of 75%. The average daily production for 2013 increased approximately 25% as compared to A decision from the Oklahoma Legislature to allow drilling extended lateral wells in the play is anticipated by May Two additional potential horizontal targets in the play are scheduled to be tested in We have leases on approximately 119,000 net acres and have two Unit rigs drilling in the play with current plans to spend approximately $70 million. In the Texas Panhandle District, which consists primarily of Granite Wash (GW) wells and to a lesser degree Cleveland wells, the average daily production for 2013 increased approximately 28% over We had first sales on 23 horizontal GW wells, having an average peak 30 day IP rate of 5.2 MMcfe per day and an average working interest of 85%. We also had first sales on three Cleveland wells with an average peak 30 day rate of 3.9 MMcfe per day at an average working interest of 80%. We recently completed drilling operations on three separate well pads located in different sections of the Buffalo Wallow GW field. Each pad has three wells resulting in nine total wells that will target five different GW sand intervals. Six of the wells have been fracture stimulated and the remaining three wells are scheduled to be fracture stimulated in the first quarter We plan to monitor production from these three pads for approximately 90 days prior to resuming pad drilling in the field. We plan to run three to five drilling Unit rigs in the GW play and one Unit rig in the Cleveland play for 2014 with plans to spend approximately $174 million. Dispositions and Acquisitions. There were no material dispositions during In September 2012, we sold our interest in certain Bakken properties (located in North Dakota). The proceeds, net of related expenses, were $226.6 million. In addition, we sold certain oil and natural gas assets located in Brazos and Madison Counties,Texas, for approximately $44.1 million. In August 2013, we sold additional Bakken property interests. The proceeds, net of related expenses, were $57.1 million. In addition, we had other non-core asset sales with proceeds, net of related expenses, of $21.7 million for Proceeds from these dispositions reduced the net book value of the full cost pool with no gain or loss recognized. On July 20, 2011, we acquired certain producing properties from an unaffiliated seller for approximately $12.3 million in cash, after post-closing adjustments, consisting of 30 operated wells and 59 non-operated well interests located in Beaver, Harper, and Ellis Counties, Oklahoma and Lipscomb County, Texas. The purchase price allocation was $8.4 million for proved properties and $3.9 million for acreage. The acquisition also included in excess of 12,000 net acres held by production available for future development. On August 31, 2011, we acquired certain producing oil and gas properties for $30.5 million in cash from an unaffiliated seller. Included in the acquisition were more than 500 wells located principally in the Oklahoma Arkoma Woodford and Hartshorne Coal plays along with other properties located throughout Oklahoma and Texas. The acquisition also included approximately 55,000 net acres of which 96% was held by production. On September 17, 2012, we acquired certain oil and natural gas assets from Noble. After final closing adjustments, the acquisition included approximately 83,000 net acres primarily in the Granite Wash, Cleveland, and various other plays in western Oklahoma and the Texas Panhandle. The adjusted amount paid was $592.6 million. As of the effective date of the Noble acquisition (April 1, 2012), the estimated proved reserves of the acquired properties were 44 MMBoe, The acquisition added approximately 24,000 net leasehold acres to our Granite Wash core area in the Texas Panhandle with significant potential including approximately 600 possible future horizontal drilling locations. The total acreage acquired in other plays in western Oklahoma and the Texas Panhandle was approximately 59,000 net acres and was characterized by high working interest and operatorship, 95% of which was held by production. We also received four gathering systems as part of the transaction, as well as other miscellaneous assets. 4
21 Well and Leasehold Data. The following tables identify certain information regarding our oil and natural gas exploratory and development drilling operations: Wells drilled: Exploratory: Oil: Year Ended December 31, Gross Net Gross Net Gross Net West division East division... Central division Total oil Natural gas: Dry: West division East division... Central division... Total natural gas West division East division... Central division... Development: Oil: Total dry Total exploratory West division East division... Central division Total oil Natural gas: Dry: West division East division Central division Total natural gas West division East division Central division Total dry Total development Total wells drilled
22 Wells producing or capable of producing: Oil: Year Ended December 31, Gross Net Gross Net Gross Net West division... 2, , , East division Central division Natural gas: Total oil... 2, , , West division... 1, , , East division... 1, , , Central division... 4,266 1, ,245 1, , Total natural gas 6,705 2, ,986 2, ,915 1, Total... 9,696 2, ,923 2, ,674 2, As of February 14, 2014, we are currently drilling or participating in 13 gross (9.66 net) wells started during Cost incurred for development drilling includes $136.7 million, $123.4 million, and $111.4 million in 2013, 2012, and 2011, respectively, to develop booked proved undeveloped oil and natural gas reserves. The following table summarizes our leasehold acreage at December 31, 2013: Year Ended December 31, 2013 Developed Undeveloped Total Gross Net Gross Net (1) Gross Net West division ,448 94, , , , ,321 East division ,054 87,908 57,707 17, , ,719 Central division , , , ,567 1,157, ,039 Total... 1,364, , , ,781 1,889, ,079 (1) Approximately 90% (West 83%; East 48%; and Central 97%) of the net undeveloped acres are covered by leases that will expire in the years unless drilling or production extends the terms of those leases. Currently, we do not have any material proved undeveloped (PUD) reserves attributable to acreage where the expiration date precedes the scheduled PUD reserve development plan. 6
23 Price and Production Data. The following tables identify the average sales price, production volumes, and average production cost per equivalent barrel for our oil, NGLs, and natural gas production for the years indicated: Year Ended December 31, Average sales price per barrel of oil produced: Price before hedging... $ $ $ Effect of hedging... (0.12) 2.41 (6.31) Price including hedging... $ $ $ Average sales price per barrel of NGLs produced: Price before hedging... $ $ $ Effect of hedging (0.80) Price including hedging... $ $ $ Average sales price per Mcf of natural gas produced: Price before hedging... $ 3.33 $ 2.53 $ 3.78 Effect of hedging... (0.01) Price including hedging... $ 3.32 $ 3.37 $
24 Year Ended December 31, Oil production (MBbls): West division , East division Central division:... Mendota field All other central division fields... 2,242 1,695 1,344 Total central division... 2,654 2,192 1,606 Total oil production (MBbls)... 3,360 3,279 2,511 NGLs production (MBbls): West division East division Central division:... Mendota field... 1,050 1, All other central division fields... 1, Total central division... 2,897 1,915 1,436 Total NGLs production (MBbls)... 3,914 2,796 2,239 Natural gas production (MMcf): West division... 13,062 11,831 11,774 East division... 9,401 11,906 12,768 Central division:... Mendota field... 9,138 8,957 4,887 All other central division fields... 25,156 16,236 14,675 Total central division... 34,294 25,193 19,562 Total natural gas production (MMcf)... 56,757 48,930 44,104 Total production (MBoe): West division... 3,860 3,901 3,653 East division... 1,607 2,023 2,145 Central division:... Mendota field... 2,985 3,118 1,768 All other central division fields... 8,282 5,188 4,535 Total central division... 11,267 8,306 6,303 Total production (MBoe)... 16,734 14,230 12,101 Average production cost per equivalent Bbl (1)... $ 7.63 $ 7.00 $ 6.90 (1) Excludes ad valorem taxes and gross production taxes. Our Mendota field, located in the Granite Wash play, includes 18%, 19%, and 22%, respectively of our total proved reserves in 2013, 2012, and 2011, respectively, expressed on an oil equivalent barrels basis, and is the only field that is greater than 15% of our proved reserves. 8
25 Oil, NGLs, and Natural Gas Reserves. The following table identifies our estimated proved developed and undeveloped oil, NGLs, and natural gas reserves: Oil (MBbls) Year Ended December 31, 2013 NGLs (MBbls) Natural Gas (MMcf) Total Proved Reserves (MBoe) Proved developed: West division... 3,244 5,981 79,760 22,518 East division ,891 16,381 Central division... 12,312 24, ,583 84,504 Total proved developed... 15,594 30, , ,403 Proved undeveloped: West division ,121 2,278 East division... 9,428 1,571 Central division... 5,846 10, ,001 32,682 Total proved undeveloped... 6,171 10, ,550 36,531 Total proved... 21,765 41, , ,934 Oil, NGLs, and natural gas reserves cannot be measured exactly. Estimates of oil, NGLs, and natural gas reserves require extensive judgments of reservoir engineering data and are generally less precise than other estimates made in connection with financial disclosures. We use Ryder Scott Company L.P. (Ryder Scott), independent petroleum consultants, to audit the reserves prepared by our reservoir engineers. Ryder Scott has been providing petroleum consulting services throughout the world for over seventy years. Their summary report is attached as Exhibit 99.1 to this Form 10-K. The wells or locations for which reserve estimates were audited were taken from reserve and income projections prepared by us as of December 31, 2013 and comprised 84% of the total proved developed discounted future net income and 91% of the total proved undeveloped discounted future net income (based on the unescalated pricing policy of the SEC). Our Reservoir Engineering department is responsible for reserve determination for the wells in which we have an interest. Their primary objective is to estimate the wells' future reserves and future net value to us. Data is incorporated from multiple sources including geological, production engineering, marketing, production, land, and accounting departments. The engineers are responsible for reviewing this information for accuracy as it is incorporated into the reservoir engineering database. Our internal audit group reviews the controls to help provide assurance all the data has been provided. New well reserve estimates are provided to management as well as the respective operational divisions for additional scrutiny. Major reserve changes on existing wells are reviewed on a regular basis with the operational divisions to confirm correctness and accuracy. As the external audit is being completed by Ryder Scott, the reservoir department performs a final review of all properties for accuracy of forecasting. Technical Qualifications Ryder Scott Mr. Fred P. Richoux is the primary technical person in charge on behalf of Ryder Scott for their audit of our reserves. Mr. Richoux, an employee of Ryder Scott since 1978, is the President and member of the Board of Directors at Ryder Scott. He is responsible for coordinating and supervising staff and consulting engineers of the company in ongoing reservoir evaluation studies worldwide as well as other administrative functions at the Company. Before joining Ryder Scott, Mr. Richoux served in a number of engineering positions with Phillips Petroleum Company. Mr. Richoux earned a Bachelor of Science degree in Electrical Engineering from the University of Louisiana at Lafayette and is a registered Professional Engineer in the State of Texas and the Province of Alberta. He is also a member of the Society of Petroleum Engineers and the Society of Petroleum Evaluation Engineers. 9
26 In addition to gaining experience and competency through prior work experience, the Texas Board of Professional Engineers requires a minimum of fifteen hours of continuing education annually, including at least one hour in the area of professional ethics, which Mr. Richoux fulfills. Based on his educational background, professional training and more than 45 years of practical experience in the estimation and evaluation of petroleum reserves, Mr. Richoux has attained the professional qualifications as a Reserves Estimator (requires appropriate degree and/or is registered as Professional Engineer and has a minimum of 3 years experience in the estimation and evaluation of reserves) and Reserves Auditor (requires appropriate degree and/or is registered as Professional Engineer and has a minimum of 10 years experience in the estimation and evaluation of reserves of which at least 5 years of such experience is being in responsible charge of the estimation and evaluation of reserves) set forth in Article III of the Standards Pertaining to the Estimating and Auditing of Oil and Gas Reserves Information promulgated by the Society of Petroleum Engineers as of February 19, For more information regarding Mr. Richoux s geographic and job specific experience, please refer to the Ryder Scott Company website at The Company Responsibility for overseeing the preparation of our reserve report is shared by our reservoir engineers Trenton Mitchell and Robert Lyon. Mr. Mitchell earned a Bachelor of Science degree in Petroleum Engineering from Texas A&M University in He has been an employee of Unit since Initially, he was the Outside Operated Engineer and since 2003 he has served in the capacity of Reservoir Engineer and in 2010 he was promoted to Manager of Reservoir Engineering. Before joining Unit, he served in a number of engineering field and technical support positions with Schlumberger Well Services in their pumping services segment (formerly Dowell Schlumberger). He obtained his Professional Engineer registration from the State of Oklahoma in 2004 and has been a member of Society of Petroleum Engineers (SPE) since Mr. Lyon received a Bachelor of Science degree in Petroleum Engineering from the University of Tulsa in 1972 and has spent 34 of his 41 years in the industry directly involved in reserve calculation work. Included in this time were 15 years working for petroleum consulting firms Raymond F. Kravis and Associates and Southmayd and Associates performing independent reserve appraisals and audits for corporations and individuals. He joined Unit in 1996 and has shared responsibility for preparation of the company s reserve report since that time. Mr. Lyon is a registered professional engineer in the State of Oklahoma and a member of the SPE. As part of the continuing education requirement for maintaining their professional licenses Mr. Mitchell and Mr. Lyon have attended various seminars and forums to enhance their understanding of current standards and issues for reserves presentation. These forums have included those sponsored by various professional societies and professional service firms including Ryder Scott. Definitions and Other. Proved oil, NGLs, and natural gas reserves, as defined in SEC Rule 4-10(a), are those quantities of oil and gas, which, by analysis of geoscience and engineering data, can be estimated with reasonable certainty to be economically producible from a given date forward, from known reservoirs and under existing economic conditions, operating methods and government regulations before the time the contracts providing the right to operate expire, unless evidence indicates that renewal is reasonably certain, regardless of whether deterministic or probabilistic methods are used for estimation. The project to extract the hydrocarbons must have commenced or the operator must be reasonably certain that it will commence the project within a reasonable time. The area of the reservoir considered as proved includes: The area identified by drilling and limited by fluid contacts, if any, and Adjacent undrilled portions of the reservoir that can, with reasonable certainty, be judged to be continuous with it and to contain economically producible oil or gas on the basis of available geosciences and engineering data. In the absence of data on fluid contacts, proved quantities in a reservoir are limited by the lowest known hydrocarbons as seen in a well penetration unless geosciences, engineering or performance data and reliable technology establishes a lower contact with reasonable certainty. Where direct observation from well penetrations has defined a highest known oil elevation and the potential exists for an associated gas cap, proved oil reserves may be assigned in the structurally higher portions of the reservoir only if geosciences, engineering or performance data and reliable technology establish the higher contact with reasonable certainty. 10
27 Reserves which can be produced economically through application of improved recovery techniques (including, but not limited to, fluid injection) are included in the proved classification when: Successful testing by a pilot project in an area of the reservoir with properties no more favorable than in the reservoir as a whole; The operation of an installed program in the reservoir or other evidence using reliable technology establishes reasonable certainty of the engineering analysis on which the project or program was based; and The project has been approved for development by all necessary parties and entities, including governmental entities. Existing economic conditions include prices and costs at which economic producibility from a reservoir is to be determined. The price is the average price during the 12-month period before the ending date of the period covered by the report, determined as an unweighted arithmetic average of the first day of month price for each month within the period, unless prices are defined by contractual arrangements, excluding escalations based on future conditions. Proved undeveloped oil, NGLs, and natural gas reserves are proved reserves that are expected to be recovered from new wells on undrilled acreage, or from existing wells where a relatively major expenditure is required for completion. Reserves on undrilled acreage are limited to those directly offsetting development spacing areas that are reasonably certain of production when drilled, unless evidence using reliable technology exists that establishes reasonable certainty of economic producibility at greater distances. Undrilled locations can be classified as having undeveloped reserves only if a development plan has been adopted indicating that they are scheduled to be drilled within five years, unless the specific circumstances, justify a longer time. Under no circumstances can estimates for proved undeveloped reserves be attributable to any acreage for which an application of fluid injection or other improved recovery technique is contemplated, unless such techniques have been proved effective by actual projects in the same reservoir or an analogous reservoir, or by other evidence using reliable technology establishing reasonable certainty. Proved Undeveloped Reserves. As of December 31, 2013, we had approximately 180 gross proved undeveloped wells all of which we plan to develop within five years of initial disclosure at a net estimated cost of approximately $508.3 million. The future estimated development costs necessary to develop our proved undeveloped oil and natural gas reserves in the United States for the years , as disclosed in our December 31, 2013 oil and natural gas reserve report, are $238.3 million, $185.4 million, $25.1 million, and $59.5 million, respectively. Our proved undeveloped reserves reported at December 31, 2013 did not include reserves that we did not expect to develop within five years of initial disclosure of those reserves. During 2013, we added new PUD reserves through extensions and discoveries representing 4.1 MMBls of oil, 5.0 MMBls of NGLs, and 52.7 Bcf of natural gas. We converted 47 proved undeveloped wells into proved developed wells at a cost of approximately $136.7 million. The proved undeveloped reserves that were converted to proved developed reserves during 2013, represented 1.8 MMBls of oil, 2.6 MMBls of NGLs, and 21.6 Bcf of natural gas. There were no other material changes to the PUD reserves. Our estimated proved reserves and the standardized measure of discounted future net cash flows of the proved reserves at December 31, 2013, 2012, and 2011, the changes in quantities, and standardized measure of those reserves for the three years then ended, are shown in the Supplemental Oil and Gas Disclosures included in Item 8 of this report. Contracts. Our oil production is sold at or near our wells under purchase contracts at prevailing prices in accordance with arrangements customary in the oil industry. Our natural gas production is sold to intrastate and interstate pipelines as well as to independent marketing firms under contracts with terms generally ranging from one month to a year. Few of these contracts contain provisions for readjustment of price as most of them are market sensitive. Customers. During 2013, sales to Valero Energy Corporation accounted for 25% of our oil and natural gas revenues. There was no other company that accounted for more than 10% of our oil and natural gas revenues. During 2013, our midstream segment purchased $83.0 million of our natural gas and NGLs production and provided gathering and transportation services of $8.0 million. Intercompany revenue from services and purchases of production between our mid-stream segment and our oil and natural gas segment has been eliminated in our consolidated financial statements. In 2012 and 2011, we eliminated intercompany revenues of $73.3 million and $76.1 million, respectively, attributable to the intercompany purchase of our production of natural gas and NGLs as well as gathering and transportation services. 11
28 CONTRACT DRILLING General. Our contract drilling business is conducted through Unit Drilling Company and its subsidiary Unit Texas Drilling L.L.C. Through these companies we drill onshore oil and natural gas wells for our own account as well as other oil and natural gas companies. Our drilling operations are located in Oklahoma, Texas, Louisiana, Kansas, Wyoming, Colorado, Utah, Montana, and North Dakota. The following table identifies certain information concerning our contract drilling operations: Year Ended December 31, Number of drilling rigs owned at year end Average number of drilling rigs owned during year Average number of drilling rigs utilized Utilization rate (1)... 52% 58% 61% Average revenue per day (2)... $ 17,486 $ 19,774 $ 17,520 Total footage drilled (feet in 1,000 s)... 10,578 10,551 9,749 Number of wells drilled (1) Utilization rate is determined by dividing the average number of drilling rigs used by the average number of drilling rigs owned during the year. (2) Represents the total revenues minus rental revenue from our contract drilling operations divided by the total number of days our drilling rigs were used minus the rental days during the year. Description and Location of Our Drilling Rigs. An on-shore drilling rig is composed of major equipment components like engines, drawworks or hoists, derrick or mast, substructure, pumps to circulate the drilling fluid, blowout preventers, and drill pipe. As a result of the normal wear and tear from operating 24 hours a day, several of the major components, like engines, mud pumps, and drill pipe, must be replaced or rebuilt on a periodic basis. Other major components, like the substructure, mast, and drawworks, can be used for extended periods of time with proper maintenance. We also own additional equipment used in the operation of our drilling rigs, including top drives, skidding systems, large air compressors, trucks, and other support equipment. The maximum depth capacities of our various drilling rigs range from 5,000 to 40,000 feet. In 2013, 78 of our 121 drilling rigs were used in drilling services. The following table shows certain information about our drilling rigs (including their distribution) as of February 14, 2014: Non- Contracted Rigs Average Rated Drilling Depth (ft) Divisions Contracted Rigs Total Rigs Mid-Continent ,879 Woodward ,719 Panhandle ,885 Gulf Coast ,929 Rocky Mountain ,188 Totals ,017 Drilling rig utilization steadily increased throughout 2011 and through the first quarter of It began declining from the second quarter of 2012 and throughout the remainder of 2012 with utilization remaining relatively flat throughout Factors contributing to the fluctuating utilization include drilling efficiencies attained by operators, more acreage in certain 12
29 plays being held by production, and weakness in commodity prices. Our active drilling rig count at the start of 2011 was 72 drilling rigs. It decreased to 62 rigs at the end of 2012 and finished out 2013 at 65. Mid-Continent, Woodward, and Panhandle We have long held a strong position and market presence in the midcontinent area of Oklahoma and the Texas Panhandle. This area is commonly referred to as the Anadarko Basin, which also encompasses portions of Kansas. Historically, the Anadarko Basin has been known as a gas producing area, but it is also rich in oil and NGL production. During the last several years operators have focused their operations in this basin on the Cana Woodford, Granite Wash, Marmaton, and Mississippian horizontal plays. Three of our divisions work in this basin. During 2013, our Mid-Continent, Panhandle, and Woodward divisions averaged 22.0, 9.5, and 10.3 drilling rigs operating, respectively. Gulf Coast Our Gulf Coast division provides drilling rigs to the onshore areas of Louisiana, Texas Gulf Coast, East Texas, South Texas. Recently two drilling rigs were moved into the Permian Basin of West Texas. During 2013, this division averaged 6.7 drilling rigs operating. Within this division, our largest drilling rig, Rig 201, a 4,000 horsepower rig rated to drill to 40,000 feet, drilled an ultra-deep exploration well for a major oil company in south Louisiana, establishing the record for the deepest onshore well in the state of Louisiana. Rocky Mountains Our Rocky Mountain division covers several states, including Colorado, Utah, Wyoming, Montana, and North Dakota. This vast area has produced a number of conventional and unconventional oil and gas fields. This division operated an average of 16.5 drilling rigs during We had six drilling rigs operating in the Pinedale Anticline of western Wyoming and ten drilling rigs operating in the Bakken Shale of North Dakota at the end of At any given time the number of drilling rigs we can work depends on a number of conditions besides demand, including the availability of qualified labor and the availability of needed drilling supplies and equipment. The impact of these conditions tends to increase with increased demand for our drilling rigs. Our average utilization rate for 2011, 2012, and 2013 was 61%, 58%, and 52%, respectively. The following table shows the average number of our drilling rigs working by quarter for the years indicated: First quarter Second quarter Third quarter Fourth quarter Drilling Rig Fleet. The following table summarizes the changes made to our drilling rig fleet in A more complete discussion of the changes follows the table: Drilling rigs owned at December 31, Drilling rigs sold... (5) Drilling rigs removed from service... (1) Drilling rigs purchased... Drilling rigs constructed... Total drilling rigs owned at December 31, Dispositions, Acquisitions, and Construction. During 2011, we were awarded two new build drilling rig contracts for 1,500 horsepower, diesel-electric drilling rigs. One was placed into service during the fourth quarter of 2011 and the other was placed in service during the first quarter of 2012, both in Wyoming. During the first quarter of 2012, we sold an idle 600 horsepower mechanical drilling rig to an unaffiliated third-party. In the second quarter we placed a new 1,500 horsepower, diesel-electric drilling rig to work in North Dakota under a three year contract. 13
30 During the third quarter of 2012, we had a fire on one of our drilling rigs located in the mid-continent region. The net book value of the damaged equipment was $3.2 million. All of the net book value of the damaged equipment was recovered from insurance proceeds. No personnel were injured in this incident. In the second quarter of 2013, we sold one of our 2,000 horsepower electric drilling rigs. During the third and fourth quarters of 2013, we sold three additional 2,000 horsepower and one 3,000 horsepower electric drilling rigs. All of these sales were to unaffiliated third-parties. Four additional idle 3,000 horsepower drilling rigs were sold to an unaffiliated third party in the first quarter of 2014 all of which were classified as assets held for sale at December 31, The proceeds from these various sales will be used in our new drilling rig program we launched to design and build a new proprietary 1,500 horsepower, AC electric drilling rig, called the BOSS rig. We anticipate the BOSS drilling rig will position us to more effectively meet the demands of our existing customers as well as allowing us to compete for the work of new customers. The first BOSS drilling rig will be operational the first quarter of 2014 and will work initially for our oil and natural gas segment. Two additional BOSS drilling rigs are contracted to third party operators and are anticipated to be placed into service in the second and third quarters of Drilling Contracts. Our drilling contracts are generally obtained through competitive bidding on a well by well basis. Contract terms and payment rates vary depending on the type of contract used, the duration of the work, the equipment and services supplied, and other matters. We pay certain operating expenses, including the wages of our drilling rig personnel, maintenance expenses, and incidental drilling rig supplies and equipment. The contracts are usually subject to early termination by the customer subject to the payment of a fee. Our contracts also contain provisions regarding indemnification against certain types of claims involving injury to persons, property, and for acts of pollution. The specific terms of these indemnifications are subject to negotiation on a contract by contract basis. The type of contract used determines our compensation. Contracts are generally one of three types: daywork; footage; or turnkey. Additional compensation may be acquired for special risks and unusual conditions. Under a daywork contract, we provide the drilling rig with the required personnel and the operator supervises the drilling of the well. Our compensation is based on a negotiated rate to be paid for each day the drilling rig is used. Footage contracts usually require us to bear some of the drilling costs in addition to providing the drilling rig. We are paid on completion of the well at a negotiated rate for each foot drilled. We did not have any footage or turnkey contracts in 2013, 2012, or Under turnkey contracts we drill the well to a specified depth for a set amount and provide most of the required equipment and services. We bear the risk of drilling the well to the contract depth and are paid when the contract provisions are completed. We may incur losses if we underestimate the costs to drill the well or if unforeseen events occur that increase our costs or result in the loss of the well. All of our work during the last three years was under daywork contracts. Because market demand for our drilling rigs as well as the desires of our customers determine the types of contracts we use, we cannot predict when and if a part of our drilling will be conducted under footage or turnkey contracts. The majority of our contracts are on a well-to-well basis, with the rest under term contracts. Term contracts range from six months to three years and the rates can either be fixed throughout the term or allow for periodic adjustments. Customers. During 2013, QEP Resources, Inc. and Kodiak Oil and Gas Corp. were our largest drilling customers accounting for approximately 18% and 10%, respectively, of our total contract drilling revenues. Our work for these customers was under multiple contracts and our business was not substantially dependent on any of these individual contracts. Consequently, none of these individual contracts were considered to be material. No other third party customer accounted for 10% or more of our contract drilling revenues. Our contract drilling segment also provides drilling services for our oil and natural gas segment. During 2013, 2012, and 2011, our contract drilling segment drilled 105, 78, and 81 wells, respectively, or 13%, 10%, and 11%, respectively, of the total wells drilled for our oil and natural gas segment. Depending on the timing of the drilling services performed on our properties those services may be deemed, for financial reporting purposes, to be associated with the acquisition of an ownership interest in the property. Revenues and expenses for these services are eliminated in our income statement, with any profit recognized reducing our investment in our oil and natural gas properties. The contracts for these services are issued under the similar terms and rates as the contracts entered into with unrelated third parties. By providing drilling services for the oil and natural gas segment, we eliminated revenue of $64.3 million, $49.6 million, and $52.2 million during 2013, 2012, and 2011, respectively, from our contract drilling segment and eliminated the associated operating expense of $46.9 million, $34.1 million, and $
31 million during 2013, 2012, and 2011, respectively, yielding $17.4 million, $15.5 million, and $19.6 million during 2013, 2012, and 2011, respectively, as a reduction to the carrying value of our oil and natural gas properties. MID-STREAM General. Our mid-stream operations are conducted through Superior Pipeline Company L.L.C. and its subsidiaries. Its operations consist of buying, selling, gathering, processing, and treating natural gas. It operates three natural gas treatment plants, 15 processing plants, 38 active gathering systems, and approximately 1,500 miles of pipeline. Superior and its subsidiaries operate in Oklahoma, Texas, Kansas, Pennsylvania, and West Virginia. The following table presents certain information regarding our mid-stream segment for the years indicated: Year Ended December 31, Gas gathered Mcf/day , , ,569 Gas processed Mcf/day , ,987 92,940 NGLs sold gallons/day , , ,064 Dispositions and Acquisitions This segment did not have any significant dispositions or acquisitions during 2011 or Included within the previously discussed acquisition of certain oil and natural gas assets from Noble were four gathering systems. These systems were transferred into our mid-stream segment. The cost for the systems was $18.7 million. Subsequently in 2013, one of these gathering systems was transferred to our oil and natural gas segment. In December 2012, our mid-stream segment had a $1.2 million write down of its Erick system in conjunction with the shut down of this system. Contracts. Our mid-stream segment provides its customers with a full range of gathering, processing, and treating services. These services are usually provided to each customer under long-term contracts (more than one year), but we do have some short-term contracts as well. Our customer agreements include the following types of contracts: Fee-Based Contracts. These contracts provide for a set fee for gathering and transporting raw natural gas. Our midstream s revenue is a function of the volume of natural gas that is gathered or transported and is not directly dependent on the value of the natural gas. For the year ended December 31, 2013, 62% of our mid-stream segment s total volumes and 37% of its operating margins (as defined below) were under fee-based contracts. Percent of Proceeds Contracts (POP). These contracts provide for our mid-stream segment to retain a negotiated percentage of the sale proceeds from residue natural gas and NGLs it gathers and processes, with the remainder being paid to the producer. In this arrangement, Superior and the producer each own a portion of the commodity and are directly dependent on the volume and value of the commodity both of which fluctuate. For the year ended December 31, 2013, 36% of our mid-stream segment s total volumes and 59% of operating margins (as defined below) were under POP contracts. Percent of Index Contracts (POI). Under these contracts our mid-stream segment, as the processor, purchases raw well-head natural gas from the producer at a stipulated index price and, after processing the natural gas, sells the processed residual gas and the produced NGLs to third parties. Our mid-stream segment is subject to the economic risk (processing margin risk) that the aggregate proceeds from the sale of the processed natural gas and the NGLs could be less than the amount paid for the unprocessed natural gas. For the year ended December 31, 2013, 2% of our mid-stream segment s total volumes and 4% of operating margins (as defined below) were under POI contracts. For each of the above contracts, operating margin is defined as total operating revenues less operating expenses and does not include depreciation and amortization, general and administrative expenses, interest expense, or income taxes. Customers. During 2013, ONEOK, Inc. and Tenaska Resources, LLC accounted for approximately 50% and 16%, respectively, of our mid-stream revenues. We believe that if we lost one or both of these identified customers, there are other 15
32 customers available to purchase our gas and NGLs. During 2013, 2012, and 2011 this segment purchased $83.0 million, $68.2 million, and $71.5 million, respectively, of our oil and natural gas segment's natural gas and NGLs production, and provided gathering and transportation services of $8.0 million, $5.1 million, and $4.6 million, respectively. Intercompany revenue from services and purchases of production between this business segment and our oil and natural gas segment has been eliminated in our consolidated financial statements. VOLATILE NATURE OF OUR BUSINESS The prevailing prices for oil, NGLs, and natural gas significantly affect our revenues, operating results, cash flow as well as our ability to grow our operations. Historically, oil, NGLs, and natural gas prices have been volatile and we expect them to continue to be so. For each of the periods indicated, the following table shows the highest and lowest average prices our oil and natural gas segment received for its sales of oil, NGLs, and natural gas without taking into account the effect of our hedging activity: Oil Price per Bbl NGLs Price per Bbl Natural Gas Price per Mcf Quarter High Low High Low High Low 2013 Fourth... $ $ $ $ $ 3.36 $ 3.08 Third... $ $ $ $ $ 3.33 $ 2.79 Second... $ $ $ $ $ 4.04 $ 3.73 First... $ $ $ $ $ 3.20 $ Fourth... $ $ $ $ $ 3.57 $ 2.54 Third... $ $ $ $ $ 2.78 $ 2.19 Second... $ $ $ $ $ 2.34 $ 1.65 First... $ $ $ $ $ 2.80 $ Fourth... $ $ $ $ $ 3.46 $ 3.16 Third... $ $ $ $ $ 4.30 $ 3.68 Second... $ $ $ $ $ 4.04 $ 3.83 First... $ $ $ $ $ 4.11 $ 3.53 Prices for oil, NGLs, and natural gas are subject to wide fluctuations in response to relatively minor changes in the actual or perceived supply of and demand for oil and natural gas, market uncertainty, and a variety of additional factors that are beyond our control, including: political conditions in oil producing regions; the ability of the members of the Organization of Petroleum Exporting Countries to agree on prices and their ability to maintain production quotas; actions taken by foreign oil and natural gas producing nations; the price of foreign oil imports; imports and exports of liquefied natural gas; actions of governmental authorities; the domestic and foreign supply of oil, NGLs, and natural gas; the level of consumer demand; United States storage levels of natural gas; weather conditions; domestic and foreign government regulations; 16
33 the price, availability, and acceptance of alternative fuels; volatility in ethane prices causing rejection of ethane as part of the liquids processed stream; and worldwide economic conditions. These factors and the volatile nature of the energy markets make it impossible to predict with any certainty the future prices of oil, NGLs, and natural gas. You are encouraged to read the Risk Factors discussed in Item 1A of this report for additional risks that can impact our operations. Our contract drilling operations are dependent on the level of demand in our operating markets. Both short-term and longterm trends in oil, NGLs, and natural gas prices affect demand. Because oil, NGLs, and natural gas prices are volatile, the level of demand for our services can also be volatile. Our mid-stream operations provide us greater flexibility in delivering our (and other parties) natural gas and NGLs from the wellhead to major natural gas and NGLs pipelines. Margins received for the delivery of these natural gas and NGLs are dependent on the price for oil, NGLs, and natural gas and the demand for natural gas and NGLs in our area of operations. If the price of NGLs falls without a corresponding decrease in the cost of natural gas, it may become uneconomical to us to extract certain NGLs. The volumes of natural gas and NGLs processed are highly dependent on the volume and Btu content of the natural gas and NGLs gathered. It is possible that the current industry shift in drilling for oil and NGLs may at some point impact future natural gas availability as well as prices for natural gas. In addition, the increasing availability of oil and NGLs may impact the price for these products if supply was to exceed demand. COMPETITION All of our businesses are highly competitive and price sensitive. Competition in the contract drilling business traditionally involves factors such as demand, price, efficiency, condition of equipment, availability of labor and equipment, reputation, and customer relations. Our oil and natural gas operations likewise encounter strong competition from other oil and natural gas companies. Many of these competitors have greater financial, technical, and other resources than we do and have more experience than we do in the exploration for and production of oil and natural gas. Our continued drilling success and the success of other activities integral to our operations will depend, in part, on our ability to attract and retain experienced geologists, engineers, and other professionals. Competition for these professionals can be extremely intense, particularly when the industry is experiencing favorable conditions. Our mid-stream segment competes with purchasers and gatherers of all types and sizes, including those affiliated with various producers, other major pipeline companies, as well as independent gatherers for the right to purchase natural gas and NGLs, build gathering and processing systems, and deliver the natural gas and NGLs once the gathering and processing systems are established. The principal elements of competition include the rates, terms, and availability of services, reputation, and the flexibility and reliability of service. OIL AND NATURAL GAS PROGRAMS AND CONFLICTS OF INTEREST Unit Petroleum Company serves as the general partner of 16 oil and natural gas limited partnerships. Three of these partnerships were formed in 1984 and 1986 for investment by third parties and 13 (the employee partnerships) were formed each year beginning with 1984 and ending with 2011 to allow our employees and directors the opportunity to participate with Unit Petroleum Company in its operations. The employee partnerships formed in 1984 through 1999 have been combined into a single consolidated partnership. The employee partnerships each have a set annual percentage (ranging from 1% to 15%) of our interest that the partnership acquires in most of the oil and natural gas wells we drill or acquire for our own account during the year in which the partnership was formed. The total interest the participants have in our oil and natural gas wells by participating in these partnerships does not exceed one percent of our interest in the wells. 17
34 Under the terms of our partnership agreements, the general partner has broad discretionary authority to manage the business and operations of the partnership, including the authority to make decisions regarding the partnership s participation in a drilling location or a property acquisition, the partnership s expenditure of funds, and the distribution of funds to partners. Because the business activities of the limited partners and the general partner are not the same, conflicts of interest will exist and it is not possible to entirely eliminate these conflicts. Additionally, conflicts of interest may arise when we are the operator of an oil and natural gas well and also provide contract drilling services. In these cases, the drilling operations are conducted under drilling contracts containing terms and conditions comparable to those contained in our drilling contracts with nonaffiliated operators. We believe we fulfill our responsibility to each contracting party and comply fully with the terms of the agreements which regulate these conflicts. These partnerships are further described in Notes 2 and 10 to the Consolidated Financial Statements in Item 8 of this report. EMPLOYEES As of February 14, 2014, we had approximately 1,901 employees in our contract drilling segment, 351 employees in our oil and natural gas segment, 132 employees in our mid-stream segment, and 79 in our general corporate area. None of our employees are members of a union or labor organization nor have our operations ever been interrupted by a strike or work stoppage. We consider relations with our employees to be satisfactory. GOVERNMENTAL REGULATIONS Our business depends on the demand for services from the oil and natural gas exploration and development industry, and therefore our business can be affected by political developments and changes in laws and regulations that control or curtail drilling for oil and natural gas for economic, environmental, or other policy reasons. Various state and federal regulations affect the production and sale of oil and natural gas. All states in which we conduct activities impose varying restrictions on the drilling, production, transportation, and sale of oil and natural gas. Under the Natural Gas Act of 1938, the Federal Energy Regulatory Commission (the FERC) regulates the interstate transportation and the sale in interstate commerce for resale of natural gas. The FERC s jurisdiction over interstate natural gas sales has been substantially modified by the Natural Gas Policy Act under which the FERC continued to regulate the maximum selling prices of certain categories of gas sold in first sales in interstate and intrastate commerce. Effective January 1, 1993, however, the Natural Gas Wellhead Decontrol Act (the Decontrol Act) deregulated natural gas prices for all first sales of natural gas. Because first sales include typical wellhead sales by producers, all natural gas produced from our natural gas properties is sold at market prices, subject to the terms of any private contracts which may be in effect. The FERC s jurisdiction over interstate natural gas transportation is not affected by the Decontrol Act. Our sales of natural gas will be affected by intrastate and interstate gas transportation regulation. Beginning in 1985, the FERC adopted regulatory changes that have significantly altered the transportation and marketing of natural gas. These changes are intended by the FERC to foster competition by, among other things, transforming the role of interstate pipeline companies from wholesale marketers of natural gas to the primary role of gas transporters. All natural gas marketing by the pipelines is required to divest to a marketing affiliate, which operates separately from the transporter and in direct competition with all other merchants. As a result of the various omnibus rulemaking proceedings in the late 1980s and the subsequent individual pipeline restructuring proceedings of the early to mid-1990s, interstate pipelines must provide open and nondiscriminatory transportation and transportation-related services to all producers, natural gas marketing companies, local distribution companies, industrial end users, and other customers seeking service. Through similar orders affecting intrastate pipelines that provide similar interstate services, the FERC expanded the impact of open access regulations to certain aspects of intrastate commerce. FERC has pursued other policy initiatives that have affected natural gas marketing. Most notable are (1) the large-scale divestiture of interstate pipeline-owned gas gathering facilities to affiliated or non-affiliated companies; (2) further development of rules governing the relationship of the pipelines with their marketing affiliates; (3) the publication of standards relating to the use of electronic bulletin boards and electronic data exchange by the pipelines to make available transportation information on a timely basis and to enable transactions to occur on a purely electronic basis; (4) further review of the role of the secondary market for released pipeline capacity and its relationship to open access service in the primary market; and (5) development of 18
35 policy and promulgation of orders pertaining to its authorization of market-based rates (rather than traditional cost-of-service based rates) for transportation or transportation-related services upon the pipeline s demonstration of lack of market control in the relevant service market. As a result of these changes, independent sellers and buyers of natural gas have gained direct access to the particular pipeline services they need and are better able to conduct business with a larger number of counter parties. We believe these changes generally have improved the access to markets for natural gas while, at the same time, substantially increasing competition in the natural gas marketplace. However, we cannot predict what new or different regulations the FERC and other regulatory agencies may adopt or what effect subsequent regulations may have on production and marketing of natural gas from our properties. Although in the past Congress has been very active in the area of natural gas regulation as discussed above, the more recent trend has been in favor of deregulation and the promotion of competition in the natural gas industry. Thus, in addition to first sales deregulation, Congress also repealed incremental pricing requirements and natural gas use restraints previously applicable. There continually are legislative proposals pending in the Federal and state legislatures which, if enacted, would significantly affect the petroleum industry. At the present time, it is impossible to predict what proposals, if any, might actually be enacted by Congress or the various state legislatures and what effect, if any, these proposals might have on the production and marketing of natural gas by us. Similarly, and despite the trend toward federal deregulation of the natural gas industry, whether or to what extent that trend will continue or what the ultimate effect will be on the production and marketing of natural gas by us cannot be predicted. Our sales of oil and natural gas liquids currently are not regulated and are at market prices. The prices received from the sale of these products are affected by the cost of transporting these products to market. Much of that transportation is through interstate common carrier pipelines. Effective as of January 1, 1995, the FERC implemented regulations generally grandfathering all previously approved interstate transportation rates and establishing an indexing system for those rates by which adjustments are made annually based on the rate of inflation, subject to certain conditions and limitations. These regulations may tend to increase the cost of transporting oil and natural gas liquids by interstate pipeline, although the annual adjustments could result in decreased rates in a given year. These regulations have generally been approved on judicial review. Every five years, the FERC will examine the relationship between the annual change in the applicable index and the actual cost changes experienced by the oil pipeline industry and make any necessary adjustment in the index to be used during the ensuing five years. We are not able to predict with certainty what effect, if any, the periodic review of the index by the FERC will have on us. Federal, state, and local agencies also have promulgated extensive rules and regulations applicable to our oil and natural gas exploration, production, and related operations. The states we operate in require permits for drilling operations, drilling bonds, and the filing of reports concerning operations and impose other requirements relating to the exploration of oil and natural gas. Many states also have statutes or regulations addressing conservation matters including provisions for the unitization or pooling of oil and natural gas properties, the establishment of maximum rates of production from oil and natural gas wells, and the regulation of spacing, plugging and, abandonment of such wells. The statutes and regulations of some states limit the rate at which oil and natural gas is produced from our properties. The federal and state regulatory burden on the oil and natural gas industry increases our cost of doing business and affects our profitability. Because these rules and regulations are amended or reinterpreted frequently, we are unable to predict the future cost or impact of complying with those laws. Our operations are subject to increasingly stringent federal, state, and local laws and regulations governing protection of the environment. These laws and regulations may require acquisition of permits before certain of our operations may be commenced and may restrict the types, quantities, and concentrations of various substances that can be released into the environment. Planning and implementation of protective measures are required to prevent accidental discharges. Spills of oil, natural gas liquids, drilling fluids, and other substances may subject us to penalties and cleanup requirements. Handling, storage, and disposal of both hazardous and non-hazardous wastes are subject to regulatory requirements. The federal Clean Water Act, as amended by the Oil Pollution Act, the federal Clean Air Act, the federal Resource Conservation and Recovery Act, and their state counterparts, are the primary vehicles for imposition of such requirements and for civil, criminal, and administrative penalties and other sanctions for violation of their requirements. In addition, the federal Comprehensive Environmental Response Compensation and Liability Act and similar state statutes impose strict liability, without regard to fault or the legality of the original conduct, on certain classes of persons who are considered responsible for the release of hazardous substances into the environment. Such liability, which may be imposed for the conduct of others and for conditions others have caused, includes the cost of remedial action as well as damages to natural resources. 19
36 The federal Endangered Species Act, referred to as the ESA, and analogous state laws regulate a variety of activities, including oil and gas development, which could have an adverse effect on species listed as threatened or endangered under the ESA or their habitats. The designation of previously unidentified endangered or threatened species could cause oil and natural gas exploration and production operators and service companies to incur additional costs or become subject to operating delays, restrictions or bans in affected areas, which impacts could adversely reduce the amount of drilling activities in affected areas. All three of our business segments could be subject to the effect of one or more species being listed as threatened or endangered within the areas of our operations. Numerous species have been listed or proposed for protected status in areas in which we provide or could in the future undertake operations. For instance, the American Burying Beetle and the Lesser Prairie-Chicken both have habitat in some areas where we operate or provide services. The U.S. Fish and Wildlife Service ( FWS ) identified the Lesser Prairie-Chicken as candidate for listing in 1998 and initiated the process to list it as threatened or endangered in November Its habitat is found in Colorado, Kansas, New Mexico, Oklahoma and Texas, and it is listed as threatened by the State of Colorado. On December 17, 2013 the FWS stated that it would make a decision on its final listing determination no later than March 30, The sage grouse and certain wildflower species, among others, are also species that have been or are being considered for protected status under the ESA and whose range can coincide with oil and natural gas production activities. The presence of protected species in areas where we provide contract drilling or mid-stream services or conduct exploration and production operations could impair our ability to timely complete or carry out those services and, consequently, adversely affect our results of operations and financial position. Climate Regulation. Recent scientific studies have suggested that emissions of certain gases, commonly referred to as greenhouse gases, or GHGs, may be contributing to warming of the Earth s atmosphere. As a result there have been a variety of regulatory developments, proposals or requirements, and legislative initiatives that have been introduced in the United States (as well as other parts of the World) that are focused on restricting the emission of carbon dioxide, methane, and other greenhouse gases. In 2007, the United States Supreme Court in Massachusetts, et al. v. EPA, held that carbon dioxide may be regulated as an air pollutant under the federal Clean Air Act if it represents a health hazard to the public. On December 7, 2009, the U.S. Environmental Protection Agency ( EPA ) responded to the Massachusetts, et al. v. EPA decision and issued a finding that the current and projected concentrations of GHGs in the atmosphere threaten the public health and welfare of current and future generations, and that certain GHGs from new motor vehicles and motor vehicle engines contribute to the atmospheric concentrations of GHG and hence to the threat of climate change. In addition, the EPA issued a final rule, effective in December 2009, requiring the reporting of GHG emissions from specified large (25,000 metric tons or more) GHG emission sources in the U.S., beginning in 2011 for emissions occurring in During 2010, the EPA proposed revisions to these reporting requirements to apply to all oil and gas production, transmission, processing, and other facilities exceeding certain emission thresholds. In September and November 2013, the EPA proposed further revisions to record keeping and reporting requirements. Which likely will be finalized in The adoption and implementation of any regulations imposing reporting obligations on, or limiting emissions of GHGs from, our equipment and operations could require us to incur additional costs to reduce emissions of GHGs associated with our operations or could adversely affect demand for the crude oil we gather, transport, store or otherwise handle in connection with our services. In addition, both President Obama and the Administrator of the EPA have repeatedly indicated their preference for comprehensive legislation to address this issue and create the framework for a clean energy economy, with the Obama Administration supporting an emission allowance system. Past proposed legislation in Congress has included an economy wide cap and trade program to reduce U.S. greenhouse gas emissions. Some states are also looking at similar types of laws and regulations. Our oil and natural gas segment routinely applies hydraulic-fracturing techniques to many of our oil and natural gas properties, including our unconventional resource plays in the Granite Wash of Texas and Oklahoma, the Marmaton of Oklahoma, the Wilcox of Texas, and the Mississippian of Kansas. The EPA, has commenced a study of the potential environmental impacts of hydraulic fracturing, including the impact on drinking water sources and public health, and a committee of the U.S. House of Representatives is also conducting an investigation of hydraulic fracturing practices. Legislation has been introduced before Congress to provide for federal regulation of hydraulic fracturing and to require disclosure of the chemicals used in the fracturing process. On November 20, 2013 the U.S. House of Representatives passed a bill, H.R. 2728, that would block the Department of Interior from regulating hydraulic fracturing in states that already have their own regulations in place; however, it is uncertain that it will ever be enacted and if enacted, it would likely be subject to a Presidential veto. In addition, certain states in which we operate, including Texas, Oklahoma, and Wyoming have adopted, and other states as well as municipalities and other local governmental entities in some states, have and others are considering adopting regulations and ordinances that could impose more stringent permitting, public disclosure, waste disposal, and well construction requirements on these operations, and possibly even restrict or ban hydraulic fracturing in certain circumstances. 20
37 Any new laws, regulation, or permitting requirements regarding hydraulic fracturing could lead to operational delay, or increased operating costs or third party or governmental claims, and could result in additional burdens that could serve to delay or limit the drilling services we provide to third parties whose drilling operations could be impacted by these regulations or increase our costs of compliance and doing business as well as delay the development of unconventional gas resources from shale formations which are not commercial without the use of hydraulic fracturing. Restrictions on hydraulic fracturing could also reduce the amount of oil and natural gas that we are ultimately able to produce from our reserves. Further, after reviewing extensive comments and making a number of changes to its previously July 28, 2011 proposed rules, on April 17, 2012 the EPA issued its final rules that subject a wide range of oil and gas operations (production, processing, transmission, storage, and distribution) to regulation under the New Source Performance Standards (NSPS) and National Emission Standards for Hazardous Air Pollutants (NESHAPS) programs (with the NSPS and NESHAPS published in the Federal Register on August 16, 2012). The EPA revised the NSPS for volatile organic compounds (VOCs) from leaking components at onshore gas processing plants and the NSPS for sulfur dioxide emissions from natural gas processing plants. The EPA also established standards for certain oil and gas operations not covered by existing standards, which will regulate VOC emissions from gas wells, centrifugal and reciprocating compressors, pneumatic controllers, and storage vessels over a certain size. The EPA also made revisions to the existing leak detection and repair requirements for the oil and gas production source category and the natural gas transmission source category and established action limits reflecting most achievable control for certain previously uncontrolled emission sources. There also are additional testing and related notification, record keeping and reporting requirements. These changes were effective October 15, The EPA regulations also result in the first federal air standards for natural gas wells that are hydraulically fractured. Refractured gas wells that use the green completions will not be considered affected from a federal standpoint. Operators may choose to flare for now from refractured wells and phase in green completions by January 1, 2015, but any such refractured well will be considered an affected facility for permitting purposes. The EPA will be designating nonattainment areas for ozone standards for outdoor quality. These areas will include those areas with significant oil and gas activities. Nonattainment areas will be required to submit state implementation plans in 2015 and to attain the standard by 2015 and 2018 for areas classified as Marginal and Moderate, respectively. Areas classified as Serious must attain by The federal NSPS constitute a federally required minimum level of control. States have the flexibility to put their own program in place or implement existing programs as long as they are at least as protective as the federal NSPS. Consequently, while we have been in the process of assessing and implementing the new EPA requirements as required, at this time we do not know and cannot predict with any degree of certainty what areas the EPA will designate nonattainment and what classification will be applied nor what the states may implement for such nonattainment areas which may affect our business segments and use of hydraulic fracturing practices. We do not know and cannot predict whether there will be any further proposed legislation or regulations It is possible that such future laws, regulations, and/or ordinances could result in increasing our compliance costs or additional operating restrictions as well as those of our customers. It is also possible that such future developments could curtail the demand for fossil fuels which could adversely affect the demand for our services, which in turn could adversely affect our future results of operations. Likewise we cannot predict with any certainty whether any changes to temperature, storm intensity or precipitation patterns as a result of climate change (or otherwise) will have a material impact on our operations. Compliance with applicable environmental requirements has not, to date, had a material effect on the cost of our operations, earnings, or competitive position. However, as noted above in connection with our discussion of the regulation of GHGs and hydraulic fracturing, compliance with amended, new or more stringent requirements of existing environmental regulations or requirements may cause us to incur additional costs or subject us to liabilities that may have a material adverse effect on our results of operations and financial condition. FINANCIAL INFORMATION ABOUT GEOGRAPHIC AREAS Revenues from our Canadian operations during the last three fiscal years, as well as information relating to long-lived assets attributable to those operations are immaterial. We have no other international operations. 21
38 Item 1A. Risk Factors FORWARD-LOOKING STATEMENTS/CAUTIONARY STATEMENT AND RISK FACTORS This report contains forward-looking statements meaning, statements related to future events within the meaning of Section 27A of the Securities Act of 1933, as amended and Section 21E of the Securities Exchange Act of 1934, as amended. All statements, other than statements of historical facts, included or incorporated by reference in this document which addresses activities, events or developments which we expect or anticipate will or may occur in the future, are forward-looking statements. The words believes, intends, expects, anticipates, projects, estimates, predicts, and similar expressions are used to identify forward-looking statements. This report modifies and supersedes documents filed by us before this report. In addition, certain information that we file with the SEC in the future will automatically update and supersede information contained in this report. These forward-looking statements include, among others, such things as: the amount and nature of our future capital expenditures and how we expect to fund our capital expenditures; the number of wells we plan to drill or rework; prices for oil, NGLs, and natural gas; demand for oil, NGLs, and natural gas; our exploration and drilling prospects; the estimates of our proved oil, NGLs, and natural gas reserves; oil, NGLs, and natural gas reserve potential; development and infill drilling potential; expansion and other development trends of the oil and natural gas industry; our business strategy; our plans to maintain or increase production of oil, NGLs, and natural gas; the number of gathering systems and processing plants we plan to construct or acquire; volumes and prices for natural gas gathered and processed; expansion and growth of our business and operations; demand for our drilling rigs and drilling rig rates; our belief that the final outcome of our legal proceedings will not materially affect our financial results; our ability to timely secure third-party services used in completing our wells; our ability to transport or convey our oil, NGLs, or natural gas production to established pipeline systems; impact of federal and state legislative and regulatory actions impacting our costs and increasing operating restrictions or delays as well as other adverse impacts on our business; our projected production guidelines for the year; our anticipated capital budgets; and the number of wells our oil and natural gas segment plans to drill during the year. These statements are based on certain assumptions and analyses made by us in light of our experience and our perception of historical trends, current conditions, and expected future developments as well as other factors we believe are appropriate in the circumstances. Whether actual results and developments will conform to our expectations and predictions is subject to a number of risks and uncertainties any one or combination of which could cause our actual results to differ materially from our expectations and predictions, including: the risk factors discussed in this document and in the documents (if any) we incorporate by reference; general economic, market, or business conditions; the availability of and nature of (or lack of) business opportunities that we pursue; demand for our land drilling services; changes in laws or regulations; decreases or increases in commodity prices; and other factors, most of which are beyond our control. You should not place undue reliance on any of these forward-looking statements. Except as required by law, we disclaim any current intention to update forward-looking information and to release publicly the results of any future revisions we may make to forward-looking statements to reflect events or circumstances after the date of this document to reflect the occurrence of unanticipated events. 22
39 In order to help provide you with a more thorough understanding of the possible effects of some of these influences on any forward-looking statements made by us, the following discussion outlines some (but not all) of the factors that could in the future cause our consolidated results to differ materially from those that may be presented in any forward-looking statement made by us or on our behalf. Contract Drilling Customer Demand. With the exception of the drilling we do for our own account, the demand for our contract drilling services depends entirely on the needs of third parties. Based on past history, these parties requirements are subject to a number of factors, independent of any subjective factors that directly impact the demand for our drilling rigs, including the availability of funds to carry out their drilling operations. For many of these parties, even if they have available funds, their decision to spend those funds is often based on the then current price for oil, NGLs, and natural gas. Other factors that affect our ability to work our drilling rigs are: the weather which, under certain circumstances, can delay or even cause the abandonment of a project by an operator; the competition we face in securing the award of drilling contracts; our lack of prior history in and recognition in a new market area; and the availability of labor to operate our drilling rigs. Oil, NGLs, and Natural Gas Prices. The prices we receive for our oil, NGLs, and natural gas production have a direct impact on our revenues, profitability, and cash flow as well as our ability to meet our projected financial and operational goals. The prices for oil, NGLs, and natural gas are determined on a number of factors beyond our control, including: the demand for and supply of oil, NGLs, and natural gas; current weather conditions in the continental United States (which can greatly influence the demand and prices for natural gas at any given time); the amount and timing of liquid natural gas and liquefied petroleum gas imports and exports; and the ability of current distribution systems in the United States to effectively meet the demand for oil, NGLs, and natural gas at any given time, particularly in times of peak demand which may result because of adverse weather conditions. Oil prices are extremely sensitive to influences domestic and foreign based on political, social or economic underpinnings, any one of which could have an immediate and significant effect on the price and supply of oil. In addition, prices of oil, NGLs, and natural gas have been at various times influenced by trading on the commodities markets. That trading, at times, has tended to increase the volatility associated with these prices resulting in large differences in prices even on a weekto-week and month-to-month basis. All of these factors, especially when coupled with the fact that much of our product prices are determined on a daily basis, can, and at times do, lead to wide fluctuations in the prices we receive. Based on our 2013 production, a $0.10 per Mcf change in what we receive for our natural gas production, without the effect of hedging, would result in a corresponding $448,000 per month ($5.4 million annualized) change in our pre-tax operating cash flow. A $1.00 per barrel change in our oil price, without the effect of hedging, would have a $268,000 per month ($3.2 million annualized) change in our pre-tax operating cash flow and a $1.00 per barrel change in our NGLs price, without the effect of hedging, would have a $310,000 per month ($3.7 million annualized) change in our pre-tax operating cash flow. In order to reduce our exposure to short-term fluctuations in the price of oil, NGLs, and natural gas, we sometimes enter into hedging arrangements such as swaps and collars. To date, we have hedged part, but not all of our production which only provides price protection against declines in oil, NGLs, and natural gas prices on the production subject to our hedges, but not otherwise. Should market prices for the production we have hedged exceed the prices due under our hedges, our hedging arrangements then expose us to risk of financial loss and limit the benefit to us of those increases in market prices. During 2013, substantially all of our oil, NGLs, and natural gas volumes were sold at market responsive prices. To help manage our cash flow and capital expenditure requirements, we hedged approximately 90% and 65% of our 2013 average daily production for oil and natural gas, respectively. A more thorough discussion of our hedging arrangements is contained in the Management s Discussion and Analysis of Financial Condition and Results of Operations section of this report contained in Item 7. Uncertainty of Oil, NGLs, and Natural Gas Reserves; Ceiling Test. There are many uncertainties inherent in estimating quantities of oil, NGLs, and natural gas reserves and their values, including many factors beyond our control. The oil, NGLs, and natural gas reserve information included in this report represents only an estimate of these reserves. Oil, NGLs, and natural gas reservoir engineering is a subjective and an inexact process of estimating underground accumulations of oil, NGLs, and natural gas that cannot be measured in an exact manner. Estimates of economically recoverable oil, NGLs, and 23
40 natural gas reserves depend on a number of variable factors, including historical production from the area compared with production from other producing areas, and assumptions concerning: reservoir size; the effects of regulations by governmental agencies; future oil, NGLs, and natural gas prices; future operating costs; severance and excise taxes; operational risks; development costs; and workover and remedial costs. Some or all of these assumptions may vary considerably from actual results. For these reasons, estimates of the economically recoverable quantities of oil, NGLs, and natural gas attributable to any particular group of properties, classifications of those oil, NGLs, and natural gas reserves based on risk of recovery, and estimates of the future net cash flows from oil, NGLs, and natural gas reserves prepared by different engineers or by the same engineers but at different times may vary substantially. Accordingly, oil, NGLs, and natural gas reserve estimates may be subject to periodic downward or upward adjustments. Actual production, revenues, and expenditures with respect to our oil, NGLs, and natural gas reserves will likely vary from estimates and those variances may be material. The information regarding discounted future net cash flows included in this report is not necessarily the current market value of the estimated oil, NGLs, and natural gas reserves attributable to our properties. The use of full cost accounting requires us to use the unweighted arithmetic average of the commodity prices existing on the first day of each of the 12 months before the end of the reporting period to calculate discounted future revenues, unless prices were otherwise determined under contractual arrangements. Actual future prices and costs may be materially higher or lower. Actual future net cash flows are also affected, in part, by the following factors: the amount and timing of oil, NGLs, and natural gas production; supply and demand for oil, NGLs, and natural gas; increases or decreases in consumption; and changes in governmental regulations or taxation. In addition, the 10% discount factor, required by the SEC for use in calculating discounted future net cash flows for reporting purposes, is not necessarily the most appropriate discount factor based on interest rates in effect from time to time and the risks associated with our operations or the oil and natural gas industry in general. We review quarterly the carrying value of our oil and natural gas properties under the full cost accounting rules of the SEC. Under these rules, capitalized costs of proved oil and natural gas properties may not exceed the present value of estimated future net revenues from those proved reserves, discounted at 10%. Application of this ceiling test generally requires pricing future revenue at the unescalated 12-month average price and requires a write-down for accounting purposes if we exceed the ceiling. We may be required to write down the carrying value of our oil and natural gas properties when oil, NGLs, and natural gas prices are depressed. If a write-down is required, it would result in a charge to earnings but would not impact our cash flow from operating activities. Once incurred, a write-down is not reversible. As a result of these ceiling test rules, during the quarters ending June 30, 2012 and December 31, 2012, we recorded a non-cash ceiling test write down of $115.9 million pre-tax ($72.1 million, net of tax) and $167.7 million pre-tax $104.4 million, net of tax), respectively. No ceiling test write down was necessary during 2011 or If there are declines in the 12-month average prices, we may be required to record a write-down in future periods. We are continually identifying and evaluating opportunities to acquire oil and natural gas properties, including acquisitions that would be significantly larger than those we have consummated to date. We cannot assure you that we will successfully consummate any acquisition, that we will be able to acquire producing oil and natural gas properties that contain economically recoverable reserves or that any acquisition will be profitably integrated into our operations. 24
41 Debt and Bank Borrowing. We have incurred and currently expect to continue to incur substantial capital expenditures because of the growth in our operations. Historically, we have funded our capital needs through a combination of internally generated cash flow and borrowings under our bank credit agreement. In 2011 and 2012, we issued $250.0 million (the 2011 Notes) and $400.0 million (the 2012 Notes), respectively, of senior subordinated notes (collectively, the Notes). We have also, from time to time, obtained funds through equity financing. We currently have, and will continue to have, a certain amount of indebtedness. At December 31, 2013, we had no outstanding long-term debt under our credit agreement and the amount of the Notes, net of unamortized discount, was $645.7 million. Depending on the amount of our debt, the cash flow needed to satisfy that debt and the covenants contained in our bank credit agreement and those applicable to the Notes could: limit funds otherwise available for financing our capital expenditures, our drilling program or other activities or cause us to curtail these activities; limit our flexibility in planning for or reacting to changes in our business; place us at a competitive disadvantage to those of our competitors that are less indebted than we are; make us more vulnerable during periods of low oil, NGLs, and natural gas prices or in the event of a downturn in our business; and prevent us from obtaining additional financing on acceptable terms or limit amounts available under our existing or any future credit facilities. Our ability to meet our debt obligations depends on our future performance. If the requirements of our indebtedness are not satisfied, a default could be deemed to occur and our lenders or the holders of the Notes would be entitled to accelerate the payment of the outstanding indebtedness. If that were to occur, we would not have sufficient funds available and probably would not be able to obtain the financing required to meet our obligations. The amount of our existing debt, as well as our future debt, if any, is, to a large extent, based on the costs associated with the projects we undertake at any given time and of our cash flow. Generally, our normal operating costs are those resulting from the drilling of oil and natural gas wells, the acquisition of producing properties, the costs associated with the maintenance, upgrade, or expansion of our drilling rig fleet, and the operations of our natural gas buying, selling, gathering, processing, and treating systems. To some extent, these costs, particularly the first two, are discretionary and we maintain a degree of control regarding the timing or the need to incur them. But, in some cases, unforeseen circumstances may arise, such as in the case of an unanticipated opportunity to make a large acquisition or the need to replace a costly drilling rig component due to an unexpected loss, which could force us to incur additional debt above that which we had expected or forecasted. Likewise, if our cash flow should prove to be insufficient to cover our current cash requirements we would need to increase our debt either through bank borrowings or otherwise. RISK FACTORS There are many other factors that could adversely affect our business. The following discussion describes the material risks currently known to us. However, additional risks that we do not know about or that we currently view as immaterial may also impair our business or adversely affect the value of our securities. You should carefully consider the risks described below together with the other information contained in, or incorporated by reference into, this report. If demand for oil, NGLs, and natural gas is reduced, our ability to market as well as produce our oil, NGLs, and natural gas may be negatively affected. Historically, oil, NGLs, and natural gas prices have been extremely volatile, with significant increases and significant price drops being experienced from time to time. In the future, various factors beyond our control will have a significant effect on oil, NGLs, and natural gas prices. Such factors include, among other things, the domestic and foreign supply of oil, NGLs, and natural gas, the price of foreign imports, the levels of consumer demand, the price and availability of alternative fuels, the availability of pipeline capacity, and changes in existing and proposed federal regulation and price controls. The oil, NGLs, and natural gas markets are also unsettled due to a number of factors. Production from oil and natural gas wells in some geographic areas of the United States has been curtailed for considerable periods of time due to a lack of market 25
42 demand and transportation and storage capacity. It is possible, however, that some of our wells may in the future be shut-in or that oil, NGLs, and natural gas will be sold on terms less favorable than might otherwise be obtained should demand for oil, NGLs, and natural gas decrease. Competition for available markets has been vigorous and there remains great uncertainty about prices that purchasers will pay. Oil, NGLs, and natural gas surpluses could result in our inability to market oil, NGLs, and natural gas profitably, causing us to curtail production and/or receive lower prices for our oil, NGls, and natural gas, situations which would adversely affect us. Disruptions in the financial markets could affect our ability to obtain financing or refinance existing indebtedness on reasonable terms and may have other adverse effects. Commercial-credit market disruptions may result in tight credit markets in the United States. Liquidity in the globalcredit markets can be severely contracted by market disruptions making terms for certain financings less attractive, and in certain cases, result in the unavailability of certain types of financing. As a result of credit-market turmoil, we may not be able to obtain debt financing, or refinance existing indebtedness on favorable terms, which could affect operations and financial performance. Oil, NGLs, and natural gas prices are volatile, and low prices have negatively affected our financial results and could do so in the future. Our revenues, operating results, cash flow, and future rate of growth depend substantially on prevailing prices for oil, NGLs, and natural gas. Historically, oil, NGLs, and natural gas prices and markets have been volatile, and they are likely to continue to be volatile in the future. Any decline in prices in the future would have a negative impact on our future financial results. Prices for oil, NGLs, and natural gas are subject to wide fluctuations in response to relatively minor changes in the supply of and demand for oil, NGLs, and natural gas, market uncertainty, and a variety of additional factors that are beyond our control. These factors include: political conditions in oil producing regions; the ability of the members of the Organization of Petroleum Exporting Countries to agree on prices and their ability to maintain production quotas; the price of foreign oil imports; imports and exports of liquefied natural gas; actions of governmental authorities; the domestic and foreign supply of oil, NGLs, and natural gas; the level of consumer demand; U.S. storage levels of oil, NGLs, and natural gas; weather conditions; domestic and foreign government regulations; the price, availability, and acceptance of alternative fuels; and worldwide economic conditions. These factors and the volatile nature of the energy markets make it impossible to predict with any certainty the future prices of oil, NGLs, and natural gas. Our contract drilling operations depend on levels of activity in the oil, NGLs, and natural gas exploration and production industry. Our contract drilling operations depend on the level of activity in oil, NGLs, and natural gas exploration and production in our operating markets. Both short-term and long-term trends in oil, NGLs, and natural gas prices affect the level of that activity. Because oil, NGLs, and natural gas prices are volatile, the level of exploration and production activity can also be 26
43 volatile. Any decrease from current oil, NGLs, and natural gas prices would depress the level of exploration and production activity. This, in turn, would likely result in a decline in the demand for our drilling services and would have an adverse effect on our contract drilling revenues, cash flows, and profitability. As a result, the future demand for our drilling services is uncertain. The industries in which we operate are highly competitive, and many of our competitors have greater resources than we do. The drilling industry in which we operate is generally very competitive. Most drilling contracts are awarded on the basis of competitive bids, which may result in intense price competition. Some of our competitors in the contract drilling industry have greater financial and human resources than we do. These resources may enable them to better withstand periods of low drilling rig utilization, to compete more effectively on the basis of price and technology, to build new drilling rigs or acquire existing drilling rigs, and to provide drilling rigs more quickly than we do in periods of high drilling rig utilization. The oil and natural gas industry is also highly competitive. We compete in the areas of property acquisitions and oil and natural gas exploration, development, production, and marketing with major oil companies, other independent oil and natural gas concerns, and individual producers and operators. In addition, we must compete with major and independent oil and natural gas concerns in recruiting and retaining qualified employees. Many of our competitors in the oil and natural gas industry have substantially greater resources than we do. The midstream industry is also highly competitive. We compete in areas of gathering, processing, transporting, and treating natural gas with other midstream companies. We are continually competing with larger midstream companies for acquisitions and construction projects. Many of our competitors have greater financial resources, human resources, and larger geographic presence than we do currently. Continued growth through acquisitions is not assured. In the past, we have experienced growth in each of our segments, in part, through mergers and acquisitions. The contract land drilling industry, the exploration and development industry, as well as the gas gathering and processing industry, have experienced significant consolidation over the past several years, and there can be no assurance that acquisition opportunities will continue to be available. Additionally, we are likely to continue to face intense competition from other companies for available acquisition opportunities. There can be no assurance that we will: be able to identify suitable acquisition opportunities; have sufficient capital resources to complete additional acquisitions; successfully integrate acquired operations and assets; effectively manage the growth and increased size; maintain the crews and market share to operate any future drilling rigs we may acquire; or successfully improve our financial condition, results of operations, business or prospects in any material manner as a result of any completed acquisition. We may incur substantial indebtedness to finance future acquisitions and also may issue debt instruments, equity securities, or convertible securities in connection with any acquisitions. Debt service requirements could represent a significant burden on our results of operations and financial condition and the issuance of additional equity would be dilutive to existing shareholders. Also, continued growth could strain our management, operations, employees, and other resources. Successful acquisitions, particularly those of oil and natural gas companies or of oil and natural gas properties require an assessment of a number of factors, many of which are beyond our control. These factors include recoverable reserves, exploration potential, future oil, NGLs, and natural gas prices, operating costs, and potential environmental and other liabilities. Such assessments are inexact and their accuracy is inherently uncertain. 27
44 Our operations have significant capital requirements, and our indebtedness could have important consequences. We have experienced and may continue to experience substantial capital needs in the growth of our operations. We have $645.7 million of indebtedness outstanding (net of unamortized discount) under the senior subordinated notes we have issued to date and in addition, have the right to borrow up to $500.0 million under our credit agreement. As of February 14, 2014, we had no outstanding borrowings under our credit agreement. Our level of indebtedness, the cash flow needed to satisfy our indebtedness, and the covenants governing our indebtedness could: limit funds available for financing capital expenditures, our drilling program or other activities or cause us to curtail these activities; limit our flexibility in planning for, or reacting to changes in, our business; place us at a competitive disadvantage to some of our competitors that are less leveraged than we are; make us more vulnerable during periods of low oil, NGLs, and natural gas prices or in the event of a downturn in our business; and prevent us from obtaining additional financing on acceptable terms or limit amounts available under our existing or any future credit facilities. Our ability to meet our debt service and other contractual and contingent obligations will depend on our future performance. In addition, lower oil, NGLs, and natural gas prices could result in future reductions in the amount available for borrowing under our credit agreement, reducing our liquidity, and even triggering mandatory loan repayments. The instruments governing our indebtedness contain various covenants limiting the conduct of our business. The indentures governing our senior subordinated notes and our credit agreement contain various restrictive covenants that limit the conduct of our business. In particular, these agreements will place certain limits on our ability to, among other things: incur additional indebtedness, guarantee obligations or issue disqualified capital stock; pay dividends or distributions on our capital stock or redeem, repurchase or retire our capital stock; make investments or other restricted payments; grant liens on assets; enter into transactions with stockholders or affiliates; sell assets; issue or sell capital stock of certain subsidiaries; and merge or consolidate. In addition, our credit agreement also requires us to maintain a minimum current ratio and a maximum leverage ratio. If we fail to comply with the restrictions in the indentures governing our senior subordinated notes, our credit agreement or any other subsequent financing agreements, a default may allow the creditors, if the agreements so provide, to accelerate the related indebtedness as well as any other indebtedness to which a cross-acceleration or cross-default provision applies. If that occurs, we may not be able to make all of the required payments or borrow sufficient funds to refinance that debt. Even if new financing were available at that time, it may not be on terms acceptable to us. In addition, lenders may be able to terminate any commitments they had made to make available further funds. Our future performance depends on our ability to find or acquire additional oil, NGLs, and natural gas reserves that are economically recoverable. In general, production from oil and natural gas properties declines as reserves are depleted, with the rate of decline depending on reservoir characteristics. Unless we successfully replace the reserves that we produce, our reserves will decline, 28
45 resulting eventually in a decrease in oil, NGLs, and natural gas production and lower revenues and cash flow from operations. Historically, we have succeeded in increasing reserves after taking production into account through exploration and development. We have conducted these activities on our existing oil and natural gas properties as well as on newly acquired properties. We may not be able to continue to replace reserves from these activities at acceptable costs. Lower prices of oil, NGLs, and natural gas may further limit the kinds of reserves that can economically be developed. Lower prices also decrease our cash flow and may cause us to decrease capital expenditures. We are continually identifying and evaluating opportunities to acquire oil and natural gas properties, including acquisitions that would be significantly larger than those consummated to date by us. We cannot assure you that we will successfully consummate any acquisition, that we will be able to acquire producing oil and natural gas properties that contain economically recoverable reserves or that any acquisition will be profitably integrated into our operations. The competition for producing oil and natural gas properties is intense. This competition could mean that to acquire properties we will have to pay higher prices and accept greater ownership risks than we have in the past. Our exploration and production and mid-stream operations involve a high degree of business and financial risk which could adversely affect us. Exploration and development involve numerous risks that may result in dry holes, the failure to produce oil, NGLs, and natural gas in commercial quantities and the inability to fully produce discovered reserves. The cost of drilling, completing, and operating wells is substantial and uncertain. Numerous factors beyond our control may cause the curtailment, delay, or cancellation of drilling operations, including: unexpected drilling conditions; pressure or irregularities in formations; capacity of pipeline systems; equipment failures or accidents; adverse weather conditions; compliance with governmental requirements; and shortages or delays in the availability of drilling rigs or delivery crews and the delivery of equipment. Exploratory drilling is a speculative activity. Although we may disclose our overall drilling success rate, those rates may decline. Although we may discuss drilling prospects that we have identified or budgeted for, we may ultimately not lease or drill these prospects within the expected time frame, or at all. Lack of drilling success will have an adverse effect on our future results of operations and financial condition. Our mid-stream operations involve numerous risks, both financial and operational. The cost of developing gathering systems and processing plants is substantial and our ability to recoup these costs is uncertain. Our operations may be curtailed, delayed, or canceled as a result of many things beyond our control, including: unexpected changes in the deliverability of natural gas reserves from the wells connected to the gathering systems; availability of competing pipelines in the area; capacity of pipeline systems; equipment failures or accidents; adverse weather conditions; compliance with governmental requirements; delays in the development of other producing properties within the gathering system s area of operation; and demand for natural gas and its constituents. Many of the wells from which we gather and process natural gas are operated by other parties. As a result, we have little control over the operations of those wells which can act to increase our risk. Operators of those wells may act in ways that are not in our best interests. 29
46 Competition for experienced technical personnel may negatively impact our operations or financial results. Our continued oil and natural gas segment and mid-stream segment success and the success of other activities integral to our operations will depend, in part, on our ability to attract and retain experienced geologists, engineers, and other professionals. Competition for these professionals can be extremely intense, particularly when the industry is experiencing favorable conditions. Our hedging arrangements might limit the benefit of increases in oil, NGLs, and natural gas prices. In order to reduce our exposure to short-term fluctuations in the price of oil, NGLs, and natural gas, we sometimes enter into hedging arrangements. Our hedging arrangements apply to only a portion of our production and provide only partial price protection against declines in oil, NGLs, and natural gas prices. These hedging arrangements may expose us to risk of financial loss and limit the benefit to us of increases in prices. Estimates of our reserves are uncertain and may prove to be inaccurate. There are numerous uncertainties inherent in estimating quantities of proved reserves and their values, including many factors beyond our control. The reserve data represents only estimates. Reservoir engineering is a subjective and inexact process of estimating underground accumulations of oil and natural gas that cannot be measured in an exact manner. Estimates of economically recoverable oil, NGLs, and natural gas reserves depend on a number of variable factors, including historical production from the area compared with production from other producing areas, and assumptions concerning: the effects of regulations by governmental agencies; future oil, NGLs, and natural gas prices; future operating costs; severance and excise taxes; development costs; and workover and remedial costs. Some or all of these assumptions may vary considerably from actual results. For these reasons, estimates of the economically recoverable quantities of oil, NGLs, and natural gas attributable to any particular group of properties, classifications of those reserves based on risk of recovery, and estimates of the future net cash flows from reserves prepared by different engineers or by the same engineers but at different times may vary substantially. Accordingly, reserve estimates may be subject to downward or upward adjustment. Actual production, revenues and expenditures with respect to our reserves will likely vary from estimates, and those variances may be material. The information regarding discounted future net cash flows should not be considered as the current market value of the estimated oil, NGLs, and natural gas reserves attributable to our properties. As required by the SEC, the estimated discounted future net cash flows from proved reserves are based on prices on the first day of the month for each month within the 12- month period before the end of the reporting period and costs as of the date of the estimate, while actual future prices and costs may be materially higher or lower. Actual future net cash flows also will be affected by the following factors: the amount and timing of actual production; supply and demand for oil, NGLs, and natural gas; increases or decreases in consumption; and changes in governmental regulations or taxation. In addition, the 10% per year discount factor, which is required by the SEC to be used in calculating discounted future net cash flows for reporting purposes, is not necessarily the most appropriate discount factor based on interest rates in effect from time to time and risks associated with our operations or the oil and natural gas industry in general. 30
47 If oil, NGLs, and natural gas prices decrease or are unusually volatile, we may be required to take write-downs of our oil and natural gas properties, the carrying value of our drilling rigs or our natural gas gathering and processing systems. We review quarterly the carrying value of our oil and natural gas properties under the full cost accounting rules of the SEC. Under these rules, capitalized costs of proved oil and natural gas properties may not exceed the present value of estimated future net revenues from proved reserves, discounted at 10% per year. Application of the ceiling test generally requires pricing future revenue at the unweighted arithmetic average of the price on the first day of month for each month within the 12-month period prior to the end of the reporting period, unless prices were defined by contractual arrangements, and requires a writedown for accounting purposes if the ceiling is exceeded. We may be required to write down the carrying value of our oil and natural gas properties when oil, NGLs, and natural gas prices are depressed. If a write-down is required, it would result in a charge to earnings, but would not impact cash flow from operating activities. Once incurred, a write-down of oil and natural gas properties is not reversible at a later date. Our drilling equipment, transportation equipment, gas gathering and processing systems, and other property and equipment are carried at cost. We are required to periodically test to see if these values, including associated goodwill and other intangible assets, have been impaired whenever events or changes in circumstances suggest the carrying amount may not be recoverable. If any of these assets are determined to be impaired, the loss is measured as the amount by which the carrying amount of the asset exceeds its fair value. An estimate of fair value is based on the best information available, including prices for similar assets. Changes in these estimates could cause us to reduce the carrying value of property, equipment, and related intangible assets. Once these values have been reduced, they are not reversible. Our operations present inherent risks of loss that, if not insured or indemnified against, could adversely affect our results of operations. Our contract drilling operations are subject to many hazards inherent in the drilling industry, including blowouts, cratering, explosions, fires, loss of well control, loss of hole, damaged or lost drilling equipment, and damage or loss from inclement weather. Our exploration and production and mid-stream operations are subject to these and similar risks. Any of these events could result in personal injury or death, damage to or destruction of equipment and facilities, suspension of operations, environmental damage, and damage to the property of others. Generally, drilling contracts provide for the division of responsibilities between a drilling company and its customer, and we seek to obtain indemnification from our drilling customers by contract for some of these risks. To the extent that we are unable to transfer these risks to drilling customers by contract or indemnification agreements (or to the extent we assume obligations of indemnity or assume liability for certain risks under our drilling contracts), we seek protection from some of these risks through insurance. However, some risks are not covered by insurance and we cannot assure you that the insurance we do have or the indemnification agreements we have entered into will adequately protect us against liability from all of the consequences of the hazards described above. The occurrence of an event not fully insured or indemnified against, or the failure of a customer to meet its indemnification obligations, could result in substantial losses. In addition, we cannot assure you that insurance will be available to cover any or all of these risks. Even if available, the insurance might not be adequate to cover all of our losses, or we might decide against obtaining that insurance because of high premiums or other costs. In addition, we are not the operator of many of our wells. As a result, our operating risks for those wells and our ability to influence the operations for those wells are less subject to our control. Operators of those wells may act in ways that are not in our best interests. Governmental and environmental regulations could adversely affect our business. Our business is subject to federal, state, and local laws and regulations on taxation, the exploration for and development, production, and marketing of oil and natural gas, and safety matters. Many laws and regulations require drilling permits and govern the spacing of wells, rates of production, prevention of waste, unitization and pooling of properties, and other matters. These laws and regulations have increased the costs of planning, designing, drilling, installing, operating, and abandoning our oil and natural gas wells and other facilities. In addition, these laws and regulations, and any others that are passed by the jurisdictions where we have production, could limit the total number of wells drilled or the allowable production from successful wells, which could limit our revenues. We are (or could become) subject to complex environmental laws and regulations adopted by the various jurisdictions where we own or operate. We could incur liability to governments or third parties for discharges of oil, natural gas or other pollutants into the air, soil or water, including responsibility for remedial costs. We could potentially discharge these materials 31
48 into the environment in any number of ways including the following: from a well or drilling equipment at a drill site; from gathering systems, pipelines, transportation facilities, and storage tanks; damage to oil and natural gas wells resulting from accidents during normal operations; and blowouts, cratering, and explosions. Because the requirements imposed by laws and regulations are frequently changed, we cannot assure you that laws and regulations enacted in the future, including changes to existing laws and regulations, will not adversely affect our business. The current Congress and White House administration may impose or change laws and regulations that will adversely affect our business. With the trend toward stricter standards, greater regulation, and more extensive permit requirements, our risks related to environmental matters and our environmental expenditures could increase in the future. In addition, because we acquire interests in properties that have been operated in the past by others, we may be liable for environmental damage caused by the former operators, which liability could be material. Any future implementation of price controls on oil, NGLs, and natural gas would affect our operations. Certain groups have asserted efforts to have the United States Congress impose some form of price controls on either oil, natural gas, or both. There is no way at this time to know what result these efforts will have nor, if implemented, their effect on our operations. However, it is possible that these efforts, if successful, would serve to limit the amount that we might be able to get for our future oil, NGLs, and natural gas production. Any future limits on the price of oil, NGLs, and natural gas could also result in adversely affecting the demand for our drilling services. Our shareholders rights plan and provisions of Delaware law and our by-laws and charter could discourage change in control transactions and prevent shareholders from receiving a premium on their investment. Our by-laws and charter provide for a classified board of directors with staggered terms and authorizes the board of directors to set the terms of preferred stock. In addition, our charter and Delaware law contain provisions that impose restrictions on business combinations with interested parties. We have also adopted a shareholders rights plan. Because of our shareholders rights plan and these provisions of our by-laws, charter, and Delaware law, persons considering unsolicited tender offers or other unilateral takeover proposals may be more likely to negotiate with our board of directors rather than pursue nonnegotiated takeover attempts. As a result, these provisions may make it more difficult for our shareholders to benefit from transactions that are opposed by an incumbent board of directors. New technologies may cause our current exploration and drilling methods to become obsolete, resulting in an adverse effect on our production. Our industry is subject to rapid and significant advancements in technology, including the introduction of new products and services using new technologies. As competitors use or develop new technologies, we may be placed at a competitive disadvantage, and competitive pressures may force us to implement new technologies at a substantial cost. In addition, competitors may have greater financial, technical, and personnel resources that allow them to enjoy technological advantages and may in the future allow them to implement new technologies before we can. We cannot be certain that we will be able to implement technologies on a timely basis or at a cost that is acceptable to us. One or more of the technologies that we currently use or that we may implement in the future may become obsolete or may not work as we expected and we may be adversely affected. We may be affected by climate change and market or regulatory responses to climate change. Climate change, including the impact of potential global warming regulations, could have a material adverse effect on our results of operations, financial condition, and liquidity. Restrictions, caps, taxes, or other controls on emissions of greenhouse gasses, including diesel exhaust, could significantly increase our operating costs. Restrictions on emissions could also affect our customers that (a) use commodities that we carry to produce energy, (b) use significant amounts of energy in producing or delivering the commodities we carry, or (c) manufacture or produce goods that consume significant amounts of energy or burn fossil fuels, including chemical producers, farmers and food producers, and automakers and other manufacturers. Significant cost increases, government regulation, or changes of consumer preferences for goods or services relating to alternative sources 32
49 of energy or emissions reductions could materially affect the markets for the commodities associated with our business, which in turn could have a material adverse effect on our results of operations, financial condition, and liquidity. Government incentives encouraging the use of alternative sources of energy could also affect certain of our customers and the markets for certain of the commodities associated with our business in an unpredictable manner that could alter our business activities. Finally, we could face increased costs related to defending and resolving legal claims and other litigation related to climate change and the alleged impact of our operations on climate change. Any of these factors, individually or in operation with one or more of the other factors, or other unforeseen impacts of climate change could reduce the amount of business activity we conduct and have a material adverse effect on our results of operations, financial condition, and liquidity. The results of our operations depend on our ability to transport oil, NGLs, and gas production to key markets. The marketability of our oil, NGLs, and natural gas production depends in part on the availability, proximity, and capacity of pipeline systems, refineries, and other transportation sources. The unavailability of or lack of available capacity on these systems and facilities could result in the shut-in of producing wells or the delay or discontinuance of development plans for properties. Federal and state regulation of oil, NGLs, and natural gas production and transportation, tax and energy policies, changes in supply and demand, pipeline pressures, damage to or destruction of pipelines, and general economic conditions could adversely affect our ability to produce, gather and, transport oil, NGLs, and natural gas. The loss of one or a number of our larger customers could have a material adverse effect on our financial condition and results of operations. During 2013, QEP Resources, Inc. and Kodiak Oil and Gas Corp. were our largest drilling customers accounting for approximately 18% and 10%, respectively, of our total contract drilling revenues. No other third party customer accounted for 10% or more of our contract drilling revenues. Any of our customers may choose not to use our services and the loss of one or a number of our larger customers could have a material adverse effect on our financial condition and results of operations. Shortages of completion equipment and services could delay or otherwise adversely affect our oil and natural gas segment s operations. In the past several years, the increase in horizontal drilling activity in certain areas has, at times, resulted in shortages in the availability of third party equipment and services required for the completion of wells drilled by our oil and natural gas segment. As a result, we have experienced delays in completing some of our wells. Although we have taken steps to try to reduce the delays associated with these services, we anticipate that these services will remain in high demand for the immediate future and could, at times, delay, restrict, or curtail part of our exploration and development operations, which could in turn harm our results. Our mid-stream segment depends on certain natural gas producers and pipeline operators for a significant portion of its supply of natural gas and NGLs. The loss of any of these producers could result in a decline in our volumes and revenues. We rely on certain natural gas producers for a significant portion of our natural gas and NGLs supply. While some of these producers are subject to long-term contracts, we may be unable to negotiate extensions or replacements of these contracts on favorable terms, if at all. The loss of all or even a portion of the natural gas volumes supplied by these producers, as a result of competition or otherwise, could have a material adverse effect on our mid-stream segment unless we were able to acquire comparable volumes from other sources. The counterparties to our commodity derivative contracts may not be able to perform their obligations to us, which could materially affect our cash flows and results of operations. To reduce our exposure to adverse fluctuations in the prices of oil and natural gas, we currently, and may in the future, enter into commodity derivative contracts for a significant portion of our forecasted oil, NGLs, and natural gas production. The extent of our commodity price exposure is related largely to the effectiveness and scope of our derivative activities, as well as to the ability of counterparties under our commodity derivative contracts to satisfy their obligations to us. If one or more of our counterparties is unable or unwilling to make required payments to us under our commodity derivative contracts, it could have a material adverse effect on our financial condition and results of operations. 33
50 Reliance on management. We depend greatly on the efforts of our executive officers and other key employees to manage our operations. The loss or unavailability of any of our executive officers or other key employees could have a material adverse effect on our business. We are subject to various claims and litigation that could ultimately be resolved against us requiring material future cash payments and/or future material charges against our operating income and materially impairing our financial position. The nature of our business makes us highly susceptible to claims and litigation. We are subject to various existing legal claims and lawsuits, which could have a material adverse effect on our consolidated financial position, results of operations, or cash flows. Any claims or litigation, even if fully indemnified or insured, could negatively affect our reputation among our customers and the public, and make it more difficult for us to compete effectively or obtain adequate insurance in the future. Derivatives regulation included in current financial reform legislation could impede our ability to manage business and financial risks by restricting our use of derivative instruments as hedges against fluctuating commodity prices and interest rates. In July 2010, the Dodd-Frank Wall Street Reform and Consumer Protection Act (the Act) was passed by Congress and signed into law. The Act contains significant derivatives regulation, including a requirement that certain transactions be cleared on exchanges and a requirement to post cash collateral (commonly referred to as margin ) for such transactions. The Act provides for a potential exception from these clearing and cash collateral requirements for commercial end-users and it includes a number of defined terms that will be used in determining how this exception applies to particular derivative transactions and the parties to those transactions. We use crude oil, NGLs, and natural gas derivative instruments with respect to a portion of our expected production in order to reduce commodity price uncertainty and enhance the predictability of cash flows relating to the marketing of our crude oil and natural gas. As commodity prices increase, our derivative liability positions increase; however, none of our current derivative contracts require the posting of margin or similar cash collateral when there are changes in the underlying commodity prices that are referred to in these contracts. Depending on the rules and definitions adopted by the CFTC, we could be required to post collateral with our dealer counterparties for our commodities derivative transactions. Such a requirement could have a significant impact on our business by reducing our ability to execute derivative transactions to reduce commodity price uncertainty and to protect cash flows. Requirements to post collateral would cause significant liquidity issues by reducing our ability to use cash for investment or other corporate purposes, or would require us to increase our level of debt. In addition, a requirement for our counterparties to post collateral would likely result in additional costs being passed on to us, thereby decreasing the effectiveness of our hedges and our profitability. Proposed federal and state legislative and regulatory initiatives relating to hydraulic fracturing could result in increased costs and additional operating restrictions or delays. Hydraulic-fracturing is an essential and common practice in the oil and gas industry used to stimulate production of oil, natural gas, and associated liquids from dense subsurface rock formations. Our oil and natural gas segment routinely apply hydraulic-fracturing techniques to many of our oil and natural gas properties, including our unconventional resource plays in the Granite Wash of Texas and Oklahoma, the Marmaton of Oklahoma, the Wilcox of Texas, and the Mississippian of Kansas. Hydraulic-fracturing involves using water, sand, and certain chemicals to fracture the hydrocarbon-bearing rock formation to allow the flow of hydrocarbons into the wellbore. The process is typically regulated by state oil and natural gas commissions; however, the EPA has asserted federal regulatory authority over certain hydraulic-fracturing activities involving diesel under the Safe Drinking Water Act and has begun the process of drafting guidance documents related to this newly asserted regulatory authority. In addition, legislation has been introduced before Congress, called the Fracturing Responsibility and Awareness of Chemicals Act, to provide for federal regulation of hydraulic-fracturing and to require disclosure of the chemicals used in the hydraulic-fracturing process. Certain states in which we operate, including Texas, Oklahoma, and Wyoming, have adopted, and other states are considering adopting, regulations that could impose more stringent permitting, public disclosure, waste disposal, and well construction requirements on hydraulic-fracturing operations or otherwise seek to ban fracturing activities altogether. For example, Texas adopted a law in June 2011 requiring disclosure to the Railroad Commission of Texas (RCT) and the public of 34
51 certain information regarding the components used in the hydraulic-fracturing process. In addition to state laws, local land use restrictions, such as city ordinances, may restrict or prohibit the performance of well drilling in general and/or hydraulic fracturing in particular. In the event state, local, or municipal legal restrictions are adopted in areas where we are currently conducting, or in the future plan to conduct operations, we may incur additional costs to comply with such requirements that may be significant in nature, experience delays or curtailment in the pursuit of exploration, development, or production activities, and perhaps even be precluded from the drilling and/or completion of wells. There are certain governmental reviews either underway or being proposed that focus on environmental aspects of hydraulic-fracturing practices. The White House Council on Environmental Quality is coordinating a review of hydraulicfracturing practices, and a committee of the United States House of Representatives has conducted an investigation of hydraulic-fracturing practices. Furthermore, a number of federal agencies are analyzing, or have been requested to review, a variety of environmental issues associated with hydraulic fracturing. The EPA has commenced a study of the potential environmental effects of hydraulic fracturing on drinking water and groundwater. In addition, the U.S. Department of Energy is conducting an investigation into practices the agency could recommend to better protect the environment from drilling using hydraulic-fracturing completion methods. Additionally, certain members of the Congress have called upon the U.S. Government Accountability Office to investigate how hydraulic fracturing might adversely affect water resources, the U.S. Securities and Exchange Commission to investigate the natural gas industry and any possible misleading of investors or the public regarding the economic feasibility of pursuing natural gas deposits in shales by means of hydraulic fracturing, and the U.S. Energy Information Administration to provide a better understanding of that agency s estimates regarding natural gas reserves, including reserves from shale formations, as well as uncertainties associated with those estimates. These ongoing or proposed studies, depending on their course and results obtained, could spur initiatives to further regulate hydraulic fracturing under the Safe Drinking Water Act or other regulatory processes. Further, after reviewing extensive comments and making a number of changes to its previously July 28, 2011 proposed rules, on April 17, 2012 the EPA issued its final rules that subject a wide range of oil and gas operations (production, processing, transmission, storage, and distribution) to regulation under the New Source Performance Standards (NSPS) and National Emission Standards for Hazardous Air Pollutants (NESHAPS) programs (with the NSPS and NESHAPS published in the Federal Register on August 16, 2012). The EPA revised the NSPS for volatile organic compounds (VOCs) from leaking components at onshore gas processing plants and the NSPS for sulfur dioxide emissions from natural gas processing plants. The EPA also established standards for certain oil and gas operations not covered by existing standards, which will regulate VOC emissions from gas wells, centrifugal and reciprocating compressors, pneumatic controllers, and storage vessels over a certain size. The EPA also made revisions to the existing leak detection and repair requirements for the oil and gas production source category and the natural gas transmission source category and established action limits reflecting most achievable control for certain previously uncontrolled emission sources. There also are additional testing and related notification, record keeping and reporting requirements. These changes were effective October 15, Increased regulation and attention given to the hydraulic fracturing process could lead to greater opposition, including litigation, to oil and gas production activities using hydraulic fracturing techniques. Additional legislation or regulation could also lead to operational delays or increased operating costs in the production of oil, natural gas, and associated liquids including from the development of shale plays, or could make it more difficult to perform hydraulic fracturing. The adoption of additional federal, state or local laws or the implementation of regulations regarding hydraulic fracturing could potentially cause a decrease in the completion of new oil and gas wells, increased compliance costs and time, which could adversely affect our financial position, results of operations, and cash flows. On October 20, 2011, EPA announced a schedule for development of standards for disposal of wastewater produced from shale gas operations to publicly owned treatment works (POTWs). The regulations will be developed under EPA s Effluent Guidelines Program under the authority of the Clean Water Act. EPA anticipates issuing the proposed rules in Our ability to produce crude oil, natural gas, and associated liquids economically and in commercial quantities could be impaired if we are unable to acquire adequate supplies of water for our drilling operations and/or completions or are unable to dispose of or recycle the water we use at a reasonable cost and in accordance with applicable environmental rules. To our knowledge, there have been no citations, suits, or contamination of potable drinking water arising from our fracturing operations. We do not have insurance policies in effect that are intended to provide coverage for losses solely related to hydraulic fracturing operations; however, it is possible that our general liability and excess liability insurance policies might 35
52 cover third-party claims related to hydraulic fracturing operations and associated legal expenses depending on the specific nature of the claims, the timing of the claims, as well as the specific terms of such policies. The hydraulic fracturing process on which we depend to produce commercial quantities of crude oil, natural gas, and associated NGLs from many reservoirs requires the use and disposal of significant quantities of water. Our inability to secure sufficient amounts of water, or to dispose of or recycle the water used in our oil and natural gas segment operations, could adversely impact our operations. Moreover, the imposition of new environmental initiatives and regulations could include restrictions on our ability to conduct certain operations such as hydraulic fracturing or disposal of wastes, including, but not limited to, produced water, drilling fluids, and other wastes associated with the exploration, development or production of oil and natural gas. Compliance with environmental regulations and permit requirements governing the withdrawal, storage and, use of surface water or groundwater necessary for hydraulic fracturing of wells may increase our operating costs and cause delays, interruptions, or termination of our operations, the extent of which cannot be predicted, all of which could have an adverse effect on our operations and financial condition. We may decide not to drill some of the prospects we have identified, and locations that we do drill may not yield oil, NGLs, and natural gas in commercially viable quantities. Our oil and natural gas segment's prospective drilling locations are in various stages of evaluation, ranging from a prospect that is ready to drill to a prospect that will require additional geological and engineering analysis. Based on a variety of factors, including future oil, NGLs, natural gas prices, the generation of additional seismic or geological information, and other factors, we may decide not to drill one or more of these prospects. As a result, we may not be able to increase or maintain our reserves or production, which in turn could have an adverse effect on our business, financial position, and results of operations. In addition, the SEC's reserve reporting rules include a general requirement that, subject to limited exceptions, proved undeveloped reserves may only be booked if they relate to wells scheduled to be drilled within five years of the date of booking. At December 31, 2013, we had 180 proved undeveloped drilling locations. To the extent that we do not drill these locations within five years of initial booking, they may not continue to qualify for classification as proved reserves, and we may be required to reclassify such reserves as unproved reserves. The reclassification of those reserves could also have a negative effect on the borrowing base under our credit facility. The cost of drilling, completing, and operating a well is often uncertain, and cost factors can adversely affect the economics of a well. Our efforts will be uneconomic if we drill dry holes or wells that are productive but do not produce enough oil, NGLs, and natural gas to be commercially viable after drilling, operating, and other costs. The borrowing base under our credit agreement is determined semi-annually at the discretion of the lenders and is based in a large part on the prices for oil, NGLs, and natural gas. Significant declines in oil, NGLs, and natural gas prices may result in a decrease in our borrowing base. The lenders can unilaterally adjust the borrowing base and therefore the borrowings permitted to be outstanding under our credit agreement. If outstanding borrowings are in excess of the borrowing base, we must (a) repay the loan in excess of the borrowing base, (b) dedicate additional properties to the borrowing base, or (c) begin monthly principal payments in accordance with our credit agreement. Potential listing of species as endangered under the federal Endangered Species Act could result in increased costs and new operating restrictions or delays on our operations and that of our customers, which could adversely affect our operations and financial results. The federal Endangered Species Act, referred to as the ESA, and analogous state laws regulate a variety of activities, including oil and gas development, which could have an adverse effect on species listed as threatened or endangered under the ESA or their habitats. The designation of previously unidentified endangered or threatened species could cause oil and natural gas exploration and production operators and service companies to incur additional costs or become subject to operating delays, restrictions or bans in affected areas, which impacts could adversely reduce the amount of drilling activities in affected areas. All three of our business segments could be subject to the effect of one or more species being listed as threatened or endangered within the areas of our operations. Numerous species have been listed or proposed for protected status in areas in which we provide or could in the future undertake operations. For instance, the American Burying Beetle and the Lesser Prairie-Chicken both have habitat in some areas where we operate or provide services. The FWS initiated the process to list the Lesser Prairie- 36
53 Chicken as threatened in November 2012, with a decision expected in March The sage grouse and certain wildflower species, among others, are also species that have been or are being considered for protected status under the ESA and whose range can coincide with oil and natural gas production activities. The presence of protected species in areas where we provide contract drilling or mid-stream services or conduct exploration and production operations could impair our ability to timely complete or carry out those services and, consequently, adversely affect our results of operations and financial position. Our new drilling rig program to design and build new proprietary BOSS drilling rigs is subject to risks, including delays and cost overruns, and may not meet our expectations. We have launched a new drilling rig program to design and build new proprietary 1,500 horsepower AC electric drilling rigs, which we refer to as BOSS drilling rigs. We anticipate that this new drilling rig will position us to more effectively meet the demands of our existing customers, result in additional new-build contract opportunities and allow us to compete for the work of new customers. The construction of new BOSS drilling rigs is subject to the risks of delays or cost overruns inherent in any large construction project as a result of numerous factors, including the following: shortages of equipment, materials or skilled labor; work stoppages and labor disputes; unscheduled delays in the delivery of ordered materials and equipment; unanticipated increases in the cost of equipment, labor and raw materials used in construction of our rigs, particularly steel; weather interferences; difficulties in obtaining necessary permits or in meeting permit conditions; unforeseen design and engineering problems; failure or delay in obtaining acceptance of the rig from our customer; and failure or delay of third party equipment vendors or service providers. As we design and build new BOSS drilling rigs, there can be no assurance that we will: obtain additional new-build contract opportunities; successfully integrate the new rigs with our existing drilling fleet; successfully deploy the new rigs; or successfully improve our financial condition, results of operations or prospects as a result of the new rigs. Cyber attacks targeting systems and infrastructure used by the oil and gas industry may adversely impact our operations. Our business has become increasingly dependent on digital technologies to conduct certain exploration, development and production activities. We depend on digital technology to estimate quantities of natural gas, oil and NGL reserves, process and record financial and operating data, analyze seismic and drilling information, and communicate with our employees and thirdparty partners. Although we utilize various procedures and controls to mitigate our exposure to such risk, cyber attacks are evolving and unpredictable. These attacks could include, but are not limited to, malicious software, attempts to gain unauthorized access to data, other electronic security breaches that could lead to disruptions in critical systems, the unauthorized release of protected information and the corruption or loss of data. The occurrence of such an attack could lead to financial losses and have a negative impact on our results of operations. We are not aware that any such breaches have occurred to date. Item 1B. Unresolved Staff Comments None. Item 2. Properties The information called for by this item was consolidated with and disclosed in connection with Item 1 above. 37
54 Item 3. Legal Proceedings Panola Independent School District No. 4, et al. v. Unit Petroleum Company, No. CJ , District Court of Latimer County, Oklahoma. Panola Independent School District No. 4, Michael Kilpatrick, Gwen Grego, Carla Lessel, Thelma Christine Pate, Juanita Golightly, Melody Culberson and Charlotte Abernathy are the Plaintiffs in this case and are royalty owners in oil and gas drilling and spacing units for which the our exploration segment distributes royalty. The Plaintiffs' central allegation is that our exploration segment has underpaid royalty obligations by deducting post-production costs or marketing related fees. Plaintiffs sought to pursue the case as a class action on behalf of persons who receive royalty from us for our Oklahoma production. We have asserted several defenses including that the deductions are permitted under Oklahoma law. We also asserted that the case should not be tried as a class action due to the materially different circumstances that determine what, if any, deductions are taken for each lease. On December 16, 2009, the trial court entered its order certifying the class. On May 11, 2012, the Court of Civil Appeals reversed the trial court's order certifying the class. The Plaintiffs petitioned the Oklahoma Supreme Court for certiorari and on October 8, 2012, the Plaintiff's petition was denied. The Plaintiffs filed a second request in 2013 to certify a class of royalty owners that is slightly smaller than their first attempt. We will continue to resist certification using the defenses described above, as well as new defenses based on the Court of Civil Appeals' decertification of the Plaintiffs' original class action. The merits of Plaintiffs' claims will remain stayed while class certification issues are pending. Item 4. Mine Safety Disclosures Not applicable. PART II Item 5. Market for the Registrant s Common Equity, Related Stockholder Matters, and Issuer Purchases of Equity Securities Our common stock trades on the New York Stock Exchange under the symbol UNT. The following table identifies the high and low sales prices per share of our common stock for the periods indicated: Quarter High Low High Low First... $ $ $ $ Second... $ $ $ $ Third... $ $ $ $ Fourth... $ $ $ $ On February 14, 2014, the closing sale price of our common stock, as reported by the NYSE, was $52.57 per share. On that date, there were approximately 870 holders of record of our common stock. We have never declared any cash dividends on our common stock. Any future determination by our board of directors to pay dividends on our common stock will be made only after considering our financial condition, results of operations, capital requirements and other relevant factors. Additionally, our bank credit agreement and the Notes prohibit the payment of cash dividends on our common stock under certain circumstances. For further information regarding our bank credit agreement and the Notes agreement s impact on our ability to pay dividends see Our Credit Agreement and Senior Subordinated Notes under Item 7 of this report. Performance Graph. The following graph and related information shall not be deemed soliciting material or be deemed to be filed with the SEC, nor shall such information be incorporated by reference into any future filing, except to the extent that we specifically incorporate it by reference into such filing. 38
55 Set forth below is a line graph comparing our cumulative total shareholder return on our common stock with the cumulative total return of the S&P 500 Stock Index, S&P 600 Oil and Gas Exploration & Production and our peer group which includes Helmerich & Payne, Inc., Patterson UTI Energy Inc. and Pioneer Energy Services Corp. The graph below assumes an investment of $100 at the beginning of the period. The shareholder return set forth below is not necessarily indicative of future performance. 39
56 Item 6. Selected Financial Data The following table shows selected consolidated financial data. The data should be read in conjunction with Item 7 Management s Discussion and Analysis of Financial Condition and Results of Operations, for a review of 2013, 2012, and 2011 activity. As of and for the Year Ended December 31, (In thousands except per share amounts) Revenues (1)... $ 1,351,850 $ 1,315,123 $ 1,207,503 $ 870,671 $ 707,188 Net income (loss)... $ 184,746 $ 23,176 (2) $ 195,867 $ 146,484 $ (55,500) (3) Net income (loss) per common share: Basic... $ 3.83 $ 0.48 $ 4.11 $ 3.10 $ (1.18) Diluted... $ 3.80 $ 0.48 $ 4.08 $ 3.09 $ (1.18) Total assets... $ 4,022,390 $ 3,761,120 $ 3,256,720 $ 2,669,240 $ 2,228,399 Long-term debt (4)... $ 645,696 $ 716,359 $ 300,000 $ 163,000 $ 30,000 Other long-term liabilities... $ 158,331 $ 167,545 $ 113,830 $ 92,389 $ 81,126 Cash dividends per common share... $ $ $ $ $ (1) During the third quarter of 2012, we made the decision to prospectively use mark-to-market accounting for our economic hedges. Previously, we reported all gains (losses) in oil and natural gas revenues and now we reflect gains (losses) on non-designated hedges and the ineffectiveness from cash flow hedges along with other revenue items in other income (expense) below income from operations. Prior year amounts have been reclassified to conform to current year presentation. (2) In June 2012 and December 2012, due to low 12-month average commodity prices, we incurred non-cash ceiling test write downs of our oil and natural gas properties of $115.9 million pre-tax ($72.1 million net of tax) and $167.7 million pre-tax ($104.4 million net of tax), respectively. (3) In March 2009, we incurred a non-cash ceiling test write down of our oil and natural gas properties of $281.2 million pre-tax ($175.1 million net of tax) due to low commodity prices at quarter-end. (4) Long-term debt is net of unamortized discount. 40
57 Item 7. Management s Discussion and Analysis of Financial Condition and Results of Operations Please read the following discussion of our financial condition and results of operations in conjunction with the consolidated financial statements and related notes included in Item 8 of this report. General We operate, manage, and analyze our results of operations through our three principal business segments: Oil and Natural Gas carried out by our subsidiary Unit Petroleum Company. This segment explores, develops, acquires, and produces oil and natural gas properties for our own account. Contract Drilling carried out by our subsidiary Unit Drilling Company and its subsidiaries. This segment contracts to drill onshore oil and natural gas wells for others and for our own account. Mid-Stream carried out by our subsidiary Superior Pipeline Company, L.L.C. and its subsidiaries. This segment buys, sells, gathers, processes, and treats natural gas for third parties and for our own account. Business Outlook Our current 2014 capital budget for all of our business segments forecasts a 33% increase over our 2013 capital expenditures, excluding acquisitions. Our oil and natural gas segment s capital budget is $718.0 million, a 31% increase over 2013, excluding acquisitions and ARO liability. Our drilling segment s capital budget is $132.0 million, a 105% increase over Our plans for 2014 include focusing on our new drilling rig program, a program we launched to design and build a new proprietary 1,500 horsepower AC electric drilling rig, called the BOSS rig. We also plan to refurbish and upgrade several of our existing drilling rigs in order that those drilling rigs can be used in horizontal drilling operations. Our mid-stream segment s capital budget is $78.0 million, a 19% decrease from 2013, excluding acquisitions. New and continued projects are discussed further in the Executive Summary. Our 2014 current capital expenditures budget is based on realized prices for the year of $90.08 per barrel of oil, $29.45 per barrel of NGLs, and $3.77 per Mcf of natural gas. This budget is subject to possible periodic adjustments for various reasons including changes in commodity prices and industry conditions. Funding for the budget will come primarily from internally generated cash flow and, if necessary, borrowings under our credit agreement. As discussed in other parts of this report, the success of our consolidated business, as well as that of each of our three operating segments depends, to a large extent, on: the prices we receive for our oil, NGLs, and natural gas production; the demand for oil, NGLs, and natural gas; and the demand for our drilling rigs which, in turn, influences the amounts we can charge for the use of those drilling rigs. Although all of our current operations (with the exception of a minor amount of production in Canada) are located within the United States, events outside the United States can and do have an impact on us and our industry. In addition to their direct impact on us, low commodity prices if sustained for a long period of time could impact the liquidity of some of our industry partners and customers which, in turn, could limit their ability to meet their financial obligations to us. Executive Summary Oil and Natural Gas Fourth quarter 2013 production from our oil and natural gas segment was 4,438,000 barrels of oil equivalent (Boe), a 5% increase over the third quarter of 2013 and an 8% increase over the fourth quarter of These increases came primarily from production associated with new wells. Oil and NGLs production during the fourth quarter of 2013 was 46% of our total production compared to 41% of our total production during the fourth quarter of Fourth quarter 2013 oil and natural gas revenues increased 11% over the third quarter of 2013 and increased 5% over the fourth quarter of These increases were primarily due to increases in production. 41
58 Our NGLs and natural gas prices for the fourth quarter of 2013 increased 21% and 3%, respectively, over the third quarter of 2013 while our oil prices decreased 1%. Our oil prices increased 3% over the fourth quarter of 2012 while NGLs prices were essentially unchanged and natural gas prices decreased 12%. Direct profit (oil and natural gas revenues less oil and natural gas operating expense) increased 20% over the third quarter of 2013 and 6% over the fourth quarter of The increases were primarily attributable to increased production from developmental drilling and acquisitions. Operating cost per Boe produced for the fourth quarter of 2013 decreased 13% from the third quarter of 2013 and decreased 6% from the fourth quarter of The decrease from the third quarter of 2013 was primarily due to decreased lease operating expenses (LOE) due to decreased workover expense and lower gross production tax resulting from credits received. These decreases were somewhat offset by higher saltwater disposal expenses. The decrease from the fourth quarter of 2012 was primarily due to a decrease in well servicing and transportation charges and a decrease in production taxes due to tax credits. For 2013 we hedged approximately 90% of our average daily oil production and approximately 65% of our average natural gas production to help manage our cash flow and capital expenditure requirements. Currently for 2014 we have hedged approximately 7,250 Bbls per day of oil production and 90,000 Mmbtu per day of natural gas production. The oil production is hedged by swap contracts for 3,250 Bbls per day and collars for 4,000 Bbls per day. The swap transactions were done at a comparable average NYMEX prices of $ The collar transactions were done at a comparable average NYMEX floor price of $90.00 and ceiling price of $ The natural gas production is hedged by swaps for 80,000 Mmbtu per day and a collar for 10,000 Mmbtu per day. The swap transactions were done at a comparable average NYMEX price of $4.24. The collar transaction was done at a comparable average NYMEX floor price of $3.75 and ceiling price of $4.37. Additionally, we have hedged our March 2014 natural gas basis exposure with basis swaps at an average price of -$0.05. In August 2013, we sold some of our Bakken oil and gas properties. The proceeds, net of related expenses, were $57.1 million. In addition, we had other non-core asset sales with proceeds, net of related expenses, of $21.7 million for Proceeds from these dispositions reduced the net book value of the full cost pool with no gain or loss recognized. During 2013, we drilled 149 wells (91.14 net wells). For 2014, we plan to participate in the drilling of approximately 180 wells. Our 2014 production guidance is approximately 19.2 to 19.7 MMBoe, an increase of 15% to 18% over 2013, although actual results will continue to be subject to many factors. This segment s capital budget for 2014 is $718.0 million, a 31% increase over 2013, excluding acquisitions and ARO liability. Contract Drilling The rate at which our drilling rigs were used ( our utilization rate ) for the fourth quarter 2013 was 53%, compared to 51% and 50% for the third quarter of 2013 and the fourth quarter of 2012, respectively. Dayrates for the fourth quarter of 2013 averaged $19,630, a 1% decrease from both the third quarter of 2013 and the fourth quarter of The decreases were primarily due to the expiration of certain contracts during 2013 that had higher rates. Direct profit (contract drilling revenue less contract drilling operating expense) for the fourth quarter of 2013 increased 3% over the third quarter of 2013 and was essentially unchanged from the fourth quarter of For both comparative periods utilization slightly increased. Operating cost per day for the fourth quarter of 2013 decreased 3% from the third quarter of 2013 and 13% from the fourth quarter of The decreases were primarily due to decreases in direct rig expenses and workers' compensation related costs. Today, almost all of our working drilling rigs are drilling horizontal or directional wells for oil and NGLs. Part of this shift included operators moving to shallower oil plays like the Mississippian play in northern Oklahoma and southern Kansas. These shallower plays tend to use drilling rigs with lower horsepower which have lower dayrates and margins. As methods for drilling horizontal wells have improved, demand to drill deeper and longer horizontal wells has once again strengthened demand for higher horsepower rigs. All of these factors ultimately affect the demand and mix of the type of drilling rigs used by our customers. 42
59 As of December 31, 2013, we had 23 term drilling contracts with original terms ranging from six months to three years. Twenty-two of these contracts are up for renewal in 2014, seven in the first quarter, ten in the second quarter, and five in the fourth quarter and one is up for renewal in Term contracts may contain a fixed rate for the duration of the contract or provide for rate adjustments within a specific range from the existing rate. In the second quarter of 2013, we sold one of our 2,000 horsepower electric drilling rigs. During the third and fourth quarters of 2013, we sold three additional 2,000 horsepower and one 3,000 horsepower electric drilling rigs. All of these sales were to unaffiliated third-parties. Four additional idle 3,000 horsepower drilling rigs were sold to an unaffiliated third party in the first quarter of 2014 all of which were classified as assets held for sale at December 31, The proceeds from these various sales will be used in our new drilling rig program we launched to design and build a new proprietary 1,500 horsepower, AC electric drilling rig, called the BOSS rig. We anticipate the BOSS drilling rig will position us to more effectively meet the demands of our existing customers as well as allowing us to compete for the work of new customers. Our anticipated 2014 capital expenditures for this segment are $132.0 million, a 105% increase over The first BOSS drilling rig will be operational the first quarter of 2014 and will work initially for our oil and natural gas segment. Two additional BOSS drilling rigs are contracted to third party operators and are anticipated to be placed into service in the second and third quarters of Mid-Stream Fourth quarter 2013 liquids sold per day increased 12% over the third quarter of 2013 and increased 49% over the fourth quarter of During the third quarter 2012, one of our producers completed construction of their own processing plant and moved their volumes off our system resulting in decreases in liquids sold, gas gathered, and gas processed. In addition, during the fourth quarter of 2012, certain processing plants were rejecting ethane due to weak ethane prices. For the fourth quarter of 2013, gas processed per day increased 3% over the third quarter of 2013 and increased 13% over the fourth quarter of We upgraded several of our existing processing facilities and added processing plants which was the primary reason for increased volumes. For the fourth quarter of 2013, gas gathered per day decreased 4% from the third quarter of 2013 and increased 12% over the fourth quarter of The decrease during the fourth quarter of 2013 was primarily due to the transfer of one system to the oil and natural gas segment. The increase over the fourth quarter of 2012 was primarily from well connects throughout NGLs prices in the fourth quarter of 2013 increased 1% over the prices received in both the third quarter of 2013 and the fourth quarter of Because certain of the contracts used by our mid-stream segment for NGLs transactions are percent of proceeds (POP) contracts under which we receive a share of the proceeds from the sale of the NGLs our revenues from those POP contracts fluctuate based on the prices of NGLs. Direct profit (mid-stream revenues less mid-stream operating expense) for the fourth quarter of 2013 decreased 4% from the third quarter of 2013 and increased 89% over the fourth quarter of The decrease from the third quarter of 2013 was primarily due to higher costs associated with gas purchased and the increase over the fourth quarter of 2012 was primarily due to increased revenues from gas liquids sold. Total operating cost for our this segment for the fourth quarter of 2013 increased 13% over the third quarter of 2013 and increased 40% over the fourth quarter of 2012 due primarily to the cost of gas purchased. After relocating two processing plants from our Hemphill County, Texas facility to our new Reno County, Kansas facility, we now have the capacity to process 135 MMcf per day of our own and third party Granite Wash natural gas production at our Hemphill facility. We completed two pipeline extension projects for a total cost of approximately $5.7 million in the fourth quarter of These extensions will connect additional production from our oil and natural gas segment to this system. We have completed construction of a new gathering and processing facility in Reno County, Kansas. This new system consists of approximately 20 miles of gathering pipeline and two processing plants that were relocated from our Hemphill facility which included a five MMcf per day refrigerated JT plant skid and a 20 MMcf per day turbo expander plant skid. Both plant skids are installed and operational. We began gathering gas at this facility during the second quarter of 2013 and processing gas in the third quarter of At our Cashion facility located in central Oklahoma, we completed the extension of our gathering system approximately three miles at a capital cost of $2.8 million. This extension will allow us to gather additional production from active producers 43
60 in the area. We installed a new 25 MMcf per day high efficiency turbo-expander processing plant at this facility that became operational in March With the installation of this additional plant, our total processing capacity increased to approximately 45 MMcf per day at our Cashion facility. At our Perkins facility located in central Oklahoma, we completed the installation and upgrade of an 8 MMcf per day processing skid which became operational in the first quarter of With this new plant skid operational, our total processing capacity is now 18 MMcf per day. In the Mississippian play in north central Oklahoma, our Bellmon system consists of approximately 185 miles of pipeline, which includes a 26-mile extension to connect our existing Remington facility, a 20-mile NGL line and two owned natural gas processing plants. In the first quarter of 2013, we completed the installation of an owned 30 MMcf per day cryogenic processing plant, which allowed us to take out of service the original rental processing plant. After this owned processing plant was installed and operational, our total processing capacity at this facility was 55 MMcf per day including the original rental processing plant. Due to anticipated increased volumes, we also completed the installation of a new 60 MMcf per day processing plant in the first quarter of With both of these owned processing plants operational we will have capacity to process 90 MMcf per day at this facility. In the Appalachian region, in the fourth quarter of 2012, construction was completed on the first phase of our Pittsburgh Mills gathering facility in Allegheny and Butler Counties, Pennsylvania. The first phase of this project consists of approximately 14 miles of gathering pipeline. In the first quarter of 2013, the related compressor station was completed and operational. We currently have 19 wells connected to this gathering system with plans to continue to add wells as they are drilled. Preliminary activity is underway for the planned expansion of this pipeline into Butler County, Pennsylvania. Right of way has been acquired and construction is scheduled to begin in the second quarter of This expansion is expected to be completed by the end of We completed the construction of the Brookfield gathering system, a new gathering system in north central Pennsylvania. It became operational in the second quarter of In December 2012, we had a $1.2 million write-down of our Erick system. There was no volume from the wells connected to this system, the compressor and related surface equipment have been removed from this location and there is no future activity anticipated from this gathering system. Anticipated 2014 capital expenditures for this segment are $78.0 million, a 19% decrease from 2013, excluding acquisitions. Critical Accounting Policies and Estimates Summary In this section, we identify those critical accounting policies we follow in preparing our financial statements and related disclosures. Many of these policies require us to make difficult, subjective, and complex judgments in the course of making estimates of matters that are inherently imprecise. Some accounting policies involve judgments and uncertainties to such an extent that there is reasonable likelihood that materially different amounts could have been reported under different conditions, or if different assumptions had been used. We evaluate our estimates and assumptions on a regular basis. We base our estimates on historical experience and various other assumptions that we believe are reasonable under the circumstances, the results of which form the basis for making judgments about the carrying values of assets and liabilities that are not readily apparent from other sources. Actual results may differ from these estimates and assumptions used in preparation of our financial statements. In the following discussion we will attempt to explain the nature of these estimates, assumptions and judgments, as well as the likelihood that materially different amounts would be reported in our financial statements under different conditions or using different assumptions. 44
61 The following table lists the critical accounting policies, estimates and assumptions that can have a significant impact on the application of these accounting policies, and the financial statement accounts affected by these estimates and assumptions. Accounting Policies Estimates or Assumptions Accounts Affected Full cost method of accounting for oil, NGLs, and natural gas properties Oil, NGLs, and natural gas reserves, estimates, and related present value of future net revenues Valuation of unproved properties Estimates of future development costs Derivatives measured at fair value Oil and natural gas properties Accumulated depletion, depreciation and amortization Provision for depletion, depreciation and amortization Impairment of oil and natural gas properties Long-term debt and interest expense Accounting for ARO for oil, NGLs, and natural gas properties Cost estimates related to the plugging and abandonment of wells Timing of cost incurred Oil and natural gas properties Accumulated depletion, depreciation and amortization Provision for depletion, depreciation and amortization Current and non-current liabilities Operating expense Accounting for impairment of longlived assets Forecast of undiscounted estimated future net operating cash flows Drilling and mid-stream property and equipment Accumulated depletion, depreciation and amortization Provision for depletion, depreciation and amortization Other intangible assets Goodwill Forecast of discounted estimated future net operating cash flows Terminal value Weighted average cost of capital Goodwill Turnkey and footage drilling contracts Estimates of costs to complete turnkey and footage contracts Revenue and operating expense Current assets and liabilities Accounting for value of stock compensation awards Estimates of stock volatility Estimates of expected life of awards granted Estimates of rates of forfeitures Oil and natural gas properties Shareholder s equity Operating expenses General and administrative expenses Accounting for derivative instruments and hedging Hedges measured for effectiveness and ineffectiveness Non-qualifying and qualifying derivatives measured at fair value Current and non-current derivative assets and liabilities Other comprehensive income as a component of equity Oil and natural gas revenue Gain (loss) on derivatives not designated as hedges and hedge ineffectiveness, net Significant Estimates and Assumptions Full Cost Method of Accounting for Oil, NGLs, and Natural Gas Properties. The determination of our oil, NGLs, and natural gas reserves is a subjective process. It entails estimating underground accumulations of oil, NGLs, and natural gas that cannot be measured in an exact manner. The degree of accuracy of these estimates depends on a number of factors, including, the quality and availability of geological and engineering data, the precision of the interpretations of that data, and individual 45
62 judgments. Each year, we hire an independent petroleum engineering firm to audit our internal evaluation of our reserves. The audit of our reserve wells or locations as of December 31, 2013 included those we projected that comprised 84% of the total proved developed discounted future net income and 91% of the total proved undeveloped discounted future net income based on the unescalated pricing policy of the SEC. Included in Part I, Item 1 of this report are the qualifications of our independent petroleum engineering firm and our personnel responsible for the preparation of our reserve reports. As a general rule, the degree of accuracy of estimating oil, NGLs, and natural gas reserves varies with the reserve classification and the related accumulation of available data, as shown in the following table: Type of Reserves Nature of Available Data Degree of Accuracy Proved undeveloped Data from offsetting wells, seismic data Less accurate Proved developed non-producing The above as well as logs, core samples, well tests, pressure data More accurate Proved developed producing The above as well as production history, pressure data over time Most accurate Assumptions as to future oil, NGLs, and natural gas prices and operating and capital costs also play a significant role in estimating oil, NGLs, and natural gas reserves and the estimated present value of the cash flows to be received from the future production of those reserves. Volumes of recoverable reserves are influenced by the assumed prices and costs due to what is known as the economic limit (that point when the projected costs and expenses of producing recoverable oil, NGLs, and natural gas reserves is greater than the projected revenues from the oil, NGLs, and natural gas reserves). But more significantly, the estimated present value of the future cash flows from our oil, NGLs, and natural gas reserves is extremely sensitive to prices and costs, and may vary materially based on different assumptions. Companies, like ours, using full cost accounting use the unweighted arithmetic average of the commodity prices existing on the first day of each of the 12 months before the end of the reporting period to calculate discounted future revenues, unless prices were otherwise determined under contractual arrangements. We compute our provision for DD&A on a units-of-production method. Each quarter, we use the following formulas to compute the provision for DD&A for our producing properties: DD&A Rate = Unamortized Cost / End of Period Reserves Adjusted for Current Period Production Provision for DD&A = DD&A Rate x Current Period Production Oil, NGLs, and natural gas reserve estimates have a significant impact on our DD&A rate. If reserve estimates for a property or group of properties are revised downward in the future, the DD&A rate will increase as a result of the revision. Alternatively, if reserve estimates are revised upward, the DD&A rate will decrease. Based on our 2013 production level of 16.7 MMBoe, a decrease in the amount of our 2013 oil, NGLs, and natural gas reserves by 5% would increase our DD&A rate by $0.72 per Boe and would decrease pre-tax income by $12.0 million annually. Conversely, an increase in our 2013 oil, NGLs, and natural gas reserves by 5% would decrease our DD&A rate by $0.66 per Boe and would increase pre-tax income by $11.0 million annually. Our DD&A expense on our oil and natural gas properties is calculated each quarter using period end reserve quantities adjusted for current period production. As noted, we account for our oil and natural gas exploration and development activities using the full cost method of accounting. Under this method, all costs incurred in the acquisition, exploration, and development of oil and natural gas properties are capitalized. At the end of each quarter, the net capitalized costs of our oil and natural gas properties are limited to the lower of unamortized cost or a ceiling. The ceiling is defined as the sum of the present value (using a 10% discount rate) of the estimated future net revenues from our proved reserves based on the unescalated 12-month average price on our oil, NGLs, and natural gas adjusted for any cash flow hedges, plus the cost of properties not being amortized, plus the lower of cost or estimated fair value of unproved properties included in the costs being amortized, less related income taxes. If the net capitalized costs of our oil and natural gas properties exceed the ceiling, we are required to write-down the excess amount. A ceiling test write-down is a non-cash charge to earnings. If required, it reduces earnings and impacts shareholders equity in the period of occurrence and results in lower DD&A expense in future periods. Once incurred, a write-down cannot be reversed. 46
63 The risk that we will be required to write-down the carrying value of our oil and natural gas properties increases when oil, NGLs, and natural gas prices are depressed or if we have large downward revisions in our estimated proved oil, NGLs, and natural gas reserves. Application of these rules during periods of relatively low prices, even if temporary, increases the chance of a ceiling test write-down. Based on the application of 12-month 2013 average unescalated prices of $96.94 per barrel of oil, $41.03 per barrel of NGLs, and $3.67 per Mcf of natural gas, then adjusted for price differentials, for the estimated life of the respective properties, the unamortized cost of our oil and natural gas properties did not exceed the ceiling of our proved oil, NGLs, and natural gas reserves. If there are declines in the 12-month average prices, we may be required to record a writedown in future periods. Derivative instruments qualifying as cash flow hedges are included in the computation of limitation on capitalized costs. Our cash flow hedges expired as of December 31, 2013 and no longer effect this computation. Our oil and natural gas hedging is discussed in Note 13 of the Notes to our Consolidated Financial Statements. We use the sales method for recording natural gas sales. This method allows for the recognition of revenue, which may be more or less than our share of pro-rata production from certain wells. Our policy is to expense our pro-rata share of lease operating costs from all wells as incurred. The expenses relating to the wells in which we have an imbalance are not material. Accounting for ARO for Oil, NGLs, and Natural Gas Properties. We record the fair value of liabilities associated with the retirement of assets having a long life. In our case, when the reserves in each of our oil or gas wells deplete or otherwise become uneconomical, we are required to incur costs to plug and abandon the wells. These costs are recorded in the period in which the liability is incurred (at the time the wells are drilled or acquired). We do not have any assets restricted for the purpose of settling these ARO liabilities. Our engineering staff uses historical experience to determine the estimated plugging costs taking into account the type of well (either oil or natural gas), the depth of the well and physical location of the well to determine the estimated plugging costs. Accounting for Impairment of Long-Lived Assets. Drilling equipment, transportation equipment, gas gathering and processing systems, and other property and equipment are carried at cost less accumulated depreciation. Renewals and enhancements are capitalized while repairs and maintenance are expensed. Realization of the carrying value of property and equipment is reviewed for possible impairment whenever events or changes in circumstances suggest that these carrying amounts may not be recoverable. Assets are determined to be impaired if a forecast of undiscounted estimated future net operating cash flows directly related to the asset, including disposal value if any, is less than the carrying amount of the asset. If any asset is determined to be impaired, the loss is measured as the amount by which the carrying amount of the asset exceeds its fair value. The estimate of fair value is based on the best information available, including prices for similar assets. Changes in these estimates could cause us to reduce the carrying value of property and equipment. An estimate of the impact to our earnings if other assumptions had been used is not practicable because of the significant number of assumptions that would be involved in the estimates. In December 2012, our mid-stream segment had a $1.2 million write down of its Erick system. There was no volume from the wells connected to this system, the compressor and related surface equipment have been removed from this location and there is no future activity anticipated from this gathering system. No significant impairment was recorded at December 31, 2013 or Goodwill. Goodwill represents the excess of the cost of acquisitions over the fair value of the net assets acquired. An annual impairment test is performed in the fourth quarter to determine whether the fair value has decreased and additionally when events indicate an impairment may have occurred. Goodwill is all related to our drilling segment, and accordingly, the impairment test is based on the estimated discounted future net cash flows of our drilling segment, utilizing discount rates and other factors in determining the fair value of our drilling segment. No goodwill impairment was recorded at December 31, 2013, 2012, or Turnkey and Footage Drilling Contracts. Because our contract drilling operations do not bear the risk of completion of a well being drilled under a daywork contract, we recognize revenues and expense generated under daywork contracts as the services are performed. Under footage and turnkey contracts we bear the risk of completion of the well, so revenues and expenses are recognized when the well is substantially completed. Substantial completion is determined when the well bore reaches the depth specified in the contract. The entire amount of a loss, if any, is recorded when the loss can be reasonably determined, however, any profit is recorded only at the time the well is finished. The costs of drilling contracts uncompleted at the end of the reporting period (which includes expenses incurred to date on footage or turnkey contracts) are included in other current assets. We did not drill any wells under turnkey or footage contracts in 2013, 2012, or
64 Accounting for Value of Stock Compensation Awards. To account for stock-based compensation, compensation cost is measured at the grant date based on the fair value of an award and is recognized over the service period, which is usually the vesting period. We elected to use the modified prospective method, which requires compensation expense to be recorded for all unvested stock options and other equity-based compensation beginning in the first quarter of adoption. The determination of the fair value of an award requires significant estimates and subjective judgments regarding, among other things, the appropriate option pricing model, the expected life of the award and performance vesting criteria assumptions. As there are inherent uncertainties related to these factors and our judgment in applying them to the fair value determinations, there is risk that the recorded stock compensation may not accurately reflect the amount ultimately earned by the employee. Accounting for Derivative Instruments and Hedging. For our economic hedges that we did not apply cash flow accounting to, any changes in their fair value occurring before their maturity (i.e., temporary fluctuations in value) are reported in gain (loss) on derivatives not designated as hedges and hedge ineffectiveness, net in our Consolidated Statements of Income. The commodity derivative instruments we had under cash flow accounting expired as of December Previous changes in the fair value of derivatives designated as cash flow hedges, to the extent they were effective in offsetting cash flows attributable to the hedged risk, were recorded in OCI until the hedged item was recognized into earnings. When the hedged item was recognized into earnings, it was reported in oil and natural gas revenues. Any change in fair value resulting from ineffectiveness was recognized in gain (loss) on derivatives not designated as hedges and hedge ineffectiveness, net. New Accounting Standards Presentation of an Unrecognized Tax Benefit When a Net Operating Loss Carryforward, a Similar Tax Loss, or a Tax Credit Carryforward Exists. In July 2013, ASU was issued because GAAP does not include explicit guidance on the financial statement presentation of an unrecognized tax benefit when a net operating loss carryforward, a similar tax loss, or a tax credit carryforward exists. The amendment provides explicit guidance on the financial statement presentation of an unrecognized tax benefit when a net operating loss carryforward, a similar tax loss, or a tax credit carryforward exists. The amendments in this Update are effective for fiscal years, and interim periods within those years, beginning after December 15, Early adoption is permitted. The amendments should be applied prospectively to all unrecognized tax benefits that exist at the effective date. Retrospective application is permitted. We anticipate there will be no effect on our financial position or results of operations when adopted. Inclusion of the Fed Funds Effective Swap Rate (or Overnight Index Swap Rate) as a Benchmark Interest Rate for Hedge Accounting Purposes. The FASB has issued ASU , the amendments in this update permit the Fed Funds Effective Swap Rate (OIS) to be used as a U.S. benchmark interest rate for hedge accounting purposes under Topic 815, in addition to U.S. Treasury and LIBOR. The amendments also remove the restriction on using different benchmark rates for similar hedges. The amendments are effective prospectively for qualifying new or redesignated hedging relationships entered into on or after July 17, We do not have any interest rate hedges at this time. Reporting of Amounts Reclassified Out of Accumulated Other Comprehensive Income. In February 2013, the FASB issued ASU to address the presentation of comprehensive income related to ASU The standard requires that companies present, either in a single note or parenthetically on the face of the financial statements, the effect of significant amounts reclassified from each component of accumulated other comprehensive income based on its source (e.g., the release due to cash flow hedges from interest rate contracts) and the income statement line items affected by the reclassification (e.g., interest income or interest expense). The amendments are effective for fiscal years, and interim periods within those years, beginning after December 15, We chose to present the information in a single note (Note 15 of the Notes to our Consolidated Financial Statements). Clarifying the Scope of Disclosures about Offsetting Assets and Liabilities. In January 2013, the FASB issued ASU to limit the scope of balance sheet offsetting disclosures contained in previously issued guidance in ASU Disclosures about Offsetting Assets and Liabilities. Specifically, ASU applies only to derivatives, repurchase agreements and reverse purchase agreements, and securities borrowing and securities lending transactions that are either offset in accordance with specific criteria contained in the FASB Accounting Standards or subject to a master netting arrangement or similar agreement. Unlike IFRS, GAAP allows companies the option to present net in their balance sheets derivatives that are subject to a legally enforceable netting arrangement with the same party where rights of set-off are only available in the event of default or bankruptcy. To address these differences between IFRS and GAAP, the FASB and the IASB (the Boards) issued an exposure draft that proposed new criteria for netting that were narrower than the current conditions currently in GAAP. Nevertheless, in response to feedback from their respective stakeholders, the Boards decided to retain their existing offsetting models. Instead, 48
65 the Boards have issued common disclosure requirements related to offsetting arrangements to allow investors to better compare financial statements prepared in accordance with IFRS or GAAP. The amendments in this ASU require an entity to disclose information about offsetting and related arrangements to enable users of its financial statements to understand the effect of those arrangements on its financial position. An entity is required to apply the amendments for annual reporting periods beginning on or after January 1, 2013, and interim periods within those annual periods. An entity should provide the disclosures required by those amendments retrospectively for all comparative periods presented. Derivatives subject to a master netting agreement are the only transactions in this accounting standard that affect us. We provide the effect of netting on our financial position in Note 14 of the Notes to our Consolidated Financial Statements. Financial Condition and Liquidity Summary. Our financial condition and liquidity depends on the cash flow from our operations and borrowings under our credit agreement. The principal factors determining the amount of our cash flow are: the demand for and the dayrates we receive for our drilling rigs; the quantity of oil, NGLs, and natural gas we produce; the prices we receive for our oil, NGLs, and natural gas production; and the margins we obtain from our natural gas gathering and processing contracts. The following is a summary of certain financial information as of December 31, and for the years ended December 31: (In thousands except percentages) Working capital... $ (31,542) $ (11,495) $ 15,715 Long-term debt (2)... $ 645,696 $ 716,359 $ 300,000 Shareholders equity... $ 2,173,392 $ 1,974,301 (1) $ 1,947,017 Ratio of long-term debt to total capitalization... 23% 27% (1) 13% Net income... $ 184,746 $ 23,176 (1) $ 195,867 Net cash provided by operating activities... $ 674,331 $ 690,911 $ 608,455 Net cash used in investing activities... $ (579,180) $ (1,079,042) $ (768,236) Net cash provided by (used in) financing activities... $ (77,532) $ 388,270 $ 159,257 (1) In June and December 2012, we incurred a non-cash ceiling test write down of our oil and natural gas properties of $115.9 million and $167.7 million pretax ($72.1 million and $104.4 million, net of tax), respectively, due to low 12-month average commodity prices at quarter-end. The write downs impacted our 2012 shareholders equity, ratio of long-term debt to total capitalization and net income. There was no impact on our compliance with the covenants contained in our credit agreement. (2) Long-term debt is net of unamortized discount. 49
66 The following table summarizes certain operating information for the years ended December 31: Oil and Natural Gas: Oil production (MBbls)... 3,360 3,279 2,511 Natural gas liquids production (MBbls)... 3,914 2,796 2,239 Natural gas production (MMcf)... 56,757 48,930 44,104 Average oil price per barrel received... $ $ $ Average oil price per barrel received excluding hedges... $ $ $ Average NGLs price per barrel received... $ $ $ Average NGLs price per barrel received excluding hedges... $ $ $ Average natural gas price per mcf received... $ 3.32 $ 3.37 $ 4.26 Average natural gas price per mcf received excluding hedges... $ 3.33 $ 2.53 $ 3.78 Contract Drilling: Average number of our drilling rigs in use during the period Total number of drilling rigs owned at the end of the period Average dayrate... $ 19,646 $ 19,949 $ 18,842 Mid-Stream: Gas gathered Mcf/day , , ,569 Gas processed Mcf/day , ,987 92,940 Gas liquids sold gallons/day , , ,064 Number of natural gas gathering systems Number of processing plants At December 31, 2013, we had unrestricted cash totaling $18.6 million and had borrowed none of the $500.0 million we currently have available under our credit agreement. Our credit agreement is used primarily for working capital and capital expenditures. On May 18, 2011, we completed the sale of $250.0 million aggregate principal amount of registered senior subordinated notes due 2021 (the 2011 Notes) which bear interest at a rate of 6.625% per year.. The 2011 Notes were issued at par and mature on May 15, The net proceeds were used to repay the $220.3 million we had outstanding as of May 18, 2011 under the credit agreement. The remaining proceeds were used for general working capital purposes. On July 24, 2012, we completed the sale of $400.0 million aggregate principal amount of unregistered senior subordinated notes (the 2012 Notes) due May 15, 2021, which bear interest at a rate of 6.625% per year. The 2012 Notes were sold at 98.75% of par plus accrued interest from May 15, We used the net proceeds from the offering to partially finance the acquisition of oil and natural gas properties from Noble. We incurred $8.7 million of fees that are being amortized as debt issuance cost over the life of the 2012 Notes. On November 13, 2012, we registered with the SEC on Form S-4 an offer to exchange the 2012 Notes for additional notes with materially identical terms to our existing 2011 Notes. The 2011 Notes were registered under the Securities Act. On January 7, 2013, the exchange of the 2012 Notes was completed. The notes issued in exchange for the 2012 Notes are now registered and treated as a single series of debt securities with the 2011 Notes, bringing the total to $650.0 million aggregate principal amount of 6.625% senior subordinated notes (the Notes). The interest is payable semi-annually (in arrears) on May 15 and November 15 of each year, and the Notes will mature on May 15, Working Capital Typically, our working capital balance varies primarily because of the timing of our trade accounts receivable and accounts payable and from the fluctuation in current assets and liabilities associated with the mark to market value of our hedging activity. We had negative working capital of $31.5 million and $11.5 million as of December 31, 2013 and 2012, respectively, and positive working capital of $15.7 million as of December 31, The effect of our derivatives decreased 50
67 working capital by $5.0 million as of December 31, 2013, and increased working capital by $9.6 million and $18.0 million as of December 31, 2012, and 2011, respectively. Impact of Prices for Our Oil, NGLs, and Natural Gas Any significant change in oil, NGLs, or natural gas prices has a material effect on our revenues, cash flow, and the value of our oil, NGLs, and natural gas reserves. Generally, prices and demand for domestic natural gas are influenced by weather conditions, supply imbalances, and by worldwide oil price levels. Domestic oil prices are primarily influenced by world oil market developments. All of these factors are beyond our control and we cannot predict nor measure their future influence on the prices we will receive. Based on our 2013 production, a $0.10 per Mcf change in what we are paid for our natural gas production, without the effect of hedging, would result in a corresponding $448,000 per month ($5.4 million annualized) change in our pre-tax operating cash flow. Our 2013 average natural gas price was $3.32 compared to an average natural gas price of $3.37 for 2012 and $4.26 for A $1.00 per barrel change in our oil price, without the effect of hedging, would have a $268,000 per month ($3.2 million annualized) change in our pre-tax operating cash flow and a $1.00 per barrel change in our NGLs prices, without the effect of hedging, would have a $310,000 per month ($3.7 million annualized) change in our pre-tax operating cash flow based on our production in Our 2013 average oil price per barrel was $95.06 compared with an average oil price of $92.60 in 2012 and $87.18 in 2011, and our 2013 average NGLs price per barrel was $31.79 compared with an average NGLs price of $31.58 in 2012 and $43.64 in Because commodity prices have an effect on the value of our oil, NGLs, and natural gas reserves, declines in those prices can result in a decline in the carrying value of our oil and natural gas properties. Price declines can also adversely affect the semi-annual determination of the amount available for us to borrow under our credit agreement since that determination is based mainly on the value of our oil, NGLs, and natural gas reserves. A reduction could limit our ability to carry out our planned capital projects. Our natural gas production is sold to intrastate and interstate pipelines, to independent marketing firms and gatherers under contracts with terms generally ranging anywhere from one month to five years. Our oil production is sold to independent marketing firms generally under six month contracts. Contract Drilling Many factors influence the number of drilling rigs we are working at any given time as well as the costs and revenues associated with that work. These factors include the demand for drilling rigs in our areas of operation, competition from other drilling contractors, the prevailing prices for oil, NGLs, and natural gas, availability and cost of labor to run our drilling rigs, and our ability to supply the equipment needed. Competition to keep qualified labor continues. We increased compensation for rig personnel in the Rocky Mountain division during the first quarter of We do not currently anticipate any further increases. Today, almost all of our working drilling rigs are drilling horizontal or directional wells for oil and NGLs. Part of this shift included operators moving to shallower oil plays like the Mississippian play in northern Oklahoma and southern Kansas. These shallower plays tend to use drilling rigs with lower horsepower which have lower dayrates and margins. As methods for drilling and completing horizontal wells have improved, demand to drill deeper and longer horizontal wells has once again strengthened demand for qualified higher horsepower rigs. All of these factors ultimately affect the demand and mix of the type of drilling rigs used by our customers. The future demand for and the availability of drilling rigs to meet that demand will have an impact on our future dayrates. For 2013, our average dayrate was $19,646 per day compared to $19,949 per day for Our average number of drilling rigs used in 2013 was 65.0 (52%) compared with 73.9 (58%) in Based on the average utilization of our drilling rigs during 2013, a $100 per day change in dayrates has a $6,500 per day ($2.4 million annualized) change in our pre-tax operating cash flow. Our contract drilling segment provides drilling services for our exploration and production segment. Some of the drilling services we perform on our properties are, depending on the timing of those services, deemed to be associated with the acquisition of an ownership interest in the property. In those cases, revenues and expenses for those services are eliminated in our income statement, with any profit recognized as a reduction in our investment in our oil and natural gas properties. The contracts for these services are issued under the same conditions and rates as the contracts entered into with unrelated third 51
68 parties. We eliminated revenue of $64.3 million, $49.6 million, and $52.2 million for 2013, 2012, and 2011, respectively, from our contract drilling segment and eliminated the associated operating expense of $46.9 million, $34.1 million, and $32.6 million during 2013, 2012, and 2011, respectively, yielding $17.4 million, $15.5 million, and $19.6 million during 2013, 2012, and 2011, respectively, as a reduction to the carrying value of our oil and natural gas properties. Mid-Stream This segment is engaged primarily in the buying, selling, gathering, processing, and treating of natural gas. It operates three natural gas treatment plants, 15 processing plants, 38 gathering systems, and approximately 1,500 miles of pipeline. Its operations are located in Oklahoma, Texas, Kansas, Pennsylvania, and West Virginia. This segment enhances our ability to gather and market not only our own natural gas and NGLs but also that owned by third parties and serves as a mechanism through which we can construct or acquire existing natural gas gathering and processing facilities. During 2013, 2012, and 2011 this segment purchased $83.0 million, $68.2 million, and $71.5 million, respectively, of our oil and natural gas segment's natural gas and NGLs production, and provided gathering and transportation services of $8.0 million, $5.1 million, and $4.6 million, respectively. Intercompany revenue from services and purchases of production between this business segment and our oil and natural gas segment has been eliminated in our consolidated financial statements. Our mid-stream segment gathered an average of 309,554 Mcf per day in 2013 compared to 250,290 Mcf per day in 2012 and 188,569 Mcf per day in It processed an average of 140,584 Mcf per day in 2013 compared to 133,987 Mcf per day in 2012 and 92,940 Mcf per day in 2011, and sold NGLs of 543,602 gallons per day in 2013 compared to 542,578 gallons per day in 2012 and 412,064 gallons per day in Gas gathering volumes per day in 2013 increased primarily from new wells connected to our systems throughout 2013 along with the addition of new systems and the expansion of existing systems. Volumes processed and NGLs sold both increased primarily due to the addition of new wells connected, recent upgrades to several existing processing facilities, and the addition of new processing facilities. Our Credit Agreement and Senior Subordinated Notes Credit Agreement. Under our Senior Credit Agreement (credit agreement) the amount available to be borrowed is the lesser of the amount we elect (from time to time) as the commitment amount ($500.0 million) or the value of the borrowing base as determined by the lenders ($800.0 million), but in either event not to exceed the maximum credit agreement amount of $900.0 million. We are charged a commitment fee ranging from to 0.50 of 1% on the amount available but not borrowed. The rate varies based on the amount borrowed as a percentage of the amount of the total borrowing base. The credit agreement matures as of September 13, We paid $1.5 million in origination, agency, syndication, and other related fees when the credit agreement was amended on September 5, We are amortizing these fees over the life of the credit agreement. At both December 31, 2013 and February 14, 2014, there were no borrowings. The current lenders under our credit agreement and their respective participation interests are as follows: Participation Lender Interest BOK (BOKF, NA, dba Bank of Oklahoma) % BBVA Compass Bank % Bank of Montreal % Bank of America, N.A % Comerica Bank... 8 % Crédit Agricole Corporate and Investment Bank, London Branch... 8 % Wells Fargo Bank, National Association... 8 % Canadian Imperial Bank of Commerce... 8 % The Bank of Nova Scotia... 4 % 100% The amount of the borrowing base, which is subject to redetermination by the lenders on April 1st and October 1st of each year, is based primarily on a percentage of the discounted future value of our oil and natural gas reserves. There was no change to the borrowing base as of the October 1, 2013 redetermination. We or the lenders may request a onetime special 52
69 redetermination of the borrowing base between each scheduled redetermination. In addition, we may request a redetermination following the completion of an acquisition that meets the requirements set forth in the credit agreement. At our election, any part of the outstanding debt under the credit agreement may be fixed at a London Interbank Offered Rate (LIBOR). LIBOR interest is computed as the sum of the LIBOR base for the applicable term plus 1.75% to 2.50% depending on the level of debt as a percentage of the borrowing base and is payable at the end of each term, or every 90 days, whichever is less. Borrowings not under LIBOR bear interest at the prime rate specified in the agreement,which cannot be less than LIBOR plus 1.00%. Interest is payable at the end of each month, and the principal may be repaid in whole or in part at anytime, without a premium or penalty. We can use borrowings for financing general working capital requirements for (a) exploration, development, production and acquisition of oil and gas properties, (b) acquisitions and operation of mid-stream assets, (c) issuance of standby letters of credit, (d) contract drilling services, and (e) general corporate purposes. The credit agreement prohibits, among other things: the payment of dividends (other than stock dividends) during any fiscal year in excess of 30% of our consolidated net income for the preceding fiscal year; the incurrence of additional debt with certain limited exceptions; and the creation or existence of mortgages or liens, other than those in the ordinary course of business, on any of our properties, except in favor of our lenders. The credit agreement also requires that we have at the end of each quarter: a current ratio (as defined in the credit agreement) of not less than 1 to 1; and a leverage ratio of funded debt to consolidated EBITDA (as defined in the credit agreement) for the most recently ended rolling four fiscal quarters of no greater than 4 to 1. As of December 31, 2013, we were in compliance with the covenants contained in the credit agreement % Senior Subordinated Notes. On May 18, 2011, we completed the sale of $250.0 million aggregate principal amount of registered senior subordinated notes due 2021 (the 2011 Notes) which bear interest at a rate of 6.625% per year. The Notes were issued at par and mature on May 15, We received net proceeds of approximately $244.0 million after deducting fees of approximately $6.0 million. Those fees are being amortized as deferred financing costs over the life of the Notes. We used the net proceeds to repay outstanding borrowings under our credit agreement, which was $220.3 million on May 18, The remaining proceeds were used for general working capital purposes. On July 24, 2012, we completed the sale of $400.0 million aggregate principal amount of unregistered senior subordinated notes (the 2012 Notes) due May 15, 2021, which bear interest at a rate of 6.625% per year. The 2012 Notes were sold at 98.75% of par plus accrued interest from May 15, We used the net proceeds from the offering to partially finance the acquisition of oil and natural gas properties from Noble. We incurred $8.7 million of fees that are being amortized as debt issuance cost over the life of the 2012 Notes. On November 13, 2012, we registered with the SEC on Form S-4 an offer to exchange the 2012 Notes for additional notes with materially identical terms to our existing 2011 Notes, which were registered under the Securities Act. On January 7, 2013, the exchange of the 2012 Notes was completed. The notes issued in exchange for the 2012 Notes are now registered and treated as a single series of debt securities with the 2011 Notes, bringing the total to $650.0 million aggregate principal amount of 6.625% senior subordinated notes (the Notes). The interest is payable semi-annually (in arrears) on May 15 and November 15 of each year, and the Notes will mature on May 15, The notes are guaranteed by our 100% owned domestic direct and indirect subsidiaries (the Guarantors). Unit, as the parent company, has no independent assets or operations. The guarantees registered under the registration statement are full and unconditional and joint and several, subject to certain automatic customary releases, including sale, disposition, or transfer of the capital stock or substantially all of the assets of a subsidiary guarantor, exercise of legal defeasance option or covenant defeasance option, and designation of a subsidiary guarantor as unrestricted in accordance with the governing Indenture. Any subsidiaries of Unit other than the Guarantors are minor. There are no significant restrictions on the ability of Unit to receive funds from its subsidiaries through dividends, loans, advances, or otherwise. 53
70 The Notes are subject to an Indenture dated as of May 18, 2011, between us and Wilmington Trust, National Association (successor to Wilmington Trust FSB), as Trustee (the Trustee), as supplemented by the First Supplemental Indenture thereto dated as of May 18, 2011, between us, the Guarantors, and the Trustee, and as further supplemented by that the Second Supplemental Indenture thereto dated as of January 7, 2013, between us, the Guarantors and the Trustee, establishing the terms and providing for the issuance of the Notes (as supplemented, the 2011 Indenture). The discussion of the Notes in this report is qualified by and subject to the actual terms of the 2011 Indenture. On and after May 15, 2016, we may redeem all or, from time to time, a part of the Notes at certain redemption prices, plus accrued and unpaid interest. Before May 15, 2014, we may on any one or more occasions redeem up to 35% of the original principal amount of the Notes with the net cash proceeds of one or more equity offerings at a redemption price of % of the principal amount, plus accrued and unpaid interest, if any, to the redemption date, provided that at least 65% of the original principal amount of the Notes remains outstanding after each redemption. In addition, at any time before May 15, 2016, we may redeem the Notes, in whole or in part, at a redemption price equal to 100% of the principal amount plus a make whole premium, plus accrued and unpaid interest, if any, to the redemption date. If a change of control occurs, subject to certain conditions, we must offer to repurchase from each holder all or any part of that holder s Notes at a purchase price in cash equal to 101% of the principal amount of the Notes plus accrued and unpaid interest, if any, to the date of purchase. The Indenture contains customary events of default. The Indenture contains covenants that, among other things, limit our ability and the ability of certain of our subsidiaries to incur or guarantee additional indebtedness; pay dividends on our capital stock or redeem capital stock or subordinated indebtedness; transfer or sell assets; make investments; incur liens; enter into transactions with our affiliates; and merge or consolidate with other companies. We were in compliance with all covenants of the Notes as of December 31, Capital Requirements Oil and Natural Gas Dispositions, Acquisitions, and Capital Expenditures. Most of our capital expenditures for this segment are discretionary and directed toward future growth. Any decision to increase our oil, NGLs, and natural gas reserves through acquisitions or through drilling depends on the prevailing or expected market conditions, potential return on investment, future drilling potential, and opportunities to obtain financing under the circumstances involved, all of which provide us with a large degree of flexibility in deciding when and if to incur these costs. We completed drilling 149 gross wells (91.14 net wells) in 2013 compared to 171 gross wells (80.08 net wells) in 2012, and 160 gross wells (82.42 net wells) in Our 2013 total capital expenditures for our oil and natural gas segment, excluding an $18.0 million reduction in the ARO liability, totaled $549.2 million compared to 2012 capital expenditures of $521.2 million (excluding a $45.1 million ARO liability and $579.0 million for acquisitions), and 2011 capital expenditures of $514.8 million (excluding a $23.3 million ARO liability and $50.0 million for acquisitions). For all of 2014, we plan to participate in drilling approximately 180 wells and estimate our total capital expenditures (excluding any possible acquisitions) for our oil and natural gas segment will be approximately $718.0 million. Whether we are able to drill all of those wells is dependent on a number of factors, many of which are beyond our control and include the availability of drilling rigs, availability of pressure pumping services, prices for oil, NGLs, and natural gas, demand for oil, NGLs, and natural gas, the cost to drill wells, the weather, and the efforts of outside industry partners. On July 20, 2011, we acquired certain producing properties from an unaffiliated seller for approximately $12.3 million in cash, after post-closing adjustments, consisting of 30 operated wells and 59 non-operated well interests located in Beaver, Harper, and Ellis Counties, Oklahoma and Lipscomb County, Texas. The purchase price allocation was $8.4 million for proved properties and $3.9 million for acreage. On August 31, 2011, we acquired certain producing oil and gas properties for $30.5 million in cash from an unaffiliated seller. Included in the acquisition were more than 500 wells located principally in the Oklahoma Arkoma Woodford and Hartshorne Coal plays along with other properties located throughout Oklahoma and Texas. The acquisition also included approximately 55,000 net acres of which 96% was held by production. On September 17, 2012, we closed on the acquisition of certain oil and natural gas assets from Noble. After final closing adjustments, the acquisition included approximately 83,000 net acres primarily in the Granite Wash, Cleveland, and various other plays in western Oklahoma and the Texas Panhandle. The adjusted amount paid was $592.6 million. Also in September 2012, we sold our interest in certain Bakken properties. The proceeds, net of related expenses, were $226.6 million. In addition, we sold certain oil and natural gas assets located in Brazos and Madison Counties, Texas for approximately $44.1 million. In August 2013, we sold additional Bakken property interests. The proceeds, net of related 54
71 expenses, were $57.1 million. In addition, we had other non-core asset sales with proceeds, net of related expenses, of $21.7 million for Proceeds from these dispositions reduced the net book value of the full cost pool with no gain or loss recognized. Drilling Dispositions, Acquisitions, and Capital Expenditures. During 2011, we were awarded two additional new build drilling rig contracts for 1,500 horsepower, diesel-electric drilling rigs. One was placed into service during the fourth quarter of 2011 and the other was placed in service during the first quarter of 2012, both in Wyoming. During the first quarter of 2012, we sold an idle 600 horsepower mechanical drilling rig to an unaffiliated third-party. Additionally, in the second quarter we placed another new 1,500 horsepower, diesel-electric drilling rig to work in North Dakota under a three year contract. During the third quarter of 2012, we had a fire on one of our drilling rigs located in the mid-continent region. The net book value of the damaged equipment was $3.2 million. All of the net book value of the damaged equipment was recoverable from insurance proceeds. No personnel were injured in this incident. In the second quarter of 2013, we sold one of our 2,000 horsepower electric drilling rigs. During the third and fourth quarters of 2013, we sold three additional 2,000 horsepower and one 3,000 horsepower electric drilling rigs. All of these sales were to unaffiliated third-parties. Four additional idle 3,000 horsepower drilling rigs were sold to an unaffiliated third party in the first quarter of 2014 all of which were classified as assets held for sale at December 31, The proceeds from these various sales will be used in our new drilling rig program we launched to design and build a new proprietary 1,500 horsepower, AC electric drilling rig, called the BOSS rig. We anticipate the BOSS drilling rig will position us to more effectively meet the demands of our existing customers as well as allowing us to compete for the work of new customers. The first BOSS drilling rig will be operational the first quarter of 2014 and will work initially for our oil and natural gas segment. Two additional BOSS drilling rigs are contracted to third party operators and are anticipated to be placed into service in the second and third quarters of Our anticipated 2014 capital expenditures for this segment are $132.0 million. We have spent $64.3 million for capital expenditures during 2013 compared to $77.5 million in 2012, and $162.2 million in Mid-Stream Dispositions, Acquisitions, and Capital Expenditures. After relocating two processing plants from our Hemphill County, Texas facility to our new Reno County, Kansas facility, we now have the capacity to process 135 MMcf per day of our own and third party Granite Wash natural gas production at our Hemphill facility. We completed two pipeline extension projects for a total cost of approximately $5.7 million in the fourth quarter of These extensions will connect additional production from our oil and natural gas segment to this system. We have completed construction of a new gathering and processing facility in Reno County, Kansas. This new system consists of approximately 20 miles of gathering pipeline and two processing plants that were relocated from our Hemphill facility which included a five MMcf per day refrigeration plant skid and a 20 MMcf per day turbo expander plant skid. Both plant skids are installed and operational. We began gathering gas at this facility during the second quarter of 2013 and processing gas in the third quarter of At our Cashion facility located in central Oklahoma, we completed the extension of our gathering system approximately three miles at a capital cost of $2.8 million. This extension will allow us to gather additional production from active producers in the area. We installed a new 25 MMcf per day high efficiency turbo-expander processing plant at this facility that became operational in March With the installation of this additional plant, our total processing capacity increased to approximately 45 MMcf per day at our Cashion facility. At our Perkins facility located in central Oklahoma, we completed the installation and upgrade of an 8 MMcf per day processing skid which became operational in the first quarter of With this new plant skid operational, our total processing capacity is now 18 MMcf per day. In the Mississippian play in north central Oklahoma, our Bellmon system consists of approximately 185 miles of pipeline, which includes a 26-mile extension to connect our existing Remington facility, a 20-mile NGL line and two owned natural gas processing plants. In the first quarter of 2013, we completed the installation of an owned 30 MMcf per day cryogenic processing plant, which allowed us to take out of service the original rental processing plant. After this owned processing plant was installed and operational, our total processing capacity at this facility was 55 MMcf per day including the original rental 55
72 processing plan. Due to anticipated increased volumes, we also completed the installation of a new 60 MMcf per day processing plant in the first quarter of With both of these owned processing plants operational we will have capacity to process 90 MMcf per day at this facility. In the Appalachian region, in the fourth quarter of 2012, construction was completed on the first phase of our Pittsburgh Mills gathering facility in Allegheny and Butler Counties, Pennsylvania. The first phase of this project consists of approximately 14 miles of gathering pipeline. In the first quarter of 2013, the related compressor station was completed and operational. We currently have 19 wells connected to this gathering system with plans to continue to add wells as they are drilled. Preliminary activity is underway for the planned expansion of this pipeline into Butler County, Pennsylvania. Right of way has been acquired and construction is scheduled to begin in the second quarter of This expansion is expected to be completed by the end of We completed the construction of the Brookfield gathering system, a new gathering system in north central Pennsylvania. It became operational in the second quarter of In December 2012, we had a $1.2 million write-down of its Erick system. There was no volume from the wells connected to this system, the compressor and related surface equipment have been removed from this location and there is no future activity anticipated from this gathering system. During 2013, our mid-stream segment incurred $96.1 million in capital expenditures as compared to $183.2 million ($18.7 million on four gathering systems acquired in the Noble acquisition) in 2012 and $79.4 million in 2011, including acquisitions. For 2014, our estimated capital expenditures (excluding acquisitions) are $78.0 million. At December 31, 2013, we had committed to purchase a gas treating plant for the remaining payment of $0.6 million within the next twelve months. Contractual Commitments At December 31, 2013, we had the following contractual obligations: Total Less Than 1 Year Payments Due by Period 2-3 Years (In thousands) 4-5 Years After 5 Years Long-term debt (1)... $ 1,021,281 $ 43,062 $ 86,125 $ 86,125 $ 805,969 Operating leases (2)... 12,640 8,480 4, Drill pipe, drilling components and equipment purchases (3)... 12,021 12,021 Total contractual obligations... $ 1,045,942 $ 63,563 $ 90,169 $ 86,241 $ 805,969 (1) See previous discussion in MD&A regarding our long-term debt. This obligation is presented in accordance with the terms of the Notes and credit agreement and includes interest calculated using our December 31, 2013 interest rates of 6.625% for the Notes. (2) We lease office space or yards in Edmond, Oklahoma City, and Tulsa, Oklahoma; Houston, Texas; Englewood, Colorado; Pinedale, Wyoming; and Pittsburgh, Pennsylvania under the terms of operating leases expiring through September, Additionally, we have several equipment leases and lease space on short-term commitments to stack excess drilling rig equipment and production inventory. (3) We have committed to purchase approximately $11.4 million of new drilling rig components, drill pipe, and related equipment and $0.6 million towards a gas treating plant over the next twelve months. 56
73 At December 31, 2013, we also had the following commitments and contingencies that could create, increase or accelerate our liabilities: Other Commitments Total Accrued Estimated Amount of Commitment Expiration Per Period Less Than 1 Year 2-3 Years (In thousands) 4-5 Years After 5 Years Deferred compensation plan (1)... $ 3,589 Unknown Unknown Unknown Unknown Separation benefit plans (2)... $ 9,382 $ 351 Unknown Unknown Unknown Derivative liabilities commodity hedges... $ 5,561 $ 5,561 $ $ $ ARO liability (3)... $ 133,657 $ 2,954 $ 40,261 $ 6,503 $ 83,939 Gas balancing liability (4)... $ 3,775 Unknown Unknown Unknown Unknown Repurchase obligations (5)... $ Unknown Unknown Unknown Unknown Workers compensation liability (6)... $ 20,041 $ 8,808 $ 2,861 $ 1,154 $ 7,218 (1) We provide a salary deferral plan which allows participants to defer the recognition of salary for income tax purposes until actual distribution of benefits, which occurs at either termination of employment, death or certain defined unforeseeable emergency hardships. We recognize payroll expense and record a liability, included in other long-term liabilities in our Consolidated Balance Sheets, at the time of deferral. (2) Effective January 1, 1997, we adopted a separation benefit plan ( Separation Plan ). The Separation Plan allows eligible employees whose employment with us is involuntarily terminated or, in the case of an employee who has completed 20 years of service, voluntarily or involuntarily terminated, to receive benefits equivalent to four weeks salary for every whole year of service completed with the company up to a maximum of 104 weeks. To receive payments the recipient must waive certain claims against us in exchange for receiving the separation benefits. On October 28, 1997, we adopted a Separation Benefit Plan for Senior Management ( Senior Plan ). The Senior Plan provides certain officers and key executives of the company with benefits generally equivalent to the Separation Plan. The Compensation Committee of the Board of Directors has absolute discretion in the selection of the individuals covered in this plan. On May 5, 2004 we also adopted the Special Separation Benefit Plan ( Special Plan ). This plan is identical to the Separation Benefit Plan with the exception that the benefits under the plan vest on the earliest of a participant s reaching the age of 65 or serving 20 years with the company. On December 31, 2008, all these plans were amended to bring the plans into compliance with Section 409A of the Internal Revenue Code of 1986, as amended. (3) When a well is drilled or acquired, under ASC 410 Accounting for Asset Retirement Obligations, we record the fair value of liabilities associated with the retirement of long-lived assets (mainly plugging and abandonment costs for our depleted wells). (4) We have recorded a liability for those properties we believe do not have sufficient oil, NGLs, and natural gas reserves to allow the under-produced owners to recover their under-production from future production volumes. (5) We formed The Unit 1984 Oil and Gas Limited Partnership and the 1986 Energy Income Limited Partnership along with private limited partnerships (the Partnerships ) with certain qualified employees, officers and directors from 1984 through 2011, with a subsidiary of ours serving as general partner. The Partnerships were formed for the purpose of conducting oil and natural gas acquisition, drilling and development operations and serving as co-general partner with us in any additional limited partnerships formed during that year. The Partnerships participated on a proportionate basis with us in most drilling operations and most producing property acquisitions commenced by us for our own account during the period from the formation of the Partnership through December 31 of that year. These partnership agreements require, on the election of a limited partner, that we repurchase the limited partner s interest at amounts to be determined by appraisal in the future. Repurchases in any one year are limited to 20% of the units outstanding. We made repurchases of $16,000, $56,000, and $22,000 in 2013, 2012, and 2011, respectively. (6) We have recorded a liability for future estimated payments related to workers compensation claims primarily associated with our contract drilling segment. Derivative Activities Periodically we enter into derivative transactions locking in the prices to be received for a portion of our oil, NGLs, and natural gas production. In August 2012, we determined on a prospective basis to enter into economic hedges without electing cash flow hedge accounting. All of our previous cash flow hedges expired as of December 31, Therefore, the change in fair value, on all commodity derivatives entered into are reflected in the income statement and not in accumulated other comprehensive income. 57
74 Commodity Hedges. Our commodity hedging is intended to reduce our exposure to price volatility and manage price risks. Our decision on the type and quantity of our production and the price(s) of our hedge(s) is based, in part, on our view of current and future market conditions. As of December 31, 2013, based on our fourth quarter 2013 average daily production, the approximated percentages of our production that we have hedged are as follows: Mark-to-Market 2014 Daily oil production... 75% Daily natural gas production... 58% With respect to the commodities subject to our hedges, the use of hedging limits the risk of adverse downward price movements. However, it also limits increases in future revenues that would otherwise result from price movements above the hedged prices. The use of derivative transactions carries with it the risk that one or more of the counterparties may not be able to meet their financial obligations under the transactions. Based on our evaluation at December 31, 2013, we determined that there was no material risk of non-performance by any of our counterparties. At December 31, 2013, the fair values of the net assets (liabilities) we had with each of the counterparties to our commodity derivative transactions are as follows: December 31, 2013 (In millions) Canadian Imperial Bank of Commerce... $ 0.5 Scotiabank... (0.3) Bank of Montreal... (5.2) Total assets (liabilities)... $ (5.0) If a legal right of set-off exists, we net the value of the derivative arrangements we have with the same counterparty in our consolidated balance sheets. At December 31, 2013, we recorded the fair value of our commodity derivatives on our balance sheet as current derivative assets of $0.5 million and current derivative liabilities of $5.6 million. At December 31, 2012, we recorded the fair value of our commodity derivatives on our balance sheet as current derivative assets of $16.5 million and current and non-current derivative liabilities of $1.9 million and $0.6 million, respectively. For our economic hedges that we did not apply cash flow accounting to, any changes in their fair value occurring before their maturity (i.e., temporary fluctuations in value) are reported in gain (loss) on derivatives not designated as hedges and hedge ineffectiveness, net in our Consolidated Statements of Income. The commodity derivative instruments we had under cash flow accounting expired as of December Previous changes in the fair value of derivatives designated as cash flow hedges, to the extent they were effective in offsetting cash flows attributable to the hedged risk, were recorded in OCI until the hedged item was recognized into earnings. When the hedged item was recognized into earnings, it was reported in oil and natural gas revenues. Any change in fair value resulting from ineffectiveness was recognized in gain (loss) on derivatives not designated as hedges and hedge ineffectiveness, net. 58
75 These gains (losses) are as follows at December 31: Gain (loss) on derivatives not designated as hedges and hedge ineffectiveness, net: (In thousands) Gain (loss) on derivatives not designated as hedges, included are amounts settled during the period of ($1,764), $0, and ($711), respectively... $ (8,184) $ 1,373 $ (1,047) Gain (loss) on ineffectiveness of cash flow hedges... (190) (2,616) 2,749 $ (8,374) $ (1,243) $ 1,702 Stock and Incentive Compensation During 2013, we granted awards covering 474,677 shares of restricted stock. These awards were granted as retention incentive awards. These stock awards had an estimated fair value as of the grant date of $21.3 million. Compensation expense will be recognized over the awards' three year vesting period. During 2013, we recognized $8.5 million in additional compensation expense and capitalized $1.9 million for these awards. During 2012, we granted awards covering 401,051 shares of restricted stock. These awards were granted as retention incentive awards and are being recognized over the awards' three year vesting period. During 2011, we granted awards covering 211,050 shares of restricted stock. These awards were granted as retention incentive awards and are being recognized over their two and three year vesting periods. No SAR awards were made during 2013, 2012, or During 2013, we recognized compensation expense of $16.1 million for our restricted stock grants and capitalized $3.5 million of compensation cost for oil and natural gas properties. Insurance We are self-insured for certain losses relating to workers compensation, control of well, and employee medical benefits. Insured policies for other coverages contain deductibles or retentions per occurrence that range from $50,000 to $1.5 million. We have purchased stop-loss coverage in order to limit, to the extent feasible, per occurrence and aggregate exposure to certain types of claims. However, there is no assurance that the insurance coverages we have will adequately protect us against liability from all potential consequences. We have elected to use an ERISA governed occupational injury benefit plan to cover our drilling segment employees in Texas in lieu of covering them under Texas Workers Compensation. If insurance coverage becomes more expensive, we may choose to self-insure, decrease our limits, raise our deductibles or any combination of these rather than pay higher premiums. Oil and Natural Gas Limited Partnerships and Other Entity Relationships. We are the general partner of 16 oil and natural gas partnerships which were formed privately or publicly. Each partnership s revenues and costs are shared under formulas set out in that partnership s agreement. The partnerships repay us for contract drilling, well supervision and general and administrative expense. Related party transactions for contract drilling and well supervision fees are the related party s share of such costs. These costs are billed on the same basis as billings to unrelated third parties for similar services. General and administrative reimbursements consist of direct general and administrative expense incurred on the related party s behalf as well as indirect expenses assigned to the related parties. Allocations are based on the related party s level of activity and are considered by us to be reasonable. During 2013, 2012, and 2011, the total we received for all of these fees was $0.5 million, $0.7 million, and $1.4 million, respectively. Our proportionate share of assets, liabilities, and net income relating to the oil and natural gas partnerships is included in our consolidated financial statements. Effects of Inflation The effect of inflation in the oil and natural gas industry is primarily driven by the prices for oil, NGLs, and natural gas. Increases in these prices increase the demand for our contract drilling rigs and services. This increase in demand in turn affects the dayrates we can obtain for our contract drilling services. During periods of higher demand for our drilling rigs we have experienced increases in labor costs as well as the costs of services to support our drilling rigs. Historically, during this same period, when oil, NGLs, and natural gas prices did decline, labor rates did not come back down to the levels existing before the 59
76 increases. If commodity prices increase substantially for a long period, shortages in support equipment (such as drill pipe, third party services, and qualified labor) can result in additional increases in our material and labor costs. Increases in dayrates for drilling rigs also increase the cost of our oil and natural gas properties. How inflation will affect us in the future will depend on increases, if any, realized in our drilling rig rates, the prices we receive for our oil, NGLs, and natural gas, and the rates we receive for gathering and processing natural gas. Off-Balance Sheet Arrangements We do not currently utilize any off-balance sheet arrangements with unconsolidated entities to enhance liquidity and capital resource positions, or for any other purpose. However, as is customary in the oil and gas industry, we are subject to various contractual commitments. 60
77 Results of Operations 2013 versus 2012 Following is a comparison of selected operating and financial data: Percent Change (1) Total operating revenue... $ 1,351,850,000 $ 1,315,123,000 3 % Net income... $ 184,746,000 $ 23,176,000 NM Oil and Natural Gas: Revenue... $ 649,718,000 $ 567,944, % Operating costs excluding depreciation, depletion, amortization, and impairment... $ 184,001,000 $ 150,212, % Average oil price received (Bbl)... $ $ % Average NGL price received (Bbl)... $ $ % Average natural gas price received (Mcf)... $ 3.32 $ 3.37 (1)% Oil production (Bbl)... 3,360,000 3,279,000 2 % NGLs production (Bbl)... 3,914,000 2,796, % Natural gas production (Mcf)... 56,757,000 48,930, % Depreciation, depletion, and amortization rate (Boe)... $ $ (9)% Depreciation, depletion, and amortization... $ 226,498,000 $ 211,347,000 7 % Impairment of oil and natural gas properties... $ $ 283,606,000 NM Contract Drilling: Revenue... $ 414,778,000 $ 529,719,000 (22)% Operating costs excluding depreciation... $ 247,280,000 $ 289,524,000 (15)% Percentage of revenue from daywork contracts % 100% Average number of drilling rigs in use (12)% Average dayrate on daywork contracts... $ 19,646 $ 19,949 (2)% Depreciation... $ 71,194,000 $ 81,007,000 (12)% Mid-Stream: Revenue... $ 287,354,000 $ 217,460, % Operating costs excluding depreciation, amortization, and impairment... $ 243,406,000 $ 187,292, % Depreciation, amortization, and impairment... $ 33,191,000 $ 24,388, % Gas gathered Mcf/day , , % Gas processed Mcf/day , ,987 5 % Gas liquids sold gallons/day , ,578 % General and administrative expense... $ 38,323,000 $ 33,086, % Gain on disposition of assets... $ (17,076,000) $ (253,000) NM Other income (expense): Interest expense, net... $ (15,015,000) $ (14,137,000) 6 % Loss on derivatives not designated as hedges and hedge ineffectiveness, net... $ (8,374,000) $ (1,243,000) NM Other... $ (175,000) $ (132,000) 33 % Income tax expense... $ 116,723,000 $ 16,226,000 NM Average interest rate % 6.1% 5 % Average long-term debt outstanding... $ 686,656,000 $ 495,830, % (1) NM A percentage calculation is not meaningful due to a zero-value denominator or a percentage change greater than
78 Oil and Natural Gas Oil and natural gas revenues increased $81.8 million or 14% in 2013 as compared to 2012 primarily due to an 18% increase in equivalent production volumes. This production increase was the result of 2012 acquisitions and new wells completed in oil and NGLs rich prospects that were brought online. Oil production increased 2%, NGLs production increased 40%, and natural gas production increased 16%. Average oil prices between the comparative years increased 3% to $95.06 per barrel and NGLs prices increased 1% to $31.79 per barrel while prices for natural gas decreased 1% to $3.32 per Mcf. Oil and natural gas operating costs increased $33.8 million or 22% between the comparative years of 2013 and 2012 due to increased well servicing costs, higher saltwater disposal expenses, and increased general and administrative expense. Depreciation, depletion, and amortization ( DD&A ) increased $15.2 million or 7% primarily due to an 18% increase in equivalent production offset by a 9% decrease in our DD&A rate. The decrease in our DD&A rate resulted primarily from a reduction to the full cost pool from proceeds associated with the divestitures completed during 2013 and the non-cash ceiling test write-down of $167.7 million pre-tax ($104.4 million, net of tax) that occurred during the fourth quarter of Our DD&A expense on our oil and natural gas properties is calculated each quarter using period end reserve quantities adjusted for current period production. We did not have any ceiling test write-downs during During the second quarter of 2012, we recorded a non-cash ceiling test write-down of $115.9 million pre-tax ($72.1 million, net of tax). During the fourth quarter of 2012, we recorded a non-cash ceiling test write down of $167.7 million pre-tax ($104.4 million, net of tax). If there are declines in the 12-month average prices, we may be required to record a write-down in future periods. Contract Drilling Drilling revenues decreased $114.9 million or 22% in 2013 as compared to The decrease was due primarily to a 12% decrease in the average number of drilling rigs in use and a 2% decrease in the average dayrate. Average drilling rig utilization decreased from 73.9 drilling rigs in 2012 to 65.0 drilling rigs in During 2012, we had eight drilling contracts that were terminated early by the operator. The early termination fees associated with these contracts included in revenues was approximately $22.6 million compared to $1.9 million for the termination of one long-term drilling contract in Drilling operating costs decreased $42.2 million or 15% in 2013 compared to The decrease was due primarily to operating fewer rigs as per day direct cost increased $79 and indirect cost increased $0.6 million due to increased ad valoreum tax. Contract drilling depreciation decreased $9.8 million or 12% also due primarily to the decrease in utilization. Mid-Stream Our mid-stream revenues increased $69.9 million or 32% in 2013 as compared to The average price for natural gas sold increased 37%. Gas processing volumes per day increased 5% between the comparative years and NGLs sold per day were essentially unchanged between the comparative periods. The increase in volumes processed per day is primarily attributable to the volumes added from new wells connected to existing systems and increased capacity of processing facilities. NGLs sold volumes per day remained constant as an increase in volumes processed and upgrades to several of our processing facilities was offset from decreases due to one of our customers completing construction of their own processing plant and moving their volumes off our system during the second half of Gas gathering volumes per day increased 24% primarily from new well connections. Operating costs increased $56.1 million or 30% in 2013 compared to 2012 primarily due to a 25% increase in prices paid for natural gas purchased. Depreciation, amortization, and impairment increased $8.8 million or 36% primarily due to additional assets placed into service throughout
79 General and Administrative General and administrative expenses increased $5.2 million or 16% in 2013 compared to The increase was primarily due to increases in employee costs. Gain on Disposition of Assets rigs. Gain on disposition of assets increased $16.8 million in 2013 compared to 2012 primarily due to the sale of five drilling Other Income (Expense) Interest expense, net of capitalized interest, increased $0.9 million between the comparative years of 2013 and We capitalized interest based on the net book value associated with unproved properties not being amortized, the construction of additional drilling rigs, and the construction of gas gathering systems. Capitalized interest for 2013 was $33.7 million compared to $18.9 million in 2012, and was netted against our gross interest of $48.7 million and $33.0 million for 2013 and 2012, respectively. Our average interest rate increased from 6.1% to 6.4% and our average debt outstanding was $190.8 million higher in 2013 as compared to 2012 due to the issuance of $400.0 million of senior subordinated notes during the third quarter of 2012 to partially fund the Noble acquisition in the oil and natural gas segment. Loss on derivatives not designated as hedges and hedge ineffectiveness, net increased from $1.2 million in 2012 to $8.4 million in 2013 primarily due to fluctuations in forward prices used to estimate the fair value in mark-to-market accounting. Income Tax Expense Income tax expense increased $100.5 million in 2013 compared to 2012 primarily due to increased income. Our effective tax rate was 38.7% for 2013 and 41.2% for This decrease is primarily due to the effect of permanent differences as they relate to the rise in pre-tax income. Current income tax expense was $16.0 million in 2013 compared to a current tax expense of $0.7 million for This increase is also primarily due to increased income. We paid $9.1 million in income taxes during
80 2012 versus Percent Change (1) Total operating revenue... $ 1,315,123,000 $ 1,207,503,000 9 % Net income... $ 23,176,000 $ 195,867,000 (88)% Oil and Natural Gas: Revenue (2)... $ 567,944,000 $ 514,614, % Operating costs excluding depreciation, depletion, amortization, and impairment... $ 150,212,000 $ 131,271, % Average oil price received (Bbl)... $ $ % Average NGL price received (Bbl)... $ $ (28)% Average natural gas price received (Mcf)... $ 3.37 $ 4.26 (21)% Oil production (Bbl)... 3,279,000 2,511, % NGLs production (Bbl)... 2,796,000 2,239, % Natural gas production (Mcf)... 48,930,000 44,104, % Depreciation, depletion, and amortization rate (Boe)... $ $ (2)% Depreciation, depletion, and amortization... $ 211,347,000 $ 183,350, % Impairment of oil and natural gas properties... $ 283,606,000 $ NM Contract Drilling: Revenue... $ 529,719,000 $ 484,651,000 9 % Operating costs excluding depreciation... $ 289,524,000 $ 269,899,000 7 % Percentage of revenue from daywork contracts % 100% Average number of drilling rigs in use (3)% Average dayrate on daywork contracts... $ 19,949 $ 18,842 6 % Depreciation... $ 81,007,000 $ 79,667,000 2 % Mid-Stream: Revenue... $ 217,460,000 $ 208,238,000 4 % Operating costs excluding depreciation and amortization... $ 187,292,000 $ 174,859,000 7 % Depreciation, amortization, and impairment... $ 24,388,000 $ 16,101, % Gas gathered Mcf/day , , % Gas processed Mcf/day ,987 92, % Gas liquids sold gallons/day , , % General and administrative expense... $ 33,086,000 $ 30,055, % Gain (loss) on disposition of assets... $ (253,000) $ 595,000 (143)% Other income (expense): (2) Interest expense, net... $ (14,137,000) $ (4,167,000) NM Gain/(loss) on derivatives not designated as hedges and hedge ineffectiveness, net... $ (1,243,000) $ 1,702,000 (173)% Other... $ (132,000) $ (239,000) (45)% Income tax expense... $ 16,226,000 $ 123,135,000 (87)% Average interest rate % 5.6% 9 % Average long-term debt outstanding... $ 495,830,000 $ 249,681, % (1) NM A percentage calculation is not meaningful due to a zero-value denominator or a percentage change greater than 200. (2) During the third quarter of 2012, we made the decision to prospectively use mark-to-market accounting for our economic hedges. Previously, we reported all designated and non-designated hedging gains (losses) in oil and natural gas revenues. We now reflect gains (losses) on non-designated hedges and the ineffectiveness from cash flow hedges along with other revenue items in other income (expense) below income from operations. Prior year amounts have been reclassified to conform to current year presentation. 64
81 Oil and Natural Gas Oil and natural gas revenues increased $53.3 million or 10% in 2012 as compared to 2011 primarily due to an increase in equivalent production volumes of 18% and an increase in oil prices partially offset by decreases in prices for NGLs and natural gas. Average oil prices between the comparative years increased 6% to $92.60 per barrel while NGLs and natural gas prices decreased 28% to $31.58 per barrel and 21% to $3.37 per Mcf, respectively. In 2012, as compared to 2011, oil production increased 31%, NGLs production increased 25%, and natural gas production increased 11%. Production increased from our drilling program and primarily from wells acquired from Noble. Oil and natural gas operating costs increased $18.9 million or 14% between the comparative years of 2012 and 2011 due to increased well servicing costs, higher saltwater disposal fees, and higher gross production taxes due to higher revenue in Lease operating expenses per Boe decreased 2% to $6.66. DD&A increased $28.0 million or 15% primarily due to an 18% increase in equivalent production slightly offset by a 2% decrease in our DD&A rate. The decrease in our DD&A rate resulted primarily from a reduction to the full cost pool from proceeds associated with the divestitures completed during the third quarter of 2012 and the non-cash ceiling test write-down of $115.9 million pre-tax ($72.1 million, net of tax) that occurred during the second quarter of Our DD&A expense on our oil and natural gas properties is calculated each quarter utilizing period end reserve quantities adjusted for current period production. During the fourth quarter of 2012, we recorded a non-cash ceiling test write down of $167.7 million pre-tax ($104.4 million, net of tax). Contract Drilling Drilling revenues increased $45.1 million or 9% in 2012 as compared to 2011 primarily due to $22.6 million in termination fees during 2012 for eight drilling rigs that were under long-term contracts but were terminated early by the operator and a 6% increase in the average dayrate, somewhat offset by a 3% decrease in rigs utilized. Average drilling rig utilization decreased from 76.1 drilling rigs in 2011 to 73.9 drilling rigs in Drilling operating costs increased $19.6 million or 7% in 2012 compared to 2012 due largely to increased personnel costs and to a lesser extent for repair and maintenance costs. The increased personnel cost was due to an increase in compensation for Rocky Mountain personnel in the first quarter of 2012 to keep qualified labor. Contract drilling depreciation increased $1.3 million or 2% primarily due to increased capital expenditures associated with the construction of new drilling rigs and for upgrades to existing drilling rigs in our fleet. Mid-Stream Our mid-stream revenues increased $9.2 million or 4% in 2012 as compared to 2011 primarily due to higher NGLs volumes offset by a decrease in price. Gas processing volumes per day increased 44% between the comparative years and NGLs sold per day increased 32% between the comparative periods. The increase in volumes processed per day is primarily attributable to the volumes added from new wells connected to existing systems and increased capacity of processing facilities. NGLs sold volumes per day increased due to an increase in volumes processed and upgrades to several of our processing facilities. Gas gathering volumes per day increased 33% primarily from new well connections. The average price for NGLs sold decreased 27%. Operating costs increased $12.4 million or 7% in 2012 compared to 2011 primarily due to a 42% increase in per day gas volumes purchased offset by a 30% decrease in prices paid for natural gas purchased. Depreciation, amortization, and impairment increased $8.3 million or 51% primarily due to the $1.2 million write-down of the carrying value of our Erick system and increased assets placed into service throughout General and Administrative General and administrative expenses increased $3.0 million or 10% in 2012 compared to 2011 primarily due to increases in employee costs. 65
82 Other Income (Expense) Interest expense, net of capitalized interest, increased $10.0 million between the comparative years of 2012 and We capitalized interest based on the net book value associated with unproved properties not being amortized, the construction of additional drilling rigs, and the construction of gas gathering systems. Capitalized interest for 2012 was $18.9 million compared to $11.5 million in 2011, and was netted against our gross interest of $33.0 million and $15.6 million for 2012 and 2011, respectively. Our average interest rate increased from 5.6% to 6.1% and our average debt outstanding was $246.1 million higher in 2012 as compared to 2011 due to the issuance of $400.0 million of senior subordinated notes during the third quarter of 2012 to partially fund the Noble acquisition in the oil and natural gas segment. Gain (loss) on derivatives not designated as hedges and hedge ineffectiveness, net fluctuates due to changes in forward prices used to estimate the fair value in mark-to-market accounting. Income Tax Expense Income tax expense decreased $106.9 million or 87% in 2012 compared to 2011 primarily due to decreased income. Our effective tax rate was 41.2% for 2012 and 38.6% for Current income tax expense was $0.7 million in 2012 compared to a current tax benefit of $2.4 million for We paid $5.1 million in income taxes during Item 7A. Quantitative and Qualitative Disclosures about Market Risk Our operations are exposed to market risks primarily as a result of changes in the prices for natural gas and oil and interest rates. Commodity Price Risk. Our major market risk exposure is in the prices we receive for our oil, NGLs, and natural gas production. Those prices are primarily driven by the prevailing worldwide price for crude oil and market prices applicable to our natural gas production. Historically, these prices have fluctuated and we expect they will continue to do so. The price of oil, NGLs, and natural gas also affects both the demand for our drilling rigs and the amount we can charge for the use of our drilling rigs. Based on our 2013 production, a $0.10 per Mcf change in what we are paid for our natural gas production would result in a corresponding $448,000 per month ($5.4 million annualized) change in our pre-tax cash flow. A $1.00 per barrel change in our oil price would have a $268,000 per month ($3.2 million annualized) change in our pre-tax operating cash flow and a $1.00 per barrel change in our NGLs prices would have a $310,000 per month ($3.7 million annualized) change in our pre-tax cash flow. We use hedging transactions to manage the risk associated with price volatility. Our decisions regarding the amount and prices at which we choose to hedge certain of our products is based, in part, on our view of current and future market conditions. The transactions we use include financial price swaps under which we will receive a fixed price for our production and pay a variable market price to the contract counterparty. We do not hold or issue derivative instruments for speculative trading purposes. At December 31, 2013, the following non-designated hedges were outstanding: Term Commodity Hedged Volume Weighted Average Fixed Price for Swaps Hedged Market Jan 14 Dec 14 Natural gas swap 80,000 MMBtu/day $4.24 IF NYMEX (HH) Jan 14 Dec 14 Natural gas collar 10,000 MMBtu/day $ IF NYMEX (HH) Jan 14 Jun 14 Crude oil swap 500 Bbl/day $ WTI NYMEX Jan 14 Dec 14 Crude oil swap 3,000 Bbl/day $91.77 WTI NYMEX Jan 14 Dec 14 Crude oil collar 4,000 Bbl/day $ WTI NYMEX 66
83 Subsequent to December 31, 2013, the following non-designated hedges were entered into: Term Commodity Hedged Volume Weighted Average Fixed Price for Swaps Hedged Market Mar'14 Natural gas basis swap 30,000 MMBtu/day $(0.095) NGPL-TXOK Mar'14 Natural gas basis swap 60,000 MMBtu/day $(0.027) NGPL-Midcon Interest Rate Risk. Our interest rate exposure relates to our long-term debt under our credit agreement and the Notes. The credit agreement, at our election bears interest at variable rates based on the Prime Rate or the LIBOR Rate. At our election, borrowings under our credit agreement may be fixed at the LIBOR Rate for periods of up to 180 days. Based on our average outstanding long-term debt subject to a variable rate in 2013, a 1% increase in the floating rate would reduce our annual pre-tax cash flow by approximately $0.4 million. Under our Notes, we pay a fixed rate of interest of 6.625% per year (payable semiannually in arrears on May 15 and November 15 of each year). 67
84 Item 8. Financial Statements and Supplementary Data Index to Financial Statements Unit Corporation and Subsidiaries Management s Report on Internal Control over Financial Reporting Consolidated Financial Statements: Report of Independent Registered Public Accounting Firm Consolidated Balance Sheets at December 31, 2013 and Consolidated Statements of Income for the Years Ended December 31, 2013, 2012, and Consolidated Statements of Comprehensive Income for the Years Ended December 31, 2013, 2012, and Consolidated Statements of Changes in Shareholders Equity for the Years Ended December 31, 2011, 2012, and Consolidated Statements of Cash Flows for the Years Ended December 31, 2013, 2012, and Notes to Consolidated Financial Statements Page 68
85 Management s Report on Internal Control over Financial Reporting Management of the company is responsible for establishing and maintaining adequate internal control over financial reporting. Internal control over financial reporting is defined in Rules 13a-15(f) or 15d-15(f) promulgated under the Securities Exchange Act of 1934 as a process designed by, or under the supervision of, the company s principal executive and principal financial officers and effected by the company s board of directors, management and other personnel, to provide reasonable assurance regarding the reliability of financial reporting and the preparation of financial statements for external purposes in accordance with generally accepted accounting principles and includes those policies and procedures that: Pertain to the maintenance of records that in reasonable detail accurately and fairly reflect the transactions and dispositions of the assets of the company; Provide reasonable assurance that transactions are recorded as necessary to permit preparation of financial statements in accordance with generally accepted accounting principles, and that receipts and expenditures of the company are being made only in accordance with authorizations of management and directors of the company; and Provide reasonable assurance regarding prevention or timely detection of unauthorized acquisition, use or disposition of the company s assets that could have a material effect on the financial statements. Because of its inherent limitations, internal control over financial reporting may not prevent or detect misstatements. Also, projections of any evaluation of effectiveness to future periods are subject to the risk that controls may become inadequate because of changes in conditions, or that the degree of compliance with the policies or procedures may deteriorate. Internal control over financial reporting cannot provide absolute assurance of achieving financial reporting objectives because of its inherent limitations. Internal control over financial reporting is a process that involves human diligence and compliance and is subject to lapses in judgment and breakdowns resulting from human failures. Internal control over financial reporting also can be circumvented by collusion or improper management override. Because of such limitations, there is a risk that material misstatements may not be prevented or detected on a timely basis by internal control over financial reporting. However, these inherent limitations are known features of the financial reporting process. Therefore, it is possible to design into the process safeguards to reduce, though not eliminate, this risk. The company s management assessed the effectiveness of the company s internal control over financial reporting as of December 31, In making this assessment, the company s management used the criteria set forth in Internal Control Integrated Framework (1992) issued by the Committee of Sponsoring Organizations of the Treadway Commission (COSO). Based on their assessment, the company s management concluded that, as of December 31, 2013, the company s internal control over financial reporting was effective based on those criteria. The effectiveness of the company s internal control over financial reporting as of December 31, 2013, has been audited by PricewaterhouseCoopers LLP, an independent registered public accounting firm, as stated in their report which appears herein. 69
86 To Board of Directors and Shareholders of Unit Corporation: Report of Independent Registered Public Accounting Firm In our opinion, the accompanying consolidated balance sheets and the related consolidated statements of income, comprehensive income, changes in shareholders equity, and cash flows present fairly, in all material respects, the financial position of Unit Corporation and its subsidiaries at December 31, 2013 and 2012, and the results of their operations and their cash flows for each of the three years in the period ended December 31, 2013, in conformity with accounting principles generally accepted in the United States of America. In addition, in our opinion, the financial statement schedule listed in the index appearing under item 15(a)(2), presents fairly, in all material respects, the information set forth therein when read in conjunction with the related consolidated financial statements. Also in our opinion, the Company maintained, in all material respects, effective internal control over financial reporting as of December 31, 2013, based on criteria established in Internal Control Integrated Framework (1992) issued by the Committee of Sponsoring Organizations of the Treadway Commission (COSO). The Company s management is responsible for these financial statements and financial statement schedule, for maintaining effective internal control over financial reporting and for its assessment of the effectiveness of internal control over financial reporting, included in the accompanying Management s Report on Internal Control Over Financial Reporting. Our responsibility is to express opinions on these financial statements, on the financial statement schedule, and on the Company s internal control over financial reporting based on our integrated audits. We conducted our audits in accordance with the standards of the Public Company Accounting Oversight Board (United States). Those standards require that we plan and perform the audits to obtain reasonable assurance about whether the financial statements are free of material misstatement and whether effective internal control over financial reporting was maintained in all material respects. Our audits of the financial statements included examining, on a test basis, evidence supporting the amounts and disclosures in the financial statements, assessing the accounting principles used and significant estimates made by management, and evaluating the overall financial statement presentation. Our audit of internal control over financial reporting included obtaining an understanding of internal control over financial reporting, assessing the risk that a material weakness exists, and testing and evaluating the design and operating effectiveness of internal control based on the assessed risk. Our audits also included performing such other procedures as we considered necessary in the circumstances. We believe that our audits provide a reasonable basis for our opinions. A company s internal control over financial reporting is a process designed to provide reasonable assurance regarding the reliability of financial reporting and the preparation of financial statements for external purposes in accordance with generally accepted accounting principles. A company s internal control over financial reporting includes those policies and procedures that (i) pertain to the maintenance of records that, in reasonable detail, accurately and fairly reflect the transactions and dispositions of the assets of the company; (ii) provide reasonable assurance that transactions are recorded as necessary to permit preparation of financial statements in accordance with generally accepted accounting principles, and that receipts and expenditures of the company are being made only in accordance with authorizations of management and directors of the company; and (iii) provide reasonable assurance regarding prevention or timely detection of unauthorized acquisition, use, or disposition of the company s assets that could have a material effect on the financial statements. Because of its inherent limitations, internal control over financial reporting may not prevent or detect misstatements. Also, projections of any evaluation of effectiveness to future periods are subject to the risk that controls may become inadequate because of changes in conditions, or that the degree of compliance with the policies or procedures may deteriorate. /s/ PricewaterhouseCoopers LLP Tulsa, Oklahoma February 25,
87 UNIT CORPORATION AND SUBSIDIARIES CONSOLIDATED BALANCE SHEETS As of December 31, (In thousands except share and par value amounts) ASSETS Current assets: Cash and cash equivalents... $ 18,593 $ 974 Accounts receivable (less allowance for doubtful accounts of $5,342 and $5,343 at December 31, 2013 and 2012, respectively) , ,046 Materials and supplies... 10,998 8,563 Current derivative asset (Note 13) ,552 Current income tax receivable Current deferred tax asset (Note 8)... 13,585 8,765 Assets held for sale (Note 3)... 15,621 Prepaid expenses and other... 12,931 13,843 Total current assets , ,644 Property and equipment: Oil and natural gas properties, on the full cost method: Proved properties... 4,235,712 3,822,381 Unproved properties not being amortized , ,659 Drilling equipment... 1,477,093 1,478,645 Gas gathering and processing equipment , ,629 Transportation equipment... 39,666 37,728 Other... 87,435 62,840 6,934,916 6,384,882 Less accumulated depreciation, depletion, amortization, and impairment... 3,212,225 2,907,660 Net property and equipment... 3,722,691 3,477,222 Debt issuance cost... 11,844 13,432 Goodwill (Note 2)... 62,808 62,808 Other intangible assets, net Other assets... 13,016 11,334 Total assets... $ 4,022,390 $ 3,761,120 71
88 UNIT CORPORATION AND SUBSIDIARIES CONSOLIDATED BALANCE SHEETS - (Continued) LIABILITIES AND SHAREHOLDERS EQUITY As of December 31, (In thousands except share and par value amounts) Current liabilities: Accounts payable... $ 154,062 $ 138,811 Accrued liabilities (Note 5)... 64,363 54,098 Income taxes payable... 7,474 Current derivative liabilities (Note 13)... 5,561 1,948 Current portion of other long-term liabilities (Note 6)... 12,113 12,282 Total current liabilities , ,139 Long-term debt (Note 6) , ,359 Non-current derivative liabilities (Note 13) Other long-term liabilities (Note 6) , ,983 Deferred income taxes (Note 8) , ,776 Commitments and contingencies (Note 16)... Shareholders equity: Preferred stock, $1.00 par value, 5,000,000 shares authorized, none issued... Common stock, $0.20 par value, 175,000,000 shares authorized, 49,107,004 and 48,581,948 shares issued as of December 31, 2013 and 2012, respectively... 9,659 9,594 Capital in excess of par value , ,603 Accumulated other comprehensive income (net of tax of $0 and $4,892, respectively) (Note 15)... 7,587 Retained earnings... 1,718,263 1,533,517 Total shareholders equity... 2,173,392 1,974,301 Total liabilities and shareholders equity... $ 4,022,390 $ 3,761,120 The accompanying notes are an integral part of the consolidated financial statements. 72
89 UNIT CORPORATION AND SUBSIDIARIES CONSOLIDATED STATEMENTS OF INCOME Year Ended December 31, (In thousands except per share amounts) Revenues: Oil and natural gas... $ 649,718 $ 567,944 $ 514,614 Contract drilling , , ,651 Gas gathering and processing , , ,238 Total revenues... 1,351,850 1,315,123 1,207,503 Expenses: Oil and natural gas: Operating costs , , ,271 Depreciation, depletion, and amortization , , ,350 Impairment of oil and natural gas properties (Note 2) ,606 Contract drilling: Operating costs , , ,899 Depreciation... 71,194 81,007 79,667 Gas gathering and processing: Operating costs , , ,859 Depreciation, amortization, and impairment... 33,191 24,388 16,101 General and administrative... 38,323 33,086 30,055 (Gain) loss on disposition of assets... (17,076) (253) 595 Total expenses... 1,026,817 1,260, ,797 Income from operations ,033 54, ,706 Other income (expense): Interest, net... (15,015) (14,137) (4,167) Gain (loss) on derivatives not designated as hedges and hedge ineffectiveness, net... (8,374) (1,243) 1,702 Other... (175) (132) (239) Total other expense... (23,564) (15,512) (2,704) Income before income taxes ,469 39, ,002 Income tax expense (benefit): Current... 15, (2,416) Deferred ,732 15, ,551 Total income taxes ,723 16, ,135 Net income... $ 184,746 $ 23,176 $ 195,867 Net income per common share: Basic... $ 3.83 $ 0.48 $ 4.11 Diluted... $ 3.80 $ 0.48 $ 4.08 The accompanying notes are an integral part of the consolidated financial statements. 73
90 UNIT CORPORATION AND SUBSIDIARIES CONSOLIDATED STATEMENTS OF COMPREHENSIVE INCOME For Years ended December 31, (In thousands) Net income... $ 184,746 $ 23,176 $ 195,867 Other comprehensive income (loss), net of taxes: Change in value of derivative instruments used as cash flow hedges, net of tax of ($4,717), $12,094, and $18, (7,349) 18,635 29,384 Reclassification - derivative settlements, net of tax of ($249), ($20,171), and ($1,146)... (354) (31,682) (1,819) Ineffective portion of derivatives, net of tax of $74, $1,008, and ($1,061) 116 1,608 (1,688) Comprehensive income... $ 177,159 $ 11,737 $ 221,744 The accompanying notes are an integral part of the consolidated financial statements. 74
91 UNIT CORPORATION AND SUBSIDIARIES CONSOLIDATED STATEMENTS OF CHANGES IN SHAREHOLDERS EQUITY Year Ended December 31, 2011, 2012, and 2013 Common Stock Capital In Excess of Par Value Accumulated Other Comprehensive Income Retained Earnings (In thousands except share amounts) Balances, January 1, $ 9,493 $ 393,501 $ (6,851) $ 1,314,474 $ 1,710,617 Comprehensive income: Net income , ,867 Other comprehensive income (net of tax of $16,205)... 25,877 25,877 Total comprehensive income ,744 Activity in employee compensation plans (241,011 shares) ,608 14,656 Balances, December 31, , ,109 19,026 1,510,341 1,947,017 Comprehensive income (loss): Net income... 23,176 23,176 Other comprehensive loss (net of tax ($7,069))... (11,439) (11,439) Total comprehensive income... 11,737 Activity in employee compensation plans (430,506 shares) ,494 15,547 Balances, December 31, , ,603 7,587 1,533,517 1,974,301 Comprehensive income (loss): Net income , ,746 Other comprehensive loss (net of tax ($4,892))... (7,587) (7,587) Total comprehensive income ,159 Activity in employee compensation plans (525,056 shares) ,867 21,932 Balances, December 31, $ 9,659 $ 445,470 $ $ 1,718,263 $ 2,173,392 Total The accompanying notes are an integral part of the consolidated financial statements. 75
92 OPERATING ACTIVITIES: UNIT CORPORATION AND SUBSIDIARIES CONSOLIDATED STATEMENTS OF CASH FLOWS Year Ended December 31, (In thousands) Net income... $ 184,746 $ 23,176 $ 195,867 Adjustments to reconcile net income (loss) to net cash provided (used) by operating activities: Depreciation, depletion, amortization, and impairment , , ,451 Impairment of oil and natural gas properties (Note 2) ,606 (Gain) loss on derivatives... 5,449 53,096 (159) Derivatives settled... 1,161 (51,853) (2,254) (Gain) loss on disposition of assets... (17,076) (253) 595 Deferred tax expense ,732 15, ,551 Employee stock compensation plans... 21,317 16,956 14,303 Bad debt expense ARO liability accretion... 5,450 4,615 3,838 Other, net... 2, Changes in operating assets and liabilities increasing (decreasing) cash: Accounts receivable... 2,967 13,994 (38,731) Materials and supplies... (2,435) (361) (1,886) Prepaid expenses and other... 1,813 (3,466) 22,672 Accounts payable... 15,715 10,187 (1,064) Accrued liabilities... 17,198 6,911 9,245 Contract advances... 1,137 (1,119) (527) INVESTING ACTIVITIES: Net cash provided by operating activities , , ,455 Capital expenditures... (703,984) (762,381) (728,551) Producing property and other acquisitions... (598,485) (50,013) Proceeds from disposition of property and equipment , ,824 10,328 Other... 3,894 FINANCING ACTIVITIES: Net cash used in investing activities... (579,180) (1,079,042) (768,236) Borrowings under line of credit , , ,500 Payments under line of credit... (293,600) (714,200) (554,500) Proceeds from issuance of senior subordinated notes, net of debt issuance costs and discount , ,950 Proceeds from exercise of stock options Tax benefit from stock options ,174 Increase (decrease) in book overdrafts (Note 2)... (7,014) (19,440) 26,454 Net cash provided by (used in) financing activities... (77,532) 388, ,257 Net increase (decrease) in cash and cash equivalents... 17, (524) Cash and cash equivalents, beginning of year ,359 Cash and cash equivalents, end of year... $ 18,593 $ 974 $ 835 Supplemental disclosure of cash flow information: Cash paid during the year for: Interest paid (net of capitalized)... $ 12,485 $ 14,880 $ 3,470 Income taxes... $ 9,100 $ 5,116 $ 655 Changes in accounts payable and accrued liabilities related to purchases of property, plant, and equipment... $ (6,550) $ (4,753) $ (28,036) Non-cash additions (reductions) to oil and natural gas properties related to asset retirement obligations... $ (17,952) $ 45,097 $ 23,345 The accompanying notes are an integral part of the consolidated financial statements. 76
93 UNIT CORPORATION AND SUBSIDIARIES NOTES TO CONSOLIDATED FINANCIAL STATEMENTS NOTE 1 ORGANIZATION Unless the context clearly indicates otherwise, references in this report to Unit, Company, we, our, us, or like terms refer to Unit Corporation and its subsidiaries. We are primarily engaged in the land contract drilling of natural gas and oil wells, the exploration, development, acquisition, and production of oil and natural gas properties, and the buying, selling, gathering, processing, and treating of natural gas. Our operations are located principally in the United States and are organized in the following three reporting segments: (1) Oil and Natural Gas, (2) Contract Drilling, and (3) Mid-Stream. Oil and Natural Gas. Carried out by our subsidiary, Unit Petroleum Company, we explore, develop, acquire, and produce oil and natural gas properties for our own account. Our producing oil and natural gas properties, unproved properties, and related assets are located mainly in Oklahoma and Texas, and to a lesser extent, in Arkansas, Colorado, Kansas, Louisiana, Mississippi, Montana, New Mexico, North Dakota, Pennsylvania, and Wyoming. Historically, our contract drilling segment experienced more demand for natural gas drilling as opposed to drilling for oil and NGLs. With the current natural gas market, operators have been focusing on drilling for oil and NGLs. Contract Drilling. Carried out by our subsidiary, Unit Drilling Company and its subsidiary Unit Texas Drilling, L.L.C., we drill onshore oil and natural gas wells for our own account as well as for a wide range of other oil and natural gas companies. Our drilling operations are mainly located in Oklahoma, Texas, Louisiana, Kansas, Wyoming, Colorado, Utah, Montana, and North Dakota. Mid-Stream. Carried out by our subsidiary, Superior Pipeline Company, L.L.C. and its subsidiaries, we buy, sell, gather, transport, process, and treat natural gas for our own account and for third parties. Mid-stream operations are performed in Oklahoma, Texas, Kansas, Pennsylvania, and West Virginia. NOTE 2 SUMMARY OF SIGNIFICANT ACCOUNTING POLICIES Principles of Consolidation. The consolidated financial statements include the accounts of Unit Corporation and its subsidiaries. Our investment in limited partnerships is accounted for on the proportionate consolidation method, whereby our share of the partnerships assets, liabilities, revenues, and expenses are included in the appropriate classification in the accompanying consolidated financial statements. Certain amounts in the accompanying consolidated financial statements for prior periods have been reclassified to conform to current year presentation. Certain financial statement captions were expanded or combined with no impact to consolidated net income or shareholders' equity. Accounting Estimates. The preparation of financial statements in conformity with generally accepted accounting principles (GAAP) requires management to make estimates and assumptions that affect the reported amounts of assets and liabilities and disclosure of contingent assets and liabilities at the date of the financial statements and the reported amounts of revenues and expenses during the reporting period. Actual results could differ from those estimates. Drilling Contracts. We recognize revenues and expenses generated from daywork drilling contracts as the services are performed, since we do not bear the risk of completion of the well. Under footage and turnkey contracts, we bear the risk of completion of the well; therefore, revenues and expenses are recognized when the well is substantially completed. Under this method, substantial completion is determined when the well bore reaches the negotiated depth as stated in the contract. The entire amount of a loss, if any, is recorded when the loss is determinable. The costs of uncompleted drilling contracts include expenses incurred to date on footage or turnkey contracts, which are still in process at the end of the period, and are included in other current assets. Typically, any one of these three types of contracts can be used for the drilling of one well which can take from 20 to 90 days. At December 31, 2013, all of our contracts were daywork contracts of which 23 were multiwell and had durations which ranged from six months to three years, 22 of which expire in 2014 and one expiring in
94 UNIT CORPORATION AND SUBSIDIARIES NOTES TO CONSOLIDATED FINANCIAL STATEMENTS (Continued) These longer term contracts may contain a fixed rate for the duration of the contract or provide for the periodic renegotiation of the rate within a specific range from the existing rate. Cash Equivalents and Book Overdrafts. We include as cash equivalents all investments with maturities at date of purchase of three months or less which are readily convertible into known amounts of cash. Book overdrafts are checks that have been issued before the end of the period, but not presented to our bank for payment before the end of the period. There were no book overdrafts at December 31, At December 31, 2012, book overdrafts were $7.0 million and included in accounts payable. Accounts Receivable. Accounts receivable are carried on a gross basis, with no discounting, less an allowance for doubtful accounts. We estimate the allowance for doubtful accounts based on existing economic conditions, the financial condition of our customers, and the amount and age of past due accounts. Receivables are considered past due if full payment is not received by the contractual due date. Past due accounts are generally written off against the allowance for doubtful accounts only after all collection attempts have been unsuccessful. Financial Instruments and Concentrations of Credit Risk and Non-performance Risk. Financial instruments, which potentially subject us to concentrations of credit risk, consist primarily of trade receivables with a variety of oil and natural gas companies. We do not generally require collateral related to receivables. Our credit risk is considered to be limited due to the large number of customers comprising our customer base. Below are the third-party customers that accounted for more than 10% of our segment s revenues: Oil and Natural Gas: Drilling: Valero Energy Corporation... 25% 26% 18% Sunoco Partners Marketing... 8% 8% 10% QEP Resources, Inc... 18% 15% 22% Kodiak Oil and Gas Corp... 10% 10% 6% Mid-Stream: ONEOK, Inc % 54% 54% Tenaska Resources, LLC... 16% 7% 1% Gavilon, LLC... % 10% 19% We had a concentration of cash of $52.1 million and $40.4 million at December 31, 2013 and 2012, respectively with one bank. The use of derivative transactions also involves the risk that the counterparties will be unable to meet the financial terms of the transactions. We considered this non-performance risk with regard to our counterparties and our own non-performance risk in our derivative valuation at December 31, 2013 and determined there was no material risk at that time. At December 31, 2013, the fair values of the net assets (liabilities) we had with each of the counterparties with respect to all of our commodity derivative transactions are listed in the table below: December 31, 2013 (In millions) Canadian Imperial Bank of Commerce... $ 0.5 Scotiabank... (0.3) Bank of Montreal... (5.2) Total assets (liabilities)... $ (5.0) Property and Equipment. Drilling equipment, natural gas gathering and processing equipment, transportation equipment, and other property and equipment are carried at cost. Renewals and improvements are capitalized while repairs and maintenance are expensed. Depreciation of drilling equipment is recorded using the units-of-production method based on 78
95 UNIT CORPORATION AND SUBSIDIARIES NOTES TO CONSOLIDATED FINANCIAL STATEMENTS (Continued) estimated useful lives starting at 15 years, including a minimum provision of 20% of the active rate when the equipment is idle. We use the composite method of depreciation for drill pipe and collars and calculate the depreciation by footage actually drilled compared to total estimated remaining footage. Depreciation of other property and equipment is computed using the straightline method over the estimated useful lives of the assets ranging from 3 to 15 years. Realization of the carrying value of property and equipment is reviewed for possible impairment whenever events or changes in circumstances indicate that the carrying amount may not be recoverable. Assets are determined to be impaired if a forecast of undiscounted estimated future net operating cash flows directly related to the asset including disposal value if any, is less than the carrying amount of the asset. If any asset is determined to be impaired, the loss is measured as the amount by which the carrying amount of the asset exceeds its fair value. An estimate of fair value is based on the best information available, including prices for similar assets. Changes in such estimates could cause us to reduce the carrying value of property and equipment. In December 2012, our mid-stream segment had a $1.2 million write down of its Erick system. There was no volume from the wells connected to this system, the compressor and related surface equipment have been removed from this location and there is no future activity anticipated from this gathering system. No significant impairments were recorded in 2013 or When property and equipment components are disposed of, the cost and the related accumulated depreciation are removed from the accounts and any resulting gain or loss is generally reflected in operations. For dispositions of drill pipe and drill collars, an average cost for the appropriate feet of drill pipe and drill collars is removed from the asset account and charged to accumulated depreciation and proceeds, if any, are credited to accumulated depreciation. We record an asset and a liability equal to the present value of the expected future asset retirement obligation (ARO) associated with our oil and gas properties. The ARO asset is depreciated in a manner consistent with the depreciation of the underlying physical asset. We measure changes in the liability due to passage of time by accreting an interest charge. This amount is recognized as an increase in the carrying amount of the liability and as a corresponding accretion expense. Capitalized Interest. During 2013, 2012, and 2011, interest of approximately $33.7 million, $18.9 million, and $11.5 million, respectively, was capitalized based on the net book value associated with unproved properties not being amortized, the construction of additional drilling rigs, and the construction of gas gathering systems. Interest is being capitalized using a weighted average interest rate based on our outstanding borrowings. Goodwill. Goodwill represents the excess of the cost of acquisitions over the fair value of the net assets acquired. Goodwill is not amortized, but an impairment test is performed at least annually to determine whether the fair value has decreased and is performed additionally when events indicate an impairment may have occurred. Goodwill is all related to our contract drilling segment, and accordingly, the impairment test is generally based on the estimated discounted future net cash flows of our drilling segment, utilizing discount rates and other factors in determining the fair value of our drilling segment. Inputs in our estimated discounted future net cash flows include rig utilization, day rates, gross margin percentages, and terminal value (these are all considered level 3 inputs). No goodwill impairment was recorded for the years ended December 31, 2013, 2012, or There were no additions to goodwill in 2013, 2012, or Goodwill of $3.9 million is deductible for tax purposes. Intangible Assets. Intangible assets are capitalized and amortized over the estimated period benefited. Such amounts are reviewed for possible impairment whenever events or changes in circumstances indicate that the carrying amount may not be recoverable. No intangible asset impairment was recorded for the years ended December 31, 2013, 2012, or Amortization of $0.7 million, $1.2 million and $1.2 million was recorded in 2013, 2012, and 2011, respectively. Accumulated amortization for 2013 and 2012 was $18.0 million and $17.3 million, respectively. Our intangible assets became fully amortized in 2013, so no amortization is expected to be recorded in Oil and Natural Gas Operations. We account for our oil and natural gas exploration and development activities using the full cost method of accounting prescribed by the SEC. Accordingly, all productive and non-productive costs incurred in connection with the acquisition, exploration and development of our oil, NGLs, and natural gas reserves, including directly related overhead costs and related asset retirement costs, are capitalized and amortized on a units-of-production method based on proved oil and natural gas reserves. Directly related overhead costs of $21.5 million, $17.6 million, and $15.6 million were capitalized in 2013, 2012, and 2011, respectively. Independent petroleum engineers annually audit our internal evaluation of our reserves. The average rates used for depreciation, depletion, and amortization (DD&A) were $13.32, $14.70, and $15.06 per Boe in 2013, 2012, and 2011, respectively. The calculation of DD&A includes estimated future expenditures to be incurred in 79
96 UNIT CORPORATION AND SUBSIDIARIES NOTES TO CONSOLIDATED FINANCIAL STATEMENTS (Continued) developing proved reserves and estimated dismantlement and abandonment costs, net of estimated salvage values. Our unproved properties totaling $545.6 million are excluded from the DD&A calculation. No gains or losses are recognized on the sale, conveyance or other disposition of oil and natural gas properties unless a significant reserve amount to our total reserves is involved. Revenue from the sale of oil and natural gas is recognized when title passes, net of royalties. Under the full cost rules, at the end of each quarter, we review the carrying value of our oil and natural gas properties. The full cost ceiling is based principally on the estimated future discounted net cash flows from our oil and natural gas properties discounted at 10%. We use the unweighted arithmetic average of the commodity prices existing on the first day of each of the 12 months before the end of the reporting period to calculate discounted future revenues, unless prices were otherwise determined under contractual arrangements. In the event the unamortized cost of oil and natural gas properties being amortized exceeds the full cost ceiling, as defined by the SEC, the excess is charged to expense in the period during which such excess occurs. Once incurred, a write-down of oil and natural gas properties is not reversible. For the quarter ended June 30, 2012, the 12-month average commodity prices, including the discounted value of our cash flow hedges, decreased significantly, resulting in a non-cash ceiling test write down of $115.9 million pre-tax ($72.1 million, net of tax). Our qualifying cash flow hedges used in the ceiling test determination at June 30, 2012, consisted of swaps and collars, covering production of 2.9 MMBoe in 2012 and 4.5 MMBoe in The effect of those hedges on the June 30, 2012 ceiling test was a $32.5 million pre-tax increase in the discounted net cash flows of our oil and natural gas properties. For the quarter ended December 31, 2012, the 12-month average commodity prices, including the discounted value of our cash flow hedges, decreased further, resulting in an additional non-cash ceiling test write down of $167.7 million pre-tax ($104.4 million, net of tax). Our qualifying cash flow hedges used in the ceiling test determination at December 31, 2012, consisted of swaps and collars covering 6.9 MMBoe in The effect of those hedges on the December 31, 2012 ceiling test was a $29.8 million pre-tax increase in the discounted net cash flows of our oil and natural gas properties. Our oil and natural gas hedging is discussed in Note 13 of the Notes to our Consolidated Financial Statements. At December 31, 2013, using the existing 12-month average commodity prices, we were not required to record a ceiling test write-down. All cash flow hedges expired at December 31, 2013 and did not effect the ceiling test determination. If there are declines in the 12-month average prices, we may be required to record a write-down in future periods. Our contract drilling segment provides drilling services for our exploration and production segment. Depending on their timing some of the drilling services performed on our properties are also deemed to be associated with the acquisition of an ownership interest in the property. Revenues and expenses for such services are eliminated in our income statement, with any profit recognized as a reduction in our investment in our oil and natural gas properties. The contracts for these services are issued under the same conditions and rates as the contracts entered into with unrelated third parties. We eliminated revenue of $64.3 million, $49.6 million, and $52.2 million for 2013, 2012, and 2011, respectively from our contract drilling segment and eliminated the associated operating expense of $46.9 million, $34.1 million, and $32.6 million during 2013, 2012, and 2011, respectively, yielding $17.4 million, $15.5 million, and $19.6 million during 2013, 2012, and 2011, respectively, as a reduction to the carrying value of our oil and natural gas properties. Gas Gathering and Processing Revenue. Our gathering and processing segment recognizes revenue from the gathering and processing of natural gas and NGLs in the period the service is provided based on contractual terms. Insurance. We are self-insured for certain losses relating to workers compensation, control of well and employee medical benefits. Insured policies for other coverage contain deductibles or retentions per occurrence that range from $50,000 to $1.5 million. We have purchased stop-loss coverage in order to limit, to the extent feasible, per occurrence and aggregate exposure to certain types of claims. However, there is no assurance that the insurance coverage will adequately protect us against liability from all potential consequences. We have elected to use an ERISA governed occupational injury benefit plan to cover all Texas drilling operations in lieu of covering them under Texas Workers Compensation. If insurance coverage becomes more expensive, we may choose to self-insure, decrease our limits, raise our deductibles or any combination of these rather than pay higher premiums. 80
97 UNIT CORPORATION AND SUBSIDIARIES NOTES TO CONSOLIDATED FINANCIAL STATEMENTS (Continued) Hedging Activities. All derivatives are recognized on the balance sheet and measured at fair value. Derivatives that are designated as a cash flow hedge are measured by the effectiveness of the hedge, or the degree that the gain (loss) for the hedging instrument offsets the loss (gain) on the hedged item, at each reporting period. The effective portion of the gain (loss) on the derivative instrument is recognized in other comprehensive income as a component of equity and subsequently reclassified into earnings when the forecasted transaction affects earnings. The ineffective portion of a derivative s change in fair value is required to be recognized in earnings immediately. Derivatives that are not designated for hedge treatment are recorded at fair value with gains (losses) recognized in earnings in the period of change. In August 2012, we determined on a prospective basis, to enter into economic hedges without electing cash flow hedge accounting. Our cash flow hedges (that existed before August 2012) expired in December We do not engage in derivative transactions for speculative purposes. We document our risk management strategy, and for the cash flow hedges, we tested the hedge effectiveness at the inception of and during the term of each hedge. Limited Partnerships. Unit Petroleum Company is a general partner in 16 oil and natural gas limited partnerships sold privately and publicly. Some of our officers, directors, and employees own the interests in most of these partnerships. We share in each partnership s revenues and costs in accordance with formulas set out in each of the limited partnership agreement. The partnerships also reimburse us for certain administrative costs incurred on behalf of the partnerships. Income Taxes. Measurement of current and deferred income tax liabilities and assets is based on provisions of enacted tax law; the effects of future changes in tax laws or rates are not included in the measurement. Valuation allowances are established where necessary to reduce deferred tax assets to the amount expected to be realized. Income tax expense is the tax payable for the year and the change during that year in deferred tax assets and liabilities. The accounting for uncertainty in income taxes prescribes a recognition threshold and measurement attribute for the financial statement recognition and measurement of a tax position taken or expected to be taken in a return. Guidance is also provided on de-recognition, classification, interest and penalties, accounting in interim periods, disclosure, and transition. We have no unrecognized tax benefits and we do not expect any significant changes in unrecognized tax benefits in the next twelve months. Natural Gas Balancing. We use the sales method for recording natural gas sales. This method allows for recognition of revenue, which may be more or less than its share of pro-rata production from certain wells. We estimate our December 31, 2013 balancing position to be approximately 5.2 Bcf on under-produced properties and approximately 4.5 Bcf on overproduced properties. We have recorded a receivable of $2.0 million on certain wells where we estimate that insufficient reserves are available for us to recover the under-production from future production volumes. We have also recorded a liability of $3.8 million on certain properties where we believe there are insufficient reserves available to allow the under-produced owners to recover their under-production from future production volumes. Our policy is to expense the pro-rata share of lease operating costs from all wells as incurred. Such expenses relating to the balancing position on wells in which we have imbalances are not material. Employee and Director Stock Based Compensation. We recognize in our financial statements the cost of employee services received in exchange for awards of equity instruments based on the grant date fair value of those awards. The amount of our equity compensation cost relating to employees directly involved in exploration activities of our oil and natural gas segment is capitalized to our oil and natural gas properties. Amounts not capitalized to our oil and natural gas properties are recognized in general and administrative expense and operating costs of our business segments. We utilize the Black-Scholes option pricing model to measure the fair value of stock options and stock appreciation rights (SARs). The value of our restricted stock grants is based on the closing stock price on the date of the grants. Impact of Financial Accounting Pronouncements. Presentation of an Unrecognized Tax Benefit When a Net Operating Loss Carryforward, a Similar Tax Loss, or a Tax Credit Carryforward Exists. In July 2013, ASU was issued because GAAP does not include explicit guidance on the financial statement presentation of an unrecognized tax benefit when a net operating loss carryforward, a similar tax loss, or a tax credit carryforward exists. The amendment provides explicit guidance on the financial statement presentation of an unrecognized tax benefit when a net operating loss carryforward, a similar tax loss, or a tax credit carryforward exists. The amendments in this Update are effective for fiscal years, and interim periods within those years, beginning after December 15, Early adoption is permitted. The amendments should be applied prospectively to all unrecognized tax benefits that exist 81
98 UNIT CORPORATION AND SUBSIDIARIES NOTES TO CONSOLIDATED FINANCIAL STATEMENTS (Continued) at the effective date. Retrospective application is permitted. We anticipate there will be no effect on our financial position or results of operations when adopted. Inclusion of the Fed Funds Effective Swap Rate (or Overnight Index Swap Rate) as a Benchmark Interest Rate for Hedge Accounting Purposes. The FASB has issued ASU , the amendments in this update permit the Fed Funds Effective Swap Rate (OIS) to be used as a U.S. benchmark interest rate for hedge accounting purposes under Topic 815, in addition to U.S. Treasury and LIBOR. The amendments also remove the restriction on using different benchmark rates for similar hedges. The amendments are effective prospectively for qualifying new or redesignated hedging relationships entered into on or after July 17, We do not have any interest rate hedges at this time. Reporting of Amounts Reclassified Out of Accumulated Other Comprehensive Income. In February 2013, the FASB issued ASU to address the presentation of comprehensive income related to ASU The standard requires that companies present, either in a single note or parenthetically on the face of the financial statements, the effect of significant amounts reclassified from each component of accumulated other comprehensive income based on its source (e.g., the release due to cash flow hedges from interest rate contracts) and the income statement line items affected by the reclassification (e.g., interest income or interest expense). The amendments are effective for fiscal years, and interim periods within those years, beginning after December 15, We chose to present the information in a single note (Note 15 of the Notes to our Consolidated Financial Statements). Clarifying the Scope of Disclosures about Offsetting Assets and Liabilities. In January 2013, the FASB issued ASU to limit the scope of balance sheet offsetting disclosures contained in previously issued guidance in ASU Disclosures about Offsetting Assets and Liabilities. Specifically, ASU applies only to derivatives, repurchase agreements and reverse purchase agreements, and securities borrowing and securities lending transactions that are either offset in accordance with specific criteria contained in the FASB Accounting Standards or subject to a master netting arrangement or similar agreement. Unlike IFRS, GAAP allows companies the option to present net in their balance sheets derivatives that are subject to a legally enforceable netting arrangement with the same party where rights of set-off are only available in the event of default or bankruptcy. To address these differences between IFRS and GAAP, the FASB and the IASB (the Boards) issued an exposure draft that proposed new criteria for netting that were narrower than the current conditions currently in GAAP. Nevertheless, in response to feedback from their respective stakeholders, the Boards decided to retain their existing offsetting models. Instead, the Boards have issued common disclosure requirements related to offsetting arrangements to allow investors to better compare financial statements prepared in accordance with IFRS or GAAP. The amendments in this ASU require an entity to disclose information about offsetting and related arrangements to enable users of its financial statements to understand the effect of those arrangements on its financial position. An entity is required to apply the amendments for annual reporting periods beginning on or after January 1, 2013, and interim periods within those annual periods. An entity should provide the disclosures required by those amendments retrospectively for all comparative periods presented. Derivatives subject to a master netting agreement are the only transactions in this accounting standard that affect us. We provide the effect of netting on our financial position in Note 14 of the Notes to our Consolidated Financial Statements. NOTE 3 ACQUISITIONS AND DIVESTITURES On July 20, 2011, we acquired certain producing properties from an unaffiliated seller for approximately $12.3 million in cash, after post-closing adjustments, consisting of 30 operated wells and 59 non-operated well interests located in Beaver, Harper, and Ellis Counties,Oklahoma and Lipscomb County, Texas. The purchase price allocation was $8.4 million for proved properties and $3.9 million for acreage. The acquisition also included in excess of 12,000 net acres held by production available for future development. On August 31, 2011, we acquired certain producing oil and gas properties for $30.5 million in cash, from an unaffiliated seller. Included in the acquisition were more than 500 wells located principally in the Oklahoma Arkoma Woodford and Hartshorne Coal plays along with other properties located throughout Oklahoma and Texas. The acquisition also included approximately 55,000 net acres of which 96% was held by production. On September 17, 2012, we closed on the acquisition of certain oil and natural gas assets from Noble Energy, Inc. (Noble). After final closing adjustments, the acquisition included approximately 83,000 net acres primarily in the Granite Wash, Cleveland, and various other plays in western Oklahoma and the Texas Panhandle. The adjusted amount paid was $592.6 million. 82
99 UNIT CORPORATION AND SUBSIDIARIES NOTES TO CONSOLIDATED FINANCIAL STATEMENTS (Continued) As of the effective date of the Noble acquisition (April 1, 2012), the estimated proved reserves of the acquired properties were 44 million barrels of oil equivalent (MMBoe). The acquisition added approximately 24,000 net acres to our Granite Wash core area in the Texas Panhandle with significant resource potential including approximately 600 horizontal drilling locations. The total acreage acquired in other plays in western Oklahoma and the Texas Panhandle was approximately 59,000 net acres and is characterized by high working interest and operatorship, 95% of which was held by production. We also received four gathering systems as part of the transaction and other miscellaneous assets. The Noble acquisition was accounted for using the acquisition method under ASC 805, Business Combinations, which required that the acquired assets and liabilities be recorded at their fair values as of the acquisition date. The following table summarizes the adjusted purchase price and the estimated values of assets acquired and liabilities assumed. It was based on information available to us at the time these consolidated financial statements were prepared and we believe these estimates are reasonable(in thousands): Adjusted Purchase Price Total consideration given... $ 592,627 Adjusted Allocation of Purchase Price Oil and natural gas properties included in the full cost pool: Proved oil and natural gas properties... $ 260,799 Unproved oil and natural gas properties ,343 Total oil and natural gas properties included in the full cost pool (1) ,142 Gas gathering and processing equipment and other... 25,163 Asset retirement obligation... (46,678) Fair value of net assets acquired... $ 592,627 (1) We used a discounted cash flow model and made market assumptions as to future commodity prices, projections of estimated quantities of oil and natural gas reserves, expectations for timing and amount of future development and operating costs, projections of future rates of production, expected recovery rates and risk adjusted discount rates. Pro Forma Financial Information The following unaudited pro forma financial information is presented to reflect the operations of the acquired assets as if the acquisition had been completed on January 1, The unaudited pro forma financial information was derived from the historical accounting records of the seller adjusted for estimated transaction costs, depreciation, depletion and amortization, ceiling test impact, general and administrative expenses, capitalized interest, and interest on the $400.0 million of Notes issued along with additional borrowings under our credit agreement to finance the acquisition. The unaudited pro forma financial information does not purport to be indicative of results of operations that would have occurred had the transaction occurred on the basis assumed above, nor is such information indicative of our expected future results of operations. The pro forma results of operations do not include any cost savings or other synergies that resulted, or may result, from the acquisition or any estimated costs that will be incurred to integrate these assets. Future results may vary significantly from the results reflected in this pro forma financial information because of future events and transactions, as well as other factors. 83
100 UNIT CORPORATION AND SUBSIDIARIES NOTES TO CONSOLIDATED FINANCIAL STATEMENTS (Continued) Pro forma: Twelve months ended December 31, (In thousands, except per share amounts) Revenues... $ 1,376,393 $ 1,336,227 Net income... $ 83,940 $ 229,272 Net income per common share: Basic... $ 1.75 $ 4.81 Diluted... $ 1.74 $ 4.78 From September 17, 2012, the date of the acquisition, through December 31, 2012, the portion of our revenues that were attributable to Noble were $21.4 million with a net loss of $0.8 million Divestitures We completed the following divestitures in 2012, the proceeds all of which reduced the net book value of the full cost pool with no gain or loss recognized: In September 2012, we sold our interest in certain Bakken properties. The proceeds, net of related expenses were $226.6 million. In September 2012, we sold certain oil and natural gas assets located in Brazos and Madison Counties, Texas, for approximately $44.1 million Other In conjunction with the acquisition and divestitures completed in the third quarter 2012, we took the necessary steps to secure like-kind exchange tax treatment for the transactions under Section 1031 of the Internal Revenue Code Divestitures and Assets Held for Sale In August 2013, we sold additional Bakken property interests. The proceeds, net of related expenses, were $57.1 million. In addition, we had other non-core asset sales with proceeds, net of related expenses, of $21.7 million for Proceeds from these dispositions reduced the net book value of the full cost pool with no gain or loss recognized. During 2013, we sold five 2,000-3,000 horsepower drilling rigs to unaffiliated third-parties for a gain of $16.5 million. Four of our idle drilling rigs were classified as assets held for sale at December 31, 2013 and were sold to an unaffiliated thirdparty in the first quarter of The proceeds for the sale of these assets, less costs to sell, is expected to exceed the approximate $15.6 million net book value of the drilling rigs, both in the aggregate and for each drilling rig with an estimated gain of $10.4 million. 84
101 UNIT CORPORATION AND SUBSIDIARIES NOTES TO CONSOLIDATED FINANCIAL STATEMENTS (Continued) NOTE 4 EARNINGS PER SHARE The following data shows the amounts used in computing earnings per share: For the year ended December 31, 2013: Income (Numerator) Weighted Shares (Denominator) (In thousands except per share amounts) Per-Share Amount Basic earnings per common share... $ 184,746 48,218 $ 3.83 Effect of dilutive stock options, restricted stock, and SARs (0.03) Diluted earnings per common share... $ 184,746 48,572 $ 3.80 For the year ended December 31, 2012: Basic earnings per common share... $ 23,176 47,909 $ 0.48 Effect of dilutive stock options, restricted stock, and SARs Diluted earnings per common share... $ 23,176 48,154 $ 0.48 For the year ended December 31, 2011: Basic earnings per common share... $ 195,867 47,658 $ 4.11 Effect of dilutive stock options, restricted stock, and SARs (0.03) Diluted earnings per common share... $ 195,867 47,951 $ 4.08 The following options and their average exercise prices were not included in the computation of diluted earnings per share because the option exercise prices were greater than the average market price of our common stock for the years ended December 31: Options and SARs , , ,000 Average exercise price... $ $ $ NOTE 5 ACCRUED LIABILITIES Accrued liabilities consisted of the following as of December 31: (In thousands) Employee costs... $ 27,633 $ 24,632 Lease operating expenses... 16,073 10,903 Interest payable... 6,504 6,568 Deposits on assets held for sale... 3,750 Taxes... 2,313 7,308 Hedge settlements Other... 7,674 4,527 Total accrued liabilities... $ 64,363 $ 54,098 85
102 UNIT CORPORATION AND SUBSIDIARIES NOTES TO CONSOLIDATED FINANCIAL STATEMENTS (Continued) NOTE 6 LONG-TERM DEBT AND OTHER LONG-TERM LIABILITIES Long-Term Debt Long-term debt consisted of the following as of December 31: (In thousands) Credit agreement with an average interest rates of 2.9% at December 31, $ $ 71, % senior subordinated notes due 2021, net of unamortized discount of $4.3 million and $4.7 million at December 31, 2013 and 2012, respectively , ,259 Total long-term debt... $ 645,696 $ 716,359 Credit Agreement. Under our Senior Credit Agreement (credit agreement), the amount available to be borrowed is the lesser of the amount we elect (from time to time) as the commitment amount ($500.0 million) or the value of the borrowing base as determined by the lenders ($800.0 million), but in either event not to exceed the maximum credit agreement amount of $900.0 million. We are charged a commitment fee ranging from to 0.50 of 1% on the amount available but not borrowed. The rate varies based on the amount borrowed as a percentage of the amount of the total borrowing base. The credit agreement matures as of September 13, In connection with this new amendment, we paid $1.5 million in origination, agency, syndication, and other related fees when the credit agreement was amended on September 5, We are amortizing these fees over the life of the credit agreement. The amount of the borrowing base, which is subject to redetermination by the lenders on April 1st and October 1st of each year, is based primarily on a percentage of the discounted future value of our oil and natural gas reserves. There was no change to the borrowing base as of the October 1, 2013 redetermination. We or the lenders may request a onetime special redetermination of the borrowing base between each scheduled redetermination. In addition, we may request a redetermination following the completion of an acquisition that meets the requirements set forth in the credit agreement. At our election, any part of the outstanding debt under the credit agreement may be fixed at a London Interbank Offered Rate (LIBOR). LIBOR interest is computed as the sum of the LIBOR base for the applicable term plus 1.75% to 2.50% depending on the level of debt as a percentage of the borrowing base and is payable at the end of each term, or every 90 days, whichever is less. Borrowings not under LIBOR bear interest at the Prime Rate, which cannot be less than LIBOR plus 1.00%. Interest is payable at the end of each month, and the principal may be repaid in whole or in part at anytime, without a premium or penalty. At December 31, 2013, we had no outstanding borrowings under our credit agreement. We can use borrowings for financing general working capital requirements for (a) exploration, development, production and acquisition of oil and gas properties, (b) acquisitions and operation of mid-stream assets, (c) issuance of standby letters of credit, (d) contract drilling services, and (e) general corporate purposes. The credit agreement prohibits, among other things: the payment of dividends (other than stock dividends) during any fiscal year in excess of 30% of our consolidated net income for the preceding fiscal year; the incurrence of additional debt with certain limited exceptions; and the creation or existence of mortgages or liens, other than those in the ordinary course of business, on any of our properties, except in favor of our lenders. The credit agreement also requires that we have at the end of each quarter: a current ratio (as defined in the credit agreement) of not less than 1 to 1; and a leverage ratio of funded debt to consolidated EBITDA (as defined in the credit agreement) for the most recently ended rolling four fiscal quarters of no greater than 4 to 1. As of December 31, 2013, we were in compliance with the covenants contained in the credit agreement. 86
103 UNIT CORPORATION AND SUBSIDIARIES NOTES TO CONSOLIDATED FINANCIAL STATEMENTS (Continued) 6.625% Senior Subordinated Notes. On May 18, 2011, we completed the sale of $250.0 million aggregate principal amount of registered senior subordinated notes due 2021 (the 2011 Notes) which bear interest at a rate of 6.625% per year. The Notes were issued at par and mature on May 15, We received net proceeds of approximately $244.0 million after deducting fees of approximately $6.0 million. Those fees are being amortized as deferred financing costs over the life of the Notes. We used the net proceeds to repay outstanding borrowings under our credit agreement, which was $220.3 million on May 18, The remaining proceeds were used for general working capital purposes. On July 24, 2012, we completed the sale of $400.0 million aggregate principal amount of unregistered senior subordinated notes (the 2012 Notes) due May 15, 2021, which will bear interest at a rate of 6.625% per year. The 2012 Notes were sold at 98.75% of par plus accrued interest from May 15, We used the net proceeds from the offering to partially finance the acquisition of oil and natural gas properties from Noble. We incurred $8.7 million of fees that are being amortized as debt issuance cost over the life of the 2012 Notes. On November 13, 2012, we registered with the SEC on Form S-4 an offer to exchange the 2012 Notes for additional notes with materially identical terms to our existing 2011 Notes, which were registered under the Securities Act. On January 7, 2013, the exchange of the 2012 Notes was completed. The notes issued in exchange for the 2012 Notes are now registered and treated as a single series of debt securities with the 2011 Notes, bringing the total to $650.0 million aggregate principal amount of 6.625% senior subordinated notes (the Notes). The interest is payable semi-annually (in arrears) on May 15 and November 15 of each year, and the Notes will mature on May 15, The Notes are guaranteed by our 100% owned domestic direct and indirect subsidiaries (the Guarantors). Unit, as the parent company, has no independent assets or operations. The guarantees registered under the registration statement are full and unconditional and joint and several, subject to certain automatic customary releases, including sale, disposition, or transfer of the capital stock or substantially all of the assets of a subsidiary guarantor, exercise of legal defeasance option or covenant defeasance option, and designation of a subsidiary guarantor as unrestricted in accordance with the Indenture. Any subsidiaries of Unit other than the Guarantors are minor. There are no significant restrictions on the ability of Unit to receive funds from its subsidiaries through dividends, loans, advances or otherwise. The Notes are subject to an Indenture dated as of May 18, 2011, between us and Wilmington Trust, National Association (successor to Wilmington Trust FSB), as Trustee (the Trustee), as supplemented by the First Supplemental Indenture thereto dated as of May 18, 2011, between us, the Guarantors, and the Trustee, and as further supplemented by that the Second Supplemental Indenture thereto dated as of January 7, 2013, between us, the Guarantors and the Trustee, establishing the terms and providing for the issuance of the Notes (as supplemented, the 2011 Indenture). The discussion of the Notes in this report is qualified by and subject to the actual terms of the 2011 Indenture. On and after May 15, 2016, we may redeem all or, from time to time, a part of the Notes at certain redemption prices, plus accrued and unpaid interest. Before May 15, 2014, we may on any one or more occasions redeem up to 35% of the original principal amount of the Notes with the net cash proceeds of one or more equity offerings at a redemption price of % of the principal amount, plus accrued and unpaid interest, if any, to the redemption date, provided that at least 65% of the original principal amount of the Notes remains outstanding after each redemption. In addition, at any time before May 15, 2016, we may redeem the Notes, in whole or in part, at a redemption price equal to 100% of the principal amount plus a make whole premium, plus accrued and unpaid interest, if any, to the redemption date. If a change of control occurs, subject to certain conditions, we must offer to repurchase from each holder all or any part of that holder s Notes at a purchase price in cash equal to 101% of the principal amount of the Notes plus accrued and unpaid interest, if any, to the date of purchase. The Indenture contains customary events of default. The Indenture contains covenants that, among other things, limit our ability and the ability of certain of our subsidiaries to incur or guarantee additional indebtedness; pay dividends on our capital stock or redeem capital stock or subordinated indebtedness; transfer or sell assets; make investments; incur liens; enter into transactions with our affiliates; and merge or consolidate with other companies. We were in compliance with all covenants of the Notes as of December 31,
104 UNIT CORPORATION AND SUBSIDIARIES NOTES TO CONSOLIDATED FINANCIAL STATEMENTS (Continued) Other Long-Term Liabilities Other long-term liabilities consisted of the following as of December 31: (In thousands) ARO liability... $ 133,657 $ 146,159 Workers compensation... 20,041 18,517 Separation benefit plans... 9,382 7,972 Gas balancing liability... 3,775 3,838 Deferred compensation plan... 3,589 2, , ,265 Less current portion... 12,113 12,282 Total other long-term liabilities... $ 158,331 $ 166,983 Estimated annual principal payments under the terms of debt and other long-term liabilities from 2014 through 2018 are $12.1 million, $2.8 million, $40.4 million, $4.2 million, and $3.5 million, respectively. NOTE 7 ASSET RETIREMENT OBLIGATIONS We are required to record the estimated fair value of the liabilities relating to the future retirement of our long-lived assets (AROs). Our oil and natural gas wells are plugged and abandoned when the oil and natural gas reserves in those wells are depleted or the wells are no longer able to produce. The plugging and abandonment liability for a well is recorded in the period in which the obligation is incurred (at the time the well is drilled or acquired). None of our assets are restricted for purposes of settling these AROs. All of our AROs relate to plugging costs associated with our oil and gas wells. The following table shows certain information about our AROs for the periods indicated: (In thousands) ARO liability, January 1:... $ 146,159 $ 96,446 Accretion of discount... 5,450 4,615 Liability incurred... 4,857 56,650 (1) Liability settled... (4,751) (2,788) Liability sold... (2,622) (1,258) Revision of estimates (2)... (15,436) (7,506) ARO liability, December 31: , ,159 Less current portion... 2,954 2,953 Total long-term ARO liability... $ 130,703 $ 143,206 (1) The liability incurred increased $46.7 million related to the Noble properties acquired in September (2) Plugging liability estimates were revised in both 2013 and 2012 for updates in the cost of services used to plug wells over the preceding year. We had various upward and downward adjustments as well as changes in estimated timing of cash flows. 88
105 UNIT CORPORATION AND SUBSIDIARIES NOTES TO CONSOLIDATED FINANCIAL STATEMENTS (Continued) NOTE 8 INCOME TAXES A reconciliation of income tax expense, computed by applying the federal statutory rate to pre-tax income to our effective income tax expense is as follows: (In thousands) Income tax expense computed by applying the statutory rate... $ 105,514 $ 13,791 $ 111,651 State income tax, net of federal benefit... 8,290 1,084 8,941 Statutory depletion and other... 2,919 1,351 2,543 Income tax expense... $ 116,723 $ 16,226 $ 123,135 For the periods indicated, the total provision for income taxes consisted of the following: (In thousands) Current taxes: Federal... $ 15,845 $ 2,084 $ (3,159) State (1,388) , (2,416) Deferred taxes: Federal... 87,839 13, ,363 State... 12,893 1,762 16, ,732 15, ,551 Total provision... $ 116,723 $ 16,226 $ 123,135 Deferred tax assets and liabilities are comprised of the following at December 31: (In thousands) Deferred tax assets: Allowance for losses and nondeductible accruals... $ 77,285 $ 74,890 Net operating loss carryforward... 61,055 56,020 Alternative minimum tax credit carryforward... 17,258 1, , ,882 Deferred tax liability: Depreciation, depletion, amortization and impairment... (943,411) (819,893) Net deferred tax liability... (787,813) (687,011) Current deferred tax asset... 13,585 8,765 Non-current deferred tax liability... $ (801,398) $ (695,776) Realization of the deferred tax assets are dependent on generating sufficient future taxable income. Although realization is not assured, management believes it is more likely than not that the deferred tax asset will be realized. The amount of the deferred tax asset considered realizable, however, could be reduced in the near-term if estimates of future taxable income are reduced. At December 31, 2013, we have federal net operating loss carryforwards of approximately $146.5 million which expire from 2015 to
106 UNIT CORPORATION AND SUBSIDIARIES NOTES TO CONSOLIDATED FINANCIAL STATEMENTS (Continued) NOTE 9 EMPLOYEE BENEFIT PLANS Under our 401(k) Employee Thrift Plan, employees who meet specified service requirements may contribute a percentage of their total compensation, up to a specified maximum, to the plan. We may match each employee s contribution, up to a specified maximum, in full or on a partial basis. We made discretionary contributions under the plan of 111,995, 95,598, and 71,742 shares of common stock and recognized expense of $6.0 million, $5.5 million, and $4.3 million in 2013, 2012, and 2011, respectively. We provide a salary deferral plan (Deferral Plan) which allows participants to defer the recognition of salary for income tax purposes until actual distribution of benefits which occurs at either termination of employment, death or certain defined unforeseeable emergency hardships. The liability recorded under the Deferral Plan at December 31, 2013 and 2012 was $3.6 million and $2.8 million, respectively. We recognized payroll expense and recorded a liability at the time of deferral. Effective January 1, 1997, we adopted a separation benefit plan (Separation Plan). The Separation Plan allows eligible employees whose employment is involuntarily terminated or, in the case of an employee who has completed 20 years of service, voluntarily or involuntarily terminated, to receive benefits equivalent to four weeks salary for every whole year of service completed up to a maximum of 104 weeks. To receive payments, the recipient must waive any claims against us in exchange for receiving the separation benefits. On October 28, 1997, we adopted a Separation Benefit Plan for Senior Management (Senior Plan). The Senior Plan provides certain officers and key executives of Unit with benefits generally equivalent to the Separation Plan. The Compensation Committee of the Board of Directors has absolute discretion in the selection of the individuals covered in this plan. On May 5, 2004 we also adopted the Special Separation Benefit Plan (Special Plan). This plan is identical to the Separation Benefit Plan with the exception that the benefits under the plan vest on the earliest of a participant s reaching the age of 65 or serving 20 years with the company. On December 31, 2008, we amended all three Plans to be in compliance with Section 409A of the Internal Revenue Code of 1986, as amended. The key amendments to the Plans address, among other things, when distributions may be made, the timing of payments, and the circumstances under which employees become eligible to receive benefits. None of the amendments materially increase the benefits, grants or awards issuable under the Plans. We recognized expense of $2.4 million, $2.2 million, and $1.9 million in 2013, 2012, and 2011, respectively, for benefits associated with anticipated payments from these separation plans. We have entered into key employee change of control contracts with three of our current executive officers. These severance contracts have an initial three-year term that is automatically extended for one year on each anniversary, unless a notice not to extend is given by us. If a change of control of the company, as defined in the contracts, occurs during the term of the severance contract, then the contract becomes operative for a fixed three-year period. The severance contracts generally provide that the executive s terms and conditions for employment (including position, work location, compensation, and benefits) will not be adversely changed during the three-year period after a change of control. If the executive s employment is terminated (other than for cause, death, or disability), the executive terminates for good reason during such three-year period, or the executive terminates employment for any reason during the 30-day period following the first anniversary of the change of control, and on certain terminations prior to a change of control or in connection with or in anticipation of a change of control, the executive is generally entitled to receive, in addition to certain other benefits, any earned but unpaid compensation; up to 2.9 times the executive s base salary plus annual bonus (based on historic annual bonus); and the company matching contributions that would have been made had the executive continued to participate in the company s 401(k) plan for up to an additional three years. The severance contract provides that the executive is entitled to receive a payment in an amount sufficient to make the executive whole for any excise tax on excess parachute payments imposed under Section 4999 of the Code. As a condition to receipt of these severance benefits, the executive must remain in the employ of the company prior to change of control and render services commensurate with his position. NOTE 10 TRANSACTIONS WITH RELATED PARTIES Unit Petroleum Company serves as the general partner of 16 oil and gas limited partnerships. Three were formed for investment by third parties and 13 (the employee partnerships) were formed to allow certain of our qualified employees and our directors to participate in Unit Petroleum s oil and gas exploration and production operations. The partnerships for the third party investments were formed in 1984 and Employee partnerships have been formed for each year beginning with
107 UNIT CORPORATION AND SUBSIDIARIES NOTES TO CONSOLIDATED FINANCIAL STATEMENTS (Continued) and ending with Interests in the employee partnerships were offered to the employees of Unit and its subsidiaries whose annual base compensation was at least a specified amount ($36,000 for 2011) and to the directors of Unit. The employee partnerships formed in 1984 through 1990 were consolidated into a single consolidating partnership in 1993 and the employee partnerships formed in 1991 through 1999 were also consolidated into the consolidating partnership in The consolidation of the 1991 through the 1999 employee partnerships was done by the general partners under the authority contained in the respective partnership agreements and did not involve any vote, consent or approval by the limited partners. The employee partnerships have each had a set percentage (ranging from 1% to 15%) of our interest in most of the oil and natural gas wells we drill or acquire for our own account during the particular year for which the partnership was formed. The total interest the employees have in our oil and natural gas wells by participating in these partnerships does not exceed one percent. Amounts received in the years ended December 31, from both public and private Partnerships for which Unit is a general partner are as follows: (In thousands) Contract drilling... $ 16 $ 246 $ 352 Well supervision and other fees... $ 470 $ 434 $ 396 General and administrative expense reimbursement... $ 36 $ 39 $ 610 Related party transactions for contract drilling and well supervision fees are the related party s share of such costs. These costs are billed to related parties on the same basis as billings to unrelated parties for such services. General and administrative reimbursements are both direct general and administrative expense incurred on the related party s behalf and indirect expenses allocated to the related parties. Such allocations are based on the related party s level of activity and are considered by management to be reasonable. One of our directors, G. Bailey Peyton IV, also serves as the President and a significant investor in Upland Resources, L.L.C., a small independent oil and natural gas exploration company, and as Manager of Peyton Royalties, LP, a familycontrolled limited partnership that owns royalty rights in wells in the Texas and Oklahoma Panhandles. In the ordinary course of business, there were no wells drilled for Upland Resources, L.L.C. during 2013 or 2011 and the Company drilled three wells during 2012, under its usual standard dayrate contracts, in which Upland Resources, L.L.C. was a participant, for which the Company received payments of approximately $1.6 million from Upland Resources, L.L.C. The Company also paid royalties during 2013 and 2012, primarily due to its status as successor in interest to prior transactions and as operator of the wells involved and, in some cases, as lessee, with respect to certain wells in which Mr. Peyton, members of Mr. Peyton's family, and Peyton Royalties, LP have an interest. Such payments totaled approximately $1.4 million, $1.2 million, and $0.7 million during 2013, 2012, and 2011, respectively. Our Audit Committee and the board, in accordance with the Policy, have determined that these arrangements are in the best interest of the Company. NOTE 11 SHAREHOLDER RIGHTS PLAN We maintain a Shareholder Rights Plan (the Plan) designed to deter coercive or unfair takeover tactics, to prevent a person or group from gaining control of us without offering fair value to all our shareholders and to deter other abusive takeover tactics, which are not in the best interest of shareholders. Under the terms of the Plan, each share of common stock is accompanied by one right, which given certain acquisition and business combination criteria, entitles the shareholder to purchase from us one one-hundredth of a newly issued share of Series A Participating Cumulative Preferred Stock at a price subject to adjustment by us or to purchase from an acquiring company certain shares of its common stock or the surviving company s common stock at 50% of its value. The rights become exercisable 10 days after we learn that an acquiring person (as defined in the Plan) has acquired 15% or more of the outstanding common stock of Unit or 10 business days after the commencement of a tender offer, which would result in a person owning 15% or more of our shares. We can redeem the rights for $0.01 per right at any date before the earlier 91
108 UNIT CORPORATION AND SUBSIDIARIES NOTES TO CONSOLIDATED FINANCIAL STATEMENTS (Continued) of (i) the close of business on the 10th day following the time we learn that a person has become an acquiring person or (ii) May 19, 2015 (the Expiration Date ). The rights will expire on the Expiration Date, unless redeemed earlier by Unit. NOTE 12 STOCK-BASED COMPENSATION For restricted stock awards and stock options, we had: (In millions) Recognized stock compensation expense... $ 16.1 $ 11.4 $ 10.0 Capitalized stock compensation cost for our oil and natural gas properties Tax benefit on stock based compensation The remaining unrecognized compensation cost related to unvested awards at December 31, 2013 is approximately $14.2 million with $2.4 million of this amount anticipated to be capitalized. The weighted average period of time over which this cost will be recognized is 0.8 years. At our annual meeting of stockholders held on May 2, 2012, our stockholders approved the Unit Corporation Stock and Incentive Compensation Plan Amended and Restated May 2, 2012 (the amended plan). The amended plan allows us to grant stock-based and cash-based compensation to our employees (including employees of subsidiaries) as well as non-employee directors. The amended plan succeeds the Non-employee Directors' 2000 Stock Option Plan (the option plan), and no new awards will be issued under the option plan. The amended plan allows for the issuance of 3.3 million shares of common stock with 2.0 million shares being the maximum number of shares that can be issued as incentive stock options. Awards under this plan may be granted in any one or a combination of the following: incentive stock options under Section 422 of the Internal Revenue Code; non-qualified stock options; performance shares; performance units; restricted stock; restricted stock units; stock appreciation rights; cash based awards; and other stock-based awards. This plan also contains various limits as to the amount of awards that can be given to an employee in any fiscal year. All awards are generally subject to the minimum vesting periods, as determined by our Compensation Committee and included in the award agreement. 92
109 UNIT CORPORATION AND SUBSIDIARIES NOTES TO CONSOLIDATED FINANCIAL STATEMENTS (Continued) The table below shows the estimates of the fair value of stock options granted to our non-employee directors under the option plan in 2011 using the Black-Scholes model and applying the estimated values also presented in the table: 2011 Options granted... 31,500 Estimated fair value (in millions)... $ 0.7 Estimate of stock volatility Estimated dividend yield... % Risk free interest rate... 2% Expected life range based on prior experience (in years)... 5 Forfeiture rate... % Expected volatilities are based on the historical volatility of our stock. We use historical data to estimate option exercise and termination rates within the model and aggregate groups that have similar historical exercise behavior for valuation purposes. To date, we have not paid dividends on our stock. The risk free interest rate is computed from the United States Treasury Strips rate using the term over which it is anticipated the grant will be exercised. SARs Activity pertaining to SARs granted under the Unit Corporation Stock and Incentive Compensation Plan is as follows: Number of Shares Weighted Average Grant Date Price Outstanding at January 1, ,901 $ Granted... Exercised... Forfeited... Outstanding at December 31, , Granted... Exercised... Forfeited... Outstanding at December 31, , Granted... Exercised... Forfeited... Outstanding at December 31, ,901 $ There were no SARs granted in 2013, 2012, or The SARs expire after 10 years from the date of the grant. In 2013 and 2012, no shares vested. In 2011, 33,745 shares vested. The aggregate intrinsic value of the 145,901 shares outstanding at December 31, 2013 was $0.7 million with a weighted average remaining contractual term of 3.6 years. 93
110 UNIT CORPORATION AND SUBSIDIARIES NOTES TO CONSOLIDATED FINANCIAL STATEMENTS (Continued) Restricted Stock Activity pertaining to restricted stock awards granted under the amended plan is as follows: Weighted Average Employees Number of Shares Grant Date Price Nonvested at January 1, ,125 $ Granted , Vested... (190,262) Forfeited... (18,952) Nonvested at December 31, , Granted , Vested... (220,788) Forfeited... (14,091) Nonvested at December 31, , Granted , Vested... (248,003) Forfeited... (18,330) Nonvested at December 31, ,743 $ Weighted Average Non-Employee Directors Number of Shares Grant Date Price Nonvested at December 31, $ Granted... 24, Vested... Forfeited... Nonvested at December 31, ,606 $ Granted... 21, Vested... (10,030) Forfeited... Nonvested at December 31, ,704 $ The restricted stock awards vest in periods ranging from 2 to 3 years, except for a portion of those granted to certain executive officers. As to those executive officers, 30% of the shares granted, or 57,405 shares in 2013, 46,441 shares in 2012, and 20,062 shares in 2011 (the performance shares), will cliff vest in the first half of 2016, 2015, and 2014, respectively. The actual number of performance shares that vest in 2014, 2015, and 2016 will be based on the company s achievement of certain performance criteria over a three-year period, and will range from 0% to 150% of the restricted shares granted as performance shares. Based on the performance criteria, the participants will receive 65.25% of the 2011 performance based shares and are estimated to receive the targeted amount (or 100%) of the 2012 and 2013 performance shares. The fair value of the restricted stock granted in 2013, 2012, and 2011 at the grant date was $21.3 million, $16.9 million, and $10.8 million, respectively. The aggregate intrinsic value of the 248,003 shares of restricted stock on their 2013 vesting date was $11.3 million. The aggregate intrinsic value of the 776,743 shares outstanding subject to vesting at December 31, 2013 was $40.1 million with a weighted average remaining life of 1.0 year. 94
111 UNIT CORPORATION AND SUBSIDIARIES NOTES TO CONSOLIDATED FINANCIAL STATEMENTS (Continued) Employee Stock Option Plan The Stock Option Plan, provided the granting of options for up to 2,700,000 shares of common stock to officers and employees. The option plan permitted the issuance of qualified or nonqualified stock options. Options granted typically became exercisable at the rate of 20% per year one year after being granted and expire after 10 years from the original grant date. The exercise price for options granted under this plan was the fair market value of the common stock on the date of the grant. In 2006, as a result of the approval of the adoption of the Unit Corporation Stock and Incentive Compensation Plan, no further awards were made under this plan. Activity pertaining to the Stock Option Plan is as follows: Number of Shares Weighted Average Exercise Price Outstanding at January 1, ,765 $ Granted... Exercised... (42,285) Forfeited... (3,500) Outstanding at December 31, , Granted... Exercised... (18,850) Forfeited... (2,100) Outstanding at December 31, , Granted... Exercised... (48,110) Forfeited... (1,000) Outstanding at December 31, ,920 $ There were no shares that vested in 2013, 2012, or The intrinsic value of options exercised in 2013 was $1.1 million. Total cash received from the options exercised in 2013 was $0.1 million. Outstanding and Exercisable Options at December 31, 2013 Weighted Exercise Prices Number of Shares Average Remaining Contractual Life Weighted Average Exercise Price $ $ , year $37.81 Options for 68,920, 118,030, and 138,980 shares were exercisable with weighted average exercise prices of $37.81, $33.03, and $31.39 at December 31, 2013, 2012, and 2011, respectively. The aggregate intrinsic value of the 68,920 shares outstanding subject to options at December 31, 2013 was $1.0 million with a weighted average remaining contractual term of 1.0 year. Non-Employee Directors' Stock Option Plan Under the Unit Corporation 2000 Non-Employee Directors Stock Option Plan, on the first business day following each annual meeting of shareholders, each person who was then a member of our Board of Directors and who was not then an employee of the company or any of its subsidiaries was granted an option to purchase 3,500 shares of common stock. The option price for each stock option was the fair market value of the common stock on the date the stock options were granted. The term of each option is 10 years and cannot be increased and no stock options were to be exercised during the first six 95
112 UNIT CORPORATION AND SUBSIDIARIES NOTES TO CONSOLIDATED FINANCIAL STATEMENTS (Continued) months of its term except in case of death. As mentioned above, on May 2, 2012, our stockholders approved the amended plan which succeeds this plan, and no new awards will be issued under the non-employee director option plan. Activity pertaining to the Directors Plan is as follows: Number of Shares Weighted Average Exercise Price Outstanding at January 1, ,500 $ Granted... 31, Exercised... (10,500) Forfeited... Outstanding at December 31, , Granted... Exercised... (7,000) Forfeited... Outstanding at December 31, , Granted... Exercised... (17,500) Forfeited... (3,500) Outstanding at December 31, ,500 $ The total grant date fair value of the 31,500 shares vesting in 2011 was $0.7 million. The intrinsic value of the 17,500 options exercised in 2013 was $0.2 million. Total cash received from options exercised in 2013 was $0.6 million. Weighted Average Exercise Price Number of Shares Outstanding and Exercisable Options at December 31, 2013 Weighted Average Remaining Contractual Life Weighted Average Exercise Price $ $ , years $ $ $ , years $ Options for 171,500, 192,500, and 199,500 shares were exercisable with weighted average exercise prices of $51.70, $49.39, and $48.37 at December 31, 2013, 2012, and 2011, respectively. The aggregate intrinsic value of the shares outstanding subject to options at December 31, 2013 was $1.0 million with a weighted average remaining contractual term of 4.6 years. 96
113 UNIT CORPORATION AND SUBSIDIARIES NOTES TO CONSOLIDATED FINANCIAL STATEMENTS (Continued) NOTE 13 DERIVATIVES Commodity Derivatives We have entered into various types of derivative transactions covering some of our projected natural gas, NGLs, and oil production. These transactions are intended to reduce our exposure to market price volatility by setting the price(s) we will receive for that production. Our decisions on the price(s), type, and quantity of our production hedged is based, in part, on our view of current and future market conditions. As of December 31, 2013, our derivative transactions consisted of the following types of hedges: Swaps. We receive or pay a fixed price for the hedged commodity and pay or receive a floating market price to the counterparty. The fixed-price payment and the floating-price payment are netted, resulting in a net amount due to or from the counterparty. Collars. A collar contains a fixed floor price (put) and a ceiling price (call). If the market price exceeds the call strike price or falls below the put strike price, we receive the fixed price and pay the market price. If the market price is between the call and the put strike price, no payments are due from either party. We have documented policies and procedures to monitor and control the use of derivative instruments. We do not engage in derivative transactions for speculative purposes. In August 2012, we determined on a prospective basis, to enter into economic hedges without electing cash flow hedge accounting. Therefore, the change in fair value, on all commodity derivatives entered into after that determination, will be reflected in the income statement and not in accumulated other comprehensive income (OCI). At December 31, 2013, the following non-designated hedges were outstanding: Term Commodity Hedged Volume Weighted Average Fixed Price for Swaps Hedged Market Jan 14 Dec 14 Natural gas swap 80,000 MMBtu/day $4.24 IF NYMEX (HH) Jan 14 Dec 14 Natural gas collar 10,000 MMBtu/day $ IF NYMEX (HH) Jan 14 Jun 14 Crude oil swap 500 Bbl/day $ WTI NYMEX Jan 14 Dec 14 Crude oil swap 3,000 Bbl/day $91.77 WTI NYMEX Jan 14 Dec 14 Crude oil collar 4,000 Bbl/day $ WTI NYMEX Subsequent to December 31, 2013, the following non-designated hedges were entered into: Term Commodity Hedged Volume Weighted Average Fixed Price for Swaps Hedged Market Mar'14 Natural gas basis swap 30,000 MMBtu/day $(0.095) NGPL-TXOK Mar'14 Natural gas basis swap 60,000 MMBtu/day $(0.027) NGPL-Midcon 97
114 UNIT CORPORATION AND SUBSIDIARIES NOTES TO CONSOLIDATED FINANCIAL STATEMENTS (Continued) The following tables present the fair values of our derivative transactions and the location within our balance sheets where those values are recorded at December 31: Derivatives designated as hedging instruments Commodity derivatives: Derivative Assets Fair Value Balance Sheet Location (In thousands) Current... Current derivative assets $ $ 13,674 Long-term... Non-current derivative assets Total derivatives designated as hedging instruments... 13,674 Derivatives not designated as hedging instruments Commodity derivatives: Current... Current derivative assets 515 2,878 Long-term... Non-current derivative assets Total derivatives not designated as hedging instruments ,878 Total derivative assets... $ 515 $ 16,552 Derivatives designated as hedging instruments Commodity derivatives: Derivative Liabilities Fair Value Balance Sheet Location (In thousands) Current... Current derivative liabilities $ $ 1,005 Long-term... Non-current derivative liabilities Total derivatives designated as hedging instruments... 1,005 Derivatives not designated as hedging instruments Commodity derivatives: Current... Current derivative liabilities 5, Long-term... Non-current derivative liabilities 562 Total derivatives not designated as hedging instruments... 5,561 1,505 Total derivative liabilities... $ 5,561 $ 2,510 If a legal right of set-off exists, we net the value of the derivative transactions we have with the same counterparty in our balance sheets. We recognized in accumulated other comprehensive income (OCI) the effective portion of any changes in fair value and reclassified the recognized gains (losses) on the sales to oil and natural gas revenue as the underlying transactions were settled. All cash flow hedges expired as of December 31, 2013, therefore we had no balance in accumulated OCI at December 31, 2013 and at December 31, 2012, we had a gain of $7.6 million, net of tax. For our economic hedges that we elected not to apply cash flow accounting to, any changes in their fair value occurring before their maturity (i.e., temporary fluctuations in value) are reported in gain (loss) on derivatives not designated as hedges 98
115 UNIT CORPORATION AND SUBSIDIARIES NOTES TO CONSOLIDATED FINANCIAL STATEMENTS (Continued) and hedge ineffectiveness, net in our consolidated statements of income. Changes in the fair value of derivatives that were designated as cash flow hedges, to the extent they were effective in offsetting cash flows attributable to the hedged risk, were recorded in OCI until the hedged item was recognized into earnings. When the hedged item was recognized into earnings, it was reported in oil and natural gas revenues. Any change in fair value that resulted from ineffectiveness was recognized in gain (loss) on derivatives not designated as hedges and hedge ineffectiveness, net. Effect of Derivative Instruments on the Consolidated Balance Sheets (cash flow hedges) for the year ended December 31: Derivatives in Cash Flow Hedging Relationships Amount of Gain or (Loss) Recognized in Accumulated OCI on Derivative (Effective Portion) (1) (In thousands) Commodity derivatives... $ $ 7,587 (1) Net of taxes. Effect of derivative instruments on the Consolidated Statements of Income (cash flow hedges) for the year ended December 31: Derivative Instrument Location of Gain or (Loss) Reclassified from Accumulated OCI into Income & Location of Gain or (Loss) Recognized in Income Amount of Gain or (Loss) Reclassified from Accumulated OCI into Income (1) Amount of Gain or (Loss) Recognized in Income (2) (In thousands) Commodity derivatives Oil and natural gas revenue (1) $ 603 $ 51,853 $ $ Commodity derivatives (1) Effective portion of gain (loss). (2) Ineffective portion of gain (loss). Gain (loss) on derivatives not designated as hedges and hedge ineffectiveness, net (2) (190) (2,616) Total $ 603 $ 51,853 $ (190) $ (2,616) Effect of Derivative Instruments on the Consolidated Statements of Income (derivatives not designated as hedging instruments) for the year ended December 31: Amount of Gain or (Loss) Location of Gain or (Loss) Recognized in Income on Recognized in Income on Derivative Derivatives Not Designated as Hedging Instruments Derivative Commodity derivatives... (In thousands) Gain (loss) on derivatives not designated as hedges and hedge ineffectiveness, net (1) $ (8,184) $ 1,373 Total... $ (8,184) $ 1,373 (1) Amount settled during the period is a loss of $(1,764) and $0, respectively. 99
116 UNIT CORPORATION AND SUBSIDIARIES NOTES TO CONSOLIDATED FINANCIAL STATEMENTS (Continued) NOTE 14 FAIR VALUE MEASUREMENTS Fair value is defined as the amount that would be received from the sale of an asset or paid for the transfer of a liability in an orderly transaction between market participants (in either case, an exit price). To estimate an exit price, a three-level hierarchy is used prioritizing the valuation techniques used to measure fair value into three levels with the highest priority given to Level 1 and the lowest priority given to Level 3. The levels are summarized as follows: Level 1 unadjusted quoted prices in active markets for identical assets and liabilities. Level 2 significant observable pricing inputs other than quoted prices included within level 1 that are either directly or indirectly observable as of the reporting date. Essentially, inputs (variables used in the pricing models) that are derived principally from or corroborated by observable market data. Level 3 generally unobservable inputs which are developed based on the best information available and may include our own internal data. The inputs available to us determine the valuation technique we use to measure the fair values of our financial instruments. The following tables set forth our recurring fair value measurements: Financial assets (liabilities): Commodity derivatives: December 31, 2013 Effect of Level 2 Level 3 Netting (In thousands) Total Assets... $ 1,978 $ 20 $ (1,483) $ 515 Liabilities... (4,429) (2,615) 1,483 (5,561) $ (2,451) $ (2,595) $ $ (5,046) Financial assets (liabilities): Commodity derivatives: December 31, 2012 Effect of Level 2 Level 3 Netting (In thousands) Total Assets... $ 18,555 $ $ (2,003) $ 16,552 Liabilities... (3,918) (595) 2,003 (2,510) $ 14,637 $ (595) $ $ 14,042 All of our counterparties are subject to master netting arrangements. If a legal right of set-off exists, we net the value of the derivative transactions we have with the same counterparty. We are not required to post any cash collateral with our counterparties and no collateral has been posted as of December 31, Certain natural gas fixed price swaps were transferred from Level 3 to Level 2 as of March 31, 2012 because of improvements in our ability to obtain and corroborate observable significant inputs to assess the fair value. Our policy is to recognize transfers either in or out of fair value hierarchy levels as of the end of the quarterly reporting period in which the event or change in circumstances causing the transfer occurred. 100
117 UNIT CORPORATION AND SUBSIDIARIES NOTES TO CONSOLIDATED FINANCIAL STATEMENTS (Continued) The following methods and assumptions were used to estimate the fair values of the assets and liabilities in the table above. Level 2 Fair Value Measurements Commodity Derivatives. We measure the fair values of our crude oil and natural gas swaps using estimated internal discounted cash flow calculations based on the NYMEX futures index. Level 3 Fair Value Measurements Commodity Derivatives. The fair values of our natural gas and crude oil collars are estimated using internal discounted cash flow calculations based on forward price curves, quotes obtained from brokers for contracts with similar terms, or quotes obtained from counterparties to the agreements. The following tables are reconciliations of our level 3 fair value measurements: Net Derivatives For the Year Ended, December 31, 2013 (In thousands) December 31, 2012 Beginning of period... $ (595) $ 33,615 Total gains or losses: Included in earnings (1)... (2,637) 24,484 Included in other comprehensive income (loss)... (11,641) Settlements (25,129) Transfers out of Level 3 into Level 2... (21,924) End of period... $ (2,595) $ (595) Total gains (losses) for the period included in earnings attributable to the change in unrealized loss relating to assets still held at end of period... $ (2,000) $ (645) (1) Commodity sales collars are reported in the consolidated statements of income in oil and gas revenues (for cash flow hedges), and gain (loss) on derivatives not designated as hedges and hedge ineffectiveness, net, respectively. The following table provides quantitative information about our Level 3 unobservable inputs at December 31, 2013: Commodity (1) Fair Value Valuation Technique Unobservable Input Range (In thousands) Oil collars... $ (2,246) Discounted cash flow Forward commodity price curve $0.20-$5.29 Natural gas collar... $ (349) Discounted cash flow Forward commodity price curve $0.00-$0.39 (1) The commodity contracts detailed in this category include non-exchange-traded natural gas and crude oil collars that are valued based on NYMEX. The forward pricing range represents the low and high price expected to be received within the settlement period. Based on our valuation at December 31, 2013, we determined that the non-performance risk with regard to our counterparties was immaterial. Fair Value of Other Financial Instruments The following disclosure of the estimated fair value of financial instruments is made in accordance with accounting guidance for financial instruments. We have determined the estimated fair values by using available market information and valuation methodologies. Considerable judgment is required in interpreting market data to develop the estimates of fair value. The use of different market assumptions or valuation methodologies may have a material effect on the estimated fair value amounts. 101
118 UNIT CORPORATION AND SUBSIDIARIES NOTES TO CONSOLIDATED FINANCIAL STATEMENTS (Continued) At December 31, 2013, the carrying values on the consolidated balance sheets for cash and cash equivalents (classified as Level 1), accounts receivable, accounts payable, other current assets, and current liabilities approximate their fair value because of their short term nature. Based on the borrowing rates currently available to us for credit agreement debt with similar terms and maturities and also considering the risk of our non-performance, long-term debt under our credit agreement at December 31, 2013 approximates its fair value. This debt would be classified as Level 2. The carrying amounts of long-term debt, net of unamortized discount, associated with the Notes reported in the consolidated balance sheets at December 31, 2013 and December 31, 2012 were $645.7 million and $645.3 million, respectively. We estimate the fair value of these Notes using quoted marked prices at December 31, 2013 and December 31, 2012 were $688.2 million and $687.7 million, respectively. These Notes would be classified as Level 2. NOTE 15 ACCUMULATED OTHER COMPREHENSIVE INCOME Changes in accumulated other comprehensive income (loss) by component, net of tax, are as follows: Net Gains (Losses) on Cash Flow Hedges (In thousands) Balance at January 1:... $ 7,587 $ 19,026 $ (6,851) Other comprehensive income before reclassification... (7,349) 18,635 29,384 Amounts reclassified from accumulated other comprehensive income... (238) (30,074) (3,507) New current-period other comprehensive income... (7,587) (11,439) 25,877 Balance at December 31:... $ $ 7,587 $ 19,026 Amounts reclassified from accumulated other comprehensive income (loss) into the consolidated statements of income for the year ended December 31: Net gains (loss) on cash flow hedges (In thousands) Affected Line Item in the Statement Where Net Income is Presented Commodity derivatives... $ 603 $ 51,853 $ 2,965 Oil and natural gas revenues Commodity derivatives... (190) (2,616) 2, ,237 5,714 Total before tax (175) (19,163) (2,207) Tax expense Total reclassification for the period.. $ 238 $ 30,074 $ 3,507 Net of tax Gain (loss) on derivatives not designated as hedges and hedge ineffectiveness, net NOTE 16 COMMITMENTS AND CONTINGENCIES We lease office space or yards in Edmond, Oklahoma City, and Tulsa, Oklahoma; Houston, Texas; Englewood, Colorado; Pinedale, Wyoming; and Pittsburgh, Pennsylvania under the terms of operating leases expiring through September, Additionally, we have several compressor rentals, equipment leases, and lease space on short-term commitments to stack excess drilling rig equipment and production inventory. Future minimum rental payments under the terms of the leases are approximately $8.4 million, $3.4 million, $0.6 million, and $0.1 million in 2014 through 2017, respectively. Total rent expense incurred was $16.9 million, $14.0 million, and $8.5 million in 2013, 2012, and 2011, respectively. 102
119 UNIT CORPORATION AND SUBSIDIARIES NOTES TO CONSOLIDATED FINANCIAL STATEMENTS (Continued) The Unit 1984 Oil and Gas Limited Partnership and the 1986 Energy Income Limited Partnership agreements along with the employee oil and gas limited partnerships require, on the election of a limited partner, that we repurchase the limited partner s interest at amounts to be determined by appraisal in the future. These repurchases in any one year are limited to 20% of the units outstanding. We made repurchases of $16,000 in 2013, 56,000 in 2012, and $22,000 in We manage our exposure to environmental liabilities on properties to be acquired by identifying existing problems and assessing the potential liability. We also conduct periodic reviews, on a company-wide basis, to identify changes in our environmental risk profile. These reviews evaluate whether there is a probable liability, its amount, and the likelihood that the liability will be incurred. The amount of any potential liability is determined by considering, among other matters, incremental direct costs of any likely remediation and the proportionate cost of employees who are expected to devote a significant amount of time directly to any possible remediation effort. As it relates to evaluations of purchased properties, depending on the extent of an identified environmental problem, we may exclude a property from the acquisition, require the seller to remediate the property to our satisfaction, or agree to assume liability for the remediation of the property. We have not historically experienced any environmental liability while being a contract driller since the greatest portion of risk is borne by the operator. Any liabilities we have incurred have been small and have been resolved while the drilling rig is on the location and the cost has been included in the direct cost of drilling the well. For the next twelve months, we have committed to purchase approximately $11.4 million of new drilling rig components, drill pipe, drill collars and related equipment and $0.6 million remaining towards a gas treating plant. We are subject to various legal proceedings arising in the ordinary course of our various businesses none of which, in our opinion, will result in judgments which would have a material adverse effect on our financial position, operating results or cash flows. NOTE 17 INDUSTRY SEGMENT INFORMATION We have three main business segments offering different products and services: Oil and natural gas, Contract drilling, and Mid-stream The oil and natural gas segment is engaged in the development, acquisition, and production of oil and natural gas properties. The contract drilling segment is engaged in the land contract drilling of oil and natural gas wells and the mid-stream segment is engaged in the buying, selling, gathering, processing, and treating of natural gas. We evaluate each segment s performance based on its operating income, which is defined as operating revenues less operating expenses and depreciation, depletion, amortization, and impairment. Our oil and natural gas production outside the United States is not significant. 103
120 UNIT CORPORATION AND SUBSIDIARIES NOTES TO CONSOLIDATED FINANCIAL STATEMENTS (Continued) The following table provides certain information about the operations of each of our segments: (In thousands) Revenues: Oil and natural gas... $ 649,718 $ 567,944 $ 514,614 Contract drilling , , ,872 Elimination of inter-segment revenue... (64,313) (49,649) (52,221) Contract drilling net of inter-segment revenue , , ,651 Gas gathering and processing , , ,248 Elimination of inter-segment revenue... (91,043) (73,313) (76,010) Gas gathering and processing net of inter-segment revenue , , ,238 Total revenues... $ 1,351,850 $ 1,315,123 $ 1,207,503 Operating income: Oil and natural gas... $ 239,219 $ (77,221) (3) $ 199,993 Contract drilling... 96, , ,085 Gas gathering and processing... 10,757 5,780 (4) 17,278 Total operating income (1) ,280 87, ,356 General and administrative expense... (38,323) (33,086) (30,055) Gain (loss) on disposition of assets... 17, (595) Interest expense, net... (15,015) (14,137) (4,167) Gain (loss) on derivatives not designated as hedges and hedge ineffectiveness, net... (8,374) (1,243) 1,702 Other income (expense), net... (175) (132) (239) Income before income taxes... $ 301,469 $ 39,402 $ 319,002 Identifiable assets: Oil and natural gas... $ 2,441,792 $ 2,214,029 $ 1,820,492 Contract drilling... 1,042,661 1,079,736 1,118,666 Gas gathering and processing , , ,763 Total identifiable assets (2)... 3,958,170 3,707,473 3,186,921 Corporate assets... 64,220 53,647 69,799 Total assets... $ 4,022,390 $ 3,761,120 $ 3,256,720 Capital expenditures: Oil and natural gas (5)... $ 531,233 $ 1,145,337 $ 588,158 Contract drilling... 64,325 77, ,208 Gas gathering and processing... 96, ,162 79,355 Other (5)... 4,483 11,083 2,688 Total capital expenditures... $ 696,126 $ 1,417,102 $ 832,409 Depreciation, depletion, amortization, and impairment: Oil and natural gas: Depreciation, depletion and amortization , , ,350 Impairment of oil and natural gas properties ,606 (3) Contract drilling... 71,194 81,007 79,667 Gas gathering and processing... 33,191 24,388 (4) 16,101 Other... 3,024 2,279 1,333 Total depreciation, depletion, amortization, and impairment... $ 333,907 $ 602,627 $ 280,451 (1) Operating income is total operating revenues less operating expenses, depreciation, depletion, amortization, and impairment and does not include general corporate expenses, (gain) loss on disposition of assets, gain (loss) on non-designated hedges and hedge ineffectiveness, interest expense, other income (loss), or income taxes. (2) Identifiable assets are those used in Unit s operations in each industry segment. Corporate assets are principally cash and cash equivalents, short-term investments, corporate leasehold improvements, furniture and equipment. (3) In June 2012 and December 2012, due to low 12-month average commodity prices, we incurred non-cash ceiling test write downs of our oil and natural gas properties of $115.9 million pre-tax ($72.1 million net of tax) and $167.7 million pre-tax ($104.4 million net of tax), respectively. 104
121 UNIT CORPORATION AND SUBSIDIARIES NOTES TO CONSOLIDATED FINANCIAL STATEMENTS (Continued) (4) Depreciation, depletion, amortization, and impairment for gas gathering and processing includes a $1.2 million write down of our Erick system. (5) Reclassified salt water disposal capital expenditures out of other and into oil and natural gas of $16,988 and $8,103 for 2012 and 2011, respectively. NOTE 18 SELECTED QUARTERLY FINANCIAL INFORMATION Summarized unaudited quarterly financial information is as follows: Three Months Ended March 31 June 30 September 30 December 31 (In thousands except per share amounts) 2013 Revenues... $ 318,532 $ 340,421 $ 333,776 $ 359,121 Gross profit... $ 83,683 $ 90,823 $ 79,082 $ 92,692 (1) Net income... $ 40,206 $ 59,007 $ 34,232 $ 51,301 Net income per common share: Basic... $ 0.84 $ 1.22 $ 0.71 $ 1.06 Diluted... $ 0.83 $ 1.22 $ 0.70 $ Revenues... $ 333,966 $ 327,785 $ 321,790 $ 331,582 Gross profit (loss)... $ 95,912 $ (22,253) $ 95,921 $ (81,833) (1) Net income (loss)... $ 52,439 $ (19,302) $ 46,586 $ (56,547) Net income (loss) per common share: Basic... $ 1.10 $ (0.40) $ 0.97 $ (1.18) (2) Diluted... $ 1.09 $ (0.40) $ 0.97 $ (1.18) (1) Gross profit excludes general and administrative expense, interest expense, (gain) loss on disposition of assets, gain (loss) on non-designated hedges and hedge ineffectiveness, income taxes, and other income (loss). (2) Due to the effect of rounding the basic earnings per share for the year s four quarters does not equal annual earnings per share. 105
122 SUPPLEMENTAL OIL AND GAS DISCLOSURES (UNAUDITED) Our oil and gas operations are substantially located in the United States. We do have operations in Canada that are insignificant. The capitalized costs at year-end and costs incurred during the year were as follows: (In thousands) Capitalized costs: Proved properties... $ 4,235,712 $ 3,822,381 $ 3,302,032 Unproved properties , , ,632 4,781,300 4,344,040 3,487,664 Accumulated depreciation, depletion, amortization, and impairment... (2,439,458) (2,216,787) (1,724,312) Net capitalized costs... $ 2,341,842 $ 2,127,253 $ 1,763,352 Cost incurred: Unproved properties acquired... $ 76,304 $ 420,467 $ 70,999 Proved properties acquired ,669 50,013 Exploration... 33,373 46,467 43,836 Development , , ,862 Asset retirement obligation... (17,951) 45,097 23,345 Total costs incurred... $ 516,040 $ 1,128,349 $ 580,055 The following table shows a summary of the oil and natural gas property costs not being amortized at December 31, 2013, by the year in which such costs were incurred: and Prior (In thousands) Unproved properties acquired and wells in progress... $ 92,929 $ 412,623 $ 32,492 $ 7,544 $ 545,588 Total Unproved properties not subject to amortization relates to properties which are not individually significant and consist primarily of lease acquisition costs. The evaluation process associated with these properties has not been completed and therefore, the company is unable to estimate when these costs will be included in the amortization calculation. The results of operations for producing activities are as follows: (In thousands) Revenues... $ 633,792 $ 557,003 $ 505,450 Production costs... (162,822) (131,389) (115,400) Depreciation, depletion, amortization, and impairment... (222,672) (492,475) (181,960) 248,298 (66,861) 208,090 Income tax (expense) benefit... (96,091) 27,533 (80,323) Results of operations for producing activities (excluding corporate overhead and financing costs)... $ 152,207 $ (39,328) $ 127,
123 Estimated quantities of proved developed oil, NGLs, and natural gas reserves and changes in net quantities of proved developed and undeveloped oil, NGLs, and natural gas reserves were as follows: 2013 Proved Developed and Undeveloped Reserves: Oil Bbls NGLs Bbls (In thousands) Natural Gas Mcf Beginning of Year... 21,998 35, ,647 Revision of Previous Estimates... (2,113) 836 2,421 Extensions and Discoveries... 4,678 7,273 68,611 Infill Reserves in Existing Proved Fields... 2,299 1,945 21,573 Purchases of Minerals in Place Production... (3,360) (3,914) (56,757) Sales... (1,737) (101) (9,722) End of Year... 21,765 41, ,784 Proved Developed Reserves: Beginning of Year... 16,441 25, ,844 End of Year... 15,594 30, ,234 Proved Undeveloped Reserves: 2012 Beginning of Year... 5,557 9, ,803 End of Year... 6,171 10, ,550 Proved Developed and Undeveloped Reserves: Beginning of Year... 20,255 22, ,135 Revision of Previous Estimates (1)... (1,747) (2,682) (55,110) Extensions and Discoveries... 5,014 4,819 54,761 Infill Reserves in Existing Proved Fields... 4,196 3,018 25,057 Purchases of Minerals in Place... 2,830 11, ,494 Production... (3,279) (2,796) (48,930) Sales... (5,271) (378) (3,760) End of Year... 21,998 35, ,647 Proved Developed Reserves: Beginning of Year... 15,618 16, ,311 End of Year... 16,441 25, ,844 Proved Undeveloped Reserves: 2011 Beginning of Year... 4,637 5,438 69,824 End of Year... 5,557 9, ,803 Proved Developed and Undeveloped Reserves: Beginning of Year... 17,494 16, ,486 Revision of Previous Estimates (1) ,112 (30,510) Extensions and Discoveries... 3,477 3,924 39,836 Infill Reserves in Existing Proved Fields... 1,229 1,780 15,592 Purchases of Minerals in Place ,835 Production... (2,511) (2,239) (44,104) Sales... End of Year... 20,255 22, ,135 Proved Developed Reserves: Beginning of Year... 12,773 12, ,928 End of Year... 15,618 16, ,311 Proved Undeveloped Reserves: Beginning of Year... 4,721 4,029 73,558 End of Year... 4,637 5,438 69,824 (1) Natural gas revisions of previous estimates decreased primarily due to a decline in natural gas prices. 107
124 Estimates of oil, NGLs, and natural gas reserves require extensive judgments of reservoir engineering data. Assigning monetary values to such estimates does not reduce the subjectivity and changing nature of such reserve estimates. Indeed the uncertainties inherent in the disclosure are compounded by applying additional estimates of the rates and timing of production and the costs that will be incurred in developing and producing the reserves. The information set forth in this report is, therefore, subjective and, since judgments are involved, may not be comparable to estimates submitted by other oil and natural gas producers. In addition, since prices and costs do not remain static, and no price or cost escalations or de-escalations have been considered, the results are not necessarily indicative of the estimated fair market value of estimated proved reserves, nor of estimated future cash flows. The standardized measure of discounted future net cash flows (SMOG) was calculated using 12-month average prices and year-end costs and statutory tax rates, adjusted for permanent differences that relate to existing proved oil, NGLs, and natural gas reserves. SMOG as of December 31 is as follows: (In thousands) Future cash flows... $ 5,573,119 $ 4,522,351 $ 4,583,629 Future production costs... (1,734,985) (1,405,773) (1,277,856) Future development costs... (571,170) (431,673) (340,992) Future income tax expenses... (1,044,608) (762,519) (952,736) Future net cash flows... 2,222,356 1,922,386 2,012,045 10% annual discount for estimated timing of cash flows... (996,380) (842,430) (924,136) Standardized measure of discounted future net cash flows relating to proved oil, NGLs, and natural gas reserves... $ 1,225,976 $ 1,079,956 $ 1,087,909 The principal sources of changes in the standardized measure of discounted future net cash flows were as follows: (In thousands) Sales and transfers of oil and natural gas produced, net of production costs.. $ (470,970) $ (425,626) $ (389,339) Net changes in prices and production costs ,826 (321,099) 115,852 Revisions in quantity estimates and changes in production timing... (10,650) (148,648) (38,336) Extensions, discoveries and improved recovery, less related costs , , ,134 Changes in estimated future development costs... 26,629 51,587 37,742 Previously estimated cost incurred during the period... 96, ,377 45,327 Purchases of minerals in place ,774 58,567 Sales of minerals in place... (43,435) (112,359) (29) Accretion of discount , , ,492 Net change in income taxes... (170,091) 94,678 (60,675) Other net... (44,711) (124,537) (65,912) Net change ,020 (7,953) 232,823 Beginning of year... 1,079,956 1,087, ,086 End of year... $ 1,225,976 $ 1,079,956 $ 1,087,909 Certain information concerning the assumptions used in computing SMOG and their inherent limitations are discussed below. We believe this information is essential for a proper understanding and assessment of the data presented. The assumptions used to compute SMOG do not necessarily reflect our expectations of actual revenues to be derived from those reserves nor their present worth. Assigning monetary values to the reserve quantity estimation process does not reduce the subjective and ever-changing nature of reserve estimates. Additional subjectivity occurs when determining present values because the rate of producing the reserves must be estimated. In addition to difficulty inherent in predicting the future, variations from the expected production rate could result from factors outside of our control, such as unintentional delays in 108
125 development, environmental concerns or changes in prices or regulatory controls. Also, the reserve valuation assumes that all reserves will be disposed of by production. However, other factors such as the sale of reserves in place could affect the amount of cash eventually realized. The December 31, 2013, future cash flows were computed by applying the unescalated 12-month average prices of $96.94 per barrel for oil, $41.03 per barrel for NGLs, and $3.67 per Mcf for natural gas, then adjusted for price differentials, relating to proved reserves and to the year-end quantities of those reserves. Future price changes are considered only to the extent provided by contractual arrangements in existence at year-end. Future production and development costs are computed by estimating the expenditures to be incurred in developing and producing the proved oil, NGLs, and natural gas reserves at the end of the year, based on continuation of existing economic conditions. Future income tax expenses are computed by applying the appropriate year-end statutory tax rates to the future pretax net cash flows relating to proved oil, NGLs, and natural gas reserves less the tax basis of our properties. The future income tax expenses also give effect to permanent differences and tax credits and allowances relating to our proved oil, NGLs, and natural gas reserves. Care should be exercised in the use and interpretation of the above data. As production occurs over the next several years, the results shown may be significantly different as changes in production performance, petroleum prices and costs are likely to occur. Item 9. Changes in and Disagreements with Accountants on Accounting and Financial Disclosure None. Item 9A. Controls and Procedures (a) Evaluation of Disclosure Controls and Procedures The company maintains disclosure controls and procedures, as that term is defined in Rule 13a-15(e) and Rule 15d-15 (e) under the Securities Exchange Act of 1934 (the Exchange Act), that are designed to ensure that information required to be disclosed in reports the company files or submits under the Exchange Act is recorded, processed, summarized, and reported within the time periods specified in SEC rules and forms, and that such information is collected and communicated to management, including our Chief Executive Officer and Chief Financial Officer, as appropriate, to allow timely decisions regarding required disclosure. In designing and evaluating its disclosure controls and procedures, our management recognized that no matter how well conceived and operated, disclosure controls and procedures can provide only reasonable, not absolute, assurance that the objectives of the disclosure controls and procedures are met. Our disclosure controls and procedures have been designed to meet, and our management believes that they meet, reasonable assurance standards. Based on their evaluation as of the end of the period covered by this Annual Report on Form 10-K, our Chief Executive Officer and Chief Financial Officer have concluded that, subject to the limitations noted above, the company s disclosure controls and procedures were effective. (b) Management s Report on Internal Control Over Financial Reporting Our management is responsible for establishing and maintaining adequate internal control over financial reporting, as defined in Exchange Act Rule 13a-15(f). Our management, including our Chief Executive Officer and Chief Financial Officer, conducted an evaluation of the effectiveness of our internal control over financial reporting based on the Internal Control Integrated Framework (1992) issued by the Committee of Sponsoring Organizations of the Treadway Commission. Based on the results of this evaluation, our management concluded that our internal control over financial reporting was effective as of December 31, The effectiveness of the company s internal control over financial reporting as of December 31, 2013, has been audited by PricewaterhouseCoopers LLP, an independent registered public accounting firm, as stated in their report which appears herein. 109
126 (c) Changes in Internal Control Over Financial Reporting During the last quarter, there were no changes in our internal control over financial reporting that have materially affected, or are reasonably likely to materially affect, our internal control over financial reporting. Item 9B. Other Information None. PART III Item 10. Directors, Executive Officers, and Corporate Governance In accordance with Instruction G(3) of Form 10-K, the information required by this item is incorporated in this report by reference to the Proxy Statement, except for the information regarding our executive officers which is presented below. The Proxy Statement will be filed before our annual shareholders meeting scheduled to be held on May 7, Our Code of Ethics and Business Conduct applies to all directors, officers, and employees, including our Chief Executive Officer, our Chief Financial Officer, and our Controller. You can find our Code of Ethics and Business Conduct on our internet website, We will post any amendments to the Code of Ethics and Business Conduct, and any waivers that are required to be disclosed by the rules of either the SEC or the NYSE, on our internet website. Because our common stock is listed on the NYSE, our Chief Executive Officer was required to make, and he has made, an annual certification to the NYSE stating that he was not aware of any violation of our corporate governance listing standards of the NYSE. Our Chief Executive Officer made his annual certification to that effect to the NYSE as of May 8, In addition, we have filed, as exhibits to this Annual Report on Form 10-K, the certifications of our Chief Executive Officer and Chief Financial Officer required under Section 302 of the Sarbanes-Oxley Act of 2002 to be filed with the SEC regarding the quality of our public disclosure. Executive Officers The table below and accompanying text sets forth certain information as of February 14, 2014 concerning each of our executive officers as well as certain officers of our subsidiaries. There were no arrangements or understandings between any of the officers and any other person(s) under which the officers were elected. NAME AGE POSITION HELD Larry D. Pinkston.. 59 Chief Executive Officer since April 1, 2005, Director since January 15, 2004, President since August 1, 2003, Chief Operating Officer since February 24, 2004, Vice President and Chief Financial Officer from May 1989 to February 24, 2004 Mark E. Schell Senior Vice President since December 2002, General Counsel and Corporate Secretary since January 1987 David T. Merrill Senior Vice President since May 2, 2012, Chief Financial Officer and Treasurer since February 24, 2004, Vice President of Finance from August 2003 to February 24, 2004 Brad J. Guidry Executive Vice President, Unit Petroleum Company since March 1, 2005 John Cromling Executive Vice President, Unit Drilling Company since April 15, 2005 Robert Parks Manager and President, Superior Pipeline Company, L.L.C. since June 1996 Mr. Pinkston joined the company in December He had served as Corporate Budget Director and Assistant Controller before being appointed Controller in February, In December, 1986 he was elected Treasurer of the company and was elected to the position of Vice President and Chief Financial Officer in May, In August, 2003, he was elected to the position of President. He was elected a director of the company by the Board in January, In February, 2004, in addition to his position as President, he was elected to the office of Chief Operating Officer. In April 2005, he also began serving as Chief Executive Officer. Mr. Pinkston holds the offices of President, Chief Executive Officer, and Chief Operating Officer. He holds a Bachelor of Science Degree in Accounting from East Central University of Oklahoma. 110
127 Mr. Schell joined the company in January 1987, as its Secretary and General Counsel. In 2003, he was promoted to Senior Vice President. From 1979 until joining Unit Corporation, Mr. Schell was Counsel, Vice President, and a member of the Board of Directors of C & S Exploration Inc. He received a Bachelor of Science degree in Political Science from Arizona State University and his Juris Doctorate degree from the University of Tulsa College of Law. He is a member of the Oklahoma Bar Association as well as the Association of Corporate Counsel. Mr. Schell is a director of the Oklahoma Independent Petroleum Association and is Chairman of its legal committee. In addition, he is the President and a director of the Oklahoma Injury Benefit Coalition, an Oklahoma non-profit association advocating for alternatives to Oklahoma's current Workers' Compensation system. He is also a member of the State Chamber of Oklahoma board of directors and serves on the board of advisors for the Greater Oklahoma City Chamber. Mr. Merrill joined the company in August 2003 and served as its Vice President of Finance until February 2004 when he was elected to the position of Chief Financial Officer and Treasurer. In May 2012, he was promoted to Senior Vice President. From May 1999 through August 2003, Mr. Merrill served as Senior Vice President, Finance with TV Guide Networks, Inc. From July 1996 through May 1999 he was a Senior Manager with Deloitte & Touche LLP. From July 1994 through July 1996 he was Director of Financial Reporting and Special Projects for MAPCO, Inc. He began his career as an auditor with Deloitte, Haskins & Sells in Mr. Merrill received a Bachelor of Business Administration Degree in Accounting from the University of Oklahoma and is a Certified Public Accountant. Mr. Guidry joined Unit Petroleum Company in August 1988 as a Staff Geologist. In 1991, he was promoted to Geologic Manager overseeing the Geologic Operations of the company. In January 2003, he was promoted to Vice President of the West division. In March 2005, Mr. Guidry was promoted to Senior Vice President of Exploration for Unit Petroleum Company. From 1979 to 1988, he was employed as a Division Geologist for Reading and Bates Petroleum Co. From 1978 to 1979, he worked with ANR Resources in Houston. He began his career as an open hole well logging engineer with Dresser Atlas Oilfield Services. Mr. Guidry graduated from Louisiana State University with a Bachelor of Science degree in Geology. Mr. Cromling joined Unit Drilling Company in 1997 as a Vice-President and Division Manager. In April 2005, he was promoted to the position of Executive Vice-President of Drilling for Unit Drilling Company. In 1980, he formed Cromling Drilling Company which managed and operated drilling rigs until From 1987 to 1997, Cromling Drilling Company provided engineering consulting services and generated and drilled oil and natural gas prospects. Prior to this, he was employed by Big Chief Drilling for 11 years and served as Vice-President. Mr. Cromling graduated from the University of Oklahoma with a degree in Petroleum Engineering. Mr. Parks founded Superior Pipeline Company, L.L.C. in When Superior was acquired by the company in July 2004, he continued with Superior as one of its managers and as its President. From April 1992 through April 1996 Mr. Parks served as Vice-President Gathering and Processing for Cimarron Gas Companies. From December 1986 through March 1992, he served as Vice-President Business Development for American Central Gas Companies. Mr. Parks began his career as an engineer with Cities Service Company in He received a Bachelor of Science degree in Chemical Engineering from Rice University and his M.B.A. from the University of Texas at Austin. Item 11. Executive Compensation In accordance with Instruction G(3) of Form 10-K, the information required by this Item is incorporated into this report by reference to the Proxy Statement (see Item 10 above). 111
128 Item 12. Security Ownership of Certain Beneficial Owners and Management and Related Stockholder Matters The following table provides information for all equity compensation plans as of the fiscal year ended December 31, 2013, under which our equity securities were authorized for issuance: Plan Category Number of Securities to be Issued Upon Exercise of Outstanding Options, Warrants and Rights (a) Weighted Average Exercise Price of Outstanding Options, Warrants and Rights (b) Number of Securities Remaining Available for Future Issuance Under Equity Compensation Plans (Excluding Securities Reflected in Column (a)) (c) Equity compensation plans approved by security holders (1) ,420 (2) $ ,604,390 (3) Equity compensation plans not approved by security holders... Total ,420 $ ,604,390 (1) Shares awarded under all above plans may be newly issued, from our treasury or acquired in the open market. (2) This number includes the following: 68,920 stock options outstanding under the company s Amended and Restated Stock Option Plan. 171,500 stock options outstanding under the Non-Employee Directors Stock Option Plan. (3) This number reflects the shares available for issuance under the Unit Corporation Stock and Incentive Compensation Plan Amended and Restated May 2, 2012 (the amended plan). The amended plan allows us to grant stock-based compensation to our employees and non-employee directors. The previous balance of 230,000 shares that were available for issuance under the Non-Employee Directors Stock Option Plan were transferred to the amended plan on May 2, No more than 2,000,000 of the shares available under the amended plan may be issued as incentive stock options and all of the shares available under this plan may be issued as restricted stock. In addition, shares related to grants that are forfeited, terminated, canceled, expire unexercised, or settled in such manner that all or some of the shares are not issued to a participant shall immediately become available for issuance. In accordance with Instruction G(3) of Form 10-K, the information required by this Item is incorporated into this report by reference to the Proxy Statement (see Item 10 above). Item 13. Certain Relationships and Related Transactions, and Director Independence In accordance with Instruction G(3) of Form 10-K, the information required by this Item is incorporated into this report by reference to the Proxy Statement (see Item 10 above). Item 14. Principal Accounting Fees and Services In accordance with Instruction G(3) of Form 10-K, the information required by this Item is incorporated into this report by reference to the Proxy Statement (see Item 10 above). 112
129 PART IV Item 15. Exhibits, Financial Statement Schedules (a) Financial Statements, Schedules and Exhibits: 1. Financial Statements: Included in Part II of this report: Report of Independent Registered Public Accounting Firm Consolidated Balance Sheets as of December 31, 2013 and 2012 Consolidated Statements of Income for the years ended December 31, 2013, 2012, and 2011 Consolidated Statements of Comprehensive Income for the Years Ended December 31, 2013, 2012, and 2011 Consolidated Statements of Changes in Shareholders Equity for the years ended December 31, 2011, 2012, and 2013 Consolidated Statements of Cash Flows for the years ended December 31, 2013, 2012, and 2011 Notes to Consolidated Financial Statements 2. Financial Statement Schedules: Included in Part IV of this report for the years ended December 31, 2013, 2012, and 2011: Schedule II Valuation and Qualifying Accounts and Reserves Other schedules are omitted because of the absence of conditions under which they are required or because the required information is included in the consolidated financial statements or notes thereto. 3. Exhibits: The exhibit numbers in the following list correspond to the numbers assigned such exhibits in the Exhibit Table of Item 601 of Regulation S-K. 3.1 Restated Certificate of Incorporation of Unit Corporation (filed as Exhibit 3.1 to Unit's Form 8-K, dated June 29, 2000, which is incorporated herein by reference) Certificate of Amendment of Amended and Restated Certificate of Incorporation of the Company (filed as Exhibit 3.1 to Unit s Form 8-K, dated May 9, 2006 which is incorporated herein by reference). 3.2 By-Laws of Unit Corporation as amended and restated May 7, 2008 (filed as Exhibit 3.2 to Unit s Form 8-K, dated May 8, 2008 which is incorporated herein by reference). 4.1 Form of Common Stock Certificate (filed as Exhibit 4.1 to Unit s Form S-3 (File No ), which is incorporated herein by reference). 4.2 Rights Agreement as amended and restated on May 18, 2005 (filed as Exhibit 4.1 to Unit s Form 8-K dated May 18, 2005, which is incorporated herein by reference). 4.3 Amendment to Rights Agreement dated March 24, 2009 (filed as Exhibit 4.1 to Unit s Form 8-K dated March 23, 2009, which is incorporated herein by reference). 4.4 Standstill Agreement dated March 24, 2009, by and between us and the George Kaiser Foundation (filed as Exhibit 4.2 to Unit s Form 8-K dated March 23, 2009, which is incorporated herein by reference). 4.5 Indenture dated as of May 18, 2011, by and between the Company and Wilmington Trust FSB, as trustee (filed as Exhibit 4.1 to Unit s Form 8-K dated May 18, 2011, which is incorporated herein by reference). 4.6 First Supplemental Indenture (including form of note) dated as of May 18, 2011, by and among the Company, as issuer, the Subsidiary Guarantors (as defined therein), as guarantors and Wilmington Trust FSB as trustee (filed as Exhibit 4.1 to Unit s Form 8-K dated May 18, 2011, which is incorporated herein by reference). 113
130 4.7 Registration Rights Agreement dated July 24, 2012, among Unit Corporation, certain of its wholly-owned subsidiaries party thereto, as guarantors, and Merrill Lynch, Pierce, Fenner & Smith Incorporated, as the representative of the several initial purchasers (filed as Exhibit 4.3 to Unit s Form 8-K dated July 24, 2012, which is incorporated herein by reference) Third Amended and Restated Security Agreement effective November 1, 2005 (filed as Exhibit 10.2 to Unit s Form 8-K dated November 4, 2005, which is incorporated herein by reference) * Form of Unit Corporation Restricted Stock Bonus Agreement (filed as Exhibit 10.1 to Unit s Form 8-K dated December 13, 2005, which is incorporated herein by reference) * Unit Corporation Stock and Incentive Compensation Plan Amended and Restated May 2, 2012 (filed as Exhibit 10 to Unit s Form 8-K dated May 2, 2012, which is incorporated herein by reference) Amended and Restated Key Employee Change of Control Contract dated August 19, 2008 (filed as Exhibit 10.1 to Unit s Form 8-K dated August 25, 2008, which is incorporated herein by reference) Senior Credit Agreement dated September 13, 2011 by and among the Company and the subsidiaries named therein (as borrowers), BOKF, NA DBA Bank of Oklahoma, as Administrative Agent, and the institutions named therein (as lenders) (filed as Exhibit 10.1 to Unit s Form 8-K dated September 13, 2011, which is incorporated herein by reference) Gas Purchase Agreement dated November 21, 2011 by and between Superior Pipeline Company, L.L.C. and Sullivan and Company, L.L.C. (filed as Exhibit 10.1 to Unit s Form 8-K dated November 21, 2011, which is incorporated herein by reference) First Amendment and Consent, dated September 5, 2012, to the Senior Credit Agreement by and among the Company and the subsidiaries named therein (as borrowers), BOKF, NA DBA Bank of Oklahoma, as Administrative Agent, and the institutions named therein (as lenders) (filed as exhibit 10.1 to Unit's Form 8-K dated September 5, 2012, which is incorporated herein by reference) Unit 1979 Oil and Gas Program Agreement of Limited Partnership (filed as Exhibit I to Unit Drilling and Exploration Company s Registration Statement on Form S-1 as S.E.C. File No , which is incorporated herein by reference) Unit 1984 Oil and Gas Program Agreement of Limited Partnership (filed as an Exhibit 3.1 to Unit 1984 Oil and Gas Program s Registration Statement Form S-1 as S.E.C. File No , which is incorporated herein by reference) * Unit s Amended and Restated Stock Option Plan (filed as an Exhibit to Unit s Registration Statement on Form S-8 as S.E.C. File No s , , and which is incorporated herein by reference) * Unit Corporation Non-Employee Directors Stock Option Plan (filed as an Exhibit to Form S-8 as S.E.C. File No and File No , which are incorporated herein by reference) * Unit Corporation Employees Thrift Plan (filed as an Exhibit to Form S-8 as S.E.C. File No , which is incorporated herein by reference) Unit Consolidated Employee Oil and Gas Limited Partnership Agreement (filed as an Exhibit to Unit s Annual Report under cover of Form 10-K for the year ended December 31, 1993, which is incorporated herein by reference) * Unit Corporation Salary Deferral Plan (filed as an Exhibit to Unit s Annual Report under cover of Form 10-K for the year ended December 31, 1993, which is incorporated herein by reference) * Unit Corporation Separation Benefit Plan for Senior Management as amended (filed as an Exhibit 10.1 to Unit s Form 8-K dated December 20, 2004) * Unit Corporation Special Separation Benefit Plan as amended (filed as Exhibit 10.3 to Unit s Form 8-K dated December 20, 2004) Unit 2000 Employee Oil and Gas Limited Partnership Agreement of Limited Partnership (filed as an Exhibit to Unit s Annual Report under the cover of Form 10-K for the year ended December 31, 1999) * Unit Corporation 2000 Non-Employee Directors Stock Option Plan (filed as an Exhibit to Form S-8 as S.E.C. File No , which is incorporated herein by reference). 114
131 Unit 2001 Employee Oil and Gas Limited Partnership Agreement of Limited Partnership (filed as an Exhibit to Unit s Annual Report under the cover of Form 10-K for the year ended December 31, 2000) Unit 2002 Employee Oil and Gas Limited Partnership Agreement of Limited Partnership (filed as an Exhibit to Unit s Annual Report under cover of Form 10-K for the year ended December 31, 2001) Unit 2003 Employee Oil and Gas Limited Partnership Agreement of Limited Partnership (filed as an Exhibit to Unit s Annual Report under cover of Form 10-K for the year ended December 31, 2002) Unit 2004 Employee Oil and Gas Limited Partnership Agreement of Limited Partnership (filed as an Exhibit to Unit s Annual Report under cover of Form 10-K for the year ended December 31, 2003) Unit 2005 Employee Oil and Gas Limited Partnership Agreement of Limited Partnership (filed as an Exhibit to Unit s Annual Report under cover of Form 10-K for the year ended December 31, 2004) * Form of Indemnification Agreement entered into between the Company and its executive officers and directors (filed as Exhibit 10.1 to Unit s Form 8-K dated February 22, 2005, which is incorporated herein by reference) Unit 2006 Employee Oil and Gas Limited Partnership Agreement of Limited Partnership (filed as an Exhibit to Unit s Annual Report under cover of Form 10-K for the year ended December 31, 2005) Unit 2007 Employee Oil and Gas Limited Partnership Agreement of Limited Partnership (filed as an Exhibit to Unit s Annual Report under cover of Form 10-K for the year ended December 31, 2006) * Separation Benefit Plan as amended August 21, 2007 (filed as an Exhibit to Unit s Form 10-Q for the quarter ended September 30, 2007) Unit 2008 Employee Oil and Gas Limited Partnership Agreement of Limited Partnership (filed as an Exhibit to Unit s Annual Report under cover of Form 10-K for the year ended December 31, 2007) * Annual Bonus Performance Plan entered into October 21, 2008 (filed as Exhibit 10.1 to Unit s Form 8-K dated October 23, 2008, which is incorporated herein by reference) * Separation Benefit Plan as amended October 21, 2008 (filed as Exhibit 10.2 to Unit s Form 8-K dated October 23, 2008, which is incorporated herein by reference) * Separation Benefit Plan as amended December 31, 2008 (filed as Exhibit 10.1 to Unit s Form 8-K dated January 6, 2009, which is incorporated herein by reference) * Special Separation Benefit Plan as amended December 31, 2008 (filed as Exhibit 10.2 to Unit s Form 8-K dated January 6, 2009, which is incorporated herein by reference) * Separation Benefit Plan for Senior Management as amended December 31, 2008 (filed as Exhibit 10.3 to Unit s Form 8-K dated January 6, 2009, which is incorporated herein by reference) Unit 2009 Employee Oil and Gas Limited Partnership Agreement of Limited Partnership (filed as an Exhibit to Unit s Annual Report under cover of Form 10-K for the year ended December 31, 2008) * Unit Corporation 2000 Non-Employee Directors Stock Option Plan as Amended and Restated August 25, 2004 (as amended on May 29, 2009 and filed as Exhibit 10.1 to Unit s Form 8-K dated May 29, 2009, which is incorporated herein by reference) Unit 2010 Employee Oil and Gas Limited Partnership Agreement of Limited Partnership (filed as an Exhibit to Unit s Annual Report under cover of Form 10-K for the year ended December 31, 2009) Unit 2011 Employee Oil and Gas Limited Partnership Agreement of Limited Partnership (filed as an Exhibit to Unit s Annual Report under cover of Form 10-K for the year ended December 31, 2010). 21 Subsidiaries of the Registrant (filed herein) Consent of Independent Registered Public Accounting Firm, PricewaterhouseCoopers LLP (filed herein) Consent of Ryder Scott Company, L.P. (filed herein) Certification of Chief Executive Officer under Rule 13a - 14(a) of the Exchange Act (filed herein) Certification of Chief Financial Officer under Rule 13a - 14(a) of the Exchange Act (filed herein). 115
132 32 Certification of Chief Executive Officer and Chief Financial Officer under Rule 13a-14(a) of the Exchange Act and 18 U.S.C. Section 1350, as adopted under Section 906 of the Sarbanes-Oxley Act of 2002 (filed herein) Ryder Scott Company, L.P. Summary Report (filed herein). 101.INS 101.SCH 101.CAL 101.DEF 101.LAB 101.PRE XBRL Instance Document. XBRL Taxonomy Extension Schema Document. XBRL Taxonomy Extension Calculation Linkbase Document. XBRL Taxonomy Extension Definition Linkbase Document. XBRL Taxonomy Extension Labels Linkbase Document. XBRL Taxonomy Extension Presentation Linkbase Document. * Indicates a management contract or compensatory plan identified under the requirements of Item 15 of Form 10-K. 116
133 Schedule II UNIT CORPORATION AND SUBSIDIARIES VALUATION AND QUALIFYING ACCOUNTS AND RESERVES Allowance for Doubtful Accounts: Description Balance at Beginning of Period Additions Charged to Costs & Expenses (In thousands) Deductions & Net Write-Offs Balance at End of Period Year ended December 31, $ 5,343 $ $ (1) $ 5,342 Year ended December 31, $ 5,343 $ 90 $ (90) $ 5,343 Year ended December 31, $ 5,083 $ 260 $ $ 5,
134 SIGNATURES Pursuant to the requirements of Section 13 or 15(d) of the Securities Exchange Act of 1934, the Registrant has duly caused this report to be signed on its behalf by the undersigned, thereunto duly authorized. UNIT CORPORATION DATE: February 25, 2014 By: /s/ LARRY D. PINKSTON LARRY D. PINKSTON President and Chief Executive Officer (Principal Executive Officer) Pursuant to the requirements of the Securities Exchange Act of 1934, this report has been signed below by the following persons on behalf of the Registrant and in the capacities indicated on the 25th day of February, Name Title /s/ JOHN G. NIKKEL John G. Nikkel Chairman of the Board and Director /s/ LARRY D. PINKSTON President and Chief Executive Officer, Chief Operating Officer and Director Larry D. Pinkston (Principal Executive Officer) /s/ DAVID T. MERRILL David T. Merrill /s/ DON A. HAYES Don A. Hayes /s/ J. MICHAEL ADCOCK J. Michael Adcock /s/ GARY CHRISTOPHER Gary Christopher Senior Vice President, Chief Financial Officer and Treasurer (Principal Financial Officer) Vice President, Controller (Principal Accounting Officer) Director Director /s/ STEVEN B. HILDEBRAND Director Steven B. Hildebrand /s/ WILLIAM B. MORGAN William B. Morgan /s/ LARRY C. PAYNE Larry C. Payne /s/ G. BAILEY PEYTON IV G. Bailey Peyton IV /s/ ROBERT SULLIVAN, JR. Robert Sullivan, Jr. Director Director Director Director 118
135 EXHIBIT INDEX Exhibit No. Description 21 Subsidiaries of the Registrant Consent of Independent Registered Public Accounting Firm, PricewaterhouseCoopers LLP Consent of Ryder Scott Company, L.P Certification of Chief Executive Officer under Rule 13a 14(a) of the Exchange Act Certification of Chief Financial Officer under Rule 13a 14(a) of the Exchange Act. 32 Certification of Chief Executive Officer and Chief Financial Officer under Rule 13a-14(a) of the Exchange Act and 18 U.S.C. Section 1350, as adopted under Section 906 of the Sarbanes-Oxley Act of Ryder Scott Company, L.P. Summary Report. 101.INS XBRL Instance Document. 101.SCH XBRL Taxonomy Extension Schema Document. 101.CAL XBRL Taxonomy Extension Calculation Linkbase Document. 101.DEF XBRL Taxonomy Extension Definition Linkbase Document. 101.LAB XBRL Taxonomy Extension Labels Linkbase Document. 101.PRE XBRL Taxonomy Extension Presentation Linkbase Document. 119


136 Corporate Information Board of Directors John G. Nikkel Chairman of the Board J. Michael Adcock Chairman of the Board of Arvest Bank, Shawnee and Trustee, Don Bodard Trust Shawnee, Oklahoma Gary R. Christopher Investments Tulsa, Oklahoma Steven B. Hildebrand Investments Tulsa, Oklahoma William B. Morgan Investments Chandler, Arizona Larry C. Payne President and CEO of LESA and Associates, LLC Tulsa, Oklahoma G. Bailey Peyton IV President, Peyton Holdings Canadian, Texas Larry D. Pinkston Chief Executive Officer and President Robert J. Sullivan, Jr. Manager of Sullivan and Company LLC Tulsa, Oklahoma Director Emeritus King P. Kirchner Co-founder, Unit Corporation Tulsa, Oklahoma Management John G. Nikkel Chairman of the Board Larry D. Pinkston President and Chief Executive Officer Mark E. Schell Senior Vice President, General Counsel, and Secretary David T. Merrill Senior Vice President, Chief Financial Officer, and Treasurer Compensation Committee J. Michael Adcock Chairman William B. Morgan Steven B. Hildebrand Gary R. Christopher Nominating & Governance Committee William B. Morgan Chairman J. Michael Adcock Larry C. Payne Robert J. Sullivan Jr. Audit Committee Steven B. Hildebrand Chairman Gary R. Christopher William B. Morgan J. Michael Adcock Larry C. Payne Transfer Agent & Registrar Communications concerning the transfer of shares, lost certificates and changes of address should be directed to: American Stock Transfer & Trust Co. 59 Maiden Lane, Plaza Level New York, NY amstock.com Stock Listing Our common stock trades on the New York Stock Exchange under the symbol: UNT. During 2013, our average daily trading volume on the NYSE was 228,000 shares. Approximately 49.1 million shares were outstanding at the end of Annual Meeting of Shareholders May 7, 2014, 11:00 a.m. Central Time Tulsa Room, Bank of Oklahoma Tower, 9th floor, Tulsa, Oklahoma Shareholder Profile We had 1,030 shareholders of record at year-end Investor Relations The Form 10-Q reports are available in May, August, and November. The Form 10-K and Form 10-Q are available for viewing on our web site at Copies of the Forms 10-K, 10-Q, and Annual Report, filed with the Securities and Exchange Commission, are available without charge on written request to: Investor Relations Department 7130 South Lewis Avenue, Suite 1000 Tulsa, Oklahoma Independent Registered Public Accounting Firm PricewaterhouseCoopers LLP Tulsa, Oklahoma Independent Petroleum Engineers Ryder Scott Company, L.P. Houston, Texas
Capital One Securities, Inc. Energy Conference. December 11, 2013
 Capital One Securities, Inc. Energy Conference December 11, 2013 Forward-Looking Statement This presentation contains forward-looking statements within the meaning of Section 27A of the Securities Act
Cowen and Company Ultimate Energy Conference. December 3, 2013
 Cowen and Company Ultimate Energy Conference December 3, 2013 Overview of Operations 16 Bakken ü Tulsa based diversified energy company incorporated in 1963 ü Integrated approach to business allows Unit
EnerCom s London Oil & Gas Conference. June 11, 2013
 EnerCom s London Oil & Gas Conference June 11, 2013 Overview of Operations 16 Bakken Tulsa based diversified energy company incorporated in 1963 Integrated approach to business allows Unit to balance its
EnerCom s The Oil & Services Conference. February 20, 2013
 EnerCom s The Oil & Services Conference February 20, 2013 Overview of Operations 16 Bakken Tulsa based diversified energy company incorporated in 1963 Integrated approach to business allows Unit to balance
2017 Annual Report. A Diversified Energy Company
 2017 Annual Report A Diversified Energy Company Corporate Profile Unit Corporation is a diversified energy company engaged through its subsidiaries in the exploration for and production of oil and natural
FORM 10-K. UNIT CORPORATION (Exact name of registrant as specified in its charter)
") UNITED STATES SECURITIES AND EXCHANGE COMMISSION WASHINGTON, D.C. 20549 FORM 10-K ANNUAL REPORT PURSUANT TO SECTION 13 OR 15(d) OF THE SECURITIES EXCHANGE ACT OF 1934 For the fiscal year ended December
UNITED STATES SECURITIES AND EXCHANGE COMMISSION WASHINGTON, D.C. 20549 FORM 10-K ANNUAL REPORT PURSUANT TO SECTION 13 OR 15(d) OF THE SECURITIES EXCHANGE ACT OF 1934 For the fiscal year ended December
EnerCom s The Oil & Gas Conference. August 15, 2012
 EnerCom s The Oil & Gas Conference August 15, 2012 Overview of Operations 16 Bakken Tulsa based company founded in 1963 with long history of operations in the Mid-Continent Integrated approach to business
Dahlman Rose Ultimate Oil Service Conference
 Dahlman Rose Ultimate Oil Service Conference December 3, 2012 Overview of Operations 16 Bakken Tulsa based company founded in 1963 with long history of operations in the Mid-Continent Integrated approach
Acquisition of Oil & Gas Properties in Mid-Continent
 Acquisition of Oil & Gas Properties in Mid-Continent July 11, 2012 Significant Overlap in Core Operating Area Pro forma Acreage Position in Core Mid-Continent Area Material acreage overlap with existing
Dahlman Rose Oil Service and Drilling Conference. Wednesday, November 30, :50 a.m.
 Dahlman Rose Oil Service and Drilling Conference Wednesday, November 30, 2011 10:50 a.m. Overview of Operations Tulsa based company founded in 1963 with long history of operations in the Mid-Continent
Canaccord Genuity Global Energy Conference. Wednesday, October 12, :00 p.m.
 Canaccord Genuity Global Energy Conference Wednesday, October 12, 2011 3:00 p.m. Overview of Operations Tulsa based company founded in 1963 with long history of operations in the Mid-Continent Bakken 3%
NYSE: UNT. US Capital Advisors E&P Corporate Access Day January 12, 2017
 US Capital Advisors E&P Corporate Access Day January 12, 2017 Forward Looking Statement This presentation contains forward looking statements within the meaning of Section 27A of the Securities Act of
IPAA Oil & Gas Investment Symposium Presentation April 13, :35 p.m.
 IPAA Oil & Gas Investment Symposium Presentation April 13, 2011 1:35 p.m. Overview of Operations Tulsa based company founded in 1963 with long history of operations in the Mid-Continent Ticker: UNT / NYSE
U.S. Capital Advisors E&P Corporate Access January 21, 2015
 U.S. Capital Advisors E&P Corporate Access January 21, 2015 Forward Looking Statement This presentation contains forward-looking statements within the meaning of Section 27A of the Securities Act of 1933
IPAA Oil & Gas Investment Symposium April 20, 2015
 IPAA Oil & Gas Investment Symposium April 20, 2015 Forward Looking Statement This presentation contains forward-looking statements within the meaning of Section 27A of the Securities Act of 1933 and Section
Raymond James Boston Spring Investors Conference. June 6, 2017
 Raymond James Boston Spring Investors Conference June 6, 2017 Forward Looking Statement This presentation contains forward looking statements within the meaning of Section 27A of the Securities Act of
LAREDO PETROLEUM ANNOUNCES 2014 THIRD-QUARTER FINANCIAL AND OPERATING RESULTS
 15 West 6 th Street, Suite 900 Tulsa, Oklahoma 74119 (918) 513-4570 Fax: (918) 513-4571 www.laredopetro.com LAREDO PETROLEUM ANNOUNCES 2014 THIRD-QUARTER FINANCIAL AND OPERATING RESULTS TULSA, OK November
2007 ANNUAL REPORT TO SHAREHOLDERS
 TM RAM Energy Resources, Inc. Unlocking Value through Strategic Growth and Focused Execution 2007 ANNUAL REPORT TO SHAREHOLDERS RAM Energy Resources, Inc. is an independent oil and gas company engaged
SOUTHWESTERN ENERGY ANNOUNCES 2015 FINANCIAL AND OPERATING RESULTS
 NEWS RELEASE SOUTHWESTERN ENERGY ANNOUNCES 2015 FINANCIAL AND OPERATING RESULTS Houston, Texas February 25, 2016...Southwestern Energy Company (NYSE: SWN) today announced its financial and operating results
 UNITED STATES SECURITIES AND EXCHANGE COMMISSION Washington, D.C. 20549 FORM 10-K [X] Annual Report pursuant to Section 13 or 15(d) of the Securities Exchange Act of 1934 For the Fiscal Year Ended December
SOUTHWESTERN ENERGY ANNOUNCES 2017 OPERATIONAL AND FINANCIAL RESULTS
 NEWS RELEASE SOUTHWESTERN ENERGY ANNOUNCES 2017 OPERATIONAL AND FINANCIAL RESULTS Houston, Texas March 1, 2018...Southwestern Energy Company (NYSE: SWN) today announced its financial and operating results
Sustaining Value. Protecting Core Assets and Focusing on Opportunities 2008 ANNUAL REPORT TO SHAREHOLDERS
 Sustaining Value Protecting Core Assets and Focusing on Opportunities 2008 ANNUAL REPORT TO SHAREHOLDERS RAM Energy Resources, Inc. is an independent oil and gas company engaged in the acquisition, exploration,
PARSLEY ENERGY, INC. (Exact name of registrant as specified in its charter)
") UNITED STATES SECURITIES AND EXCHANGE COMMISSION Washington, D.C. 20549 FORM 10-Q (Mark One) x QUARTERLY REPORT PURSUANT TO SECTION 13 OR 15(d) OF THE SECURITIES EXCHANGE ACT OF 1934 For the quarterly
UNITED STATES SECURITIES AND EXCHANGE COMMISSION Washington, D.C. 20549 FORM 10-Q (Mark One) x QUARTERLY REPORT PURSUANT TO SECTION 13 OR 15(d) OF THE SECURITIES EXCHANGE ACT OF 1934 For the quarterly
Gulfport Energy Corporation Reports Fourth Quarter and Year-End 2010 Results
 March 14, 2011 Gulfport Energy Corporation Reports Fourth Quarter and Year-End 2010 Results OKLAHOMA CITY, March 14, 2011 (GLOBE NEWSWIRE) -- Gulfport Energy Corporation (Nasdaq:GPOR) today reported financial
acquire develop exploit explore
 2007 a n n u a l r e p o r t acquire develop exploit explore Erick Nelson, Operations Manager, and John Coffman, Drilling Superintendent, discuss drilling plans for the Houma State #4 well. core operating
LAREDO PETROLEUM ANNOUNCES 2014 FIRST-QUARTER FINANCIAL AND OPERATING RESULTS
 15 West 6 th Street, Suite, 900 Tulsa, Oklahoma 74119 (918) 513-4570 Fax: (918) 513-4571 www.laredopetro.com LAREDO PETROLEUM ANNOUNCES 2014 FIRST-QUARTER FINANCIAL AND OPERATING RESULTS TULSA, OK May
EV ENERGY PARTNERS, LP
 EV ENERGY PARTNERS, LP FORM 10-K (Annual Report) Filed 02/29/12 for the Period Ending 12/31/11 Address 1001 FANNIN SUITE 800 HOUSTON, TX 77002 Telephone 713-659-3500 CIK 0001361937 Symbol EVEP SIC Code
Callon Petroleum Company (Exact Name of Registrant as Specified in Its Charter)
") UNITED STATES SECURITIES AND EXCHANGE COMMISSION Washington, D.C. 20549 FORM 10-Q Quarterly Report Pursuant to Section 13 or 15(d) of the Securities Exchange Act of 1934 For The Quarterly Period Ended
UNITED STATES SECURITIES AND EXCHANGE COMMISSION Washington, D.C. 20549 FORM 10-Q Quarterly Report Pursuant to Section 13 or 15(d) of the Securities Exchange Act of 1934 For The Quarterly Period Ended
Raymond James Institutional Investors Conference March 8, 2016
 Raymond James Institutional Investors Conference March 8, 2016 Forward Looking Statement This presentation contains forward looking statements within the meaning of Section 27A of the Securities Act of
PARSLEY ENERGY, INC. (Exact name of registrant as specified in its charter)
") UNITED STATES SECURITIES AND EXCHANGE COMMISSION Washington, D.C. 20549 FORM 10-Q (Mark One) x QUARTERLY REPORT PURSUANT TO SECTION 13 OR 15(d) OF THE SECURITIES EXCHANGE ACT OF 1934 For the quarterly
UNITED STATES SECURITIES AND EXCHANGE COMMISSION Washington, D.C. 20549 FORM 10-Q (Mark One) x QUARTERLY REPORT PURSUANT TO SECTION 13 OR 15(d) OF THE SECURITIES EXCHANGE ACT OF 1934 For the quarterly
Cowen & Co. 5 th Annual Ultimate Energy Conference December 2, 2015
 Cowen & Co. 5 th Annual Ultimate Energy Conference December 2, 2015 Forward Looking Statement This presentation contains forward looking statements within the meaning of Section 27A of the Securities Act
SOUTHWESTERN ENERGY ANNOUNCES SECOND QUARTER 2012 FINANCIAL AND OPERATING RESULTS
 NEWS RELEASE SOUTHWESTERN ENERGY ANNOUNCES SECOND QUARTER 2012 FINANCIAL AND OPERATING RESULTS Houston, Texas August 2, 2012...Southwestern Energy Company (NYSE: SWN) today announced its financial and
FOR IMMEDIATE RELEASE PLEASE CONTACT: Michael C. Coffman Website: Dec. 12, 2016
 FOR IMMEDIATE RELEASE PLEASE CONTACT: Michael C. Coffman 405.948.1560 Website: www.panhandleoilandgas.com Dec. 12, 2016 PANHANDLE OIL AND GAS INC. REPORTS FOURTH QUARTER AND FISCAL 2016 FINANCIAL RESULTS
Centennial Resource Development Announces Full Year 2017 Results, 2017 Year-End Reserves, 2018 Guidance and Increases 2020 Oil Production Target
 Centennial Resource Development Announces Full Year 2017 Results, 2017 Year-End Reserves, 2018 Guidance and Increases 2020 Oil Production Target DENVER, CO, February 26, 2018 (GLOBE NEWSWIRE) - Centennial
Callon Petroleum Company (Exact Name of Registrant as Specified in Its Charter)
") UNITED STATES SECURITIES AND EXCHANGE COMMISSION Washington, D.C. 20549 FORM 10-Q Quarterly Report Pursuant to Section 13 or 15(d) of the Securities Exchange Act of 1934 For The Quarterly Period Ended
UNITED STATES SECURITIES AND EXCHANGE COMMISSION Washington, D.C. 20549 FORM 10-Q Quarterly Report Pursuant to Section 13 or 15(d) of the Securities Exchange Act of 1934 For The Quarterly Period Ended
QEP RESOURCES, INC. (Exact name of registrant as specified in its charter)
") UNITED STATES SECURITIES AND EXCHANGE COMMISSION Washington, D.C. 20549 FORM 10-K ý ANNUAL REPORT PURSUANT TO SECTION 13 OR 15(d) OF THE SECURITIES EXCHANGE ACT OF 1934 For the fiscal year ended December
UNITED STATES SECURITIES AND EXCHANGE COMMISSION Washington, D.C. 20549 FORM 10-K ý ANNUAL REPORT PURSUANT TO SECTION 13 OR 15(d) OF THE SECURITIES EXCHANGE ACT OF 1934 For the fiscal year ended December
CHESAPEAKE ENERGY CORPORATION REPORTS FINANCIAL AND OPERATIONAL RESULTS FOR THE 2010 THIRD QUARTER
 FOR IMMEDIATE RELEASE NOVEMBER 3, 2010 CHESAPEAKE ENERGY CORPORATION REPORTS FINANCIAL AND OPERATIONAL RESULTS FOR THE 2010 THIRD QUARTER Company Reports 2010 Third Quarter Net Income to Common Stockholders
UNITED STATES SECURITIES AND EXCHANGE COMMISSION Washington, D.C FORM 10-Q
 UNITED STATES SECURITIES AND EXCHANGE COMMISSION Washington, D.C. 20549 FORM 10-Q ( X ) Quarterly Report Pursuant to Section 13 or 15(d) of the Securities Exchange Act of 1934 For the period ended March
Antero Resources Reports First Quarter 2013 Results
 Antero Resources Reports First Quarter 2013 Results DENVER, May 13, 2013 /PRNewswire/ -- Highlights: Net daily production averaged 383 MMcfe/d, up 114% over first quarter 2012 production from continuing
Gulfport Energy Corporation Reports Fourth Quarter and Year-End 2012 Results
 February 26, 2013 Gulfport Energy Corporation Reports Fourth Quarter and Year-End 2012 Results OKLAHOMA CITY, Feb. 26, 2013 (GLOBE NEWSWIRE) -- Gulfport Energy Corporation (Nasdaq:GPOR) today reported
Unit Corporation Corporate Presentation. September 26, 2017
 Unit Corporation Corporate Presentation September 26, 2017 Forward Looking Statement This presentation contains forward looking statements within the meaning of Section 27A of the Securities Act of 1933
Antero Resources Reports Second Quarter 2013 Financial Results, Utica First Production and Well Rates
 Antero Resources Reports Second Quarter 2013 Financial Results, Utica First Production and Well Rates Highlights: Net daily production averaged 458 MMcfe/d, up 115% over second quarter 2012 production
Capital One Securities Annual Energy Conference. December 7, 2017
 Capital One Securities Annual Energy Conference December 7, 2017 Forward Looking Statement This presentation contains forward looking statements within the meaning of Section 27A of the Securities Act
SOUTHWESTERN ENERGY ANNOUNCES THIRD QUARTER 2013 FINANCIAL AND OPERATING RESULTS
 NEWS RELEASE SOUTHWESTERN ENERGY ANNOUNCES THIRD QUARTER 2013 FINANCIAL AND OPERATING RESULTS Houston, Texas October 31, 2013...Southwestern Energy Company (NYSE: SWN) today announced its financial and
Preserving Value. Executing on Our Plan to Preserve Asset Value in a Volatile Environment 2009 ANNUAL REPORT TO SHAREHOLDERS
 Preserving Value Executing on Our Plan to Preserve Asset Value in a Volatile Environment 2009 ANNUAL REPORT TO SHAREHOLDERS RAM Energy Resources, Inc. is an independent oil and gas company engaged in the
FOR IMMEDIATE RELEASE PLEASE CONTACT: Paul F. Blanchard Jr Website: Dec. 12, 2017
 FOR IMMEDIATE RELEASE PLEASE CONTACT: Paul F. Blanchard Jr. 405.948.1560 Website: www.panhandleoilandgas.com Dec. 12, 2017 PANHANDLE OIL AND GAS INC. REPORTS FOURTH QUARTER AND FISCAL 2017 RESULTS AND
Gulfport Energy Corporation Reports Fourth Quarter and Year-End 2017 Results
 February 21, 2018 Gulfport Energy Corporation Reports Fourth Quarter and Year-End 2017 Results OKLAHOMA CITY, Feb. 21, 2018 (GLOBE NEWSWIRE) -- Gulfport Energy Corporation (NASDAQ:GPOR) ( Gulfport or the
SOUTHWESTERN ENERGY COMPANY (Exact name of registrant as specified in its charter)
") UNITED STATES SECURITIES AND EXCHANGE COMMISSION Washington, D.C. 20549 FORM 8-K CURRENT REPORT Pursuant to Section 13 or 15(d) of the Securities Exchange Act of 1934 Date of report (Date of earliest event
UNITED STATES SECURITIES AND EXCHANGE COMMISSION Washington, D.C. 20549 FORM 8-K CURRENT REPORT Pursuant to Section 13 or 15(d) of the Securities Exchange Act of 1934 Date of report (Date of earliest event
Diamondback Energy, Inc. Announces Second Quarter 2018 Financial and Operating Results and Announces Accretive Acquisition
 Announces Second Quarter 2018 Financial and Operating Results and Announces Accretive Acquisition August 8, 2018 MIDLAND, Texas, Aug. 08, 2018 (GLOBE NEWSWIRE) -- (NASDAQ:FANG) ( Diamondback or the Company
LAREDO PETROLEUM 2013 ANNUAL REPORT
 LAREDO PETROLEUM 2013 ANNUAL REPORT Corporate Profile Laredo Petroleum is an independent energy company headquartered in Tulsa, Oklahoma. Laredo s business strategy is focused on the exploration, development
Antero Resources Reports Third Quarter 2013 Financial and Operational Results
 Antero Resources Reports Third Quarter 2013 Financial and Operational Results Highlights: Net daily production averaged 566 MMcfe/d, a 25% increase over second quarter 2013 and a 128% increase over third
DEVON ENERGY REPORTS FOURTH-QUARTER AND FULL-YEAR 2012 RESULTS
 Devon Energy Corporation 333 West Sheridan Avenue Oklahoma City, OK 73102-5015 News Release Investor Contacts Scott Coody Shea Snyder 405 552 4735 405 552 4782 Media Contact Chip Minty 405 228 8647 DEVON
UNITED STATES SECURITIES AND EXCHANGE COMMISSION Washington, D.C FORM 10-Q
 UNITED STATES SECURITIES AND EXCHANGE COMMISSION Washington, D.C. 20549 FORM 10-Q ( X ) Quarterly Report Pursuant to Section 13 or 15(d) of the Securities Exchange Act of 1934 For the period ended June
Midstates Petroleum to Acquire Mississippian Lime Properties in Oklahoma and Kansas
 NEWS RELEASE Midstates Petroleum to Acquire Mississippian Lime Properties in Oklahoma and Kansas Midstates Petroleum Reports Second Quarter 2012 Financial and Operating Results HOUSTON--(BUSINESS WIRE)--Aug.
HEADLINES SANDRIDGE ENERGY, INC. UPDATES SHAREHOLDERS ON OPERATIONS AND REPORTS FINANCIAL RESULTS FOR THIRD QUARTER AND FIRST NINE MONTHS OF 2015
 SANDRIDGE ENERGY, INC. UPDATES SHAREHOLDERS ON OPERATIONS AND REPORTS FINANCIAL RESULTS FOR THIRD QUARTER AND FIRST NINE MONTHS OF 2015 Oklahoma City, Oklahoma, November 4, 2015 SandRidge Energy, Inc.
LAREDO PETROLEUM ANNOUNCES RECORD PRODUCTION AND YEAR-END PROVED RESERVES IN 2012
 15 West 6 th Street, Suite, 1800 Tulsa, Oklahoma 74119 (918) 513-4570 Fax: (918) 513-4571 www.laredopetro.com LAREDO PETROLEUM ANNOUNCES RECORD PRODUCTION AND YEAR-END PROVED RESERVES IN 2012 TULSA, OK
Centennial Resource Development Announces Third Quarter 2018 Financial and Operational Results
 Centennial Resource Development Announces Third Quarter 2018 Financial and Operational Results DENVER, CO, November 5, 2018 (GLOBE NEWSWIRE) - Centennial Resource Development, Inc. ( Centennial or the
Antero Resources Reports Third Quarter 2013 Financial and Operational Results
 Antero Resources Reports Third Quarter 2013 Financial and Operational Results DENVER, Nov. 6, 2013 /PRNewswire/ -- (Logo: http://photos.prnewswire.com/prnh/20131101/la09101logo) Highlights: Net daily production
Laredo Petroleum Announces 29% Growth in Year-End Proved Reserve Estimates
 15 West 6 th Street, Suite 900 Tulsa, Oklahoma 74119 (918) 513-4570 Fax: (918) 513-4571 www.laredopetro.com Laredo Petroleum Announces 29% Growth in Year-End Proved Reserve Estimates 2018 Capital Budget
Callon Petroleum Company (Exact Name of Registrant as Specified in Its Charter)
") UNITED STATES SECURITIES AND EXCHANGE COMMISSION Washington, D.C. 20549 FORM 10-Q Quarterly Report Pursuant to Section 13 or 15(d) of the Securities Exchange Act of 1934 For The Quarterly Period Ended
UNITED STATES SECURITIES AND EXCHANGE COMMISSION Washington, D.C. 20549 FORM 10-Q Quarterly Report Pursuant to Section 13 or 15(d) of the Securities Exchange Act of 1934 For The Quarterly Period Ended
FORM 10-Q. COMSTOCK RESOURCES, INC. (Exact name of registrant as specified in its charter)
") UNITED STATES SECURITIES AND EXCHANGE COMMISSION Washington, D.C. 20549 FORM 10-Q (Mark One) QUARTERLY REPORT PURSUANT TO SECTION 13 OR 15(d) OF THE SECURITIES EXCHANGE ACT OF 1934 For The Quarter Ended
UNITED STATES SECURITIES AND EXCHANGE COMMISSION Washington, D.C. 20549 FORM 10-Q (Mark One) QUARTERLY REPORT PURSUANT TO SECTION 13 OR 15(d) OF THE SECURITIES EXCHANGE ACT OF 1934 For The Quarter Ended
Diamondback Energy, Inc.
 Management Travis Stice, President and CEO Teresa Dick, CFO Jeffrey White, VP Operations Michael Hollis, VP Drilling Randall Holder, VP & Gen Counsel www.diamondbackenergy.com EPG Commentary by Dan Steffens
Noble Energy Announces First Quarter 2018 Results
 Noble Energy Announces First Quarter 2018 Results May 1, 2018 HOUSTON, May 01, 2018 (GLOBE NEWSWIRE) -- (NYSE:NBL) ( Noble Energy or the "Company ) today announced first quarter 2018 financial and operating
Antero Resources Reports Fourth Quarter and Year- End 2013 Financial and Operating Results
 Antero Resources Reports Fourth Quarter and Year- End 2013 Financial and Operating Results February 26, 2014 DENVER, Feb. 26, 2014 /PRNewswire/ -- (Logo: http://photos.prnewswire.com/prnh/20131101/la09101logo)
Callon Petroleum Company (Exact Name of Registrant as Specified in Its Charter)
") UNITED STATES SECURITIES AND EXCHANGE COMMISSION Washington, D.C. 20549 FORM 10-Q Quarterly Report Pursuant to Section 13 or 15(d) of the Securities Exchange Act of 1934 For The Quarterly Period Ended
UNITED STATES SECURITIES AND EXCHANGE COMMISSION Washington, D.C. 20549 FORM 10-Q Quarterly Report Pursuant to Section 13 or 15(d) of the Securities Exchange Act of 1934 For The Quarterly Period Ended
WPX ENERGY, INC. FORM 8-K. (Current report filing) Filed 05/05/15 for the Period Ending 05/05/15
 Filed 05/05/15 for the Period Ending 05/05/15") WPX ENERGY, INC. FORM 8-K (Current report filing) Filed 05/05/15 for the Period Ending 05/05/15 Address ONE WILLIAMS CENTER TULSA, OK 74172 Telephone 9185732000 CIK 0001518832 Symbol WPX SIC Code 1311
WPX ENERGY, INC. FORM 8-K (Current report filing) Filed 05/05/15 for the Period Ending 05/05/15 Address ONE WILLIAMS CENTER TULSA, OK 74172 Telephone 9185732000 CIK 0001518832 Symbol WPX SIC Code 1311
UNITED STATES SECURITIES AND EXCHANGE COMMISSION Washington, D.C FORM 10-Q
 UNITED STATES SECURITIES AND EXCHANGE COMMISSION Washington, D.C. 20549 FORM 10-Q Quarterly Report Pursuant to Section 13 or 15(d) of the Securities Exchange Act of 1934 For the period ended March 31,
Investor Presentation J.P. Morgan Global High Yield and Leveraged Finance Conference FEBRUARY 2016
 Investor Presentation J.P. Morgan Global High Yield and Leveraged Finance Conference FEBRUARY 2016 Forward-Looking Statements and Other Disclaimers This presentation contains forward-looking statements
NOBLE ENERGY INC FORM 8-K. (Current report filing) Filed 05/02/06 for the Period Ending 05/02/06
 Filed 05/02/06 for the Period Ending 05/02/06") NOBLE ENERGY INC FORM 8-K (Current report filing) Filed 05/02/06 for the Period Ending 05/02/06 Address 100 GLENBOROUGH SUITE 100 HOUSTON, TX 77067 Telephone 2818723100 CIK 0000072207 Symbol NBL SIC Code
NOBLE ENERGY INC FORM 8-K (Current report filing) Filed 05/02/06 for the Period Ending 05/02/06 Address 100 GLENBOROUGH SUITE 100 HOUSTON, TX 77067 Telephone 2818723100 CIK 0000072207 Symbol NBL SIC Code
U N I T C O R P O R A T I O N (Exact name of registrant as specified in its charter)
") SECURITIES AND EXCHANGE COMMISSION Washington, D.C. 20549 Form 10-Q [x] QUARTERLY REPORT PURSUANT TO SECTION 13 OR 15(d) OF THE SECURITIES EXCHANGE ACT OF 1934 For the quarterly period ended March 31,
SECURITIES AND EXCHANGE COMMISSION Washington, D.C. 20549 Form 10-Q [x] QUARTERLY REPORT PURSUANT TO SECTION 13 OR 15(d) OF THE SECURITIES EXCHANGE ACT OF 1934 For the quarterly period ended March 31,
Investor Presentation HOWARD WEIL ENERGY CONFERENCE MARCH 2015
 Investor Presentation HOWARD WEIL ENERGY CONFERENCE MARCH 2015 Forward-Looking Statements and Other Disclaimers This presentation contains forward-looking statements within the meaning of Section 27A of
BUILDING THE BEST-IN-CLASS
 BUILDING THE BEST-IN-CLASS 2014 was a model for how our Company and employees continue to build on our Vision of delivering operational excellence, top tier business results and value to our shareholders,
COMSTOCK RESOURCES, INC. (Exact name of registrant as specified in its charter)
") UNITED STATES SECURITIES AND EXCHANGE COMMISSION Washington, D.C. 20549 FORM 10-Q (Mark One) QUARTERLY REPORT PURSUANT TO SECTION 13 OR 15(d) OF / THE SECURITIES EXCHANGE ACT OF 1934 For The Quarter Ended
UNITED STATES SECURITIES AND EXCHANGE COMMISSION Washington, D.C. 20549 FORM 10-Q (Mark One) QUARTERLY REPORT PURSUANT TO SECTION 13 OR 15(d) OF / THE SECURITIES EXCHANGE ACT OF 1934 For The Quarter Ended
SOUTHWESTERN ENERGY ANNOUNCES SECOND QUARTER 2017 FINANCIAL AND OPERATING RESULTS
 NEWS RELEASE SOUTHWESTERN ENERGY ANNOUNCES SECOND QUARTER 2017 FINANCIAL AND OPERATING RESULTS Houston, Texas August 3, 2017...Southwestern Energy Company (NYSE: SWN) today announced its financial and
Panhandle Oil and Gas Inc.
 PHX LISTED NYSE 1 Panhandle Oil and Gas Inc. FORWARD-LOOKING STATEMENTS AND RISK FACTORS This presentation contains projections and other forward-looking statements within the meaning of Section 27A of
Panhandle Oil and Gas Inc. - PHX
 PHX LISTED NYSE 1 Panhandle Oil and Gas Inc. - PHX FORWARD-LOOKING STATEMENTS AND RISK FACTORS This presentation contains projections and other forward-looking statements within the meaning of Section
Panhandle Oil and Gas Inc.
 PHX LISTED NYSE 1 Panhandle Oil and Gas Inc. FORWARD-LOOKING STATEMENTS AND RISK FACTORS This presentation contains projections and other forward-looking statements within the meaning of Section 27A of
N e w s R e l e a s e
 N e w s R e l e a s e Chesapeake Energy Corporation P. O. Box 18496 Oklahoma City, OK 73154 FOR IMMEDIATE RELEASE AUGUST 2, 2010 INVESTOR CONTACTS: JEFFREY L. MOBLEY, CFA (405) 767-4763 jeff.mobley@chk.com
Centennial Resource Development Announces First Quarter 2018 Financial and Operational Results
 Centennial Resource Development Announces First Quarter 2018 Financial and Operational Results DENVER, CO, May 8, 2018 (GLOBE NEWSWIRE) - Centennial Resource Development, Inc. ( Centennial or the Company
chesapeake energy corporation 2014 annual Report
 chesapeake energy corporation 2014 annual Report At Chesapeake, our people are focused on performance. From elevating innovative solutions to demonstrating operational and financial leadership as well
Comstock Resources, Inc. is a fast growing independent energy company based in Dallas, Texas engaged in the
 C O M S T O C K R E S O U R C E S, I N C. 1 9 9 8 A N N U A L R E P O R T Comstock Resources, Inc. is a fast growing independent energy company based in Dallas, Texas engaged in the acquisition, development,
Centennial Resource Development Announces First Quarter 2018 Financial and Operational Results
 Centennial Resource Development Announces First Quarter 2018 Financial and Operational Results DENVER, CO, May 8, 2018 (GLOBE NEWSWIRE) - Centennial Resource Development, Inc. ( Centennial or the Company
SANDRIDGE ENERGY, INC. (Exact name of registrant as specified in its charter)
") (Mark One) þ UNITED STATES SECURITIES AND EXCHANGE COMMISSION Washington, D.C. 20549 Form 10-K ANNUAL REPORT PURSUANT TO SECTION 13 OR 15(d) OF THE SECURITIES EXCHANGE ACT OF 1934 For the fiscal year ended
(Mark One) þ UNITED STATES SECURITIES AND EXCHANGE COMMISSION Washington, D.C. 20549 Form 10-K ANNUAL REPORT PURSUANT TO SECTION 13 OR 15(d) OF THE SECURITIES EXCHANGE ACT OF 1934 For the fiscal year ended
PARSLEY ENERGY ANNOUNCES FOURTH QUARTER 2018 FINANCIAL AND OPERATING RESULTS AUSTIN,
 NEWS RELEASE PARSLEY ENERGY ANNOUNCES FOURTH QUARTER 2018 FINANCIAL AND OPERATING RESULTS AUSTIN, Texas, February 21, 2019 Parsley Energy, Inc. (NYSE: PE) ( Parsley, Parsley Energy, or the Company ) today
Corporate Presentation
 Corporate Presentation May 22, 2018 Forward Looking Statement This presentation contains forward-looking statements within the meaning of Section 27A of the Securities Act of 1933 and Section 21E of the
Corporate Profile. Production (MBOEPD) Reserves (MMBOE) BY THE NUMBERS OPERATIONAL METRICS For the year ended 12/31/13
 Reserves (MMBOE) BY THE NUMBERS OPERATIONAL METRICS For the year ended 12/31/13") 2013 Annual Report Corporate Profile We are an independent exploration and production company focused on the acquisition and development of unconventional oil and natural gas resources. As of December
2013 Annual Report Corporate Profile We are an independent exploration and production company focused on the acquisition and development of unconventional oil and natural gas resources. As of December
Platts North American Crude Marketing Conference February 28, 2013
 Platts North American Crude Marketing Conference February 28, 2013 Forward Looking Statements, Non-GAAP Measures, Reserve and Resource Information This presentation includes forward-looking statements
SOUTHWESTERN ENERGY ANNOUNCES FIRST QUARTER 2014 FINANCIAL AND OPERATING RESULTS
 NEWS RELEASE SOUTHWESTERN ENERGY ANNOUNCES FIRST QUARTER 2014 FINANCIAL AND OPERATING RESULTS Houston, Texas May 1, 2014...Southwestern Energy Company (NYSE: SWN) today announced its financial and operating
Concho Resources Inc. Reports Fourth Quarter and Full-Year 2014 Results
 NEWS RELEASE Concho Resources Inc. Reports Fourth Quarter and Full-Year 2014 Results 2/25/2015 MIDLAND, Texas--(BUSINESS WIRE)-- Concho Resources Inc. (NYSE:CXO) (the Company or Concho ) today reported
DRIVING FORCE OASIS PETROLEUM 2014 ANNUAL REPORT
 DRIVING FORCE OASIS PETROLEUM 2014 ANNUAL REPORT CORPORATE PROFILE We are an independent exploration and production company focused on the acquisition and development of unconventional oil and natural
SOUTHWESTERN ENERGY ANNOUNCES SECOND QUARTER 2014 FINANCIAL AND OPERATING RESULTS
 NEWS RELEASE SOUTHWESTERN ENERGY ANNOUNCES SECOND QUARTER 2014 FINANCIAL AND OPERATING RESULTS Houston, Texas July 31, 2014...Southwestern Energy Company (NYSE: SWN) today announced its financial and operating
EQT REPORTS SECOND QUARTER 2014 EARNINGS
 EQT REPORTS SECOND QUARTER 2014 EARNINGS Reiterates full-year production volume guidance PITTSBURGH, PA (July 24, 2014) -- EQT Corporation (NYSE: EQT) today announced second quarter 2014 net income attributable
SOUTHWESTERN ENERGY ANNOUNCES QUARTERLY AND 2018 RESULTS Continued outperformance, advantaged balance sheet, foundation set for value growth
 NEWS RELEASE SOUTHWESTERN ENERGY ANNOUNCES QUARTERLY AND 2018 RESULTS Continued outperformance, advantaged balance sheet, foundation set for value growth SPRING, Texas February 28, 2019...Southwestern
Diamondback Energy, Inc. Announces Fourth Quarter and Full Year 2018 Financial and Operating Results
 Announces Fourth Quarter and Full Year 2018 Financial and Operating Results February 19, 2019 MIDLAND, Texas, Feb. 19, 2019 (GLOBE NEWSWIRE) -- (NASDAQ: FANG) ( Diamondback or the Company ) today announced
Concho Resources Inc. Reports Fourth-Quarter and Full-Year 2017 Results and Provides 2018 Outlook
 Press Release Concho Resources Inc. Reports Fourth-Quarter and Full-Year 2017 Results and Provides 2018 Outlook Exceeds Crude Oil and Total Production Growth Guidance Increases Total Resource Potential
JONES ENERGY, INC. FORM 10-Q. (Quarterly Report) Filed 05/09/14 for the Period Ending 03/31/14
 Filed 05/09/14 for the Period Ending 03/31/14") JONES ENERGY, INC. FORM 10-Q (Quarterly Report) Filed 05/09/14 for the Period Ending 03/31/14 Address 807 LAS CIMAS PARKWAY SUITE 350 AUSTIN, TX 78746 Telephone 512-328-2953 CIK 0001573166 Symbol JONE
JONES ENERGY, INC. FORM 10-Q (Quarterly Report) Filed 05/09/14 for the Period Ending 03/31/14 Address 807 LAS CIMAS PARKWAY SUITE 350 AUSTIN, TX 78746 Telephone 512-328-2953 CIK 0001573166 Symbol JONE
Energy XXI Gulf Coast Announces Fourth Quarter and Full Year 2017 Financial and Operational Results
 March 16, 2018 Energy XXI Gulf Coast Announces Fourth Quarter and Full Year 2017 Financial and Operational Results Nasdaq Ticker Symbol Will Change March 21, 2018 HOUSTON, March 16, 2018 (GLOBE NEWSWIRE)
SandRidge Energy, Inc. Reports Financial and Operational Results for Fourth Quarter and Full Year 2018
 SandRidge Energy, Inc. Reports Financial and Operational Results for Fourth Quarter and Full Year 2018 Oklahoma City, Oklahoma, March 4, 2019 /PRNewswire/ SandRidge Energy, Inc. (the Company or SandRidge
UNITED STATES SECURITIES AND EXCHANGE COMMISSION Washington, D.C FORM 8-K
 UNITED STATES SECURITIES AND EXCHANGE COMMISSION Washington, D.C. 20549 FORM 8-K CURRENT REPORT Pursuant to Section 13 OR 15(d) of the Securities Exchange Act of 1934 Date of Report (Date of earliest event
2016 ANNUAL REPORT. 90th ANNIVERSARY
 926 2016 ANNUAL REPORT 2016 90th ANNIVERSARY 2016 ANNUAL REPORT 2016 1926 Panhandle Co-Operative Royalty Company was incorporated under the laws of the State of Oklahoma on the 3rd day of December, 1926.