Investors Overview AXWAY. March 2017 October 2017
|
|
|
- Michael Wood
- 5 years ago
- Views:
Transcription

1 Investors Overview AXWAY March 2017 October 2017
2 Forward Looking Statements This presentation contains forecasts in respect of which there are risks and uncertainties concerning the company s future growth and profitability. The group highlights the fact that the signature of license contracts, which often represent investments for clients, are more significant in the second half of the year and may therefore induce to a more or less favorable full-year performance. Furthermore the current outcome of the events or actual results may differ from those described in this document as a result of a number of risks and uncertainties set out in the Registration Document 2016 submitted to the Autorité des Marchés Financiers (AMF) on 24 April 2017 n D The distribution of this document in certain countries may be subject to the laws and regulations in force. Natural persons present in these countries and in which this document is disseminated, published or distributed, should obtain information about such restrictions and comply with them. 1
3 Axway: Catalyst for digital transformation INDEX Software Digital Transformation Business Model Offer Financial Results 2016 and Latest Publications Corporate Profile Perspective 2017 Axway CONFIDENTIAL 2
4 Axway, Catalyst for digital transformation Rev million OPM 16.9% FCF/Rev 9.3% Equity 374 million Cash 51 million Net Debt - 16 million Named a leader in the Gartner MQ for Content Collaboration Platforms. Formerly referred to as Enterprise File Synchronization and Sharing. (July2017) Axway solutions are deployed by over 11,000 companies spanning 100 countries. Dual nationality FR/US 19 locations worldwide 1,930+ employees including 584 in R&D & 148 in the sales force 2016 figures 2017 Axway CONFIDENTIAL 3
5 Software Digital Transformation MARKET DRIVERS 2017 Axway CONFIDENTIAL 4
 estimated at $21 billion*.")
6 Axway Market Origin: Infrastructure Software Software market estimated at $300 billion* Applications software estimated at $130 billion* Accounting ERP Sales management Human resources Infrastructure software estimated at $ 169 billion* Databases Operating systems Network management Storage management Application integration solutions (Middleware) estimated at $21 billion*. Digital Engagement Estimated at $2.0 billion. Foundation Estimated at $3.9 billion * Source Axway 5


7 Market origin: technology viewpoint Axway addressable Market ($6 billion) A A A BPM / BAM Data Integration (ETL, MDM, ) Application Integration (ESB, MOM, ) MFT B2B EFSS Integration Brokerage (VAN ), ipaas Integration Middleware SOA Governance / API Management A A A A
8 Digital technology impact CLOUD DIGITAL DISTRUPTION 2020 Cloud Creates $240 Billion Market Opportunity Mobile Spans 80% of Developed World Internet of Things Drivers 25 Billion Connected Machines INTERNET OF THINGS MOBILE 74% of today s business executives say they have a digital strategy only 19% of executives believe their firms have the right technology to properly execute on the digital strategy. 1 1 The State of Digital Business 2014, Forrester Research, Inc., May 7,
9 Digital technology impact : B2B and B2C are converging Digital transformation is everywhere Billion of datas Security Regulation Cost optimization IT rationalization Business Innovation 8


10 Competitive & Market Landscape From traditional middleware scope to Platform providers Integration Engagement IaaS 2017 Axway CONFIDENTIAL 9
11 Software Digital Transformation AXWAY OFFER 2017 Axway CONFIDENTIAL 10


12 DNA of Axway: Exchange Platform


13 Digital transformation increases complexity 2017 Axway CONFIDENTIAL 12


14 Customer Experience Network (CXN) MQTT API API PROACTIVE CUSTOMER CARE Analytics Dashboards, Mining, Algorithms, etc. MQTT API API EDI API MFT PREDICTIVE MAINTENANCE EDI API API EDI DYNAMIC ORDER FULFILLMENT API API API API API API Integration & EFSS Messages, Files, Streaming Data, APIs Mobile Devices, Bots, IoT, App App Apps App App API API API API API API SMART SERVICE OPTIMIZATION MQTT API PERSONALIZED MARKETING 2017 Axway CONFIDENTIAL 13


15 Axway AMPLIFY Turn Data into Real-time, DevOps-ready Services Cross-Platform App Development DATA INTEGRATION & ENGAGEMENT PLATFORM Achieve higher levels of efficiency and growth by transforming rigid and manual connections between people, businesses and machines into customer experience networks. Unified Engagement with User Communities Measure Business Value of Services Leverage Existing Integration Foundation 2017 Axway CONFIDENTIAL 14

16 Leveraging industry-leading products API Management Plus Decision Insight Axway Appcelerator SecureTransport / B2Bi, CG/CFT Axway Syncplicity Open up data and engage developers to innovate new experiences Analyze service levels and adoption with real-time, predictive insights Build beautiful apps that delight users with a seamless digital journey Secure and consolidate file transfers and streamline B2B processes Secure Enterprise File Sync and Share 2017 Axway CONFIDENTIAL 15


17 Industry analyst recognition Leader Full Life Cycle API Management Leader Applications Services Governance Leader On-Premises Application Integration Suites Leader API Management Solutions Champion MFT Vendor Landscape Strong Performer API Management Solutions, Q Strong Performer Mobile Development Platforms, Q Leader Pharmaceutical Track and Trace Software Leader B2B Integration Gateway Software Leader API Security Management Solutions 2017 Axway CONFIDENTIAL 16
18 Axway Business Model A Catalyst for transformation 2017 Axway CONFIDENTIAL 17
19 Axway Business Model: 4 sources of revenue in 2017 Services (Classic Editor) Associated with the initial installation Independent of licence Service agreement Licenses Perpetual usage rights Tiered pricing Standard licensing agreement 30% Cloud. Subscription usage ACV or TCV 24% 46% Maintenance Associated with licence sales Three levels of support For five years, but termination possible every year Licences Maintenance Services 2017 Axway CONFIDENTIAL 18


20 Business Model transformation Traditional Model Upfront Sales New Model Long Tail Sales 2017 Axway CONFIDENTIAL 19
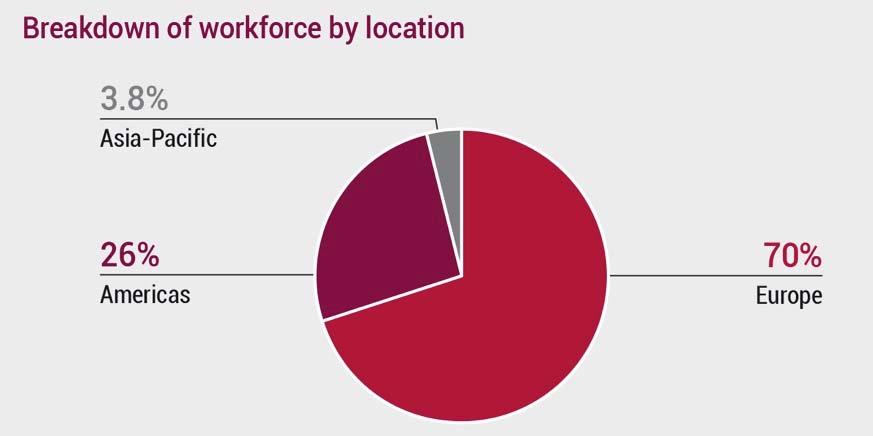
21 Balanced and resilient business model FY 2016 By Region By Activity Product Software 80.84%/R +6.8%growth 31% 23% 26% 27% France 5% Asia Pacific Rest of Europe 41% Americas Services Of which Cloud +26.6% Growth Licenses 47% Maintenance Recurring 53.8%/R +9.9%growth Software 33.34%/R +11.2% growth 2017 Axway CONFIDENTIAL 20

22 Balanced and resilient business model HY 2017 By Region By Activity 19% 18% 27% 24% Services Licenses France Rest of Europe 12% Cloud 5% Asia Pacific 44% Americas 51% Maintenance Recurring Revenue up 5.6% representing 63% of Total Revenue 2017 Axway CONFIDENTIAL 21
23 Axway Cash generation profile (FY 2016) Cash life cycle (cumulative) 100,00% 80,00% 60,00% Software Business Cycle 2016 Rev. ( M) ,00% 15 20,00% ,00% Jan Feb Mar Apr May Jun Jul Aug Sep Oct Nov Dec 0 Q1 Q2 Q3 Q4 Cash flow cycle Influenced by grouped maintenance at the beginning of the year (Feb. March) Increased at the start of the year by licences Regulated by services during the year 2017 Axway CONFIDENTIAL 22

24 A composite growth model: organic + acquisition 300 Revenue in M Appcelerator Catalyst for Transformation Incubation within Sopra B2B and Integration Collaborative Business Solutions Network of professional interactions MFT market leader Governing the flow of data Axway 5 Suite Digital Business Engablement Acquisition target: Customer position Acquisition target: Technology/competency 2017 Axway CONFIDENTIAL 23


25 Business Model Business Metrics
26 License Metrics FY 2016 (versus 2015) Digital Licenses 45% Nb Deals ~1967 Share of Tiers 1 business Share of nb. of deals: 3.2% Share of total amount: 46.6% Share of indirect business partner: 24% Share of New business ( ): 10.3% Average Sale Price ASP Tiers 1 ~571K ASP Tiers 2 (< 250 k ) ~104 ASP Tiers 3 (< 50 k ) ~10K 2017 Axway CONFIDENTIAL 25
27 License Metrics HY 2017 (versus HY 2016) Digital Licenses 43% Nb Deals ~724 Share of Tiers 1 business Share of nb. of deals: % Share of total amount: 27.6% Share of indirect business partner: 17.2% Share of New business ( ): 10.5% Average Sale Price ASP Tiers 1 ~451K ASP Tiers 2 (< 250 k ) ~102 ASP Tiers 3 (< 50 k ) ~9K 2017 Axway CONFIDENTIAL 26


28 License Pipe (July 2017) By Technology By Region 4% AI 7% Div 13% ADI 10% APAC 32% MFT 32% API 45% Digital solutions 39% USA 24% FRANCE +BNL 12% EDI 6% LATAM 21% GEMEA 2017 Axway CONFIDENTIAL 27
29 License Metrics FY 2016 Share of verticals in License revenues Sectors % 17% Others Healthcare vs Supply Chain 13% Supply Chain vs 42% FSI Public Sector 7% Healthcare Public Sector FSI vs vs 2017 Axway CONFIDENTIAL 28
30 License Metrics HY 2017 (vs HY 2016) Share of verticals in License revenues Sectors % 14% Others Healthcare vs Supply Chain 22% Supply Chain vs 31% FSI Public Sector 8% Healthcare Public Sector FSI vs vs 2017 Axway CONFIDENTIAL 29
31 Maintenance Metrics FY 2016 (vs 2015) Total Value/ Contribution ~1 38M /49% vs Attachment rate (average weighted by volume) =21% vs Renewal rate 1 =92.5% vs (1) This percentage represents full year revenue impact 2017 Axway CONFIDENTIAL 30
32 Maintenance Metrics HY 2017 (vs HY 2016) HY2017 HY2016 Total Value/ Contribution ~51% vs Attachment rate (average weighted by volume) =21.5% vs Renewal rate 1 =92.5% vs (1) This percentage represents full year revenue impact 2017 Axway CONFIDENTIAL 31
33 Cloud Metrics HY 2017(vs HY 2016) 14.8% Organic growth HY 2017 HY 2016 Subscription/Total Revenue 12% vs New ACV ACV= Annual Contract Value is the signed revenue still to come during the year. New TCV TCV= Annual Contract Value is the signed revenue still to come during the year. 4.3M 7.3M vs (1) This percentage represents full year revenue impact 2017 Axway CONFIDENTIAL 32


34 Cloud References, New Clients & Upsell API NEW Country USA GERMANY Industry Government Solution Syncplicity Country USA Industry Manufacturing, Retail, Electronics Solution Axway Cloud B2B Service NEW Country USA Industry US Federal Government Solution Axway Cloud MFT Service Rnw. Rene wal 2017 Axway CONFIDENTIAL 33


35 Headcount at End of 2016 Financial Results Full-Year FRANCE 680 USA Axway CONFIDENTIAL 34
36 Income statement (1/2) Total Revenue grew 5.8 % with total growth seen in all lines of business Gross Profit as a % of Revenue improved in all periods with improved Service and Cloud profitability R&D continued to grow in support of our growing portfolio and new Platform launch In millions of euros FY 2016 FY 2015 FY 2014 Revenue : Licenses Maintenance Total Product Revenue Services Total Revenue : Costs of sales: Product Revenue Services Total Costs of sales : Gross profit: as a % of Revenue 71.2% 69.7% 69.8% Operating expenses : Sales and marketing Research and development General and administrative Total operating expenses : Profit on operating activities Axway CONFIDENTIAL 35
37 Income statement (2/2) Profit on Operating Activities finished at 16.9%, a strong 1.3 point improvement over FY2015 Income tax benefit in 2015 due to the release of certain tax asset valuation reserves as well as favorable profit levels across our different tax jurisdictions. Basic EPS improved in all periods presented up to 1.51 in 2016 In millions of euros FY 2016 FY 2015 FY 2014 Profit on operating activities as a % of Revenue 16.9% 15.6% 15.2% Stock option releated expenses (1.1) (0.6) (0.8) Amortization of intangible assets (7.9) (6.0) (5.3) Profit from recurring operations as a % of Revenue 13.9% 13.3% 12.8% Other income and expenses (6.7) (10.5) (2.3) Operating profit Cost of net financial debt (0.4) (0.4) (1.4) Other financial revenues and expenses 0.5 (1.3) 0.4 Income taxes (3.7) 2.1 (3.6) Net Profit as a % of Revenue 10.5% 9.8% 10.2% Basic net earnings per share (in Euro) Axway CONFIDENTIAL 36
38 Simplified balance sheet (1/2) Goodwill and intangibles increased from the acquisition of Appcelerator Strong cash balance to end 2016 at 51.7 DSO finished at 85 days, equal to 2015 end of year DSO In millions of euros 31/12/16 31/12/15 31/12/14 ASSETS Goodwill Intangible assets Property, plant and equipment Other non-current assets Non-current assets Trade receivables Other current assets Cash and cash equivalents Current assets TOTAL ASSETS Axway CONFIDENTIAL 37
39 Simplified balance sheet (2/2) 20 M of borrowings under 125 M RCF at 31 Dec 2016, additional debt outside RCF Current liabilities includes 74.5 M of deferred income in 2016 versus 66.6 M in 2015 In millions of euros 31/12/16 31/12/15 31/12/14 SHAREHOLDERS' EQUITY AND LIABILITIES Share capital Capital reserves and results Total shareholders' equity Financial debt - long-term portion Other non-current liabilities Non-current liabilities Financial debt - short-term portion Other current liabilities Current liabilities TOTAL LIABILITIES TOTAL SHAREHOLDERS' EQUITY AND LIABILITIES Axway CONFIDENTIAL 38
40 Change in equity Due to the USD/Euro conversion rate movement a significant translation adjustment was recorded in 2014 and 2015 on the conversion of the foreign balance sheets to Euros In millions of euros 31/12/16 31/12/15 31/12/14 Equity at Opening of Period Profit for the period Other comp. income statement items Share-based payments Treasury Shares Dividends Capital increase Actuarial gains and losses Other changes Translation differental Equity at End of Period Axway CONFIDENTIAL 39
41 Cash Flow statement Working Capital Requirements positive improvement in 2014 and 2015 with monetization of certain assets and improvement in DSO Change finished at -5,9 M Free cash for 2016 is 27.9 M versus 44.5 M for 2015 In millions of euros FY 2016 FY 2015 FY 2014 Net profit for the period Net charges to amortizations, depreciations and provisions Other income and expense items 3.5 (1.1) 0.2 Cash from operations after cost of net debt and tax Changes to operating working capital requirements (5.9) Costs of net financial debt Income tax paid net of accrual 0.5 (4.6) (0.2) Net cash from operating activities Net cash used in investing activities (57.3) (5.2) (54.4) Proceeds on shares issued Dividends paid (8.3) (8.2) (8.2) Change in loan 31.3 (41.0) 7.7 Net interest paid (0.4) (0.4) (1.4) Other changes (0.1) 0.3 (0.7) Net cash from (used in) financing activites 26.0 (46.1) (1.2) Effect of foreign exchange rate changes NET CHANGE IN CASH AND CASH EQUIVALENTS 7.8 (0.7) (4.6) Opening cash position CLOSING CASH POSITION Axway CONFIDENTIAL 40


42 Latest financial publication
43 Income statement (1/2) Continue to see impact of shifting business model with license revenue decrease and cloud increase Gross Profit as a 66.9% of revenue dropped with falling license revenue, Cloud margin up to 38% and service margin increased to 13% as well R&D continued to grow in support of our growing portfolio and new Platform launch and Syncplicity products In millions of euros HY 2017 HY 2016 FY 2016 Revenue : Licenses Cloud Maintenance Total Product Revenue Services Total Revenue : Costs of sales: License and Maintenance Cloud Services Total Costs of sales : Gross profit: as a % of Revenue 66.9% 69.3% 71.2% Operating expenses : Sales and marketing Research and development General and administrative Total operating expenses : Profit on operating activities Axway CONFIDENTIAL 42
44 Income statement (2/2) Profit on Operating Activities finished at 4.2%, a drop from 11.3% in HY 2016 Increase in intangible amortization relates to assets from Syncplicity Net Profit finish at 2.6 M or 0,12 per share, similar to S and 2014 In millions of euros HY 2017 HY 2016 FY 2016 Profit on operating activities as a % of Revenue 4.2% 11.3% 16.9% Stock option releated expenses (0.5) (0.2) (1.1) Amortization of intangible assets (4.5) (3.8) (7.9) Profit from recurring operations as a % of Revenue 0.7% 8.5% 13.9% Other income and expenses (1.3) (1.5) (6.7) Operating profit (0.4) Cost of net financial debt (0.0) (0.2) (0.4) Other financial revenues and expenses Income taxes 2.5 (0.5) (3.7) Net Profit as a % of Revenue 1.8% 7.6% 10.5% Basic net earnings per share (in Euro) Axway CONFIDENTIAL 43
45 Simplified balance sheet (1/2) Goodwill and intangibles increased from the acquisition of Syncplicity Cash balance ended at 27,1 M for 30 June 2017 With our drop in Trade Receivables, our DSO finished at 51 days, down from 78 days at 30 June 2016 In millions of euros 30/06/17 30/06/ /12/16 ASSETS Goodwill Intangible assets Property, plant and equipment Other non-current assets Non-current assets Trade receivables Other current assets Cash and cash equivalents Current assets TOTAL ASSETS Axway CONFIDENTIAL 44
46 Simplified balance sheet (2/2) 45 M$ of borrowings under 125 M RCF at 30 June 2017, additional debt outside RCF Current liabilities includes 84.5 M of deferred income in June 2017 versus 86.9 M in June 2016 In millions of euros 30/06/ /06/ /12/16 SHAREHOLDERS' EQUITY AND LIABILITIES Share capital Capital reserves and results Total shareholders' equity Financial debt - long-term portion Other non-current liabilities Non-current liabilities Financial debt - short-term portion Deferred Revenues Other current liabilities Current liabilities TOTAL LIABILITIES TOTAL SHAREHOLDERS' EQUITY AND LIABILITIES Axway CONFIDENTIAL 45
47 Change in Equity Due to the USD/Euro conversion rate movement at balance sheet ending date a significant translation adjustment was recorded in June 2017 on the conversion of the foreign balance sheets to Euros In millions of euros 30/06/ /06/ /12/2016 Equity at Opening of Period Profit for the period Other comp. income statement items Share-based payments Dividends Capital increase Actuarial gains and losses Other changes Translation differental Equity at End of Period Axway CONFIDENTIAL 46
48 Cash Flow statement Working Capital Requirements (BFR) positive improvement in HY 2017 of 16.5 M which was used to pay off our Appcelerator draw under our RCF Free cash for HY 2017 is 19.0 M versus 17.4 M for HY 2016 In millions of euros HY 2017 HY 2016 FY 2016 Net profit for the period Net charges to amortizations, depreciations and provisions Other income and expense items Cash from operations after cost of net debt and tax Changes to operating working capital requirements (5.9) Costs of net financial debt Income tax paid net of accrual (4.1) (0.6) 0.5 Net cash from operating activities Net cash used in investing activities (60.4) (50.4) (57.3) Proceeds on shares issued Dividends paid (8.5) - (8.3) Change in loan Net interest paid (0.0) (0.2) (0.4) Other changes (0.2) (0.2) (0.1) Net cash from (used in) financing activites Effect of foreign exchange rate changes (1.1) (0.6) 0.8 NET CHANGE IN CASH AND CASH EQUIVALENTS (26.4) (4.4) 7.8 Opening cash position CLOSING CASH POSITION Axway CONFIDENTIAL 47
 The 125 M credit line is extended to mid-2021 and approximately 85 M is available")
49 Financial structure Covenants HY 2017 Financial covenants met in all periods. Net bank debt for 2017 is 28,8 M Our main covenant is the leverage ratio: Net debt/ebe 3 (0,72 at June 30, 2017) The 125 M credit line is extended to mid-2021 and approximately 85 M is available EBE/Costs of Debt (covenant >5) Net Debt/EBE (covenant <3) Net Debt/Retained Earnings (Covenant <1) 2017 Axway CONFIDENTIAL 48
50 Corporate Profile A Catalyst for transformation 2017 Axway CONFIDENTIAL 49
51 Axway shareholder structure 30/06/ ,168,021 SHARES OUTSTANDING 34,274,819 VOTING RIGHTS Sopra Steria Group Pasquier Family Odin Family Managers Sopra GMT Caravelle Public Treasury Shares Shares Outstanding 32.7% 0.1% 1.4% 1.7% 21.3% 12.1% 30.6% 0.07% Voting Rights 35.1% 0.1% 1.5% 1.7% 26.3% 15.0% 20.2% Concerted action 57.14% of the shares 64.73% of the voting rights 2017 Axway CONFIDENTIAL 50


52 Governance Strengthened Governance French-American management: 8 top managers coming from the software industry and historical corporate management Board of Directors comprising 13 members, of which 7 are independent members Pierre Pasquier Chairman Kathleen Clark-Bracco Vice Chairman Compliance with the Middlenext Code of Corporate Governance Jean-Marc Lazzari Chief Executive Officer 51


53 1,941At 30 June

54 A presence spanning the continents Americas France 94.2million 576 people 2,077 customers Rest of Europe 68.8million 745people 2,908 customers North America 122.9million 529 people 4,014 customers Asia Pacific 15.3million 74 people 1,530 customers South America 1,387 customers Africa 73 customers 17 people R&D: 700 people, Fr, US, Ireland Romania, Bulgaria More than 11,000 customers served through 19 locations General management in the United States and registered office in France 1941 employees (30/06/2017) 53


55 Corporate Social Responsibility Organizations & Labels Global Compact EcoVadis label for customers Sub-contractor & purchasing policy Annual Gaïa evaluation for investors Governance Board members: 63% independant 36% women 95% attendance rate meeting HR Responsibility 1,286 Axwagians trained hours 7,367 training sessions CSR Report Download way.com/sites/default/ files/csr_report_extract_ registration_document_ axway_2016_0.pdf Environmental Responsibility Digital customer journey Full digital internal exchanges/paperless 90% virtual servers Transportation policy 54

 Caravelle Public")


56 Axway Shareholder Structure Sopra Steria Shares outstanding Pasquier Family Odin Family 31/12/ ,773,916 SHARES OUTSTANDING 35,538,163 VOTING RIGHTS Managers Sopra GMT Geninfo (SG Group) Caravelle Public Treasury Shares 24.9% 0.1% 1.4% 1.7% 21.6% 8.6% 12.3% 28.9% 0.2% Voting Rights 29.0% 0.1% 1.5% 1.6% 25.0% 10.0% 14.4% 18.0% Perspective Concerted action % of the shares % of the voting rights 2017 Axway CONFIDENTIAL 55
57 FY 2017 Outlook Keep focusing on our strategic ambition Continue Axway Transformation Stable FY Revenue FY ROA over 13% 56


58 Thank you Presentation available on: Mobile App: Axway IR available on Apple store & Android Patrick Gouffran Investor Relations 57
59 APM Definition Restated: Revenue for the prior year, expressed on the basis of the scope and exchange rates for the current year. Organic growth of revenue: Growth of operations between revenue for the period and the reprocessed revenue data for the same period of the preceding fiscal year. Profit (loss) from operations This indicator, such as defined in the Registration Document, corresponds to profit from the reprocessed counting operations data of the charge pertaining to the cost of services rendered by the beneficiaries of stock options and of restricted shares and of the provisions to amortisation of the affected intangible assets. Profit from counting operations: This indicator corresponds to the operating profit prior to taking into account other operating income and expenses which correspond to unusual, abnormal, infrequent, non-predictive operating income and expenses, and of a particularly significant amount, presented in a distinct manner in order to facilitate understanding of the performance connected to current operations. ACV: Annual Contract Value is the signed revenue still to come during the year. TCV: Total contract value, represents the full value of a customer contract. It includes both recurring for the duration of the contracted period and one-time payments. 58
AXWAY 2017 ANNUAL RESULTS: 299.8m revenue, OPA was 13.5% of revenue, net profit 1.5% of revenue and Cloud operations generated +14.4% organic growth.
 Contacts Investor Relations: Patrick Gouffran +33 (0)1 40 67 29 26 pgouffran@axway.com Press Relations: Sylvie Podetti +33 (0)1 47 17 22 40 spodetti@axway.com Press Release AXWAY 2017 ANNUAL RESULTS: 299.8m
AXWAY: m142.8 in revenue for the first half of 2017 and 4.2% profit on operating activities
 Contacts Investor Relations: Patrick Gouffran +33 (0)1 40 67 29 26 pgouffran@axway.com Press Relations: Sylvie Podetti +33 (0)1 47 17 22 40 spodetti@axway.com Press release AXWAY: m142.8 in revenue for
Axway Software Half-Year 2018: Revenue 1 of million and Operating margin of 9.1%
 Contacts Investor Relations: Arthur Carli +33 (0)1 47 17 24 65 acarli@axway.com Press Relations: Sylvie Podetti +33 (0)1 47 17 22 40 spodetti@axway.com Press Release Axway Software Half-Year 2018: Revenue
Axway Software 2018 Full-Year Results: Execution of the AMPLIFY strategy accelerates in the second-half
 Contacts Investor Relations: Arthur Carli +33 (0)1 47 17 24 65 acarli@axway.com Press Relations: Sylvie Podetti +33 (0)1 47 17 22 40 spodetti@axway.com Press Release Axway Software 2018 Full-Year Results:
Combined Shareholders Meeting of Axway Software SA
 Combined Shareholders Meeting of Axway Software SA 22 June 2015 Hôtel Le Meurice Paris 2014 Axway Confidentiel 1 Forward looking statements This presentation contains forecasts in respect of which there
Press release HY 2014 HY 2013 FY Key income statement items
 Contacts Investor Relations: Patrick Gouffran +33 (0)1 40 67 29 26 pgouffran@axway.com Press Relations: Sylvie Podetti +33 (0)1 47 17 22 40 spodetti@axway.com Press release Axway: 8.0% total revenue growth
Welcome to the Axway 2017 General Shareholders Meeting. Tuesday 6 June 2017 Hôtel Le Meurice, Paris
 Welcome to the Axway 2017 General Shareholders Meeting Tuesday 6 June 2017 Hôtel Le Meurice, Paris Forward-looking statements This presentation contains forecasts in respect of which there are risks and
Interim financial report at 30 June 2018
 Interim financial report at 30 June 2018 2018 Contents 1 Half-year 2 Condensed 3 Statutory 4 Declaration management report 3 Key events in the first half of 2018 4 Accelerating execution of the transformation
Sopra: 2013 annual results exceed targets
 Press Release Contacts Investor Relations: Kathleen Clark Bracco +33 (0)1 40 67 29 61 investors@sopragroup.com Sopra: 2013 annual results exceed targets Paris, 18 February 2014 At its meeting yesterday
PRESENTATION OF FIRST-HALF 2017 RESULTS
 PRESENTATION OF FIRST-HALF 2017 RESULTS Paris, 28 July 2017 Delivering Transformation. Together. DISCLAIMER This presentation contains forward-looking information subject to certain risks and uncertainties
Sopra Steria turns in a solid performance in 2017
 Press release Sopra Steria turns in a solid performance in Revenue of 3,845.4 million, equating to organic growth* of 3.5% Revenue growth of 4.6% at constant exchange rates and total growth of 2.8% Operating
2018 Full-year results
 Press release Full-year results Revenue up 6.9% to 4,095.3 million Organic growth of 4.9% over the full year, and 5.5% in the 4th quarter Operating margin on business activity of 7.5%, in line with the
Sopra Group announces an excellent performance in 2011
 Press release Contacts Investor relations: Kathleen Clark Bracco +33 (0)1 40 67 29 61 kbraccoclark@sopragroup.com Press relations: Virginie Legoupil +33 (0)1 40 67 29 41 vlegoupil@sopragroup.com Image
PRESENTATION OF 2017 ANNUAL RESULTS
 PRESENTATION OF 2017 ANNUAL RESULTS Paris, 19 February 2018 Delivering Transformation. Together. DISCLAIMER This presentation contains forward-looking information subject to certain risks and uncertainties
Sopra Group: solid growth in 1st half of 2013
 Press Release Contacts Investor Relations: Kathleen Clark Bracco +33 (0)1 40 67 29 61 investors@sopragroup.com Sopra Group: solid in 1st half of 2013 Revenue in the 2nd quarter representing total of 12.6%
Sopra Group: Excellent performance in first half 2010
 Press Release Contacts Investor Relations: Kathleen Clark Bracco +33 (0)1 40 67 29 61 kbraccoclark@sopragroup.com Press Relations: Virginie Legoupil +33 (0)1 40 67 29 41 vlegoupil@sopragroup.com Sopra
2014 ANNUAL RESULTS PRESENTATION
 ANNUAL RESULTS PRESENTATION Paris, 19 March 2015 Delivering Transformation. Together. INTRODUCTION Pierre Pasquier - Chairman 2 AGENDA 1 Introduction 2 Performance in Steria scope Sopra scope Sopra Steria
Investor Presentation. March 2017
 Investor Presentation March 2017 Safe Harbor Statement Safe Harbor statement under Private Securities Litigation Reform Act of 1995: This presentation contains forward-looking statements, including statements
Sopra Group resilient in 2009
 Direction Générale 9 bis, rue de Presbourg FR 75116 Paris Tél : +33 (0)1 40 67 29 29 Fax : +33 (0)1 40 67 29 30 w w w. s o p r a g r o u p. c o m Press release Sopra Group resilient in Paris, 15 February
REDKNEE SOLUTIONS INC. MANAGEMENT S DISCUSSION AND ANALYSIS FOR THE SECOND QUARTER ENDED MARCH 31, 2016
 REDKNEE SOLUTIONS INC. MANAGEMENT S DISCUSSION AND ANALYSIS FOR THE SECOND QUARTER ENDED MARCH 31, 2016 DATED: May 9, 2016 SCOPE OF ANALYSIS This ( MD&A ) covers the results of operations, financial condition
Sopra Group Excellent performance in 2008
 Press Release Paris, 12 February 2009 Sopra Group Excellent performance in 2008 Strong growth in revenue Total growth: +12.8% Organic growth: +10.5% Current operating margin: 9.1% Excellent performance
Interim financial report for the six-month period ended 30 June 2016
 Interim financial report for the six-month period ended 30 June 2016 1 2 3 4 Summary HALF-YEAR 3 Key events in the first half of 2016 4 Business performance in the first half of 2016 5 Results for the
Axway Software Notice of Shareholders Meeting 2018 (hereinafter referred to as Axway Software or Axway or the Company )
") Axway Software Notice of Shareholders Meeting 2018 (hereinafter referred to as Axway Software or Axway or the Company ) Axway Shareholders Program 1 email = 1 tree planted. Opt for the e-notice (form page
Axway Software Notice of Shareholders Meeting 2018 (hereinafter referred to as Axway Software or Axway or the Company ) Axway Shareholders Program 1 email = 1 tree planted. Opt for the e-notice (form page
ROADSHOW USA & CANADA KEPLER CHEUVREUX
 ROADSHOW USA & CANADA KEPLER CHEUVREUX December 2017 Delivering Transformation. Together. DISCLAIMER This presentation contains forward-looking information subject to certain risks and uncertainties that
How to Scale Innovation?
 How to Scale Innovation? Dr. Wolfram Jost CTO Darmstadt February 11th, 2014 1 Safe harbor This presentation contains forward-looking statements based on beliefs of Software AG management. Such statements
rhipe Limited (ASX code RHP) FY16 Full Year Results Presentation & FY 2017 Outlook
 FY16 Full Year Results Presentation & FY 2017 Outlook") rhipe Limited (ASX code RHP) FY16 Full Year Results Presentation & FY 2017 Outlook Dominic O Hanlon, CEO & Managing Director Mike Hill, Executive Chairman 1 This presentation has been prepared by rhipe
rhipe Limited (ASX code RHP) FY16 Full Year Results Presentation & FY 2017 Outlook Dominic O Hanlon, CEO & Managing Director Mike Hill, Executive Chairman 1 This presentation has been prepared by rhipe
OPTIVA INC. (Formerly Redknee Solutions Inc.) MANAGEMENT S DISCUSSION AND ANALYSIS FISCAL YEAR ENDED SEPTEMBER 30, 2018
 MANAGEMENT S DISCUSSION AND ANALYSIS FISCAL YEAR ENDED SEPTEMBER 30, 2018") OPTIVA INC. (Formerly Redknee Solutions Inc.) MANAGEMENT S DISCUSSION AND ANALYSIS FISCAL YEAR ENDED SEPTEMBER 30, 2018 DATED: December 12, 2018 SCOPE OF ANALYSIS This Management's Discussion and Analysis
OPTIVA INC. (Formerly Redknee Solutions Inc.) MANAGEMENT S DISCUSSION AND ANALYSIS FISCAL YEAR ENDED SEPTEMBER 30, 2018 DATED: December 12, 2018 SCOPE OF ANALYSIS This Management's Discussion and Analysis
Sopra Steria beats targets for 2015
 Press release Sopra Steria beats targets for Successful integration Organic revenue growth: 2.0% Operating margin on business activity: 6.8% Net profit Group share: 84.4m Free cash flow: 49.3m Paris, 29
ZEBRA TECHNOLOGIES FIRST QUARTER 2016 RESULTS May 10, 2016
 ZEBRA TECHNOLOGIES FIRST QUARTER 2016 RESULTS May 10, 2016 Anders Gustafsson Chief Executive Officer Mike Smiley Chief Financial Officer 2 Safe Harbor Statement Statements made in this presentation which
Sopra Group 2007 objectives met
 Press Release Paris, 14 February 2008 Sopra Group 2007 objectives met : 1 billion euros Total growth: +11.6% Organic growth: +9.4% Current operating margin: 9.1% (+21.1%) Net profit: 5.5% (+24.7%) 2007
First half 2018 in line with forecasts
 Press release First half 2018 in line with forecasts Revenue grew by 6.5%, with organic growth at 5.3% 1 Operating margin on business activity was 6.6% (7.5% in H1 2017) in line with budget, and net profit
Financial review Gemalto
 0 0111010 0110 010 0 0110 0 011101010 0 0111010 0110 010 0 0110 0 011101010 0 0111010 0110 010 0 0110 0 011101010 0 0111010 0110 010 0 0110 0 011101010 0 0111010 0110 010 0 0110 0 011101010 0 0111010 01100100010
2017 Full Year Results
 2017 Full Year Results Title of the presentation 2 lines Location, Date, Author Paris February 15 th, 2018 Disclaimer This presentation may contain forward-looking statements, Such statements may include
ENIRO Q3 REPORT Johan Lindgren, CEO Mattias Lundqvist, CFO Cecilia Lannebo, Head of IR
 ENIRO Q3 REPORT 2012-10-25 Johan Lindgren, CEO Mattias Lundqvist, CFO Cecilia Lannebo, Head of IR CEO INTRODUCTION & SUMMARY A digital media company with 74 percent of revenues being digital the transformation
ZEBRA TECHNOLOGIES SECOND-QUARTER 2016 RESULTS. August 9, 2016
 ZEBRA TECHNOLOGIES SECOND-QUARTER 2016 RESULTS August 9, 2016 Anders Gustafsson Chief Executive Officer Mike Smiley Chief Financial Officer 2 Safe Harbor Statement Statements made in this presentation
Q order intake and sales 19 October 2017
 Q3 2017 order intake and sales 19 October 2017 www.thalesgroup.com Q3 order intake and sales Update on implementation of IFRS 15 standard 2017 outlook Q3 2017 highlights New London underground signaling
Fourth Quarter Fiscal Year 2017
 Fourth Quarter Fiscal Year 2017 October 25, 2017 J. Michael Bruff Vice President Investor Relations Mike.Bruff@Varian.com This presentation is intended exclusively for investors. It is not intended for
Analysts Meeting FY & Q4 2015
 1 Analysts Meeting FY & Q4 2015 Forward Looking Information Such forward-looking statements are based on Dassault Systèmes management's current views and assumptions and involve known and unknown risks
DATATEC GROUP UNAUDITED INTERIM RESULTS FOR THE 6 MONTHS ENDED 31 AUGUST 2016
 Technology Distribution Integration & Managed Services Consulting & Research UNAUDITED INTERIM RESULTS FOR THE 6 MONTHS ENDED 31 AUGUST 2016 AGENDA Results summary, market conditions & operational strategy
Caution Concerning Forward-Looking Statements
 Caution Concerning Forward-Looking Statements This presentation contains forward-looking statements within the meaning of the Private Securities Litigation Reform Act of 1995. Forward-looking statements
Avaya Reports Third Quarter Fiscal 2018 Financial Results
 Media Inquiries: Investor Inquiries: Debbie Lewandowski Peter Schuman 630-245-2720 669-242-8098 deblewan@avaya.com pschuman@avaya.com Avaya Reports Third Quarter Fiscal Financial Results Named to the Gartner's
Axway. Presentation of Annual Results
 Presentation of Annual Results Index AXWAY 1 PRESENTATION OF ANNUAL RESULTS 1 Index 1 Highlights 2017 2 Jean-Marc LAZZARI 2 CEO 2 Accounting and Financial Results 4 4 CFO 4 Market 6 Jean-Marc LAZARRI 6
Electrocomponents 2017 half-year financial results. 18 November 2016
 Electrocomponents 2017 half-year financial results 18 November 2016 Agenda Overview of results Lindsley Ruth Financial results and performance update David Egan Performance Improvement Plan Lindsley Ruth
ANNUAL GENERAL MEETING
 *Réussir la transformation. Ensemble. ANNUAL GENERAL MEETING Paris, 25 June 2015 This document is a free translation into English of the original French document. It is not a binding document. In the event
Net Element Inc. (NASDAQ: NETE)
") NEW YORK SÃO PAULO TORONTO Research Note Inc. (NASDAQ: ) reported developments in both its Netevia platform and Unified Payments subsidiary. intends to improve reveneue generation by extending its Netevia
NEW YORK SÃO PAULO TORONTO Research Note Inc. (NASDAQ: ) reported developments in both its Netevia platform and Unified Payments subsidiary. intends to improve reveneue generation by extending its Netevia
Interim results. for the six months to 30 September Company Registration Number
 Interim results for the six months to 30 September 2018 Company Registration Number 01892751 Contents 01 Highlights 02 Chief Executive review 05 Our integrated core services 07 IFRS 8 reporting change
ZEBRA TECHNOLOGIES. William Blair Growth Stock Conference June 16, 2016
 ZEBRA TECHNOLOGIES William Blair Growth Stock Conference June 16, 2016 Safe Harbor Statement Statements made in this presentation which are not statements of historical fact are forward-looking statements
2014 pro forma revenue: 3,370.1m. Pro forma net profit Group share: 92.8m
 Press Release pro forma revenue: 3,370.1m Pro forma net profit Group share: 92.8m Paris, 19 March 2015 At its meeting on 17 March 2015 chaired by Pierre Pasquier, Sopra Steria Group s Board of Directors
News Release Tupperware Brands Corp S. Orange Blossom Trail Orlando, FL 32837
 News Release Tupperware Brands Corp. 14901 S. Orange Blossom Trail Orlando, FL 32837 Investor Contact: James Hunt (407) 826-4475 Tupperware Brands Reports Fourth Quarter 2017 Results Declares Regular Quarterly
1H 19 Investor Presentation February 2019
 1H 19 Investor Presentation February 2019 1 About Raiz Raiz (formerly Acorns) is a mobile first micro-investing platform via mobile phone or web app, which allows customers to invest in a portfolio of
Looking to the medium term
 Looking to the medium term Issued: 4 September 2013 Legal notice This presentation has been prepared to inform investors and prospective investors in the secondary markets about the Group and does not
Sage Group plc results for the six months ended 31 March 2017
 Sage Group plc results for the six months ended 31 March 2017 Safe harbour The following presentation is being made only to, and is only directed at, persons to whom such presentation may lawfully be communicated
REDKNEE SOLUTIONS INC. MANAGEMENT S DISCUSSION AND ANALYSIS FOR THE FIRST QUARTER ENDED DECEMBER 31, 2017
 REDKNEE SOLUTIONS INC. MANAGEMENT S DISCUSSION AND ANALYSIS FOR THE FIRST QUARTER ENDED DECEMBER 31, 2017 DATED: February 7, 2018 SCOPE OF ANALYSIS This ( MD&A ) covers the results of operations, financial
Investor Presentation. Third Quarter 2018
 Investor Presentation Third Quarter 2018 Safe Harbor and Other Information This presentation contains forward looking statements that are based on our management s beliefs and assumptions and on information
RESULTS FOR THE SIX MONTHS ENDED 30 JUNE 2014
 RESULTS FOR THE SIX MONTHS ENDED 30 JUNE 2014 AGENDA Brian Mattingley Introduction Aviad Kobrine Itai Frieberger Financial Review Operational Review Brian Mattingley Summary Q&A 2 SUMMARY OF RESULTS H1
Third Fiscal Quarter FY19 Financial Results. November 28, 2018
 Third Fiscal Quarter FY19 Financial Results November 28, 2018 2 Forward-Looking Statements and Non-GAAP Financial Measures This presentation contains forward-looking statements that involve risks and uncertainties,
This flash report is unaudited and the translation of the Japanese language version.
 This flash report is unaudited and the translation of the Japanese language version. Flash Report for the 2 nd Quarter of Fiscal Year Ending May 31, 2017 [under Japanese GAAP] (Non-consolidated) December
SEMI-ANNUAL FINANCIAL REPORT AS AT JUNE 30, 2017
 SEMI-ANNUAL FINANCIAL REPORT AS AT JUNE 30, 2017 TABLE OF CONTENTS First semester 2017 Management Report 3 Highlights 3 Basis of preparation of financial information 4 Adjusted financial information for
Annual Shareholder Meeting. Joachim Kreuzburg Chairman of the Board and CEO 03. April 2018
 Annual Shareholder Meeting Joachim Kreuzburg Chairman of the Board and CEO 03. April 2018 Disclaimer This presentation contains statements concerning Sartorius Stedim Biotech Group s future performance.
SOFTWARE AG THE NEW GROWTH DRIVER KEPLER CHEUVREUX ROADSHOW HELSINKI / STOCKHOLM MAY 3-4, Software AG. All rights reserved.
 IOT @ SOFTWARE AG THE NEW GROWTH DRIVER KEPLER CHEUVREUX ROADSHOW HELSINKI / STOCKHOLM MAY 3-4, 2018 SAFE-HARBOR-STATEMENT This presentation includes forward-looking statements based on the beliefs of
News Release Tupperware Brands Corp S. Orange Blossom Trail Orlando, FL 32837
 News Release Tupperware Brands Corp. 14901 S. Orange Blossom Trail Orlando, FL 32837 Investor Contact: James Hunt (407) 826-4475 Tupperware Brands Reports Second Quarter 2017 Results Significant Restructuring
Preliminary Results. 22nd February 2018
 Preliminary Results 22nd February 2018 Mark Lewis Chief Executive Officer Matthew Price Chief Financial Officer Full year themes Diversified business delivering stable returns Doing a great job for our
Prepared Remarks 03/26/18
 Speaker: Tom McCallum, VP of Investor Relations Thank you operator, Hello everyone, and welcome to Red Hat's earnings call for the fourth quarter of FY18. Speakers for today's call will be Jim Whitehurst,
Investor & Analyst Presentation Ful YearResults 30 June2016 For personal use only 25th August 2016 Rebekah O Flaherty - CEO I Jonathan Kenny - CFO
 Investor & Analyst Presentation Full YearResults 30 June2016 25th August 2016 Rebekah O Flaherty - CEO I Jonathan Kenny - CFO Agenda 1 Overview 2 Strategic Priorities 3 FY16 Financial Results 4 FY17 Outlook
KCB GROUP PLC INVESTOR PRESENTATION. FY17 FINANCIAL RESULTS
 KCB GROUP PLC INVESTOR PRESENTATION. FY17 FINANCIAL RESULTS JOSHUA OIGARA GROUP CEO & MD LAWRENCE KIMATHI GROUP CFO KCB Group at a glance 6,483 staff 15.7M Customers 153,431 shareholders Market Capitalization
INTENSIFIED TRANSFORMATION THANKS TO INCREASED INVESTMENT AND COST REDUCTION AS SALES DECREASE
 2016 HALF-YEAR RESULTS AND Q2 2016 SALES INTENSIFIED TRANSFORMATION THANKS TO INCREASED INVESTMENT AND COST REDUCTION AS SALES DECREASE First-half 2016 sales down 5.0%, or -3.3% organically 1 H1 2016 current
Results presentation. Year ended 31 March 2016
 Results presentation Year ended 31 March 2016 Introduction Peter Cruddas - Group Chief Executive Officer Introduction Key Highlights Successful IPO Strong growth across all key metrics and significant
Interim report January December 2018
 Interim report January December 2018 PERIOD OCTOBER 1 DECEMBER 31, 2018 PERIOD JANUARY 1 DECEMBER 31, 2018 Net sales decreased by 1 % to SEK 109.6 m Net sales increased by 4 % to SEK 406.4 m (SEK 390.2
Deutsche Bank 24 th Annual Media, Internet & Telcom Conference. March 8, 2016
 Deutsche Bank 24 th Annual Media, Internet & Telcom Conference March 8, 2016 Safe Harbor for Forward-Looking Statements Certain statements in this presentation are forward-looking statements within the
Financial Release June 30, 2018
 Hexaware Reports Q2 2018 results Q2 Constant Currency Revenue at $169.8 Mn, up 4.7% QoQ Profitability Outgrows Revenue PAT at $22.7 mn; up 9.5% QoQ, 19.5% YoY EBITDA* - Excludes ESOP Cost Q2 Performance
Six months of FY ending December 31, (0.4) (1.9) 22.5 (0.4) (0.3) (0.4) (0.1) (0.4) (0.7) (2.0) 0.9 (1.
 (1.9) 22.5 (0.4) (0.3) (0.4) (0.1) (0.4) (0.7) (2.0) 0.9 (1.") November 11, ISEKI & CO., LTD. Supplementary Information to Consolidated Financial Results (April 1, September 30, ) I. Consolidated business results for the six months ended September 30, (Billions of
November 11, ISEKI & CO., LTD. Supplementary Information to Consolidated Financial Results (April 1, September 30, ) I. Consolidated business results for the six months ended September 30, (Billions of
THIRD QUARTER OCTOBER 2018
 THIRD QUARTER 2018 18 OCTOBER 2018 DISCLAIMER Certain information contained in this document, other than historical information, may constitute forward-looking statements or unaudited financial forecasts.
Press Release December 15, 2017
 ISRA VISION AG: 2016 / 2017 financial year Revenues and EBT +11 %, cash flow significantly stronger ISRA again matches full year guidance: Heading for the next revenue level with double-digit growth rates
H1/2017 Results u-blox Holding AG
 H1/2017 Results u-blox Holding AG August 24, 2017 Thomas Seiler, CEO Roland Jud, CFO locate, communicate, accelerate Disclaimer This presentation contains certain forward-looking statements. Such forward-looking
Real-time Driver Profiling & Risk Assessment for Usage-based Insurance with StreamAnalytix
 Real-time Driver Profiling & Risk Assessment for Usage-based Insurance with StreamAnalytix The auto insurance industry is rising up to meet consumer expectations of personalization and flexibility in all
Hathway Cable and Datacom Limited Investor Update 9M / Q3-FY19
 Hathway Cable and Datacom Limited Investor Update 9M / Q3-FY19 Safe Harbour The information contained in this presentation is only current as of its date. All actions and statements made herein or otherwise
Flow Traders N.V. 1Q 2016 AMSTERDA M - NEW YORK - SINGAP O R E - CLUJ
 Flow Traders N.V. 1Q 2016 AMSTERDA M - NEW YORK - SINGAP O R E - CLUJ Disclaimer This presentation is prepared by Flow Traders N.V. and is for information purposes only. It is not a recommendation to engage
Press Release February 28, 2018
 ISRA VISION AG: First quarter 2017 / 2018 revenues grow by approx. +10 %, EBT by +11 % ISRA starts dynamically into the new financial year: Guidance again double-digit Revenues at 31.2 million euros, plus
Salesforce.com Announces Fiscal 2013 Fourth Quarter and Full Year Results
 David Havlek salesforce.com Investor Relations 415-536-2171 dhavlek@salesforce.com Jane Hynes salesforce.com Public Relations 415-901-5079 jhynes@salesforce.com Salesforce.com Announces Fiscal 2013 Fourth
1Q of FY ending December 31, (0.2) (1.9) 11.3 (0.2) (0.2) (0.2) (0.2) (1.2) (89.2) 0.1
 (1.9) 11.3 (0.2) (0.2) (0.2) (0.2) (1.2) (89.2) 0.1") August 6, ISEKI & CO., LTD. Supplementary Information to Consolidated Financial Results (April 1, June 30, ) I. Consolidated business results for the three months ended June 30, (Billions of yen, %) Year-on
August 6, ISEKI & CO., LTD. Supplementary Information to Consolidated Financial Results (April 1, June 30, ) I. Consolidated business results for the three months ended June 30, (Billions of yen, %) Year-on
TomTom Reports Fourth Quarter and Full Year 2009 Results
 Q4 2009 and FY 2009 results Page 1 of 13 TomTom Reports Fourth Quarter and Full Year 2009 Results Normalised 1 (unaudited) Normalised 1 (unaudited) (in millions) Q4'09 Q4'08 Q3'09 q.o.q. 2009 2008 Revenue
September Colliers International Group Inc. Investor Presentation
 September 2018 Colliers International Group Inc. Investor Presentation Basis Of Presentation All amounts in millions of US Dollars unless otherwise noted. Adjusted EBITDA ( AEBITDA ) and Adjusted EPS (
INTERIM FINANCIAL REPORT FOR THE SIX-MONTH PERIOD
 INTERIM FINANCIAL REPORT FOR THE SIX-MONTH PERIOD SUMMARY 1 2 3 4 HALF-YEAR 3 Key events in the first half of 2015 4 Business performance in the first half of 2015 5 Results for the first half of 2015
ROADSHOW POST-Q2 & H RESULTS. September 2016
 ROADSHOW POST-Q2 & H1 2016 RESULTS September 2016 1. COMPANY OVERVIEW Rexel at a glance : Strategic partner for suppliers and customers Energy Providers Suppliers Customers Endusers Economies of scale
AGENDA. Cegedim at a glance. Cegedim Strategy. Cegedim Finance
 AGENDA SAFE HARBOR STATEMENT ---------- This presentation contains forwardlooking statements (made pursuant to the safe harbour provisions of the Private Securities Litigation Reform Act of 1995). By their
IFRS 15 IMPLICATIONS IOT / CLOUD BUSINESS LINE. Arnd Zinnhardt Chief Financial Officer. Capital Market Day 2018 March 12, 2018
 IFRS 15 IMPLICATIONS IOT / CLOUD BUSINESS LINE Arnd Zinnhardt Chief Financial Officer Capital Market Day 2018 March 12, 2018 SAFE HARBOR This presentation includes forward-looking statements based on the
Results Presentation
 1 Fiscal Year 2018 Results Presentation STOCK CODE: 9449 February 12, 2019 2 1. Highlights 2. Overview 3. Financial Results 4. Segment Report i) Group Overview ii) Internet Infrastructure iii) Online Advertising
Net sales Operating income Recurring profit. Net income per share diluted
 Consolidated Financial Results for the First Three Quarters of the Fiscal Year Ending March 31, 2018 (April 1, 2017 through December 31, 2017) (Prepared pursuant to Japanese GAAP) All financial information
INFORCE MANAGEMENT. A strategic asset. Paul EVANS CEO of AXA UK & Ireland Member of the AXA Group Executive Committee. Investor Day November 20, 2014
 INFORCE MANAGEMENT A strategic asset Investor Day November 20, 2014 Paul EVANS CEO of AXA UK & Ireland Member of the AXA Group Executive Committee Certain statements contained herein are forward-looking
PTC INC. FOURTH QUARTER FISCAL 2015 PREPARED REMARKS October 28, 2015
 PTC INC. FOURTH QUARTER FISCAL 2015 PREPARED REMARKS October 28, 2015 Please refer to the Important Disclosures section of these prepared remarks for important information about our operating metrics,
COMPANY OVERVIEW. February 7, 2019
 COMPANY OVERVIEW February 7, 2019 1 DISCLAIMERS This presentation contains forward-looking statements. All statements contained in this presentation other than statements of historical facts, including,
Caution Concerning Forward-Looking Statements
 Caution Concerning Forward-Looking Statements This presentation contains forward-looking statements within the meaning of the Private Securities Litigation Reform Act of 1995. Forward-looking statements
PTC SECOND QUARTER FISCAL 2017 PREPARED REMARKS APRIL 19, 2017
 PTC SECOND QUARTER FISCAL 2017 PREPARED REMARKS APRIL 19, 2017 Please refer to the Important Disclosures section of these prepared remarks for important information about our operating metrics (including
2018 SECOND QUARTER FINANCIAL RESULTS
 2018 SECOND QUARTER FINANCIAL RESULTS July 30, 2018 0 SAFE HARBOR STATEMENT The 2018 second quarter news release, conference call webcast, and the following slides contain forward-looking statements. The
Bottomline Technologies Reports Fourth Quarter Results
 Bottomline Technologies Reports Fourth Quarter Results 20% Growth in Subscription and Transaction Revenue Highlights Fourth Quarter PORTSMOUTH, N.H. August 9, 2018 Bottomline Technologies (NASDAQ:EPAY),
Responsible investment in growth
 Responsible investment in growth Issued: 1 March 2016 Legal notice This presentation has been prepared to inform investors and prospective investors in the secondary markets about the Group and does not
The Board of Directors met on March 6, 2018 and approved the audited 2017 financial statements.
 Mersen 2017 results: on-going positive momentum LIKE-FOR-LIKE INCREASE IN SALES OF 8% FOR THE YEAR OPERATING MARGIN BEFORE NON-RECURRING ITEMS OF 9.2% FOR THE YEAR, UP 170 BASIS POINTS ON 2016 VERY STRONG
FY2016 H1 Results Presentation. September 2016
 FY2016 H1 Results Presentation September 2016 Corporate Headlines Capital Structure Share Price (1 Sep 2016) $1.97 Fully paid ordinary shares 159.4m Options 0.0m Shareholders Founder -David Dicker 60.6m
Investor Update Philip Mezey, President and Chief Executive Officer
 Investor Update Philip Mezey, President and Chief Executive Officer Barbara Doyle, Vice President, Investor Relations March 2018 FORWARD LOOKING STATEMENTS Certain matters in this presentation and being
13,759. diluted. Equity ratio millions of yen 199,202. Total
 Consolidated Financial Results for the First Half of the Fiscal Year Y Ending March 31, 2018 (April 1, 2017 through September 30, 2017) ( Prepared pursuant to Japanese GAAP) All financial information has