|
|
|
- Steven Carr
- 5 years ago
- Views:
Transcription

1
2
3
4
5
6
7
8
9
10
11
12
13
14


15 Grow & diversify the economy Increase employment Strengthen Islamic values & national identity Offer a fulfilling & healthy life Enhance government effectiveness Enable social responsibility Lower the rate of unemployment from 11.6% to 7% Increase the Public Investment Fund s assets to over SAR 7 trillion Increase the private sector s contribution from 40% to 65% of GDP Raise the share of non-oil exports in non-oil GDP from 16% to 50% Increase the localization of oil and gas sectors from 40% to 75% Increase SME contribution to GDP from 20% to 35% Increase FDI from 3.8% to the international level of 5.7% of GDP Raise non-oil government revenue from SAR 163 billion to SAR 1 trillion Increase women s participation in the workforce from 22% to 30% Enriching the Hajj and Umrah Experience National Transformation Program PIF Program National Industrial Development and Development and Logistics Program Financial Sector Development Program Quality of Life Improvement Program National Companies Promotion Program Strategic Partnerships Program The Housing Program Privatization Program Saudi Character Enrichment Program Fiscal Balance Program
16


17

18
19
20
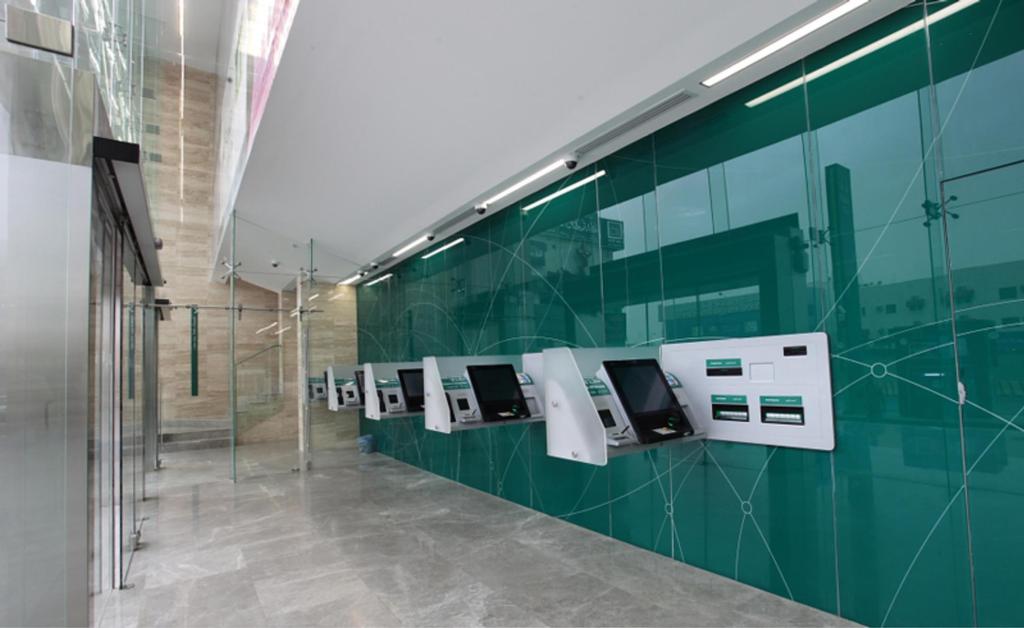
21 Continue expanding our distribution reach to acquire customers and grow market share Expand with smaller branches that are headcount efficient Optimize costs of existing branch network Equip branches with self-service/assisted-service technologies Enhance the in-branch sales and service model to improve customer experience


22 Mobile first - anytime, anywhere Consistently lead KSA banks in functionality and userexperience Expand end-to-end digital sales capability Expand subscription base and incentivize usage Leverage data and analytics to drive sales effectiveness


")


23 Grow market share in consumer finance Grow deposits in key segments (Mass/ Affluent/ GRE) Expand and optimize branch network Drive digital migration Continue improving customer satisfaction


24 Build a deal pipeline in V2030 target sectors Cross sell treasury and cash management Focus on portfolio quality and proactively manage risk Drive migration to digital channels Expand collection capacity and increase recoveries
25 Execute international hubs strategy Expand wholesale funding program Maintain the high quality/liquidity and profitability of the investment book Support the development of the sukuk capital markets Underpin Islamic product innovation


26 Grow recurring revenues by gathering more AUMs, launching new products, growing Corporate Savings business Set the stage for future market upturn by growing brokerage market share and continuing to invest in NCBC capabilities Build on market leadership, landmark IB mandates to support GREs as well as local and foreign institutional clients Continue to focus on increasing efficiency, improving productivity to bolster resilience


27 Resume branch expansion and expand digital channels to drive customer acquisition Strengthen underwriting and improve collections Increase automation and drive capacity optimization Instill NCB s principles (Customer excellence, robust governance, best-in-class technology)
28

29


30
31
32
33
34 1Q 2018 Total operating income declined 2% due to lower Corporate (-20%) and Treasury (-20%), partly offset by growth in Retail (+18%) and Capital Market (+39%) income. 1Q 2018 Net income improved 10.5% due to growth in Retail (+52%) and Capital Market (+75%), partly offset by a decline in Treasury (-30%) from lower operating income.
35
36
37 1Q 2018 total operating income declined 2% YoY despite a 2% improvement in net special commission income due mainly to lower investment-related income (-22%) and FX revenue (-19%), partly offset by higher fees from banking services income (+6%). Excluding the International business, 1Q 2018 total operating income was 1% lower YoY. International operating income was affected by 3% depreciation of average Turkish Lira rate as compared with 1Q 2017.
38 The 1Q 2018 net special commission margin increased by 7bps YoY to 3.59% due to improved yields (+12bps). Special commission expense for 1Q 2018 was 7% higher due to higher SAIBOR/LIBOR rates. Excluding the International business, domestic NSCI grew by 2% in 1Q 2018.
39 1Q 2018 fee and other income declined 9% YoY as 6% growth in fees from banking services was more than offset by a 22% decline in investment-related income and 19% lower FX revenue. The higher fees from banking services in 1Q 2018 were mainly driven by higher fees from investment management services, partly offset by lower financing and lending fees.
40 1Q 2018 operating expenses improved by 1% YoY. The cost to income ratio for 1Q 2018 was 35.0%, higher by 28bps compared to 1Q The cost base improvement was relatively broad-based, reflecting the continued strides made in digitization and productivity initiatives, lower depreciation as well as currency depreciation in the Turkish subsidiary. This was partly offset by VAT and cost of living allowance to employees announced this year.
41 Total assets declined 1% due to optimization of assets and funding mix. 1% financing increase mainly due to 2% increase in domestic financing partially offset by 5% decline in international financing impacted by 4% Turkish Lira depreciation. Overall financing trends were reflective of early signs of economic recovery but further muted by Turkish Lira depreciation. Investments declined 1% as a result of portfolio re-balancing.
42 Domestically, financing grew for the Corporate Segment (+2%) and Consumer segment (+1%) since 4Q Growth in Corporate segment comes from Services and Banking & financial sectors International financing declined 5% in 1Q 2018 due principally to weakened Turkish Lira.
43
44 NPL ratio declined in 1Q 2018 driven by proactive remedial management and write offs of fully provided loans. NPL coverage was higher at 165% as at 1Q 2018 because of the write offs as well as higher provision stock as a result of IFRS 9 adoption adjustments. Domestic CoR ratio significantly improved due to higher recoveries in both Corporate and Retail. International credit quality remained stable during 1Q 2018.
45 Corporate NPL ratio declined in 1Q 2018, in part due to write offs and proactive remedial management. Corporate NPL coverage ratio improved due to the above as well as higher provision stock as a result of IFRS 9 adoption adjustments. Consumer NPL ratio and coverage remain stable.
46
47 The investment portfolio is built on high quality securities with ~91% being investment grade. Since the resumption of KSA government debt issuance, NCB has actively participated in issues of longer term debt securities. The portfolio has been re-balancing towards floating rate securities in light of the rising interest-rate environment.
48 Customers deposits are the main source of funding and remained stable in 1Q CASA balances account for 77% of customers deposits.
49 As at 1Q 2018, the financing to customers deposit ratio was 81.8% and comfortably below the regulatory guidelines. HQLA balances risen by 2% compared to 4Q The average quarterly LCR improved to 198.6% from 177.3% in 4Q Basel III leverage ratio improved to 13.5% from 13.0% in 4Q 2017.
50 Capitalization remained strong and comfortably above the regulatory minima. Pillar I risk weighted assets decreased by 1% in 1Q 2018 principally by lower charge on residential real estate financing as recently allowed by SAMA. Common equity Tier 1 capital (CET1) is impacted by one time IFRS9 adjustment adoption please refer to page (46) for more details.
51
52 1Q 2018 net income rose 52% YoY driven principally by 18% operating income growth and a 158% improvement in impairment charge. NSCI for 1Q 2018 improved by 21% YoY due to a 5% increase in retail financing, better margins and higher current account growth. Fee income increased by 11% in 1Q 2018 YoY, mainly from financing-related activity. 1Q 2018 operating expenses remained flat YoY and the cost to income ratio improved to 43% from 51% a year earlier, reflecting continued digitization and productivity initiatives.
53 1Q 2018 net income increased 5% YoY as lower operating income (-20%) were more than offset by improvements in impairments (-115%). NSCI for 1Q 2018 declined 22% YoY as a result of repayments in 4Q 2017 that reduced the average balance by 8% compared with 1Q Fee income decreased by 17% YoY mainly lower lending and trade fees. 1Q 2018 operating expenses higher by 6% and the cost to income ratio increased by 32% YoY to 27.4%. The 1Q 2018 impairment charge declined 115% YoY due mainly to a significant recovery and one-time IFRS 9 adoption adjustment to retained earnings permissible by IFRS 9.
54 30% YoY drop in net income in 1Q 2018 due to a 20% reduction in operating income and higher impairments partly offset by a 22% improvement in operating expenses. Operating income in 1Q 2018 declined 20% YoY mainly due to lower NSCI and a reduction in investment income. Investment impairments were higher at SAR 99mn.
55 1Q 2018 net income increased by 75% YoY due to higher operating income (+39%) and improved operating efficiency. Operating income in 1Q 2018 rose 39% YoY due to higher fee and other income, mainly resulting from asset management. Cost to income improved to 39% in 1Q 2018 from 51% in 1Q 2017.
56 1Q 2018 net income increased 42% YoY on improving credit quality, despite declining operating income. 1Q 2018 operating expenses remains flat despite legislative inflationary increases in staff costs which was offset by the ongoing progress made in cost-optimization initiatives. The impairment charge for 1Q 2018 declined 25% due to limited new NPL formation, further aided by the Turkish Lira depreciation.
57 1Q 2018 net income increased 39% YoY on improving credit quality, despite declining operating income. 1Q 2018 operating expenses higher by 5% due to legislative inflationary increases in staff costs which was partly offset by the ongoing progress made in cost-optimization initiatives. The impairment charge for 1Q 2018 declined 22% due to limited new NPL formation.
58


59 Financial statements Earnings release Investor presentation Financial data pack (Excel)
National Commercial Bank. Investor Presentation. FY 2017 Results. NCB Investor Relations FY 2017 Investor Presentation 1
 National Commercial Bank Investor Presentation FY 7 Results FY 7 Investor Presentation Disclaimer The National Commercial Bank (NCB) prepared this presentation on a proprietary basis as general background
NCB reports 8.7% net income growth year-on-year to SAR 5.6 billion in 1H 2018
 Earnings Release NCB reports 8.7% net income growth year-on-year to SAR 5.6 billion in 1H 1H net income growth of 8.7% year-on-year to SAR 5.6 billion on higher operating income and lower impairment charges;
Abu Dhabi Commercial Bank PJSC ( ADCB or the Bank ) today reported its financial results for the year ended 31 December 2017.
 today reported its financial results for the year ended 31 December 2017.") Abu Dhabi Commercial Bank Sheikh Zayed Bin Sultan Street P. O. Box: 939, Abu Dhabi http://www.adcb.com ABU DHABI COMMERCIAL BANK PJSC REPORTS FULL YEAR NET PROFIT OF 4.278 BILLION, UP 3% YEAR ON YEAR FOURTH
Abu Dhabi Commercial Bank Sheikh Zayed Bin Sultan Street P. O. Box: 939, Abu Dhabi http://www.adcb.com ABU DHABI COMMERCIAL BANK PJSC REPORTS FULL YEAR NET PROFIT OF 4.278 BILLION, UP 3% YEAR ON YEAR FOURTH
Q Results Presentation. 18 April 2018
 Q1 218 Results Presentation 18 April 218 2 Important Information Disclaimer The material in this presentation is general background information about the activities of Emirates NBD Bank PJSC (Emirates
FY 2017 Results Presentation. 16 January 2018
 FY 217 Results Presentation 16 January 218 2 Important Information Disclaimer The material in this presentation is general background information about the activities of Emirates NBD Bank PJSC (Emirates
ABU DHABI COMMERCIAL BANK PJSC REPORTS FIRST QUARTER 2018 NET PROFIT OF AED BILLION, AN INCREASE OF 13% QUARTER ON QUARTER, AND 9% YEAR ON YEAR
 Abu Dhabi Commercial Bank Sheikh Zayed Bin Sultan Street P. O. Box: 939, Abu Dhabi http://www.adcb.com ABU DHABI COMMERCIAL BANK PJSC REPORTS FIRST QUARTER 2018 NET PROFIT OF AED 1.207 BILLION, AN INCREASE
Investor Relations Presentation Q3 2017
 Investor Relations Presentation Q3 2017 Table of Content 1 KSA Fact Sheet 3 2 Saudi Arabia 2030 Vision 4 3 Al Rajhi at a Glance 5 4 Recent International Recognition 6 5 Al Rajhi 2020 Strategy 7 6 Al Rajhi
Analysts Presentation 3 rd Quarter 2017 Financial Results. Dato' Khairussaleh Ramli Group Managing Director RHB Banking Group 27 November 2017
 Analysts Presentation 3 rd Quarter Financial Results Dato' Khairussaleh Ramli Group Managing Director RHB Banking Group 27 November Executive Summary 3 rd Quarter Financial Results Strategy Update Summary
Al Rajhi Bank Investor Presentation
 Al Rajhi Bank Investor Presentation 2Q 218 Results The Blue Chip Islamic Bank Al Rajhi Bank 2Q 218 Investor Presentation The Blue Chip Islamic Bank Table of Contents 1... The World's Leading Islamic Bank
Grupo Santander carried out its business in 2017 in a more favourable environment, one of the most positive in recent years.
 Message from José Antonio Álvarez Grupo Santander carried out its business in 2017 in a more favourable environment, one of the most positive in recent years. The global economy and, in particular, the
BRD - GROUP R E S U LT S 3 R D Q U AR T E R AN D F I R S T 9 M O N T H S N O V E M B E R
 BRD - GROUP R E S U LT S 3 R D Q U AR T E R AN D F I R S T 9 M O N T H S 2 0 1 7 0 6 N O V E M B E R 2 0 1 7 DISCLAIMER The consolidated and separate financial position and income statement for the period
H Results Presentation. 19 July 2017
 H1 2017 Results Presentation 19 July 2017 2 Important Information Disclaimer The material in this presentation is general background information about the activities of Emirates NBD Bank PJSC (Emirates
1Q18 Financial Results
 1Q18 Financial Results Analyst Meeting Presentation 23 April 2018 IMPORTANT DISCLAIMER: Information contained in this document has been prepared from several sources and the Bank does not confirm the accuracy
Second Quarter 2017 Results Presentation 27 July 2017
 Second Quarter 2017 Results Presentation 27 July 2017 Disclaimer: This material should be read as an overview of OCBC s current business activities and operating environment. It should not be solely relied
BBVA earns 4.32 billion in the first nine months
 Press release 10.30.2018 January-September 2018 BBVA earns 4.32 billion in the first nine months Transformation: Digital and mobile customers as well as digital sales continued to grow across all geographies,
Emirates NBD Announces First Quarter 2018 Results
 For immediate release Emirates NBD Announces First Quarter 2018 Results Net profit up 27% y-o-y and 10% q-o-q to AED 2.4 billion Dubai, 18 April 2018 Emirates NBD (DFM: EmiratesNBD), a leading bank in
ABU DHABI COMMERCIAL BANK PJSC REPORTS FIRST HALF 2018 NET PROFIT OF AED BILLION, SECOND QUARTER 2018 NET PROFIT OF AED 1.
 Abu Dhabi Commercial Bank Sheikh Zayed Bin Sultan Street P. O. Box: 939, Abu Dhabi http://www.adcb.com ABU DHABI COMMERCIAL BANK PJSC REPORTS FIRST HALF 2018 NET PROFIT OF AED 2.332 BILLION, SECOND QUARTER
TMB Bank Plc. Building the Best Transactional Bank. Make THE Difference. Day with Executive Management
 TMB Bank Plc. Building the Best Transactional Bank Day with Executive Management November 1, 215 Make THE Difference AGENDA 3Q15 Financial Performance 9M15 Financial Performance Looking Forward [2] Executive
First Quarter 2017 Results Presentation 09 May 2017
 First Quarter 2017 Results Presentation 09 May 2017 Disclaimer: This material should be read as an overview of OCBC s current business activities and operating environment. It should not be solely relied
SIAM COMMERCIAL BANK PCL.
 SIAM COMMERCIAL BANK PCL. 1Q17 Financial Results Analyst Meeting Presentation April 21 st, 2017 IMPORTANT DISCLAIMER: Information contained in this document has been prepared from several sources and the
Al Rajhi Bank Investor Presentation
 Al Rajhi Bank Investor Presentation Q 28 Results The Blue Chip Islamic Bank Al Rajhi Bank Q 28 Investor Presentation The Blue Chip Islamic Bank Table of Contents... The World's Leading Islamic Bank 3 2...
Hatton National Bank. 1H 2018 Performance
 Hatton National Bank 1H 2018 Performance 1H 2018 (Rs Bn) 1H 2017 (Rs Bn) Growth % Interest 51.0 46.5 9.6% Interest Expenses (29.0) (27.4) 5.6% Net Operating NII 22.0 19.1 15.3% Net Fee 4.4 4.1 8.8% Net
Analysts Presentation 3 rd Quarter 2018 Financial Results. Dato' Khairussaleh Ramli Group Managing Director RHB Banking Group 27 November 2018
 Analysts Presentation 3 rd Quarter Financial Results Dato' Khairussaleh Ramli Group Managing Director RHB Banking Group 27 November Executive Summary 3 rd Quarter Financial Results Strategy Update Summary
No. 11/2018. Performance of the Thai Banking System in 2017
 No. 11/218 Performance of the Thai Banking System in 217 Ms. Daranee Saeju, Senior Director, Financial Institutions Strategy Department, Bank of Thailand, reported on the Thai banking system s performance
Financial Results March Investor Presentation
 Financial Results March 2018 Investor Presentation 0 Key Highlights Consolidated PBT for Q1 18 is Rs 7.4 bn compared to Rs 14.1 bn in Q1 17 Domestic PBT is Rs 3.6 bn lower YoY at Rs 9.7 Bn, mainly due
INVESTOR PRESENTATION
 INVESTOR PRESENTATION CLSA ASEAN CORPORATE ACCESS FORUM 2013 14 th March 2013 Agenda Page 1. Review of Result 2012 3-19 2. Future Positioning 21-23 IMPORTANT DISCLAIMER: Information contained in this document
RHB Bank Posts 16% Growth in Net Profit at RM1.16 billion for First Half of 2018
 RHB Bank Posts 16% Growth in Net Profit at RM1.16 billion for First Half of 2018 Total income grew 8.1% Y-o-Y Pre-tax profit rose 19.3% to RM1.56 billion Cost-to-income ratio improved further to 49.1%
Robust performance, supported by record operating income, optimal management of cost of funds and lower impairment charges (2018 vs.
 Abu Dhabi Commercial Bank Sheikh Zayed Bin Sultan Street P. O. Box: 939, Abu Dhabi http://www.adcb.com ABU DHABI COMMERCIAL BANK PJSC REPORTS FULL YEAR NET PROFIT OF AED 4.840 BILLION, UP 13% YEAR ON YEAR
ABU DHABI COMMERCIAL BANK PJSC REPORTS NINE MONTH 2018 NET PROFIT OF AED BILLION THIRD QUARTER 2018 NET PROFIT OF AED 1.
 Abu Dhabi Commercial Bank Sheikh Zayed Street P. O. Box: 939, Abu Dhabi http://www.adcb.com ABU DHABI COMMERCIAL BANK PJSC REPORTS NINE MONTH 2018 NET PROFIT OF AED 3.483 BILLION THIRD QUARTER 2018 NET
1Q18 EARNINGS PRESENTATION. Based on BRSA Consolidated Financials April 26 th 2018
 1Q18 EARNINGS PRESENTATION Based on BRSA Consolidated Financials April 26 th 2018 ROBUST EARNINGS PERFORMANCE NET INCOME (TL million) 2.2% ROAA vs. 1.9% in 2017 31% 2,011 1,537 1,702 18% 18.3% ROAE vs.
Analysts Presentation First Half 2018 Financial Results. Dato' Khairussaleh Ramli Group Managing Director RHB Banking Group 30 August 2018
 Analysts Presentation First Half Financial Results Dato' Khairussaleh Ramli Group Managing Director RHB Banking Group 30 August Executive Summary H1 Financial Results Strategy Update Summary and Outlook
Q Results Presentation. 19 April 2017
 Q1 2017 Results Presentation 19 April 2017 2 Important Information Disclaimer The material in this presentation is general background information about the activities of Emirates NBD Bank PJSC (Emirates
Forward-looking Statements
 2017 Annual Results Forward-looking Statements This presentation and subsequent discussion may contain certain forward-looking statements with respect to the financial condition, results of operations
BBVA posts highest quarterly profit in three years: 1.34 billion (+12 percent YoY)
") Press release 04.27.2018 January - March 2018 BBVA posts highest quarterly profit in three years: 1.34 billion (+12 percent YoY) Transformation: Digital sales grew in all regions and accounted for 37 percent
Press release 04.27.2018 January - March 2018 BBVA posts highest quarterly profit in three years: 1.34 billion (+12 percent YoY) Transformation: Digital sales grew in all regions and accounted for 37 percent
No. 53/2018 Performance of the Thai Banking System in the Second Quarter of 2018 Ms. Daranee Saeju, Senior Director, Financial Institutions Strategy
 No. 53/218 Performance of the Thai Banking System in the Second Quarter of 218 Ms. Daranee Saeju, Senior Director, Financial Institutions Strategy Department, Bank of Thailand, reported on the Thai banking
Telephone Conference Q2-18 Johan Torgeby President & CEO 17 July, 2018
 Telephone Conference Q2-18 Johan Torgeby President & CEO 17 July, 2018 Highlights Jan-Jun 2018 Pick-up in customer activity following a muted start of the year Broad based demand for SEB s services Strong
(Following results for the year ended 31 December 2015 are subject to approval by the UAE Central Bank)
") 27 January 2016 NBAD Reports 4 th Quarter and Full-Year 2015 Results (Following results for the year ended 31 December 2015 are subject to approval by the UAE Central Bank) FY 15 Net Profits of AED 5.23
27 January 2016 NBAD Reports 4 th Quarter and Full-Year 2015 Results (Following results for the year ended 31 December 2015 are subject to approval by the UAE Central Bank) FY 15 Net Profits of AED 5.23
Results: BBVA earns 2.31 billion in first half (+25.9%)
") Press release 07.27.2017 January-June 2017 Results: BBVA earns 2.31 billion in first half (+25.9%) Income: Net interest income reached a seven-quarter high in Q2. In the year to June, this item, plus fees
Press release 07.27.2017 January-June 2017 Results: BBVA earns 2.31 billion in first half (+25.9%) Income: Net interest income reached a seven-quarter high in Q2. In the year to June, this item, plus fees
Press Release FOR IMMEDIATE RELEASE
 Press Release FOR IMMEDIATE RELEASE The financial information reported herein is based on the condensed interim consolidated (unaudited) information for the three-month period ended,, and on the audited
Performance of the Thai Banking System in the Second Quarter of 2017
 No. 38/ Performance of the Thai Banking System in the Second Quarter of Ms. Daranee Saeju, Senior Director, Financial Institutions Strategy Department, Bank of Thailand, reported on the Thai banking system
AmBank Group Recorded Net Profit of RM368.7 million for Q1FY2016
 Media Release Your Bank. Malaysia s Bank. AmBank. TM 19 August 2015 AmBank Group Recorded Net Profit of RM368.7 million for Q1FY2016 AMMB Holdings Berhad (AmBank Group or the Group) today announced the
2017 Full Year Results Presentation 14 February 2018
 2017 Full Year Results Presentation 14 February 2018 Disclaimer: This material should be read as an overview of OCBC s current business activities and operating environment. It should not be solely relied
Forward-looking Statements
 2016 Annual Results Forward-looking Statements This presentation and subsequent discussion may contain certain forward-looking statements with respect to the financial condition, results of operations
Half Year Results for the Six Months to 31 January 2019
 Close Brothers Group plc T +44 (0)20 7655 3100 10 Crown Place E enquiries@closebrothers.com London EC2A 4FT W www.closebrothers.com Registered in England No. 520241 Half Year Results for the Six Months
Management Discussion and Analysis
 Management Discussion and Analysis For the second quarter and first half ended June 30, 2018 The Siam Commercial Bank Public Company Limited The Siam Commercial Bank Public Company Limited 9 Ratchadapisek
THE COMMERCIAL BANK (P.S.Q.C.)
") THE COMMERCIAL BANK (P.S.Q.C.) Financial Results For the full year ended 31 December 2017 Forward Looking Statements This presentation and subsequent discussion may contain certain forward-looking statements
THE COMMERCIAL BANK (P.S.Q.C.) Financial Results For the full year ended 31 December 2017 Forward Looking Statements This presentation and subsequent discussion may contain certain forward-looking statements
Standard Chartered first half profit up 9% to US$3.95bn
 Standard Chartered first half profit up 9% to US$3.95bn Strong momentum combined with diversity of performance provides real resilience Highlights: Group income climbs 9%, with growth across our markets.
4Q18 Quarterly Supplement
 4Q18 Quarterly Supplement January 15, 2019 2019 Wells Fargo & Company. All rights reserved. Table of contents 4Q18 Results 4Q18 Highlights Pages 2 4Q18 Earnings 3 2018 year-over-year results 4 Balance
Emirates NBD Announces Full Year 2018 Results
 For immediate release Emirates NBD Announces Full Year 2018 Results AED 10 billion Net Profit up 20% y-o-y on higher income Total assets surpass AED 500 billion Proposed dividend of 40% Dubai, 16 January
Standard Chartered Bank Kenya Limited 2011 Full Year Results Announcement
 Standard Chartered Bank Kenya Limited 2011 Full Year Results Announcement Introduction The Standard Chartered Bank story is one of consistent delivery and sustained growth. We have the right strategy,
News Release News Release
 News Release Ref No. 02/2016 DBS FIRST-QUARTER NET PROFIT RISES 6% TO SGD 1.20 BILLION * * * Total income up 5% to new high of SGD 2.87 billion SINGAPORE, 3 May 2016 DBS Group achieved net profit of SGD
4Q17 and FY2017 Financial Results. January 19, 2018
 4Q17 and FY2017 Financial Results January 19, 2018 Forward-looking statements and use of key performance metrics and non-gaap Financial Measures This document contains forward-looking statements within
4Q14 and FY 2014 Financial Results. January 26, 2015
 4Q14 and FY 2014 Financial Results January 26, 2015 Forward-looking statements This document contains forward-looking statements within the Private Securities Litigation Reform Act of 1995. Statements
Third Quarter 2017 Results Presentation 26 October 2017
 Third Quarter 2017 Results Presentation 26 October 2017 Disclaimer: This material should be read as an overview of OCBC s current business activities and operating environment. It should not be solely
3Q17 Financial Results. October 20, 2017
 3Q17 Financial Results October 20, 2017 Forward-looking statements and use of key performance metrics and Non-GAAP financial measures This document contains forward-looking statements within the Private
AmBank Group Reports Net Profit of RM878.7 million for 9MFY18
 Media Release 28 February 2018 AmBank Group Reports Net Profit of RM878.7 million for 9MFY18 AMMB Holdings Berhad (AmBank Group or the Group) today announced the financial results for the 9 months ended
Investor Presentation. June 2018
 Investor Presentation June 2018 Contents Bank Muscat Introduction Operating environment Bank Muscat business - Overview Financial Performance Annexure Note: The financial information is updated as of 30
R E S U LT S 1 ST Q U A R T E R M A Y
 BRD - GROUP R E S U LT S 1 ST Q U A R T E R 2 0 1 8 M A Y 2 0 1 8 DISCLAIMER The consolidated and separate financial position and income statement for the period ended March 31, 2018 were examined by the
RHB Bank s Net Profit Grows 9.4% to RM1.0 billion for First Half 2017
 FOR IMMEDIATE RELEASE RHB Bank s Net Profit Grows 9.4% to RM1.0 billion for First Half 2017 Pre-tax profit of RM1.3 billion, up by 7% Cost-to-income ratio at 49.3% Gross loans of RM156.6 billion, up by
TMB Bank Plc. Moving toward Digital Banking. Make THE Difference. Investor Presentation. 1H16 and 2Q16 Performance Update
 TMB Bank Plc. Moving toward Digital Banking Investor Presentation 1H16 and 2Q16 Performance Update Make THE Difference AGENDA 1H16 & 2Q16 Financial Performance Asset quality Upcoming Digital Banking [2]
3Q17 Quarterly Supplement
 3Q17 Quarterly Supplement October 13, 2017 2017 Wells Fargo & Company. All rights reserved. Table of contents 3Q17 Results 3Q17 Highlights Year-over-year results Page 2 Balance Sheet and credit overview
INVESTOR PRESENTATION
 INVESTOR PRESENTATION Fourth Quarter 2018 Conference call December 5, 2018 at 11:00 am lbcfg.ca1 Caution Regarding Forward-Looking Statements In this document and in other documents filed with Canadian
Abu Dhabi Commercial Bank PJSC Earnings presentation
 Abu Dhabi Commercial Bank PJSC 2017 Earnings presentation January 2018 Disclaimer THIS PRESENTATION IS NOT AN OFFER OR SOLICITATION OF AN OFFER TO BUY OR SELL SECURITIES. IT IS SOLELY FOR USE AS AN INVESTOR
ABU DHABI COMMERCIAL BANK PJSC REPORTS NINE MONTH 2017 NET PROFIT OF AED BILLION, UP 2% YEAR ON YEAR
 Abu Dhabi Commercial Bank Sheikh Zayed Street P. O. Box: 939, Abu Dhabi http://www.adcb.com ABU DHABI COMMERCIAL BANK PJSC REPORTS NINE MONTH 2017 NET PROFIT OF AED 3.206 BILLION, UP 2% YEAR ON YEAR THIRD
Nine Month 2016 Profit after Tax at Euro 22.2 million
 Nine Month 2016 Profit after Tax at Euro 22.2 million Main Highlights - Profitable 9M 2016 driven by de-escalation of Cost of Risk and improvement in Pre-Provision Income. - Core Pre-Provision income 1
Key Performance Highlights (H1FY11 vs H1FY10)
") Press release, 12 November 2010 AMMB delivers a strong performance, PATMI of RM 701.2 mil for H1FY11, up 40.7% HoH Higher revenues and lower allowances, and good loans and deposit growth Proposed interim
Press release, 12 November 2010 AMMB delivers a strong performance, PATMI of RM 701.2 mil for H1FY11, up 40.7% HoH Higher revenues and lower allowances, and good loans and deposit growth Proposed interim
Financial Results December Investor Presentation
 Financial Results December 2018 Investor Presentation 0 Key Highlights PAT for 2018 is Rs 12.4 bn vs Rs 8.8 bn in 2017. PBT is Rs 21.6 bn for 2018 compared to Rs 29.5 bn in 2017 Ex settlement payment,
3Q18 Quarterly Supplement
 3Q18 Quarterly Supplement October 12, 2018 2018 Wells Fargo & Company. All rights reserved. Table of contents 3Q18 Results 3Q18 Highlights Pages 2 3Q18 Earnings 3 Year-over-year results 4 Balance Sheet
Bank of America Merrill Lynch 28 September, Jan Erik Back CFO
 Bank of America Merrill Lynch 28 September, 2016 Jan Erik Back CFO 1 Well diversified business in a strong economic environment Operates principally in economically robust AAA rated European countries
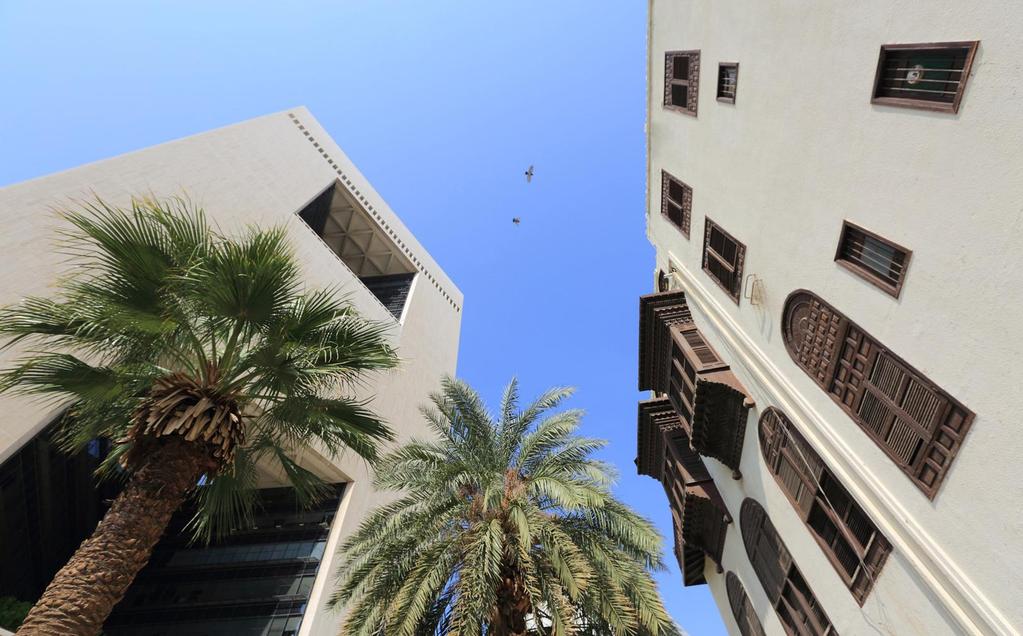
Saudi Arabia Beyond Oil
 Saudi Arabia Beyond Oil Saudi Arabia at a Glance tal Population 1.7 illion entage of Youth er 25) 50% GDP $646 Billion Population Growth Rate 2.5% FDI Inward Sto $224 Billion Source : 1) UNCTAD 2016 2)
PRESS RELEASE. Results at a Glance
 PRESS RELEASE AXIS BANK ANNOUNCES FINANCIAL RESULTS FOR THE QUARTER AND NINE-MONTHS ENDED 31 st DECEMBER 2017 Results at a Glance Financial performance: o Q3FY18 PAT up 25% YOY & 68% QOQ to `726 crores;
9M17. IFRS Financials 30 September IFRS Earnings Presentation 9M17
 9M17 Earnings Presentation IFRS Financials 30 September 2017 ROBUST & HIGH QUALITY EARNINGS PERFORMANCE Net Income (TL million) Cumulative 37% Quarterly ROAE 18.3% 14.8% @2016YE ROAA 2.2% 1.8% @2016YE
(millions of Canadian dollars) Quarter ended October 31 Year ended October % Change % Change
 Quarter ended October 31 Year ended October % Change % Change") PRESS RELEASE FOURTH QUARTER 2015 National Bank reports its results for the fourth quarter and year-end of 2015 and raises its quarterly dividend by 4% to 54 cents per share The financial information reported
PRESS RELEASE FOURTH QUARTER 2015 National Bank reports its results for the fourth quarter and year-end of 2015 and raises its quarterly dividend by 4% to 54 cents per share The financial information reported
HSBC Bank plc Annual Repor t and A ccounts 20 Additional Information 2013
 HSBC Bank plc Additional Information 2013 Additional Information Presentation of Information This document, which should be read in conjunction with the HSBC Bank plc Annual Report and Accounts 2013, contains
ICICI Group: Strategy & Performance. February 2010
 ICICI Group: Strategy & Performance February 2010 Certain statements in these slides are forward-looking statements. These statements are based on management's current expectations and are subject to uncertainty
RHB BANK BERHAD 51 st ANNUAL GENERAL MEETING. Dato Khairussaleh Ramli Group Managing Director Presentation To Shareholders 26 th April 2017
 RHB BANK BERHAD 51 st ANNUAL GENERAL MEETING Dato Khairussaleh Ramli Group Managing Director Presentation To Shareholders 26 th April 2017 Overview FY2016 Performance Review IGNITE 2017 2017 Outlook 2016
2017 EARNINGS PRESENTATION. Based on IFRS Consolidated Financials
 2017 EARNINGS PRESENTATION Based on IFRS Consolidated Financials ROBUST & HIGH QUALITY EARNINGS PERFORMANCE NET INCOME (TL million) 860 Free Prov. 15.6% ROAE vs. 14.8% in 2016 5,052 6,094 1.8% ROAA vs.
Analysts Presentation 1 st Quarter 2018 Financial Results. Dato' Khairussaleh Ramli Group Managing Director RHB Banking Group 31 May 2018
 Analysts Presentation 1 st Quarter 2018 Financial Results Dato' Khairussaleh Ramli Group Managing Director RHB Banking Group 31 May 2018 Executive Summary 1 st Quarter 2018 Financial Results Summary and
Abu Dhabi Islamic Bank net profit for 2013 increases 20.7% to AED billion
 MANAGEMENT DISCUSSION & ANALYSIS FOR THE YEAR ENDING 31 DECEMBER Abu Dhabi Islamic Bank net profit for increases 20.7% to AED 1.450 billion Total assets increased 19.8% to AED 103.2 billion Group Financial
FGB reports net profit of AED 2.87 Billion in the first half of 2015, up by 7%
 Press Release FGB reports net profit of AED 2.87 Billion in the first half of 2015, up by 7% FGB achieved a H1 2015 Group Net Profit of AED 2.87 Billion, up 7% from H1 2014. Second quarter net profit up
ANALYSTS/FUND MANAGERS BRIEFING FY2016 RESULTS. 1 March
 ANALYSTS/FUND MANAGERS BRIEFING FY2016 RESULTS 1 March 2017 KEY HIGHLIGHTS & RATIOS PROFIT BEFORE TAX BY SEGMENTS STRATEGIC DIRECTION AFFINITY PROGRAM PROPOSED REORGANIZATION Summary of Key Highlights
Bank of Georgia Holdings PLC announces Q and nine months ended 30 September 2014 results
 Bank of Georgia Holdings PLC announces Q3 2014 and nine months ended 30 September 2014 results Bank of Georgia Holdings PLC (LSE: BGEO LN), the holding company of Georgia s leading bank JSC Bank of Georgia
ICICI Group: Performance & Strategy. May 2015
 ICICI Group: Performance & Strategy May 2015 Certain statements in these slides are forward-looking statements. These statements are based on management's current expectations and are subject to uncertainty
Introduction to mbank Group The most successful organic growth story in Poland
 Introduction to mbank Group The most successful organic growth story in Poland May 2016 mbank Group in a snapshot General description Key financial data (PLN M) Set up in 1986, mbank (originally BRE Export
No. 29/2018 Performance of the Thai Banking System in the first Quarter of 2018
 No. 29/218 Performance of the Thai Banking System in the first Quarter of 218 Ms. Daranee Saeju, Senior Director, Financial Institutions Strategy Department, Bank of Thailand, reported on the Thai banking
3Q18 Financial Results. October 19, 2018
 3Q18 Financial Results October 19, 2018 Forward-looking statements and use of key performance metrics and non-gaap financial measures This document contains forward-looking statements within the Private
AmBank Group achieves RM461.8 million PAT in Q1FY2013
 AmBank Group achieves RM461.8 million PAT in Q1FY2013 Higher net-interest income and lower allowances Improved Profitability Q1FY2013 (RM mil) Q1FY2013 vs Q1FY2012 1 Profit after tax ( PAT ) 461.8 5.1%
ADIB 2017 Net Profit rises 17.7% to AED 2.3 billion
 MANAGEMENT DISCUSSION & ANALYSIS FOR THE YEAR ENDED 31 DECEMBER 2017 ADIB 2017 Net Profit rises 17.7% to AED 2.3 billion Group Financial Highlights Income Statement: FYR 2017 vs. FYR Group net revenues
Erste Group posts net profit of EUR million in H1 17. Press conference 4 August Page 1
 Erste Group posts net profit of EUR 624.7 million in H1 17 Press conference 4 August 2017 Page 1 Business environment Central and Eastern Europe is the fastest growing EU region 2017 2018 Real GDP growth
Financial Ambition 2017 ING Investor Day Patrick Flynn CFO, Member Executive Board ING Group. Amsterdam - 31 March 2014
 Financial Ambition 2017 ING Investor Day Patrick Flynn CFO, Member Executive Board ING Group Amsterdam - 31 March 2014 www.ing.com We entered the final phase to become a pure Bank 2009-2011 2012-2013 2014-2017
Results: BBVA posts profit of 2.82 billion (+45.9% y-o-y) excluding corporate operations
 excluding corporate operations") January September 2015 Results: BBVA posts profit of 2.82 billion (+45.9% y-o-y) excluding corporate operations Income: Quarterly gross income grew 14.5% y-o-y, to a record 5.98 billion. The cumulative
January September 2015 Results: BBVA posts profit of 2.82 billion (+45.9% y-o-y) excluding corporate operations Income: Quarterly gross income grew 14.5% y-o-y, to a record 5.98 billion. The cumulative
Financial Review. Management Discussion and Analysis 79 Consolidated Financial Statements 87
 Financial Review Management Discussion and Analysis 79 Consolidated Financial Statements 87 78 Danamon Annual Report 2007 Management Discussion and Analysis Consolidated Financial Data Operating Results
Interim Financial Report 2017
 Interim Financial Report 2017 ABN AMRO Bank N.V. II Notes to the reader Executive Board Report Introduction This is the Interim Financial Report for the year 2017 of ABN AMRO Bank N.V. (ABN AMRO Bank).
Emirates NBD Announces Full Year 2016 Results
 For immediate release Emirates NBD Announces Full Year 2016 Results Net profit up 2% to AED 7.24 billion Proposed dividend maintained at 40% Dubai, 16 January 2017 Emirates NBD (DFM: EmiratesNBD), the
2Q18 Quarterly Supplement
 2Q18 Quarterly Supplement July 13, 2018 2018 Wells Fargo & Company. All rights reserved. Table of contents 2Q18 Results 2Q18 Highlights Page 2 Update on customer remediation for previously disclosed matters
Results: BBVA earned 2.64 billion (+0.9%); excluding corporate operations, net income was 3.75 billion, up 43.3%
; excluding corporate operations, net income was 3.75 billion, up 43.3%") January December 2015 Results: BBVA earned 2.64 billion (+0.9%); excluding corporate operations, net income was 3.75 billion, up 43.3% Record income: Gross income for the full year and for the fourth quarter
January December 2015 Results: BBVA earned 2.64 billion (+0.9%); excluding corporate operations, net income was 3.75 billion, up 43.3% Record income: Gross income for the full year and for the fourth quarter
R E S U LT S 3 R D Q U A R T E R AN D 9 M O N T H S N O V E M B E R
 BRD - GROUP R E S U LT S 3 R D Q U A R T E R AN D 9 M O N T H S 2 0 1 8 9 N O V E M B E R 2 0 1 8 DISCLAIMER The consolidated and separate financial position and income statement for the period ended September
ING Challengers & Growth Markets
 ING Challengers & Growth Markets Goldman Sachs European Financials Conference Aris Bogdaneris, Head of Challengers & Growth Markets Paris 9 June 2016 Key points Think Forward strategy at work in Challengers
BANK PEKAO S.A. GROUP
 BANK PEKAO S.A. GROUP Financial results after 4Q 2005 Strong results, positive outlook Warsaw, 21 February, 2006 DISCLAIMER Forward looking statements This presentation contains certain forward-looking
Presentation to Investors and Analysts
 First Quarter 2018 Results Presentation to Investors and Analysts April 25, 2018 Disclaimer This material does not purport to contain all of the information that you may wish to consider. This material