management discussion analysis Itaú Unibanco Holding S.A.
|
|
|
- Jack Brent Lindsey
- 6 years ago
- Views:
Transcription
1 management discussion analysis 3 rd quarter of 2013
2 (This page was left in blank intentionally) 4
3 Executive Summary Information and financial indicators of (Itaú Unibanco) are presented below. Highlights (except where indicated) 3Q13 2Q13 3Q12 9M13 9M12 Statement of Income Recurring Net Income 4,022 3,622 3,412 11,156 10,541 Net Income 3,995 3,583 3,372 11,050 10,102 Operating Revenues (1) 19,612 19,166 19,179 57,596 58,542 Managerial Financial Margin (2) 11,835 11,573 12,811 34,935 39,549 Shares (R$) Recurring Net Income per share (3) Net Income per share (3) Number of Outstanding Shares at the end of period in thousands 4,956,804 4,967,393 4,970,068 4,956,804 4,970,068 Average price of non-voting share on the last trading day of the period (4) Book Value per share Dividends/JCP net of taxes (5) ,913 1,959 Dividends/JCP net of taxes (5) per share Market Capitalization (6) 156, , , , ,394 Market Capitalization (6) (US$ Million) 70,151 63,964 68,154 70,151 68,154 Performance Ratios (%) Recurring Return on Average Equity Annualized (7) 20.9% 19.3% 18.5% 19.8% 19.4% Return on Average Equity Annualized (7) 20.8% 19.1% 17.5% 19.6% 18.2% Recurring Return on Average Assets Annualized (8) 1.5% 1.4% 1.5% 1.4% 1.5% Return on Average Assets Annualized (8) 1.5% 1.4% 1.5% 1.4% 1.5% Solvency Ratio (BIS Ratio) - Economic Financial-Consolidated 17.5% 17.5% 17.5% 17.5% 17.5% Annualized Credit Margin (9) 10.9% 11.4% 12.6% 11.3% 13.1% Annualized Net Interest Margin with Clients (9) 9.1% 9.4% 10.8% 9.2% 11.1% Annualized Net Interest Margin with Credit after Provision for Credit Risk (9) 7.4% 7.2% 6.9% 7.2% 7.2% Annualized Net Interest Margin with Clients after Provision for Credit Risk (9) 6.5% 6.4% 6.5% 6.3% 6.7% Nonperforming Loans Index (NPL over 90 days) 3.9% 4.2% 5.1% 3.9% 5.1% Nonperforming Loans Index (NPL 15 to 90 days) 3.0% 3.4% 4.2% 3.0% 4.2% Coverage Ratio (Provision for Loan and Lease Losses/NPL over 90 days) 170% 165% 149% 170% 149% Efficiency Ratio (ER) (10) 48.2% 49.1% 45.0% 48.4% 44.8% Risk Adjusted Efficiency Ratio (RAER) (10) 68.4% 72.1% 75.3% 71.1% 74.5% Balance Sheet Sep 30,13 Jun 30,13 Sep 30,12 Total Assets 1,082,787 1,057, ,216 Total Loan Portfolio, including Sureties, Endorsements and Guarantees 456, , ,603 Loan Operations (A) 387, , ,810 Sureties, Endorsements and Guarantees 69,522 65,900 57,792 Deposits + Debentures + Securities + Borrowings and Onlending (B) (11) 505, , ,341 Loan Operations/Funding (A/B) 76.5% 76.0% 75.9% Stockholders' Equity 78,260 75,781 78,979 Other Relevant Data Assets Under Administration 622, , ,458 Employees (Individuals) 94,280 94,820 97,030 Employees in Brazil (Individuals) 87,440 88,059 90,427 Employees Abroad (Individuals) 6,840 6,761 6,603 Number of Points of Service 32,956 32,924 32,794 Branches (Units) 4,105 4,088 4,081 CSB Client Service Branches (Units) ATM Automated Teller Machines (Units) (12) 27,981 27,962 27,817 Macroeconomic Indicators 3Q13 2Q13 3Q12 9M13 9M12 EMBI Brazil Risk CDI In the Period (%) 2.1% 1.8% 1.9% 5.6% 6.6% Dollar Exchange Rate Quotation in R$ Dollar Exchange Rate Variation in the Period (%) 0.6% 10.0% 0.5% 9.1% 8.3% Euro Exchange Rate Quotation in R$ Euro Exchange Rate Variation in the Period (%) 4.7% 11.5% 2.0% 12.0% 7.3% IGP-M In the Period (%) 1.9% 0.9% 3.8% 3.7% 7.1% Note: 3Q13, 2Q13, 3Q12, 9M13 and 9M12 refer to the 3rd quarter of 2013, 2nd quarter of 2013, 3rd quarter of 2012, nine months to September 2013 and nine months to September 2012, respectively. (1) Operating Revenues are the sum of Managerial Financial Margin, Banking Service Fees and Income from Banking Charges, Other Operating Income and Result from Insurance, Pension Plan and Capitalization Operations Before Retained Claims and Selling Expenses, Equity in Earnings of Affiliates and Non-Operating Income; (2) Described on pages 16 to 18; (3) Calculated based on the weighted average number of outstanding shares; (4) The number of outstanding shares was adjusted to reflect the share bonus of 10% granted on May 20, 2013; (5) JCP Interest on Net Equity. Declared amounts paid/accrued; (6) Total number of outstanding shares (common and non-voting shares) multiplied by the average price of the non-voting share on the last trading day in the period; (7) Annualized Return was calculated by dividing Net Income by Average Stockholders Equity. The quotient was multiplied by the number of periods in the year to derive the annualized rate. The calculation bases of the returns were adjusted by the amount of dividends that have not yet been approved in stockholders or Board meetings, proposed after the balance sheet date; (8) Return was calculated by dividing Net Income by Average Assets. The quotient of this division was multiplied by the number of periods of the year to derive the annualized rate. (9) It does not include financial margin with the market. See details on page 17; (10) For more details on the calculation methodology of both Efficiency and Risk Adjusted Efficiency ratios, please see page 25; (11) As described on page 32; (12) It includes ESBs (electronic service branches) and service points in third-parties establishments. 5
4 Executive Summary Net Income and Recurring Net Income Our recurring net income totaled R$4,022 million in the third quarter of This amount is due to the elimination of non-recurring events, which are presented in the table below, from net income of R$3,995 million for the period. Non-Recurring Events Net of Tax Effects Note: Impacts of the non-recurring events, described above, are net of tax effects further details are presented in Note 22-K of the Financial Statements 3Q13 2Q13 3Q12 9M13 9M12 Recurring Net Income 4,022 3,622 3,412 11,156 10,541 Non Recurring Events (27) (39) (40) (106) (439) Economic Plans (a) (27) (39) (40) (106) (133) Market value based on the share price BPI (b) (305) Net Income 3,995 3,583 3,372 11,050 10,102 Non-Recurring Events of the nine months of 2013 and comparative periods of 2012 (a) Provision for Economic Plans Provision for losses arising from economic plans that were in effect in Brazil in the 1980's. (b) Impairment BPI: In the second quarter of 2012, we sold our interest of 18.87% in Banco Português de Investimento to the La Caixa group and received approximately 93 million. This transaction negatively impacted net income of that quarter by R$205 million, net of taxes, and positively impacted stockholder s equity by R$106 million. This item also includes the effects of the adjustments to market value that took place in the first half of 2012, totaling R$97 million. Effects of the Reclassifications of the Managerial Statement of Income Since the first quarter of 2013, we apply the consolidation criteria for the managerial results in our MD&A. The adjustments in accounting figures only change the order of the account components and, therefore, do not affect the net income disclosed. With these reclassifications, we improved the presentation of our results to allow better comparability and understanding in the assessment of our performance. In addition, we adjusted the tax effects of hedges of investments abroad, which were originally included in tax expenses (PIS and COFINS), and income tax and social contribution on net income, and were reclassified to the financial margin, and non-recurring effects. Our strategy for the exchange risk management of capital invested abroad is intended to avoid impacts from foreign exchange variations on net income. For this purpose, the foreign exchange risk is neutralized and investments are remunerated in Brazilian reais through the use of derivative financial instruments. Our strategy to hedge investments abroad also considers the impact of all related tax effects. It should be noted that, in the third quarter of 2013, the Brazilian real depreciated 0.6% in relation to the U.S. dollar and 4.7% in relation to the Euro, compared with a depreciation of 10.0% and 11.5%, respectively, in the previous quarter. Operations Highlights During the first nine months of 2013, important steps were taken to expand our operations in Brazil and in Latin America. In Brazil, in line with our strategy of higher growth in service fees, we purchased Credicard for R$2.767 billion, strengthening our leadership in the credit card market, and purchased % of the BMG Seguradora s shares from the controlling stockholders of Banco BMG. In Latin America, we entered into an agreement with the retailer Cencosud to jointly develop the consumer financing business in Chile and Argentina and also announced an agreement to purchase the retail operations of Citibank in Uruguay. These transactions are still awaiting for the approval of regulatory bodies and therefore have not yet impacted our net income for the third quarter of In August 2013, we renewed the business cooperation agreement with Fiat Group Automobilies S.p.A. and Fiat Automóveis S.A. for 10 years, which provides exclusivity for new vehicle financing in Fiat promotional campaigns, and for the use the Fiat brand in activities related to vehicle financing. In October 2013, Redecard adopted the brand REDE. REDE is among the largest merchant acquirers in the world, responsible for acquiring, capturing, transmitting, and processing, and financial settlement, mainly for credit and debit card transactions. 6
5 Executive Summary The reconciliations between the Accounting and Managerial Statements of Income for the last two quarters are presented below. Conciliation between the Accounting and Managerial Statements 3 rd Quarter of 2013 Accounting Non-recurring Effects Tax Effect of Hedge Managerial Reclassifications Operating Revenues 19, (242) 19,612 Managerial Financial Margin 11, (84) 11,835 Financial Margin with Clients 11, (84) 11,495 Financial Margin with Market Banking Service Fees and Income from Banking Charges 6, (468) 5,591 Results from Insurance, Pension Plan and Capitalization - - Operations Before Retained Claims and Selling Expenses 1, ,187 Other Operating Income (90) - Equity in Earnings of Affiliates and Other Investments (106) - Non-operating Income (19) - Loan and Retained Claim Losses Net of Recovery (3,751) - - (4) (3,755) Expenses for Allowance for Loan and Lease Losses (4,533) - - (4) (4,537) Income from Recovery of Loans Written Off as Losses 1, ,297 Retained Claims (515) (515) Other Operating Income/(Expenses) (10,188) 40 (19) 177 (9,989) Non-interest Expenses (8,920) (8,703) Tax Expenses for ISS, PIS, Cofins and Other Taxes (1,010) - (19) - (1,029) Selling Expenses from Insurance (258) (258) Income before Tax and Profit Sharing 5, (68) 5,868 Income Tax and Social Contribution (1,601) (18) (185) 8 (1,796) Profit Sharing (60) Minority Interests (50) (50) Net Income 3, ,022 Managerial Conciliation between the Accounting and Managerial Statements 2 nd Quarter of 2013 Accounting Non-recurring Effects Tax Effect of Hedge Managerial Reclassifications Operating Revenues 17, ,698 (215) 19,166 Managerial Financial Margin 9, ,698 (104) 11,573 Financial Margin with Clients 11, (104) 11,305 Financial Margin with Market (1,430) - 1, Banking Service Fees and Income from Banking Charges 5, (466) 5,399 Results from Insurance, Pension Plan and Capitalization - - Operations Before Retained Claims and Selling Expenses 1, ,194 Other Operating Income (96) - Equity in Earnings of Affiliates and Other Investments (92) - Non-operating Income (6) Loan and Retained Claim Losses Net of Recovery (4,159) - - (5) (4,164) Expenses for Allowance for Loan and Lease Losses (4,907) - - (5) (4,912) Income from Recovery of Loans Written Off as Losses 1, ,262 Retained Claims (514) (514) Other Operating Income/(Expenses) (9,973) 41 (183) 150 (9,965) Non-interest Expenses (8,816) (8,626) Tax Expenses for ISS, PIS, Cofins and Other Taxes (907) - (183) - (1,090) Selling Expenses from Insurance (249) (249) Income before Tax and Profit Sharing 3, ,515 (69) 5,038 Income Tax and Social Contribution 139 (26) (1,515) 9 (1,393) Profit Sharing (60) Minority Interests (24) (24) Net Income 3, ,622 Managerial 7
6 Executive Summary We present below a perspective of the income statement highlighting the Operating Revenues, which are composed of the sum of revenues from banking, insurance, pension plans and capitalization operations. Statement of Income Operating Revenues Perspective Variation 3Q13 2Q13 3Q12 9M13 9M12 3Q13-2Q13 3Q13-3Q12 9M13-9M12 Operating Revenues 19,612 19,166 19,179 57,596 58, % % (947) -1.6% Managerial Financial Margin 11,835 11,573 12,811 34,935 39, % (976) -7.6% (4,615) -11.7% Financial Margin with Clients 11,495 11,305 11,963 33,730 36, % (468) -3.9% (2,885) -7.9% Financial Margin with Market ,205 2, % (509) -60.0% (1,729) -58.9% Banking Service Fees and Income from Banking Charges 5,591 5,399 4,338 16,111 12, % 1, % 3, % Result from Insurance, Pension Plan and Capitalization Operations Before Retained Claims and Selling Expenses 2,187 2,194 2,030 6,550 6,003 (8) -0.3% % % Loan and Retained Claim Losses Net of Recovery (3,755) (4,164) (5,510) (12,339) (16,480) % 1, % 4, % Expenses for Allowance for Loan and Lease Losses (4,537) (4,912) (6,120) (14,388) (18,469) % 1, % 4, % Income from Recovery of Loans Written Off as Losses 1,297 1,262 1,174 3,645 3, % % % Retained Claims (515) (514) (563) (1,596) (1,539) (1) 0.2% % (57) 3.7% Operating Margin 15,858 15,003 13,669 45,256 42, % 2, % 3, % Other Operating Income/(Expenses) (9,989) (9,965) (9,189) (29,522) (27,909) (24) 0.2% (800) 8.7% (1,613) 5.8% Non-interest Expenses (8,703) (8,626) (7,898) (25,608) (24,059) (77) 0.9% (804) 10.2% (1,549) 6.4% Tax Expenses for ISS, PIS, Cofins and Other Taxes (1,029) (1,090) (1,019) (3,160) (3,088) % (10) 1.0% (72) 2.3% Selling Expenses From Insurance (258) (249) (272) (754) (763) (9) 3.6% % 8-1.1% Income before Tax and Profit Sharing 5,868 5,038 4,480 15,734 14, % 1, % 1, % Income Tax and Social Contribution (1,796) (1,393) (1,053) (4,484) (3,597) (404) 29.0% (744) 70.6% (887) 24.7% Minority Interests in Subsidiaries (50) (24) (15) (95) (16) (27) - (35) - (79) - Recurring Net Income 4,022 3,622 3,412 11,156 10, % % % We present below a perspective of the income statement highlighting the Managerial Financial Margin. Statement of Income Managerial Financial Margin Perspective Variation 3Q13 2Q13 3Q12 9M13 9M12 3Q13-2Q13 3Q13-3Q12 9M13-9M12 Managerial Financial Margin 11,835 11,573 12,811 34,935 39, % (976) -7.6% (4,615) -11.7% Financial Margin with Clients 11,495 11,305 11,963 33,730 36, % (468) -3.9% (2,885) -7.9% Financial Margin with Market ,205 2, % (509) -60.0% (1,729) -58.9% Results from Loan and Lease Losses (3,240) (3,650) (4,946) (10,743) (14,940) % 1, % 4, % Expenses for Allowance for Loan and Lease Losses (4,537) (4,912) (6,120) (14,388) (18,469) % 1, % 4, % Income from Recovery of Loans Written Off as Losses 1,297 1,262 1,174 3,645 3, % % % Net Result from Financial Operations 8,595 7,923 7,865 24,192 24, % % (418) -1.7% Other Operating Income/(Expenses) (2,727) (2,886) (3,385) (8,457) (10,456) % % 1, % Banking Service Fees and Income from Banking Charges 5,591 5,399 4,338 16,111 12, % 1, % 3, % Result from Insurance, Pension Plan and Capitalization Operations 1,414 1,431 1,195 4,199 3,701 (18) -1.2% % % Non-interest Expenses (8,703) (8,626) (7,898) (25,608) (24,059) (77) 0.9% (804) 10.2% (1,549) 6.4% Tax Expenses for ISS, PIS, Cofins and Other Taxes (1,029) (1,090) (1,019) (3,160) (3,088) % (10) 1.0% (72) 2.3% Income before Tax and Profit Sharing 5,868 5,038 4,480 15,734 14, % 1, % 1, % Income Tax and Social Contribution (1,796) (1,393) (1,053) (4,484) (3,597) (404) 29.0% (744) 70.6% (887) 24.7% Minority Interests in Subsidiaries (50) (24) (15) (95) (16) (27) - (35) - (79) - Recurring Net Income 4,022 3,622 3,412 11,156 10, % % % 8
7 Executive Summary Net Income 19,203 19,518 19,845 19,179 19,932 18,817 19,166 19,612 4,022 3,746 3,681 3,544 3,585 3,426 3,304 3,412 3,372 3,502 3,512 3,492 3,472 3,622 3,583 3,995 4Q11 1Q12 2Q12 3Q12 4Q12 1Q13 2Q13 3Q13 4Q11 1Q12 2Q12 3Q12 4Q12 1Q13 2Q13 3Q13 Recurring Net Income Net Income Recurring net income for the third quarter of 2013 amounted to R$4,022 million, representing an increase of 11.0% in relation to the second quarter of We highlight that our income before taxes and profit sharing increased 16.5%. The increase in net income for the third quarter of 2013 in relation to the previous quarter is mainly due to the lower expenses for allowance for loan and lease losses and to the increases of 3.6% in service fees, of 2.8% in recovery of credits written off as losses, and of 2.3% in our managerial financial margin. These increases were partially offset by the increase of 0.9% in non-interest expenses, mainly due to the salary adjustment related to the collective bargaining labor agreement. Managerial Financial Margin The managerial financial margin for the third quarter of 2013 totaled R$11,835 million, an increase of R$262 million in relation to the second quarter of Our financial margin with clients totaled R$11,495 million, an increase of R$190 million, mainly due to the increase in the volume of loan operations and the increase in the Brazilian benchmark rate (Selic), partially offset by the changes in the mix of products and clients. The financial margin with the market amounted to R$340 million, an increase of R$72 million from the previous quarter. 3Q13 2Q ,495 11,305 11,835 11,573 Annualized Return on Average Equity % 1Q13 4Q12 3Q12 2Q ,128 10,929 11,732 11,963 12,393 11,526 12,608 12,811 13, Q ,259 13, Operating Revenues Q12 3Q12 4Q12 1Q13 2Q13 3Q13 ROE Annualized Return on Average Equity ROE from Insurance, Pension Plan and Capitalization - considering the allocated capital for the operation ROE from Banking - without excess capital, considering a capital ratio of 13.75% (11% from Basel II with a 25% safety margin) The annualized recurring return on equity reached 20.9% in the third quarter of 2013, whereas it reached 19.7% over the last 12 months. On September 30, 2013, stockholders equity totaled R$ 78.3 billion, a 3.3% increase in relation to the previous quarter. The recurring return of our insurance, pension plan and capitalization operations reached 36.5% in the third quarter of 2013, considering the net income in relation to the allocated capital of these operations. In the third quarter of 2013, operating revenues, which represent revenues from banking, and insurance, pension plan and capitalization operations, totaled R$19,612 million, increasing 2.3% when compared to the previous quarter and 2.3% to the third quarter of The main components of operating revenues and other items of the results are presented below. 4Q11 1,039 10,027 Financial Margin with Market 10,573 10,902 3,880 4,839 4,862 11,795 10,504 10,349 Financial Margin with Clients 12,834 Our managerial financial margin recorded a decrease of R$4,615 million when compared to the first nine months of This decrease is due to the decrease of R$1,729 million in the financial margin with the market, in addition to the decrease of R$2,.885 million in the financial margin with clients, which is due to the changes in the loan portfolio mix (impact of R$1,910 million), the fall of the average SELIC rate (effect of R$527 million), and the acquisition of minority shareholders' interest in REDE carried out in the fourth quarter of 2012 that decreased our cash position (effect of R$774 million). Managerial Financial Margin, net of the Allowance for Loan Losses Our financial margin with clients, net of expenses for allowance for loan losses, increased for the fourth consecutive quarter, as a result of the adoption of a policy of stricter selectivity in origination, which gave rise to lower default levels. 9,699 9,937 9,874 4,781 4,531 3,854 3,650 3,240 6,148 5,734 6,040 5,724 5,818 5,845 6,287 6,634 4Q11 1Q12 g 2Q12 3Q12 4Q12 1Q13 2Q13 3Q13 Loan Loss Provision Expenses, net of recovery Financial Margin of Credit (-) Provision for loan and lease losses, net of recovery 9
8 Executive Summary Banking Services Fees and Income from Banking Charges 4,432 4,311 4,341 4,338 5,149 5,122 5,399 5,591 The expenses for provisions for loan losses decreased R$375 million in the quarter (7.6%) to R$4,537 million. The income from the recovery of credits written off as losses increased R$35 million (2.8%), totaling R$1,297 million. Non-Interest Expenses 3.9% 3.6% 3.7% 3.4% 3.4% 3.2% 3.3% 3.3% 4Q11 1Q12 2Q12 3Q12 4Q12 1Q13 2Q13 3Q13 8,327 7,956 8,205 7,898 8,491 8,280 8,626 8,703 Banking service fees, including income from banking charges increased R$192 million (3.6%) in the third quarter of 2013 when compared to the previous quarter, totaling R$5,591 million. In comparison to the first nine months of the previous year, these revenues increased 24.0%, boosted by the acquisition of minority shareholders interest in REDE at the end of Even if the effect of the proportional increase of our stake in REDE were disregarded, the increase would have totaled of 14.2%. Result from Insurance, Pension Plan and Capitalization Q11 1Q12 2Q12 3Q12 4Q12 1Q13 2Q13 3Q13 Non Interest Expenses () Non Interest Expenses / Average Assets Non-interest expenses increased 0.9% in the third quarter of Personnel expenses increased 2.7%, mainly due to the collective bargaining labor agreement with effects as from September 2013, which increased our personnel expenses by R$161 million in the quarter. If this increase were disregarded, personnel expenses would have decreased by R$58 million (1.5%) and total expenses by R$84 million (1.0%). Administrative expenses decreased R$14 million in the quarter, mainly due to the decrease in financial system services. 1,227 1,195 1,402 1,354 1,431 1,414 In the first nine months of 2013, non-interest expenses increased R$1,549 million (6.4%) when compared to the same period of the previous year. If the effect of consolidation of REDE were disregarded, this increase would have totaled 4.4% (lower than the inflation rate of the period). 2Q12 3Q12 4Q12 1Q13 2Q13 3Q13 Result from Insurance, Pension Plan and Capitalization Loss Ratio (%) Note: The loss ratio of the graphic does not consider the company Itauseg Saúde and our 30% interest in Porto Seguro. In the third quarter of 2013, the result of insurance, pension plan and capitalization operations reached R$1,414 million, an increase of R$219 million compared to the previous year whereas the loss ratio improved 530 basis points in the same period. Risk-Adjusted Efficiency Ratio (R.A.E.R) (*) and Efficiency Ratio (E.R.) Result from Loan Losses, Net of Recovery 3,998 5,587 4,998 4,995 4,946 6,210 6,139 6,120 4,531 5,741 3,854 3,650 4,939 4,912 3,240 4,537 1,589 1,212 1,144 1,174 1,210 1,086 1,262 1,297 4Q11 1Q12 2Q12 3Q12 4Q12 1Q13 2Q13 3Q13 Expenses for Provision for Loan and Lease Losses Income from Recovery of Loans Written Off as Losses Result from Loan Losses The result from loan losses, net of recovery, decreased 11.2% in relation to the previous quarter, totaling R$3,240 million in the quarter, which was the sixth consecutive quarter of decrease. In comparison to the first nine months of the 2012, these results decreased 28.1% or R$4,197 million in the first nine months of Q11 1Q12 2Q12 3Q12 4Q12 1Q13 2Q13 3Q13 Quarter E.R. (%) Quarter R.A.E.R. (%) E.R. Cumulative figure of the last 12 months (%) R.A.E.R. Cumulative figure of the last 12 months (%) (*) The criteria for calculating the ratios are detailed on page 25. In the third quarter of 2013, the risk-adjusted efficiency ratio, in the full concept (including all expenses and also claims and expenses for allowance for loan losses), reached 68.4%, a decrease of 370 basis points from the previous quarter. In the last 12 months, the risk-adjusted efficiency ratio reached 71.7%. In the third quarter of 2013, the efficiency ratio, in the full concept (including all expenses except claims and loan loss provisions), reached 48.2%, a decrease of 90 basis points from the previous quarter, this was the first reduction observed since the fourth quarter of In the 12-month period, the efficiency ratio reached 48.0%, an increase of 270 basis points from the same period of the previous year. The main reason behind this increase in the last quarters was the change of loan portfolio mix and the resulting revenue retraction. 10
9 Executive Summary Balance Sheet Assets On September 30, 2013, our assets totaled R$1.08 trillion, corresponding to an increase of 2.4% (R$25.1 billion) when compared to the previous quarter and of 12.8% in relation to the same period of the previous year. This growth was due to the increases of 5.3% (R$9.7 billion) in short-term interbank investments, 5.8% (R$4.0 billion) in interbank and interbranch accounts, 2.1% (R$7.8 billion) in loan, lease and other credit operations and 6.3% (R$3.1 billion) in the foreign exchange portfolio. Noteworthy was the 2.8% decrease in the allowance for Sep 30,13 Jun 30,13 Sep 30,12 sep/13 - jun/13 Variation sep/13 - sep/12 Current and Long-term Assets 1,068,222 1,043, , % 14.0% Cash and Cash Equivalents 14,466 14,671 13, % 10.4% Short-term Interbank Investments 193, , , % 18.3% Securities and Derivative Financial Instruments 272, , , % 16.0% Interbank and Interbranch Accounts 73,878 69,855 68, % 7.4% Loan, Lease and Other Loan Operations 387, , , % 7.6% (Allowance for Loan Losses) (25,653) (26,399) (27,682) -2.8% -7.3% Other Assets 153, , , % 22.3% Foreign Exchange Portfolio 52,989 49,851 40, % 29.4% Other 100, ,389 84, % 18.9% Permanent Assets 14,565 13,734 23, % -37.1% Investments 3,068 2,996 3, % -7.7% Fixed and Operating Lease Assets 6,108 5,834 5, % 14.6% Intangible Assets and Goodwill 5,388 4,904 14, % -62.8% Total Assets 1,082,787 1,057, , % 12.8% loan and lease losses, although our loan portfolio increased 2.1% in the period. In the past twelve months, the increase of R$122.6 billion mainly arises from the increases of R$37.6 billion in securities and derivative financial instruments, of R$29.9 billion in short-term interbank investments and of R$27.2 billion in loan, lease and other loan operations. Balance Sheet Liabilities and Equity Sep 30,13 Jun 30,13 Sep 30,12 sep/13 - jun/13 Variation sep/13 - sep/12 Current and Long-Term Liabilities 1,001, , , % 13.9% Deposits 252, , , % 8.8% Demand Deposits 37,817 38,665 29, % 26.8% Savings Deposits 98,228 92,324 77, % 26.9% Interbank Deposits 7,680 7,056 9, % -19.3% Time Deposits 108, , , % -5.7% Deposits Received under Securities Repurchase Agreements 295, , , % 20.3% Fund from Acceptances and Issue of Securities 50,672 53,202 57, % -11.2% Interbank and Interbranch Accounts 12,991 8,337 8, % 55.4% Borrowings and Onlendings 73,301 69,139 56, % 28.9% Derivative Financial Instruments 9,205 11,530 9, % 0.9% Technical Provisions for Insurance, Pension Plans and Capitalization 98,758 97,447 87, % 13.1% Other Liabilities 209, , , % 14.1% Subordinated Debt 54,394 53,813 48, % 12.1% Foreign Exchange Portfolio 53,315 50,168 41, % 29.6% Other 101, ,063 93, % 8.3% Deferred Income 1,085 1, % 33.5% Minority Interest in Subsidiaries 1,842 1,796 1, % 64.3% Stockholders' Equity 78,260 75,781 78, % -0.9% Total Liabilities and Equity 1,082,787 1,057, , % 12.8% Our stockholders equity reached R$78,260 million, an increase of R$2,478 million in the third quarter of 2013 despite the impact of the mark-to-market of available-forsale securities (R$224 million) and the repurchase of shares for treasury (R$406 million). Liabilities grew 2.4%, driven by the increases of 6.4% (R$5.9 billion) in savings deposits, 2.0% (R$5.9 billion) in deposits received under securities repurchase agreements, 55.8% (R$ 4.7 billion) in interbank and interbranch accounts, 6.0% (R$ 4.2 billion) in borrowings and onlending and 6.3% (R$3.1 billion) in foreign exchange portfolio, which were partially offset by the drops of 4.8% (R$2.5 billion) in funds from acceptances and issue of securities, 20.2% (R$ 2.3 billion) in derivative financial instruments and 2.2% in demand deposits. In 12 months, we highlight the increases of R$49.9 billion in deposits received under repurchase agreements, of R$20.8 billion in saving deposits, of R$16.4 billion in borrowings and onlending and of R$12.2 billion in the foreign exchange portfolio. 11
10 Executive Summary Loan Portfolio with Endorsements and Sureties As of September 30, 2013, our total loan portfolio (including sureties, endorsements and private securities) reached R$481,017 million, growing 2.9% compared to the second quarter of 2013 and 9.9% compared to the same period of the previous year. Disregarding the vehicle portfolio, the increase in our loan portfolio would have been of 3.8% in the quarter and of 14.3% in the 12-month period. In the individuals segment, the highlight was the growth of lowrisk loan portfolios: payroll loans, which increased 11.6% in the quarter and of 64.0% in the 12-month period, and mortgage loan portfolios, which increased 8.1% in the quarter, and of 34.9% in the 12-month period. The companies segment, without considering private securities, grew 2.6% in the quarter and 9.1% in the 12-month period. The corporate portfolio increased 4.2% in relation to the previous quarter and 16.9% in the past 12 months, whereas the very small, small and middle market companies portfolio decreased 0.7% in the third quarter of 2013 and 4.1% in relation to September Considering the private security operations, the companies segment recorded a 3.1% increase compared to the second quarter of 2013 and 10.1% compared to Our operations in Latin America grew 5.8% in the quarter and reached R$36,354 million. In 12 months, the growth was 32.4%. Excluding the effect of the foreign exchange variation, the growth of this portfolio was 5.1% compared to the second quarter of 2013 and 20.6% year-on-year. The balance of endorsements and sureties reached R$69,522 million on September 30, 2013, representing an increase of 5.5% in the second quarter and of 20.3% in the past 12 months, mainly due to the increase in the portfolio of large companies, which grew 5.5% in relation to the previous quarter and 20.4% in relation to the same period of the previous year. Variation Sep 30,13 Jun 30,13 Dec 31,12 Sep 30,12 sep/13 sep/13 sep/13 jun/13 dec/12 sep/12 Individuals 156, , , , % 3.8% 5.4% Credit Card 43,078 41,621 40,614 36, % 6.1% 17.4% Personal Loans 27,293 27,185 26,999 28, % 1.1% -3.2% Payroll Loans (1) 20,579 18,442 13,551 12, % 51.9% 64.0% Vehicles 42,733 45,302 51,220 54, % -16.6% -20.9% Mortgage Loans (2) 22,515 20,836 18,047 16, % 24.8% 34.9% Companies 264, , , , % 6.9% 9.1% Corporate 178, , , , % 12.9% 16.9% Very Small, Small and Middle Market (3) 85,782 86,405 88,959 89, % -3.6% -4.1% Latin America (4) 36,354 34,355 29,293 27, % 24.1% 32.4% Total with Endorsements and Sureties 456, , , , % 7.0% 9.3% Corporate - Private Securities (5) 24,455 22,400 22,652 20, % 8.0% 22.1% Total with Endorsements, Sureties and Private Securities 481, , , , % 7.1% 9.9% Total with Endorsements, Sureties and Private Securities (ex-vehicles) 438, , , , % 10.1% 14.3% Endorsements and Sureties 69,522 65,900 60,310 57, % 15.3% 20.3% Individuals % 188.0% 194.3% Corporate 62,553 59,274 54,184 51, % 15.4% 20.4% Very Small, Small and Middle Market 3,645 3,673 3,774 3, % -3.4% -2.3% Latin America (4) 2,743 2,561 2,151 1, % 27.5% 44.5% (1) It includes operations originated by the institution and acquired operations. On September 30, 2013, the portfolio of Itaú BMG Consignado reached R$5,610 million. (2) The table does not include co-obligation in mortgage loan assignments in the amount of R$296.7 million in the 4Q11. (3) It includes Rural Loans to Individuals. (4) It includes Argentina, Chile, Colombia, Paraguay and Uruguay. (5) It includes Debentures, CRI and Commercial Paper. Note: Mortgage and Rural Loan portfolios from the companies segment are allocated according to the client s size. For more details, please see page 29. Loan Portfolio Currency Disclosure R$ billion NPL Ratio (overdue 90 days) Sep/13 Jun/ % 6.7% 7.3% 7.5% 6.9% 6.7% 6.4% 6.0% Mar/13 Dec/12 Sep/12 Jun/ % 3.5% 5.1% 5.2% 5.1% 4.8% 3.7% 3.5% 3.3% 3.2% 4.5% 2.9% 4.2% 2.5% 3.9% 2.3% Mar/ Dec/ Dec/11 Mar/12 Jun/12 Sep/12 Dec/12 Mar/13 Jun/13 Sep/13 Foreign Currency Local Currency On September 30, 2013, R$94.8 billion of our loan portfolio was denominated in or indexed to foreign currencies and increased 3.6% in the quarter. The highlight in this portfolio is the increase of 5.8% in our operations in Latin America. Individuals Total Companies The NPL ratio for operations more than 90 days overdue (NPL 90) decreased 30 basis points when compared to the second quarter of 2013 and 120 basis points when compared to September 2012, and reached the lowest level since the merger of Itaú and Unibanco in November
11 Executive Summary 2013 Outlook The table below, we reiterated our current expectations for the year 2013: 2013 Outlook Actual Total Loan Portfolio Growth of 8% to 11% 9.9% (12M) Loan Loss Provision Between R$ 19 billion and R$ 22 billion R$14.4 (9M13) Service Fees and Result of Insurance 1 Growth of 15% to 18% 21.7% (9M13/9M12) Non-Interest Expenses Growth of 4% to 6% 6.4% (9M13/9M12) 4.4% (100% REDE 2012) (9M13/9M12) Risk-Adjusted Efficiency Ratio Improvement of 200 to 400 bps bps (9M13/9M12) (1) Service Fees (+) Income from Insurance, Pension Plan and Capitalization Operations (-) Expenses for Claims (-) Selling Expenses for Insurance, Pension Plan and Capitalization. Although the growth plans and projections of results presented above are based on assumptions of management and information available in the market to date, these expectations involve inaccuracies and risks that are difficult to anticipate and there may be, therefore, results or consequences that differ from those anticipated. This information is not a guarantee of future performance. The use of these expectations should take into consideration the risks and uncertainties that involve any activities and that are out of our control. These risks and uncertainties include, and are not limited to, our ability to perceive the dimension of the synergies projected and their timing, political and economic changes, volatility in interest and foreign exchange rates, technological changes, inflation, financial disintermediation, competitive pressures over products, prices, changes in tax legislation, among others. 13
12 ( This page was left in blank intentionally) 14
13 analysis of net income 3 rd quarter of 2013
14 Analysis of Net Income Managerial Financial Margin Our managerial financial margin for the third quarter of 2013 totaled R$11,835 million. This amount corresponds to an increase of R$262 million (2.3%) compared to the second quarter of In the first nine months of 2013, there was a decrease of R$4,615 Financial Margin with Clients 3QT13 2Q13 9M13 9M12 million (11.7%) compared to the same period of The main drivers of these variations are presented below: Variation 3Q13 2Q13 9M13 9M12 Financial Margin with Clients 11,495 11,305 33,730 36, % (2,885) -7.9% Interest Rate-Sensitive 1,295 1,059 3,288 3, % (607) -15.6% Spread-Sensitive 10,200 10,246 30,442 32,720 (46) -0.4% (2,279) -7.0% Financial Margin with Market ,205 2, % (1,729) -58.9% Total 11,835 11,573 34,935 39, % (4,615) -11.7% The managerial financial margin with clients arises from the use of financial products by our clients, including both account and non-account holders. In the third quarter of 2013, the financial margin with clients totaled R$11,495 million, corresponding to an increase of 1.7% in relation to the previous quarter, impacted by the increase in the average balance of loan operations, the higher number of calendar days and the increase in the Brazilian benchmark rate (SELIC), which were offset by the credit mix that currently favors the growth of lower spread and risk products and segments. For a better understanding of the financial margin, we divided the operations into two different groups: financial margin of operations that are sensitive to interest rate variations, and financial margin of operations that are sensitive to spread variations. Interest Rate-Sensitive Operations The financial margin of operations that are sensitive to interest rates totaled R$1,295 million in the quarter, which corresponds to a 22.3% increase in relation to the previous quarter, mainly due to an increase in the balance of operations in Brazilian reais that are subject to the SELIC rate, which was offset by a decrease in the average balance of operations in U.S. dollars, which consist of investments in U.S. Treasury Bonds. The increase in the Brazilian SELIC rate in the quarter positively impacted the financial margin that is sensitive to this variation by R$199 million. When compared to the first nine months of 2013, the same factor negatively impacted the result of these operations by approximately R$527 million. The detailed evolution of these margins is shown on the next page of this report. Annualized Rate of Interest Rate-Sensitive Operations 9.0% 8.4% 7.0% 7.1% Spread-Sensitive Operations 3Q13 2Q13 5.9% 5.8% Variation 3Q13 2Q13 Average Balance 67,703 66,141 1, % Financial Margin 1,295 1, % Annualized Rate 7.6% 6.4% 120 bps Average SELIC - Annualized Rate 8.5% 7.4% 110 bps 6.4% 7.6% 4Q11 1Q12 2Q12 3Q12 4Q12 1Q13 2Q13 3Q13 The financial margin of spread-sensitive operations amounted to R$10,200 million in the period, corresponding to a decrease of 0.4%, or R$46 million, from the previous quarter. The credit spread dropped 50 basis points but after the expense with the allowance for loan losses, net of credit recovery, this indicator reached 7.4%, an increase of 20 basis points. The spread of other interest-bearing assets considered in this analysis reached 1.7% and the combined spread of spread-sensitive operations dropped 50 basis points, to 9.3%, in the third quarter of Annualized Rate of Spread-Sensitive Operations Variation 3Q13 2Q13 3Q13 2Q13 Average Balance 433, ,298 17, % Financial Margin 10,200 10,246 (46) -0.4% Annualized Rate 9.3% 9.9% -60 bps 11.3% 12.0% 12.1% 11.4% 10.4% 9.6% 9.9% 9.3% 4Q11 1Q12 2Q12 3Q12 4Q12 1Q13 2Q13 3Q13 Managerial Financial Margin with Market The financial margin with the market basically arises from treasury transactions that include Asset and Liability Management (ALM) and proprietary portfolio management. In the third quarter of 2013, the financial margin with the market amounted to R$340 million, an increase of R$72 million from the previous quarter. This variation was mainly due to the higher results of fixed-rate positions and to the sale of Cetip and BM&FBovespa shares. We present below the evolution of our financial margin with the market ,039 1, , Q11 1Q12 2Q12 3Q12 4Q12 1Q13 2Q13 3Q13 g Sales of Cetip/BM&FBovespa Shares Financial Margin with Market (ex-sales of Shares) Moving Average for 1 year of Financial Margin with Market (ex-sales of Shares) 16
15 Analysis of Net Income Managerial Financial Margin with Clients As a result of the changes described above, the Net Interest Margin NIM, which is the annualized rate of the managerial financial margin with clients and does not take into consideration the financial margin with the market, reached 9.1% in the third quarter of Average Balance Taking into consideration the financial margin with clients after the expenses for allowance for loan losses, net of the recovery of credits written off as losses, the risk adjusted NIM reached 6.5%, an increase of 10 basis point. 3Q13 2Q13 9M13 Financial Margin Average Rate (p.y.) Average Balance Financial Margin Average Rate (p.y.) Average Balance Financial Margin Average Rate (p.y.) Demand Deposits + Floatings 48,763 45,104 46,016 (-) Reserve Requirements (16,933) (15,729) (15,791) Contingent Liabilities (-) Deposits in guarantee of Contingent Liabilities 3,213 3,256 3,099 Tax and Social Security obligations (-) Deposits in guarantee 17,107 16,126 16,490 Working Capital (Equity + Minority Interests - Permanent Assets - Capital Allocated to Treasury - Cash Equivalents Abroad) 48,929 47,888 47,806 (-) Tax Credits (40,048) (37,661) (38,172) Interest Rate-Sensitive Operations in Brazil 61,031 1, % 58,984 1, % 59,447 3, % Interest Rate-Sensitive Operations Abroad 6, % 7, % 7, % Interest Rate Sensitive Margin with Clients (A) 67,703 1, % 66,141 1, % 66,471 3, % Cash and Cash Equivalents + Interbank Deposits + Securities (*) 71,173 63,286 71,146 Interbank and Interbranch Accounts (**) 4,777 4,777 4,369 Spread-Sensitive Margin with Clients Other Assets 75, % 68, % 75, % Loans, Leasing and Other Credits 384, , ,948 (Allowance for Loan Losses) (26,067) (26,721) (26,665) Spread-Sensitive Margin with Clients Credit (B) 358,042 9, % 348,236 9, % 348,283 29, % Spread-Sensitive Margin with Clients (C) 433,992 10, % 416,298 10, % 423,798 30, % Net Interest Margin with Clients (D = A+C) 501,695 11, % 482,439 11, % 490,269 33, % Provision for Loan and Lease Losses (E) (4,537) (4,912) (14,388) Recovery of Credits Written Off as Losses (F) 1,297 1,262 3,645 Net Interest Margin with Credit after Provision for Credit Risk (G = B+E+F) 358,042 6, % 348,236 6, % 348,283 18, % Net Interest Margin after Provision for Credit Risk (H = D+E+F) 501,695 8, % 482,439 7, % 490,269 22, % (*) Cash and Cash Equivalents + Interbank Deposits + Securities (-) Interbank Deposits related to Repurchase Liability (-) Derivative financial instruments (-) Assets Guaranteeing PGBL/VGBL and Insurance Technical Provisions (-) Operations Sensitive to Variations in Interest Rate; (**) Net of reserve requirements (Central Bank). Net Interest Margin with Clients and Net Interest Margin of Credit before and after Provision for Credit Risk 13.4% 13.4% 12.7% 12.6% 12.3% 11.4% 11.3% 11.0% 10.8% 10.7% 9.8% 8.3% 7.8% 7.3% 7.4% 7.4% 6.9% 6.9% 11.6% 11.4% 10.9% 9.8% 9.4% 9.1% 9.1% 8.4% 7.6% 6.9% 6.9% 7.0% 7.2% 7.4% 6.8% 6.5% 6.5% 6.0% 5.9% 7.2% 6.5% 6.4% 4Q11 1Q12 2Q12 3Q12 4Q12 1Q13 2Q13 3Q13 Credit NIM (gross spread) NIM with clients Risk adjusted credit NIM (net spread) Risk adjusted NIM with clients (after provision for loan and lease losses and net of the recovery) CDI 17
16 Analysis of Net Income Complementary Aspects in Analysis of Financial Margin with Clients Evolution of the Loan Portfolio Mix (excluding endorsements and sureties) Our loan portfolio mix presented below highlights its major components and their share in the past quarters. Loan Portfolio Mix Companies Our loan portfolio mix on September 30, 2013, in relation to 2011, continues to reduce the margin from companies as a result of the lower proportion of credits to very small and small market companies and larger proportion of credits to middle market and large companies, which have lower spreads. 50.9% 51.4% 52.3% 54.0% 54.9% 56.2% 57.4% 58.5% Loan Portfolio by Origination Period The chart below shows the evolution of our loan portfolio, excluding sureties and endorsements, by origination period (vintages). 359, , , % 2.6% 2.3% 3.6% 1.9% 1.5% 9.2% 8.0% 14.1% 13.3% 15.8% 3.4% 4.2% 4.6% 25.5% 5.5% 5.1% 6.9% 7.2% 8.2% 11.9% 8.8% 11.4% 8.7% 12.8% Other (20.4%) 2013 (54.6%) 32.6% 33.7% 33.1% 49.1% 48.6% 47.7% 46.0% 45.1% 43.8% 42.6% 41.5% 4Q11 1Q12 2Q12 3Q12 4Q12 1Q13 2Q13 3Q13 Very Small, Small and Middle Market Corporate Loan Portfolio Mix Individuals The evolution of our loan portfolio mix for individuals in the same period shows the growth of the payroll loan and mortgage loan portfolios. The decreased share of the vehicle portfolio in our mix is a result of the reduction in the nominal balance of this portfolio. 9.1% 9.8% 10.6% 11.3% 12.0% 12.6% 13.6% 14.5% 6.8% 7.4% 7.8% 8.5% 9.0% 10.7% 12.1% 13.2% 17.5% 18.7% 18.9% 18.9% 17.8% 17.9% 17.5% 17.2% 26.2% 24.5% 24.7% 24.8% 27.0% 27.1% 27.2% 27.7% 3Q12 2Q13 3TQ3 3Q13 2Q13 1Q13 4Q12 3Q12 2Q12 1Q Other In this quarter, we maintained the policy of greater selectivity in the origination of credit, and noted that the volume of originations was practically unchanged. Additionally, given the profile of the terms of our different credit products, the composition of new contract vintages also showed a similar profile over the past periods. On September 30, 2013, 54.6% of the loan portfolio was composed of vintages from 2013, 20.4% from 2012, 13.3% from 2011, 8.0% from 2010, 1.5% from 2009 and 2.3% of previous years. We see, therefore, that the operations originated until 2010 correspond to less than 12.0% of our portfolio and are basically vehicle and mortgage loans that have characteristically longer average maturity terms. Loan Portfolio by Maturity 40.4% 39.6% 38.0% 36.5% 34.1% 31.8% 29.6% 27.5% 4Q11 1Q12 2Q12 3Q12 4Q12 1Q13 2Q13 3Q13 Vehicles Credit Card Personal Loans Payroll Loans Mortgage Loans The variation of Financial Margin with Clients We present below our performing credit portfolio, that is, composed of operations for which payments made by clients are non-overdue(*) according to the maturity schedule, including the concentration on operations longer than 365 days. To show the effect of changes in the mix of products in our net interest margin, we isolated these effects from those resulting from the growth in the volume of loan operations, the number of calendar days, the Brazilian growth of the benchmark rate (SELIC), changes in spreads and other effects. TOTAL = R$361, ,090 In the third quarter of 2013, the increase in the volume of loan operations, in the number of calendar days and in the SELIC rate were the main drivers of the increase in the financial margin with clients, which was partially offset by the effects of the product mix, clients and spreads. 11, (108) (220) (85) 11,495 52,757 52,105 41,022 30,157 20, over 365 days Non-Overdue Loans (*) (*) Non-Overdue loans are loan operations that don't have any installments more than 14 days overdue, irrespective of collateral provided. 2Q13 Loan Volume Selic Calendar Days Product Mix Mix of Clients and Spreads Other 3Q13 18
17 Analysis of Net Income Banking Service Fees, Income from Banking Charges and Result from Insurance, Pension Plan and Capitalization Variation 3Q13 2Q13 9M13 9M12 3Q13 2Q13 9M13-9M12 Asset Management ,815 1, % % Current Account Services 1,040 1,050 3,068 2,403 (10) -0.9% % Credit Operations and Guarantees Provided ,061 1, % % Collection Services ,061 1,052 (2) -0.7% 9 0.9% Credit Cards 2,281 2,175 6,544 4, % 1, % Other ,563 1,431 (79) -14.0% % Banking Service Fees and Income from Banking Charges 5,591 5,399 16,111 12, % 3, % Result from Insurance, Pension Plan and Capitalization (*) 1,414 1,431 4,199 3,701 (18) -1.2% % Total 7,004 6,830 20,310 16, % 3, % (*) Income from Insurance, Pension Plan and Capitalization operations (-) Expenses for Claims (-) Selling Expenses with Insurance, Pension Plan and Capitalization. In the third quarter of 2013, banking service fees, including income from banking charges, amounted to R$5,591 million, a 3.6% increase in relation to the previous quarter. Year to date, these revenues recorded a 24.0% increase, mainly due to current account services and revenues from credit cards, the latter also driven by the purchase of minorities shares of REDE in the end of Taking into account the result of insurance, pension plan and capitalization operations, service fees totaled R$7,004 million, with a 2.6% increase from the previous quarter. In the nine months to September, these revenues grew 21.7% in relation to the same period of the previous year. Even if the effect of the proportional increase of our stake in REDE were disregarded, the increase in banking service fees, including the result of insurance, pension plans and capitalization, would have been of 14.0%. Asset Administration Asset Administration fees totaled R$549 million in the third quarter of 2013, an increase of 10.5% from the second quarter of 2013, due to the higher number of business days in the period. The volume of assets under administration totaled R$622.4 billion in September 2013, recording an increase of 2.3% from the previous quarter and of 19.8% when compared to the same period of the previous year Asset Management Asset management revenues totaled R$663 million in the third quarter of 2013, a 13.3% increase from the second quarter of 2013, mainly due to the higher revenues from fund management. In the year, these revenues recorded a 17.6% increase in relation to the same period of the previous year, mainly due to the larger balance of consortia and asset administration. 4Q11 1Q12 2Q12 3Q12 4Q12 1Q13 2Q13 3Q13 Asset Administration () Consortia Administration Fees Assets Under Administration (R$ billion) Consortia administration fees totaled R$114 million in the third quarter of 2013, a 29.1% increase from the second quarter of 2013, due to the higher volume of consortia operations in the period. In the year, these fees recorded a 79.8% increase when compared to the same period of the previous year Q11 1Q12 2Q12 3Q12 4Q12 1Q13 2Q13 3Q13 4Q11 1Q12 2Q12 3Q12 4Q12 1Q13 2Q13 3Q13 Note: Exclusive funds of consolidated companies have been consolidated in the balances presented above. 19
18 Analysis of Net Income Current Account Services Revenues from current account services totaled R$1,040 million in the third quarter, representing a decrease of 0.9% from the previous quarter. In the nine months to September, these revenues increased 27.7% when compared to the same period of the previous year, due to the increase in the volume of packages and services. The highlights among them are the packages that convert fees paid by clients into mobile phone credit. This result was also influenced by actions of collection and adhesion and adjustment of services provided to Uniclass clients and in the companies segment. Credit Operations and Guarantees Provided Revenues from loan operations and guarantees provided totaled R$765million, a 14.8% increase when compared to the previous quarter, influenced by the increase in vehicle financing origination and higher charges on advances to deposit account holders. Since the first quarter of 2012, these revenues were very much affected by the suspension of the collection of charges on contract amendments and the decreased pace in vehicle financing and leasing transactions, although they have restarted to grow in Collection Services Revenues from collection services reached R$359 million, which represented a 0.7% decrease when compared to the second quarter of In the year, these revenues increased of 0.9% in relation to the same period of the previous year. Credit Cards Q11 1Q12 2Q12 3Q12 4Q12 1Q13 2Q13 3Q13 Revenues from Guarantees Provided Credit card revenues amounted to R$2,281 million in the third quarter of 2013, a 4.9% growth from the previous quarter, mainly as a result of higher interchange revenues arising from the increased volume of transactions in the period, and by the increase in revenues from the rental of equipment, which arose from the increase in the installed equipment base and higher average price Revenues from Credit Operations In the year, these revenues recorded a 42.1% increase, mainly due to the acquisition of 100% minority interest of REDE in the end of 2012, to the larger revenues from annual fees, higher sales and the increase in number of equipment rented in the period. If the effects of the acquisition of minority interests in REDE in the end of 2012 and the revenues from credit card processing services, due to the sale of Orbitall, were disregarded, credit card revenues would have increased 16.8% when compared to the same period of the previous year. Acquiring Services 1,590 1,534 1,496 1,574 2,037 2,087 2,175 2, % 34.5% 36.9% 36.0% 62.9% 65.5% 63.1% 64.0% Acquiring service revenues totaled R$1,126 million in the third quarter of 2013, recording a 4.3% increase when compared to the previous quarter. Credit card revenues related to acquiring services totaled R$628 million in the third quarter of 2013, an increase of 1.7% from the previous quarter. In the same period, debit card revenues totaled R$201 million, an increase of 8.8% from the previous quarter. Finally, revenues from the rental of equipment increased 6.9% from the previous quarter, totaling R$297 million in the period. Acquiring Service Revenues 55.2% 44.8% 49.8% 49.7% 49.4% 50.2% 50.3% 50.6% 4Q11 1Q12 2Q12 3Q12 4Q12 1Q13 2Q13 3Q13 Acquiring Services Other Credit Card Revenues ,125 1,039 1,080 1, % 24.9% 25.0% 25.3% 23.8% 26.4% 25.8% 26.4% 14.6% 14.5% 13.9% 14.8% 18.3% 18.1% 17.1% 17.8% 62.6% 60.6% 61.1% 59.9% 57.9% 55.5% 57.1% 55.7% 4Q11 1Q12 2Q12 3Q12 4Q12 1Q13 2Q13 3Q13 Credit Card Debit Card Rental of Equipment 20
19 Analysis of Net Income Other Result from Insurance, Pension Plan and Capitalization 3Q13 2Q13 3Q13 2Q13 Foreign Exchange Services Brokerage and Securities Placement (55) Custody Services and Management of Portfolio Economic and Financial Advisory Services (17) Other Services (23) Total (79) Revenues from brokerage and security placement services and from economic and financial advisory services decreased R$72 million, influenced by the lower volume of Investment Banking services. In the third quarter of 2013, the result from insurance, pension plan and capitalization operations totaled R$1,414 million, a 1.2% decrease in relation to the previous quarter, mainly due to the increase in selling expenses. In the nine months to September, these revenues increased 13.5% when compared to the same period of the previous year. In the third quarter of 2013, the technical provisions for insurance, pension plans and capitalization totaled R$98.8 billion, a 1.3% increase from the previous quarter. Banking Service Fees and Income from Banking Charges and Result from Insurance, Pension Plan and Capitalization In the third quarter of 2013, the ratio of total banking service fees and income from banking charges, plus the result from insurance, pension plan and capitalization operations, divided by operating revenues which includes, in addition to these revenues, the managerial financial margin and other operating revenues reached 35.7%. In this quarter, this ratio was higher than the average ratio of the last quarters. Accordingly, the operational coverage ratio, which represents the extent to which non-interest expenses were covered by the banking service fees and income from banking charges added to the result of insurance, pension plans and capitalization, reached 80.5% in this quarter, which corresponds to the highest ratio in relation to the average ratio of the last years. The chart below presents the quarterly historical data of banking service fees, including the result from insurance, pension plan and capitalization operations, and their relation with our operating revenues. 69.6% 70.3% 5, % 70.0% 5,590 5,568 5, % 78.2% 79.2% 80.5% 6,551 6,476 6,830 7, % 28.6% 28.1% 28.8% 32.9% 34.4% 35.6% 35.7% 1,363 1,279 1,227 1,195 1,402 1,354 1,431 1,414 4Q11 1Q12 2Q12 3Q12 4Q12 1Q13 2Q13 3Q13 Banking Services Fees and Income from Banking Charges and Result from Insurance, Pension Plan and Capitalization (Banking Services Fees and Income from Banking Charges and Result from Insurance, Pension Plan and Capitalization) /Operating Revenues Banking Services Fees and Income from Banking Charges and Result from Insurance, Pension Plan and Capitalization / Non Interest Expenses 4Q11 1Q12 2Q12 3Q12 4Q12 1Q13 2Q13 3Q13 Result from Insurance, Pension Plan and Capitalization (*) Technical Provisions from Insurance, Pension Plan and Capitalization (R$ billion) (*) Income from Insurance, Pension Plan and Capitalization operations (-) Expenses for Claims (-) Selling Expenses for Insurance, Pension Plan and Capitalization. 21
20 Analysis of Net Income Result from Loan Losses 3Q13 2Q13 9M13 9M12 Expenses for Provision for Loan and Lease Losses (4,537) (4,912) (14,388) (18,469) % 4, % Income from Recovery of Loans Written Off as Losses 1,297 1,262 3,645 3, % % Result from Loan and Lease Losses (3,240) (3,650) (10,743) (14,940) % 4, % Variation 3Q13-2Q13 9M13-9M12 The result from loan and lease losses, net of credit recoveries, totaled R$3,240 million in the third quarter of 2013, an improvement of 11.2% in relation to the previous quarter, mainly due to lower expenses for provisions for loan losses, which totaled R$4,537 million in the period, which represented a 7.6% decrease in relation to the second quarter of the year. In the year to September, these expenses decreased 22.1% in relation to the same period of the previous year. Expenses for Provision for Loan Losses and Loan Portfolio 1.64% 1.79% 1.74% 1.71% 1.58% 1.44% 1.42% 1.38% 1.17% 1.25% 1.34% 1.31% 1.04% 0.97% 5,587 6,210 6,139 6,120 5,741 4,939 4, % 0.85% 4,537 The income from the recovery of loans written off as losses continued to increase. In the quarter, this income was R$35 million (2.8%) higher than in the second quarter and totaled R$1,297 million. From January to September, this income increased R$116 million (3.3%) compared to the same period of the previous year. Allowance for Loan Losses and Credit Portfolio 3,998 4,998 4,995 4,946 4,531 3,854 3,650 3,240 4Q11 1Q12 2Q12 3Q12 4Q12 1Q13 2Q13 3Q13 Expenses for provision for loan losses () Result from Loan and Lease Losses () Expenses for provision for loan losses / Credit portfolio (*) Result from Loan and Lease Losses/ Credit Portfolio (*) (*) Average balance of the Loan Portfolio of the two previous quarters. In the third quarter of 2013, the ratio of expenses for provision for loan losses to the credit portfolio reached 1.18%, 13 basis points lower than in the previous quarter, the lowest level since the Itaú and Unibanco merger in % 7.5% 7.6% 7.7% 7.6% 6.0% 6.0% 6.2% 6.3% 6.2% Complementary portion of the provision expected loss model () Allowance for loan losses specific + generic () Allowance for loan losses specific + generic / Credit portfolio 7.3% 7.0% 6.0% 5.6% Allowance for loan losses specific + generic + complementary portion / Credit portfolio 6.6% 5.3% 25,772 25,951 27,056 27,682 27,745 27,188 26,399 25,653 5,058 5,058 5,058 5,058 5,058 5,058 5,058 5,058 20,713 20,893 21,998 22,624 22,687 22,130 21,341 20,594 Dec/11 Mar/12 Jun/12 Sep/12 Dec/12 Mar/13 Jun/13 Sep/13 In September 2013, the balance of the credit portfolio without endorsements and sureties increased R$7,826 million (2.1%) in relation to June 2013, reaching R$387,040 million, whereas the balance of the allowance for loan losses decreased R$747 million (2.8%) to reach R$25,653 million. The complementary allowance for loan losses, in addition to the minimum required by Resolution No. 2,682/99 of the National Monetary Council (CMN), was maintained at R$5,058 million at the end of the third quarter of Non Performing Loans Delinquency Ratios and Non Performing Loans (a) Loans overdue for more than 60 days and that do not accrue revenues. (b) Loans overdue for more than 90 days. (c) Endorsements and sureties not included. Sep 30,13 Jun 30,13 Sep 30,12 Non-performing Loans 60 days (a) 17,982 19,243 22,201 Non-performing Loans 90 days (b) 15,134 16,028 18,528 Credit Portfolio (c) 387, , ,810 NPL Ratio [(a)/(c)] x 100 over 60 days 4.6% 5.1% 6.2% NPL Ratio [(b)/(c)] x 100 over 90 days 3.9% 4.2% 5.1% Coverage: Non-performing Loans 60 days 143% 137% 125% Non-performing Loans 90 days 170% 165% 149% Overdue Loans The overdue loan portfolio decreased 6.6% in the third quarter of 2013 and the balance of the allowance for loan losses, decreased, as mentioned above, 2.8% in the same period. Since a year ago, total overdue loans as defined was reduced by 19.0% or more than R$ 6.0 billion. Sep 30,13 Jun 30,13 Sep 30,12 Overdue Loans 25,835 27,658 31,891 Allowance for Loan and Lease Losses (25,653) (26,399) (27,682) Coverage (183) (1,259) (4,209) Note: overdue loans are loan operations having at least one installment more than 14 days overdue, irrespective of collateral provided. 22
21 Analysis of Net Income NPL Ratio 90 days Coverage 90 days 7.3% 7.5% 6.6% 6.7% 6.9% 4.9% 5.1% 5.2% 5.1% 4.8% 3.5% 3.7% 3.5% 3.3% 3.2% 6.7% 4.5% 6.4% 4.2% 6.0% 3.9% 153% 158% 161% 165% 170% 148% 147% 149% 30% 29% 30% 32% 33% 29% 27% 27% 35% 33% 33% 34% 40% 39% 43% 42% 2.9% 2.5% 2.3% 88% 86% 87% 88% 89% 92% 90% 94% Dec/11 Mar/12 Jun/12 Sep/12 Dec/12 Mar/13 Jun/13 Sep/13 The NPL ratio of credits more than 90 days overdue decreased 30 and 120 basis points from the previous quarter and the third quarter of 2012, respectively, reaching 3.9% of our credit portfolio. This ra o is the lowest level since the merger of Itaú and Unibanco, and was mainly due to the change in the credit profile of our por olio. The improvement in the ratio was due to the decreases in the ratios for individuals and companies. The ratio for individuals dropped 40 and 150 basis points, respectively, when compared to the previous quarter and the same period of the previous year. Meanwhile, for companies this ratio decreased 20 and 100 basis points from the previous period and the third quarter of 2012, respectively. No credit assignments were made in the third quarter of NPL Ratio 15 to 90 days Individuals Total Companies Dec/11 Mar/12 Jun/12 Sep/12 Dec/12 Mar/13 Jun/13 Sep/13 Specific Allowance Coverage Generic Allowance Coverage Complementary Allowance Coverage Note: The coverage ratio is derived from the division of the allowance for loans and lease losses balance by the balance of operations more than 90 days overdue. In the quarter, the 90-day coverage ratio increased 500 basis points to 170%, impacted by the reduction of 5.6% in the portfolio of credits overdue for over 90 days and the decrease of 2.8% in the balance of the allowance for loan losses, which totaled R$25,653 million in September Noteworthy is that, in this quarter, both the overdue credit portfolio and the portfolio of credits overdue for over 60 days decreased 6.6%. These decreases reiterate the good performance of the most recent credit origination vintages. Credit Portfolio Write-Offs Write-offs from the credit portfolio totaled R$5,279 million in the third quarter of 2013, dropping R$417 million and R$34 million in relation to the previous quarter and to the same period of the previous year, respectively. The ratio of written-off operations to the average balance of the credit portfolio reached 1.4% in the third quarter of 2013, a decrease of 10 basis points when compared to the previous quarter. 7.9% 7.5% 6.9% 4.4% 4.8% 4.5% 2.3% 2.3% 2.2% 7.2% 6.3% 4.2% 3.6% 1.8% 1.5% 6.7% 4.0% 1.9% 5.9% 5.4% 3.4% 3.0% 1.4% 1.2% 4,400 5,852 4,884 5,313 6,094 5,985 5,696 5,279 Dec/11 Mar/12 Jun/12 Sep/12 Dec/12 Mar/13 Jun/13 Sep/13 Individuals Total Companies 1.3% ' 1.7% 1.4% 1.5% ' 1.7% 1.6% 1.5% 1.4% Short term delinquency, measured based on the balance of the opera ons that are overdue from 15 to 90 days, reached the lowest level since the merger of Itaú and Unibanco, not only in the total por olio but also in the individuals and companies por olios. This was due to the decrease of 50 basis points in the ratio for individuals and 20 basis points in the ratio for companies in relation to the previous quarter, resulting in a reduction of 40 basis points in the total ratio, which reached 3.0% in the quarter. 4Q11 1Q12 2Q12 3Q12 4Q12 1Q13 2Q13 3Q13 Write-Off Write-Off / Credit Portfolio (1) (1) Average balance of the two previous quarters. In 12 months, the short-term delinquency ratio decreased 120 basis points, mainly due to the improvement of 180 basis points in the individuals ratio. 23
22 Analysis of Net Income Non-interest Expenses In the third quarter of 2013, non-interest expenses totaled R$8,703 million, an increase of 0.9% in relation to the previous quarter. This increase is basically explained by the higher personnel expenses, which were impacted by the 8.0% readjustment determined by the Collective Bargaining Labor Agreement reached in October 2013 to be applied as from September If this readjustment were disregarded, noninterest expenses would have dropped by R$84 million (1.0%) in 3Q13 2Q13 9M13 9M12 Personnel Expenses (3,914) (3,811) (11,445) (10,370) (103) 2.7% (1,075) 10.4% Administrative Expenses (3,653) (3,667) (10,749) (10,452) % (298) 2.8% Operating Expenses (1,030) (1,049) (3,091) (2,907) % (184) 6.3% Other Tax Expenses (*) (105) (98) (323) (331) (7) 7.0% 8-2.4% Total (8,703) (8,626) (25,608) (24,059) (77) 0.9% (1,549) 6.4% REDE Full Consolidation Adjustment (465) Total Expenses with REDE (8,703) (8,626) (25,608) (24,523) (77) 0.9% (1,085) 4.4% (*) It does not include ISS, PIS and Cofins. the quarter. In the year to date, non-interest expenses reached R$25,608 million, an increase of 6.4% in relation to the same period of the previous year. If the full consolidation of REDE were taken into consideration, in accordance with the financial statements, the expenses would have increased 4.4% when compared to 2012 (lower than the inflation for the period - IPCA 5.9%). Variation 3Q13 2Q13 9M13 9M12 Personnel Expenses 3Q13 2Q13 Variation Compensation, Charges and Social (2,652) (2,579) (72) Profit Sharing (*) (785) (742) (43) Employee Terminations and Labor Claims (431) (446) 15 Training (46) (44) (2) Total (3,914) (3,811) (103) (*) Includes variable compensation and stock option plans. Personnel expenses totaled R$3,914 million in the third quarter of 2013, representing an increase of 2.7% from the previous period. The increase was mainly due to the collective bargaining labor agreement reached in October, which determined an adjustment of 8.0% for compensation, social benefits and charges, with the provision for the related impact in the quarter as from September. If this readjustment were disregarded, our personnel expenses would have reduced by 1.5% in the quarter. The increase in profit sharing expenses of R$43 million also contributed to the increase. These impacts were partially offset by the decrease in expenses with terminations and labor claims of R$15 million in the period. Administrative Expenses 3Q13 2Q13 Variation Financial System Services (102) (128) 26 Depreciation and Amortization (465) (480) 15 Third-Party Services (838) (820) (18) Facilities (576) (559) (17) Data Processing and Telecommunications (902) (893) (9) Travel (51) (48) (4) Transportation (114) (113) (1) Advertising, Promotions and Publications (261) (268) 7 Security (138) (139) 1 Materials (94) (94) 0 Outras (111) (125) 13 Total (3,653) (3,667) 14 Administrative expenses slightly decreased by 0.4% from the previous quarter. This decrease was mainly due to the decrease in the expenses with financial system services of R$26 million. This positive effect was partially offset by the increase in expenses with third-party services, which were R$18 million higher than the related expenses for the second quarter, due to the increased collection agency expenses. Number of Employees The number of employees decreased from 94,820 in June 2013 to 94,280 in September , ,694 6,284 99,017 6,400 97,030 96,977 96,355 94,820 94,280 6,500 6,603 6,654 6,740 6,761 6,840 98,258 96,294 92,517 90,427 90,323 89,615 88,059 87,440 Dec/11 Mar/12 Jun/12 Sep/12 Dec/12 Mar/13 Jun/13 Sep/13 Operating Expenses Brazil Abroad Note: For companies under the control of Itaú Unibanco, 100% of the number of employees is considered. No employee is considered for companies that are not under Itaú Unibanco s control. In the third quarter of 2013, operating expenses decreased 1.8% from the previous quarter, impacted by the decrease in the expenses with provisions for contingencies by R$99 million, mainly due to the reversal of provisions as a result of civil lawsuits settlements. Other Tax Expenses (*) 3Q13 2Q13 Variation Provision for Contingencies (324) (423) 99 Selling - Credit Cards (250) (253) 3 Claims (99) (105) 6 Other (357) (268) (90) Total (1,030) (1,049) 19 In the third quarter of 2013, other tax expenses increased R$7 million in relation to the previous quarter. From January to September, these expenses decreased R$8 million when compared to the same period of (*) Does not include ISS, PIS and Cofins. 24
23 Analysis of Net Income Efficiency Ratio and Risk-Adjusted Efficiency Ratio We present below the efficiency ratio and the risk-adjusted efficiency ratio, which includes the risk portions associated with banking transactions (result of the provision for loan losses) and insurance and pension plan transactions (claims) Q11 1Q12 2Q12 3Q12 4Q12 1Q13 2Q13 3Q13 Quarter E.R. (%) Quarter R.A.E.R. (%) E.R. Cumulative figure of the last 12 months (%) R.A.E.R. Cumulative figure of the last 12 months (%) Risk Ajusted Efficiency Ratio = Non-Interest Expenses (Personnel Expenses + Administrative Expenses + Operating Expenses + Other Tax Expenses) +Insurance Selling Expenses + Result from Loan Losses + Retained Claims (Managerial Financial Margin + Banking Service Fees and Banking Charges + Operating Result of Insurance, Capitalization and Pension Plans before Retained Claims and Insurance Selling Expenses - Tax Expenses for ISS, PIS, Cofins and Other Taxes) Risk-Adjusted Efficiency Ratio In the third quarter of 2013, the risk-adjusted efficiency ratio, as broadly defined (including all expenses, including claims and selling expenses from insurance), reached 68.4%, an increase of 370 basis points in relation to the second quarter of This decrease was mainly due to the significant decrease in the result from loan losses (a decrease of 11.2%, mainly influenced by the change in the credit profile of our portfolio), to the 3.6% increase in banking service fees and income from banking charges and to the 2.3% increase in the financial margin with clients. Selling expenses from insurance increased 3.6% in the quarter, mitigating the positive impacts on the ratio in the quarter. Over the past twelve months, the risk-adjusted efficiency ratio reached 71.7%, a decrease of 180 basis points when compared to the same period of Efficiency Ratio The efficiency ratio for the third quarter of 2013 reached 48.2%, a decrease of 90 basis points from the second quarter of This decrease was due to the increases in banking service fees and income from banking charges and in the financial margin with clients, and indicates a reversal of the trend observed in the five previous quarters. In the 12-month period, the efficiency ratio reached 48.0%, an increase of 270 basis points from the same period of the previous year. The main reason behind this increase is the change of the loan portfolio mix, which resulted in a decrease in revenues in the last quarters. Usage of Operating Revenues The chart below shows the portions of the operating revenues that are used to cover non-interest expenses, result from loan losses and expenses with claims. Operating Revenues (*) (-) Efficiency Ratio (-) Loan Losses and Retained Claims Net of Recovery/ Operating Revenues (*) (+) = Income before Tax and Profit Sharing / Operating Revenues (*) Risk Adjusted Efficiency Ratio % Operating Revenues (*) R.A.E.R 3Q % Q11 1Q12 2Q12 3Q12 4Q12 1Q13 2Q13 3Q13 (*) Net of Tax Expenses for ISS, PIS and Cofins and Other. 25
24 Analysis of Net Income Points of Service At the end of the third quarter of 2013, our network was comprised of 4,975 branches and client service branches (CSB), including Brazil and abroad. Branches and Client Service Branches (CSB) Brazil and Abroad 4,961 4,949 4,970 4,977 4,983 4,957 4,962 4,975 4,049 4,056 4,075 4,081 4,083 4,075 4,088 4,105 Tax Expenses for ISS, PIS, Cofins and Other Tax expenses amounted to R$1,029 million in the third quarter of 2013, a decrease of 5.6% from the previous quarter. Income Tax and Social Contribution on Net Income In the third quarter of 2013, income tax and social contribution on net income (CSLL) expenses totaled R$1,796 million, an increase of R$404 million from the previous quarter as a result of higher income before tax and profit sharing. The effective tax rate reached 30.6%. Unrealized Gains ,946 Dec/12 Mar/12 Jun/12 Sep/12 Dec/12 Mar/13 Jun/13 Sep/13 Client Service Branches (CSB) Branches Note: Includes Banco Itaú BBA, Banco Itaú Argentina and Chile, Uruguay and Paraguay companies. 3,529 4,126 5,796 6,120 4,739 Automated Teller Machines (ATMs) Brazil and Abroad 2,332 1,945 In the third quarter of 2013, the number of ATMs totaled approximately 28 thousand, representing an increase of 19 units when compared to the previous quarter. 28,769 27,994 27,789 27,817 27,960 27,866 27,962 27,981 4Q11 1Q12 2Q12 3Q12 4Q12 1Q13 2Q13 3Q13 Unrealized gains decreased 16.6% in relation to the previous quarter and totaled R$1,945 million at the end of the third quarter of The balance of unrealized gains from our available-for-sale securities portfolio decreased R$382 million, which negatively impacted stockholders equity by R$224 million in September This decrease was mainly due to the impact of the increase in future interest rates on the prices of securities in this portfolio, which is marked to market. Dec/12 Mar/12 Jun/12 Sep/12 Dec/12 Mar/13 Jun/13 Sep/13 Note: (i) Includes Banco Itaú Argentina and Chile, Uruguay and Paraguay companies. (ii) Includes ESBs (Electronic Service Branches) and service points in third-party establishments. (iii) Does not include points of sale and ATMs of Banco 24h. 26
25 balance sheet, balance sheet by currency, risk management and ownership structure 3 rd quarter of 2013
26 Balance Sheet Assets On September 30, 2013, total assets amounted to R$1.1 trillion, an increase of 2.4% in relation to the end of the previous quarter and of 12.8% to the previous year. The breakdown of our assets and the details of their main components are presented below: Assets Breakdown I September 30, % 1.3% 33.4% Total Assets R$ billion , , , , % 26.0% Cash, Cash Equivalents, Short-term Interbank Deposits and Interbank and Interbranch Accounts Credit Portfolio Net of Provisions Securities and Derivatives Permanent Other Dec/11 Mar/12 Jun/12 Sep/12 Dec/12 Mar/13 Jun/13 Sep/13 Short-Term Interbank Investments and Securities Portfolio On September 30, 2013, the balance of our short-term interbank investments and securities portfolio, including derivative financial instruments, totaled R$465,373 million, corresponding to an increase of 2.0% in relation to the previous quarter. The balance of our short-term interbank investments increased R$9.7 billion, whereas the balance of the Brazilian government securities decreased R$2,038 million. Variation Sep 30, 13 % Jun 30, 13 % Sep 30, 12 % Sep 30,13 Sep 30,13 Jun 30,13 Sep 30,12 Short-Term Interbank Investments 193, % 183, % 163, % 5.3% 18.3% Total Public Securities 129, % 130, % 109, % -1.1% 18.0% Government Securities Domestic 120, % 122, % 101, % -1.7% 18.1% Government Securities Foreign 9, % 8, % 7, % 7.3% 16.6% Denmark 2, % 3, % 1, % -8.4% 73.1% Korea 2, % 1, % 1, % 86.1% 46.8% Chile % 1, % 1, % -19.7% -51.6% United States % % % 2.8% -2.9% Paraguay % % % -11.4% 89.7% Uruguay % % % 21.4% 25.1% Colombia % % % 77.9% 72.8% Mexico % % % -17.1% -58.1% Belgium % % % 3.3% 171.7% Argentina % % % -49.3% -32.9% France % % % 5.0% 212.0% Netherlands % % % - Germany % Other 9 0.0% % % -87.5% -79.4% Corporate Securities 51, % 48, % 43, % 4.7% 16.2% PGBL/VGBL Fund Quotas 79, % 79, % 69, % 0.8% 14.2% Derivative Financial Instruments 11, % 14, % 11, % -15.6% 7.4% Total 465, % 456, % 397, % 2.0% 17.0% Evolution of Short-term Interbank Investments and Securities Portfolio The breakdown of short-term interbank investments and securities in the past few quarters is shown below: R$ billion Derivative Financial Instruments PGBL/VGBL Fund Quotas Corporate Securities Public Securities Foreign Public Securities Domestic Short-term Interbank Investments Dec/11 Mar/12 Jun/12 Sep/12 Dec/12 Mar/13 Jun/13 Sep/13 28
27 Balance Sheet Securities and Derivative Financial Instruments Our securities and derivative financial instruments are presented below in accordance with their maturity period, allowing us to see our positions by maturity date. Securities by Categories Our securities portfolio is classified into three categories: trading, available-for-sale and held-to-maturity. On September 30, 2013, the securities portfolio totaled R$260,247 million, and its breakdown is presented in the chart below: 92,527 84, % 46,141 48, % 66.4% Trading securities Available-for-sale securities Held-to-maturity securities Over 720 days Government Securities Domestic Corporate Securities Derivative Financial Instruments Government Securities Foreign PGBL/VGBL Fund Quotas Credit Portfolio Credit Portfolio by Product In the table below, the credit portfolio is split into two groups: individuals and companies. For a better understanding of the performance of these portfolios, the main product groups of each segment are presented below. (1) The portfolios acquired from other banks, except for BMG, amounted to approximately R$ 21 million (2) Does not consider co-obligation in mortgage loan assignment in the amount of R$ million in the 4Q11; (3) Also includes Revolving, Receivables, Hot Money, Leasing, and other;; (4) Includes Argentina, Chile, Colombia, Paraguay and Uruguay; (5) Includes Debentures, CRI and Commercial Paper. The portfolio of credits to individuals reached R$168,282 million on September 30, 2013, a 2.1% increase when compared to the last quarter, due to the increase of 11.6% in the payroll loan portfolio, amounting R$20,579 million, 8.1% in mortgage loans, amounting to R$22,515 million, and 6.8% in our operations in Latin America, amounting to R$12,415 million, partially offset by the 5.7% decrease in the vehicle portfolio, which totaled R$42,733 million. The portfolio of credit to companies grew 2.1% in the quarter, totaling R$ 218,757 million. The changes in this portfolio were driven by the increase in mortgage loans, of 8.9%, to R$9,469 million, and in onlending from BNDES, of 4.6%, to R$47,102 Sep 30,13 Jun 30,13 Dec 31,12 Sep 30,12 Sep 30,13 Jun 30,13 Variation Sep 30,13 Dec 31,12 Sep 30,13 Sep 30,12 Individuals 168, , , , % 4.6% 6.5% Credit Card 43,078 41,621 40,614 36, % 6.1% 17.4% Personal Loans 26,712 26,793 26,798 27, % -0.3% -4.6% Payroll Loans (1) 20,579 18,442 13,551 12, % 51.9% 64.0% Vehicles 42,733 45,302 51,220 54, % -16.6% -20.9% Mortgage Loans (2) 22,515 20,836 18,047 16, % 24.8% 34.9% Rural Loans % -6.2% -6.5% Latin America (4) 12,415 11,622 10,361 9, % 19.8% 27.9% Companies 218, , , , % 6.5% 8.4% Working Capital (3) 103, , , , % -2.6% -1.5% BNDES/Onlending 47,102 45,019 40,951 39, % 15.0% 20.0% Export / Import Financing 25,364 24,311 21,258 22, % 19.3% 14.0% Vehicles 4,970 5,083 6,031 6, % -17.6% -25.1% Mortgage Loans 9,469 8,693 7,790 7, % 21.6% 28.9% Rural Loans 7,191 6,990 6,349 5, % 13.3% 30.1% Latin America (4) 21,196 20,172 16,782 15, % 26.3% 33.7% Total without Endorsements and Sureties 387, , , , % 5.7% 7.6% Endorsements and sureties 69,522 65,900 60,310 57, % 15.3% 20.3% Total with Endorsements and Sureties 456, , , , % 7.0% 9.3% Private Securities (5) 24,455 22,400 22,652 20, % 8.0% 22.1% Total Risk 481, , , , % 7.1% 9.9% million, which offset the decreases seen in the vehicle portfolio. Taking into account our fixed income private securities portfolio and the balance of sureties and endorsements, the adjusted balance of our overall credit portfolio amounted to R$481,017 million, a growth of 2.9% when compared to June 30, 2013, and of 9.9% when compared to September 30,
28 Balance Sheet Credit Portfolio by Risk Level On September 30, 2013, the share of credits rated AA to C in the total portfolio was 93.0%, an increase of 60 basis points from the previous quarter. Evolution of Loan Portfolio by Risk Level 9.6% 9.6% 9.0% 8.9% 8.6% 8.1% 7.6% 7.0% 4.8% 5.5% 5.2% 5.1% 6.2% 6.2% 5.6% 4.2% 8.2% 9.4% 9.7% 9.8% 9.2% 8.9% 8.5% 9.0% 37.2% 35.4% 35.3% 34.0% 33.4% 33.4% 40.3% 40.1% 40.8% 42.2% 42.6% 43.4% 26.0% 26.5% 52.3% 53.3% Dec/11 Mar/12 Jun/12 Sep/12 Dec/12 Mar/13 Jun/13 Sep/13 AA A B C D-H Credit Portfolio by Business Sector (including endorsements and sureties) The changes in the portfolio of credit to companies are listed below: Business Sector Sep 30, 13 Jun 30, 13 Variation Sep 30,13 - Jun 30, 13 Transportation 19,742 19, % Vehicles and autoparts 19,719 19, % Real estate 17,926 17, % Food and beverage 17,481 16, % Agribusiness and fertilizers 14,666 13,663 1, % Steel and metallurgy 12,058 11, % Energy and water treatment 12,098 11, % Sugar and alcohol 9,378 9, % Capital assets 9,738 8, % Petrochemical and chemical 8,304 7, % Electronic and IT 7,087 7,229 (143) -2.0% Banks and other financial institu 7,815 7, % Pharmaceuticals and cosmetics 6,875 6,890 (15) -0.2% Infrastructure work 6,799 6,881 (82) -1.2% Construction material 6,660 6, % Clothing and footwear 5,652 5,838 (186) -3.2% Oil and gas 5,042 4, % Mining 4,631 4,857 (226) -4.6% Leisure and tourism 3,746 3, % Pulp and paper 3,395 3, % Other 82,279 80,183 2, % Total 281, ,506 7, % Credit Concentration Our loan, lease and other credit operations, including endorsements and sureties, are diversified in such a way that only 22.1% of the credit risk was concentrated in the 100 largest debtors at the end of September The credit concentration of the 100 largest debtors (group consolidated) is as follows: Loan, Lease and Other Credit Operations Risk Sep/13 % of Total % of Total Assets Largest debtor 4, % 10 largest debtors 29, % 20 largest debtors 45, % 50 largest debtors 73, % 100 largest debtors 100, % Operations under Renegotiation According to the rules of the CMN Resolution No. 2,682/99, balances of all contracts that have had changes to their original contractual terms must be reported as renegotiated loans, even if they are not overdue. With the intention of allowing better understanding, we began to disclose the renegotiated loans not overdue or overdue for less than 30 days apart from those that had changes in the original contractual terms, as shown below: Portfolio LLP % Amended Credit Agreements 18,252 (8,171) 44.8% Amended Operations non-overdue (4,959) 1, % Renegotiated Loan Operations 13,293 (6,798) 51.1% Further information on note 8-d of our financial statements. On September 30, 2013, the portfolio of operations under renegotiation reached R$13,293 million, with a decrease of R$380 million in the quarter, which represents 3.4% of our credit portfolio (a decrease of 20 basis points from the previous quarter). At the end of the third quarter of 2013, the ratio of the allowance for loan losses to the renegotiated portfolio reached 51.1%. The following chart presents the changes in the past few quarters: 3.4% 3.8% 4.0% 4.0% 4.0% 3.8% 3.6% 3.4% 45.0% 44.1% 45.7% 49.6% 50.3% 50.5% 50.5% 51.1% Dec/11 Mar/12 Jun/12 Sep/12 Dec/12 Mar/13 Jun/13 Sep/13 Provision for Loan and Lease Losses / Reneg. Portfolio Reneg. Portfolio / Total Credit Portfolio The portfolio of operations under renegotiation includes both overdue and renegotiated operations and renegotiated operations from the portfolio that had already been written off as losses. At the time of renegotiating credits written off as losses, we recognize a provision for the total amount renegotiated (not generating an immediate result) that is reversed only when there is a strong indication of the recovery of this credit (after payments are received on a regular basis for a few months). The 90-day non-performing loans (NPL 90) in the renegotiated portfolio reached R$4,143 million, which caused the 90-day NPL ratio to reach 31.2%. The coverage ratio of the corresponding allowance for loan losses was 164% on September 30, The portfolio of over 90-day non-performing loans presented in the report also includes the NPL on renegotiated credits. Other and Permanent Assets The other assets item comprises foreign exchange portfolio, tax credits, taxes and contributions for offset and escrow deposits. In the third quarter of 2013, other assets reached R$153,117 million (a 1.9% increase from the previous quarter), mainly due to the increased foreign exchange portfolio. The tax credit balance reached R$39.8 billion (an increase of 0.7% from the previous quarter), of which R$33.0 billion refers to temporary differences of provisions and R$6.8 billion (17.1% of the total tax credits) refer to tax losses, social contribution tax loss carryforwards, and social contribution for offset. Our permanent assets, in the amount of R$14,565 million, are represented by non-consolidated investments in Brazil and abroad, fixed assets and deferred charges. In this quarter, this category represented 1.3% of total assets and increased 6.0% in relation to the previous quarter. 30
29 Balance Sheet Funding Variation Sep 30, 13 Jun 30, 13 Sep 30, 12 sep/13 sep/13 jun/13 sep/12 Demand Deposits 37,817 38,665 29, % 26.8% Savings Deposits 98,228 92,324 77, % 26.9% Time Deposits 108, , , % -5.7% Debentures (Linked to Repurchase Agreements and Third Parties Operations) 121, , , % -2.4% Funds from Bills (1) 34,276 34,952 39, % -13.9% (1) Total - Funding from Account Holders and Institutional Clients (*) 400, , , % 3.5% Onlending 41,355 38,995 34, % 18.6% (2) Total Funding from Clients 441, , , % 4.8% Assets Under Administration (2) 622, , , % 19.8% Technical Provisions for Insurance, Pension Plan and Capitalization 98,758 97,447 87, % 13.1% (3) Total Clients 1,162,805 1,140,909 1,028, % 13.1% Interbank deposits 7,680 7,056 9, % -19.3% Funds from Acceptance and Issuance of Securities 16,395 17,723 14, % 12.3% Total Funds from Clients + Interbank Deposits 1,186,880 1,165,688 1,052, % 12.8% Repurchase Agreements (3) 173, , , % 40.7% Borrowings 31,947 30,145 21, % 45.3% Foreign Exchange Portfolio 53,315 50,168 41, % 29.6% Subordinated Debt 54,394 53,813 48, % 12.1% Collection and payment of Taxes and Contributions 4,430 4,749 4, % -1.9% Free Assets (4) 65,537 63,843 56, % 15.1% Free Assets and Other 383, , , % 29.2% Total Funds (Free, Raised and Managed Assets) 1,570,269 1,535,131 1,349, % 16.4% (*) Funds from Institutional Clients totaled R$15,947 million, which corresponds to 4.0% of the total raised with clients. (1) Includes funds from Real Estate, Mortgage, Financial, Credit and Similar Notes. (2) In December 2012, we started to consolidate the exclusive investment funds of our consolidated subsidiaries. (3) Does not include own issued debentures classified as funding. (4) Equity + Non-Controlling Interest Permanent Assets. On September 30, 2013, total funds from clients, including interbank deposits, amounted to R$1.2 trillion, corresponding to an increase of R$21,191 million from the second quarter of The main drivers were increases of R$13,979 million in funds obtained through investment funds and assets under administration, of R$5,903 million in savings deposits and of R$1,570 million in time deposits. These increases were partially offset by the reductions of R$1,703 million in debentures, of R$1,328 million in funds from acceptance and issuance of securities and of R$848 million in demand deposits. The debentures issued by leasing companies of the conglomerate, after being purchased by the bank (the Conglomerate s leading company), are traded with the same features as a time deposit or other deposits, although they are classified as deposits received under securities repurchase agreements. Therefore, these deposits are reclassified in the table above as deposits from account holders. In the third quarter of 2013, this type of funding added to other debentures totaled R$121,369 million, including institutional clients. Total funds (free, raised and managed assets) amounted to approximately R$1.6 trillion on September 30, 2013, an increase of R$35,138 million when compared to June 30, 2013, mainly driven by the increase in funds from clients, foreign exchange portfolio and borrowings. In the past 12 months, we highlight the increase of R$134,471 million in funds from clients, mainly due to the increase in funds obtained through investment funds and assets under administration and savings deposits, partially offset by the decrease in time deposits. Total funds (free, raised and managed assets) grew R$221,234 million year on year. Funds from clients (1) R$ billion , , , , , , Dec/11 Mar/12 Jun/12 Sep/12 Dec/12 Mar/13 Jun/13 Sep/13 Demand and Savings Deposits Time Deposits + Debentures + Funds from Bills Assets Under Administration + Technical Provisions for Insurance, Pension Plan and Capitalization Total Funds from Clients + Interbank Deposits (1) It includes institutional clients in the proportion of each type of product invested by them. 31
30 Balance Sheet Ratio between Loan Portfolio and Funding Variation Sep 30, 13 Jun 30, 13 Sep 30, 12 sep/13 sep/13 jun/13 sep/12 Funding from Clients + Account Holders 441, , , % 4.8% Funds from Acceptance and Issuance of Securities Abroad 16,395 17,723 14, % 12.3% Borrowings 31,947 30,145 21, % 45.3% Other (1) 15,968 15,819 16, % -1.8% Total (A) 505, , , % 6.7% (-) Reserve Required by BACEN (79,985) (72,646) (76,951) 10.1% 3.9% (-) Cash (Currency) (2) (14,466) (14,671) (13,104) -1.4% 10.4% Total (B) 411, , , % 7.1% Loan Portfolio (C) (3) 387, , , % 7.6% C/A 76.5% 76.0% 75.9% 50 bps 60 bps C/B 94.1% 92.2% 93.6% 190 bps 40 bps (1) These comprise installments of subordinated debts that are not included in the Tier II Referential Equity. (2) It includes cash, bank deposits of institutions without reserve requirements, foreign currency deposits in Brazil, foreign currency deposits abroad, and cash and cash equivalents in foreign currency. (3) The loan portfolio balance does not include endorsements and sureties. The ratio of loans to funding, before the deduction of compulsory deposits and cash and cash equivalents, reached 76.5% in September, 2013, compared to 76.0% in June, Taking the compulsory deposits and cash and cash equivalents into consideration, this ratio reached 94.1% in September, 2013, compared to 92.2% in June, As from May 22, 2012, part of the funds that were previously intended for compulsory deposits were allowed to be used in financing and leasing operations through September 14, 2012, when they were replaced by motorcycle financing (Circular No. 3,569/11 and Circular No. 3,576/12 of the Central Bank of Brazil). Additionally, on September 14, 2012, Circular No. 3,609/12 was published and among its changes are the reduction of the compulsory on time deposits remunerated by the SELIC rate, from 64% to 50%, and the decrease in the additional rates of compulsory time deposits, from 12% to 11%, and in demand deposits, from 6% to 0%. On July 1, 2013, Circular No. 3,660/13, which redefines the rules for compulsory time deposits, changed the schedule to decrease the obligation to purchase credits from financial institutions classified as small and medium sized banks. Ratio between Loan Portfolio and Funding 95.5% 96.7% 98.0% 71.9% 93.6% 90.1% 94.1% 92.2% 94.1% 75.9% 76.8% 75.9% 73.9% 76.9% 76.0% 76.5% Dec/11 Mar/12 Jun/12 Sep/12 Dec/12 Mar/13 Jun/13 Sep/13 Funding Compulsory Deposits and Cash Loan Portfolio Loan Portfolio / Funding (%) Loan Portfolio / Gross Funding (*) (%) R$ billion (*) Gross funding, disregarding the deductions of compulsory deposits and cash and cash equivalents External Funding (1) The table below highlights the main issuances of Itaú Unibanco abroad in effect on September 30, US$ million Instrumento Issuer Balance at Exchange Balance at Issuances Amortization Jun 30,13 Variation Sep 30,13 Issue Date Maturity Date Coupon % p.y. Fixed Rate Notes(2) Itaú Chile /24/ /24/2017 UF(5) % Fixed Rate Notes(3) Itaú Chile /30/ /30/2017 UF(5) % Floating Rate Notes Itaubank /31/ /30/2015 Libor(6) % Medium Term Notes, Grand Cayman Branch 1,000 1,000 04/15/ /15/ % Medium Term Notes, Grand Cayman Branch 1,000 1,000 09/23/ /22/ % Medium Term Notes(4), Grand Cayman Branch 226 (1) /23/ /23/ % Medium Term Notes, Grand Cayman Branch /24/ /22/ % Medium Term Notes, Grand Cayman Branch /15/ /21/ % Medium Term Notes, Grand Cayman Branch /24/ /21/ % Medium Term Notes, Grand Cayman Branch 1,250 1,250 03/19/ /19/ % Medium Term Notes, Grand Cayman Branch 1,375 1,375 08/06/ /06/ % Medium Term Notes, Grand Cayman Branch 1,870 1,870 11/13/ /13/ % Structured Notes 5,446 - (757) 4,689 Total 14,054 - (757) (1) 13,296 (1) The balances refer to principal amounts; (2) and (3) Amounts in US$ equivalent on the issuance dates to CHP 46.9 billion and CHP 48.5 billion, respectively; (4) Amounts in US$ equivalent on the issuance dates to R$500 million; (5) Development Financial Unit; (6) 180-day Libor. On September 30, 2013, funds obtained abroad totaled US$13,296 million, a decrease of US$758 million from the second quarter of 2013 (presented in the Funding table in the previous section as Foreign Borrowings through Securities and Subordinated Debts). 32
31 Balance Sheet by Currency We adopt a management policy for foreign exchange risk associated with our asset and liability positions that is primarily intended to prevent impacts on consolidated results from fluctuations in foreign exchange rate parities. The Brazilian tax legislation determines that gains and losses from exchange rate variation on permanent foreign investments must not be included in the tax basis. On the other hand, gains and losses arising from financial instruments used to hedge such asset positions are impacted by tax effects. Therefore, in order to hedge net income from foreign exchange rate variations, a liability position must be built at a higher volume than the hedged assets. The Balance Sheet by Currency shows our assets and liabilities denominated in local and foreign currencies. On September 30, 2013, the net foreign exchange position was a liability of US$7,639 million. Assets September 30, 2013 Business in Brazil Consolidated Total Local Currency Foreign Currency Business Abroad Cash and Cash Equivalents 14,466 7,720 5,878 1,842 7,802 Short - Term Interbank Deposits 193, , ,677-16,628 Securities 272, , ,037 2,571 69,358 Loan, Lease and Other Loan Operations 361, , ,093 13,508 84,913 Loans 387, , ,148 13,508 86,511 (Allowance for Loan Losses) (25,653) (24,054) (24,054) - (1,598) Other Assets 226, , ,220 18,563 61,876 Foreign Exchange Portfolio 52,989 26,272 9,963 16,308 53,077 Other 174, , ,256 2,255 8,800 Permanent Assets 14,565 40,504 13,705 26, Total Assets 1,082, , ,611 63, ,417 Derivatives Purchased Positions 219,705 Total Assets After Adjustments (a) 282,989 Liabilities and Equity September 30, 2013 Business in Brazil Consolidated Total Local Currency Foreign Currency Business Abroad Deposits 252, , , ,355 Funds Received under Securities Repurchase Agreements 295, , ,087-14,049 Funds from Acceptances and Issue of Securities 50,672 68,764 35,302 33,462 14,665 Borrowings and On Lendings 73,301 56,487 35,302 15,351 29,999 Interbank and Interbranch Accounts 12,991 12,678 10,538 2, Derivative Financial Instruments 9,205 6,975 6,975-3,020 Other Liabilities 209, , ,392 15,355 78,173 Foreign Exchange Portfolio 53,315 26,553 11,677 14,876 53,122 Other 155, , , ,051 Technical Provisions of Insurance, Pension Plan and Capitalization 98,758 98,716 96,625 2, Deferred Income 1, Minority Interest in Subsidiaries 1, Stockholders' Equity of Parent Company 78,260 78,260 78,260-26,799 Capital Stock and Reserves 67,210 67,210 67,210-25,424 Net Income 11,050 11,050 11,050-1,375 Total Liabilities and Equity 1,082, , ,809 69,086 1,375 Derivatives Sold Positions 230,937 Total Liabilities and Equity After Adjustments (b) 300,023 Net Foreign Exchange Sold Position Itaú Unibanco (c = a - b) (17,034) Net Foreign Exchange Sold Position Itaú Unibanco (c) in US$ (7,639) Note: It does not consider eliminations of operations between local and foreign business units. Assets and liabilities denominated in foreign currencies We present below the net foreign exchange position, a liability position at a higher volume than the balance of the hedged assets (overhedge), which, when considering the tax effects on the net balance of other assets and liabilities denominated in foreign currency, reflects the elimination of the exposure to foreign exchange variations. Balance Sheet Variation Sep/13 Jun/13 Sep 13 Jun 13 Investments Abroad 26,798 26, % Net Foreign Exchange Position (Except Investments Abroad) (43,832) (44,506) % Total (17,033) (18,450) 1, % Total in US$ (7,639) (8,327) % 33
32 Risk Management Corporate Principles of Risk and Capital Management We regard risk management as an essential instrument for optimizing the use of resources and selecting the best business opportunities in order to create value to our stockholders. The risk management processes permeate the entire institution and are in line with the guidelines of the Board of Directors and Senior Management, which, through Committees and Superior Commissions, determine the overall objectives, expressed as targets and limits for the risk management business units. Meanwhile, the control and capital management units support Itaú Unibanco s management by means of monitoring processes and risk and capital analysis. The capital management process continually monitors the capital needs in scenarios of normality and stress, and helps on planning of targets and capital needs and on adopting a prospective posture in relation to capital management. For additional information on the risk and capital management structure, please see the Investor Relations website at Corporate Governance >> Risk Management Pilar 3. Credit Risk Our credit risk management is aimed at maintaining the quality of the credit portfolio at levels that are appropriate for each market segment in which we operate. The credit risk control is centralized and carried out by an independent executive area responsible for risk control. The main responsibilities include the following evaluating credit policies and new products, defining governance in model development, including its validation, calculating and monitoring the referential equity, evaluating the calculation of the portfolio s risk and return parameters, as well as their monitoring, and monitoring the allowance for loan losses Itaú Unibanco s centralized process for approving policies and validating models ensures the timing of credit actions. Operational Risk Our operational risk management structure is composed of operational risk management and control activities aimed at supporting the organization in decision-making processes, always in the search for the proper identification and evaluation of risks, the creation of value for stockholders, as well as the protection of our assets and image. Liquidity Risk Liquidity risk is defined as the possibility of our failing to efficiently meet expected and unexpected, current and future, obligations, including those arising from guarantees, without affecting the daily operations and incurring significant losses. The liquidity risk measurement comprises all financial operations of our companies, as well as possible contingent or unexpected exposures, such as those arising from settlement services, provision of endorsements and sureties and lines of credit raised but not used. Market Risk Our risk management strategy is aimed at balancing corporate business goals, taking into account, political, economic and market conditions, market risk portfolio of the institution and expertise to operate in specific markets, among others aspects. The control of market risk is carried out by an area that is independent from the business areas and it is responsible for carrying out, on a daily basis, the activities of risk measurement, assessment, analysis and reporting to the proper areas and persons according to the governance determined and monitoring the necessary procedures to adjust the position and/ or risk level, when applicable. To this end, Itaú Unibanco has a structured communication and information process that provides feedback for the monitoring of the Superior Committees and compliance with the requirements of Brazilian and foreign regulatory bodies. VaR of Itaú Unibanco The exposure to market risk of the portfolios of Itaú Unibanco and its foreign subsidiaries is presented in the table Global VaR by Risk Factor Group, which shows where the larger concentrations of market risk are. This quarter, we maintained our conservative management approach and diversified portfolio, keeping our policy of operating within lower limits in relation to our capital. The decrease seen in the Global VaR value compared to the previous quarter is mainly due to changes in our positions and to the decrease in the market volatility of some risk factors. VaR by Risk Factor Itaú Unibanco Itaú Unibanco Foreign Units Adjusted for tax effects. VaR refers to the maximum potential loss for a day, with a 99% confidence level. Volatilities and correlations are estimated based on a methodology that attributes more weight to the most recent information. Evolution of Itaú Unibanco's Value at Risk Capital Adequacy Through the Internal Capital Adequacy Assessment (ICAAP), we aim at ensuring the sufficiency of capital to cover our risks, represented by the Required Referential Equity (PRE) for credit, market and operational risks and by the capital necessary to cover the other risks, the assessment of which is the subject matter of ICAAP jun/11 sep/11 dec/11 mar/12 jun/12 sep/12 dec/12 mar/13 jun/13 sep/13 Global Maximum Average Minimum Sep Jun Brazilian Interest rates Other Foreign Interest rates FX rates Brazilian Inflation Indexes Equities and Commodities Banco Itaú BBA International Banco Itaú Argentina Banco Itaú Chile Banco Itaú Uruguay Banco Itaú Paraguay Banco Itaú BBA Colombia Diversification Effect (103.3) (151.2) Global VaR Maximum VaR in the Quarter Average VaR in the Quarter Minimum VaR in the Quarter
33 Capital Ratios (BIS) Solvency Ratios Economic-Financial Consolidated Variation Sep 30,13 Jun 30,13 Sep 30,12 Sep 30,13 - Sep 30,13 - Jun 30,13 Sep 30,12 Stockholder s Equity of Parent Company 78,260 75,781 78,979 2,478 (719) Referential Equity Tier I 78,712 75,988 77,282 2,724 1,430 (*) Referential Equity Tier II 37,279 37,104 33, ,795 Total exposure weighted by risk 661, , ,186 14,439 29,632 Credit Assets Expansion Simulation 392, , ,775 11,916 17,872 Excess of Capital 43,191 41,880 41,225 1,311 1,966 Ratios (%) BIS (Referential Equity / Total exposure weighted by risk) bps 0 bps Tier I bps -40 bps Tier II bps 40 bps (*) It takes into consideration the redeemable non-voting shares and the exclusion of credit instruments issued by financial institutions and adjustments to market value securities and derivatives. On September 30, 2013, the stockholders' equity of the parent company totaled R$78,260 million, an increase of R$2,478 million in relation to June 30, The BIS ratio reached 17.5%, steady in relation to June 30, 2013, due to the increase in the total exposure weighted by risk followed by the increase in Referential Equity. The Tier I ratio increased 10 basis points in the quarter. The total ratio exceeds the minimum of 11% required by the Central Bank of Brazil and indicates an excess of capital of R$43.2 billion, allowing for the increase of up to R$392.6 billion in credit assets based on a 100% risk-weighting. If the remaining values of assets realization and the complementary allowance for loan losses in the reference equity were taken into consideration, our BIS ratio would have been of 18.4%. The evolution of the BIS ratio and Referential Equity Tier I is presented below. Solvency Ratios 17.5% 11.8% Sep/13 BIS 17.5% 11.7% Jun/13 Tier I 17.5% 12.2% Sep/12 Note: The BIS ratio of the financial system consolidated (another criterion used by the Central Bank of Brazil) reached 18.0% on September 30, The difference between the BIS ratios of the financial conglomerate and the economic-financial consolidated (CONEF) arises from the inclusion of non-financial subsidiaries in the economic-financial consolidated, the funds of which may, when necessary, be distributed to financial companies through the payment of dividends/jcp (interest on net equity) or corporate restructuring. Referential Equity Economic-Financial Consolidated Sep 30,13 Jun 30, 13 Sep 30,12 Sep 30,13 - Jun 30, 13 Variation (*) It takes into consideration the redeemable non-voting shares and the exclusion of credit instruments issued by financial institutions and adjustments to market value securities and derivatives. Sep 30,13 - Sep 30,12 Referential Equity Tier I 78, % 75, % 77, % 2,724 1,430 Referential Equity Tier II (*) 37, % 37, % 33, % 175 3,795 Referential Equity 115, , ,766 2,899 5,226 On September 30, 2013, our Referential Equity reached R$115,991 million, an increase of R$2,899 million when compared to June 30, 2013, due to the increase in Tier I. When compared to the same period of the previous year, the Referential Equity increased R$5,226 million. Aiming at ensuring the soundness of Itaú Unibanco and the capital availability to support the business growth, the levels of Referential Equity were maintained well above the Required Preferential Equity, as demonstrated by the BIS ratio. Therefore, the capital levels are more than sufficient to cover the risks. Circular No. 3,608, of August 17, 2012, changed the procedures for the calculation of the Required Referential Equity portion related to the foreign currency risk (PCAM), mentioned in Circular No. 3,568. Until December 31, 2013, if exposures are equal to or lower than 2% of the Referential Equity, the PCAM portion will be zero and, therefore, we have not allocated capital to it in this quarter. If the new rule were in effect, the ratios would decrease approximately 0.2%. Subordinated Debt and Referential Equity Tier II Set 30, 2013 Maturities < 1 year 1-2 years 2-3 years 3-4 years 4-5 years > 5 years Total CDB (Time Deposits) 3,635 2,445 4,151 1, ,755 Financial Treasury Bills 449-2,188 7,297 9,534 5,329 24,798 Euronotes ,152 17,397 Subordinated Debt 4,329 2,445 6,340 8,819 9,534 22,481 53,949 Subject to approval - Central Bank of Brazil (*) and Other Subordinated Debt - Total 4,347 2,445 6,418 8,819 9,535 22,828 54,394 (*) Subordinated debt that does not make up the Tier II Referential Equity. Subordinated Debt (part of Referential Equity Tier II) ,536 5,292 7,628 22,481 38,425 35
34 Capital Ratios (BIS) Exposure by Risk Sep 30,13 Jun 30,13 Sep 30,12 Sep 30,13 - Jun 30,13 Variation Sep 30,13 - Sep 30,12 Exposure weighted by credit risk (EPR) 594, , ,832 18,131 27,892 Portion required for credit risk coverage (PEPR = 0.11x(EPR)) 65,420 63,425 62,351 1,994 3,068 FPR at 20% 1,170 1, (224) 796 FPR at 35% FPR at 50% 4,397 3,518 4, (341) FPR at 75% 23,841 23,425 12, ,091 FPR at 100% 30,113 29,529 40, (10,328) FPR at 150% 2,282 2,068 1, FPR at 300% 2,323 2,341 1,803 (17) 521 Derivatives potential future gain Portion required for operational risk coverage (POPR) 4,870 4,773 4, Portion required for market risk coverage 2,511 3,014 2,832 (503) (322) Operations subject to interest rate variation (PJUR) 2,098 2,540 2,489 (442) (391) Operations subject to commodity price variation (PCOM) Operations subject to stock price variation (PACS) (87) (7) Total exposure weighted by risk (Risk Weighted Assets - RWA) [EPR + (1/0.11x(Operational Risk+Market Risk)] 661, , ,186 14,439 29,632 The total exposure weighted by risk amounted to R$661,818 million in September 30, The increase of R$14,439 million when compared to June 30, 2013 is mainly due to the variation of R$1,994 million in the portion required for credit risk coverage. The variation of the portion required for market risk coverage that decreased R$503 million is due to the reduced capital needs transactions subject to interest rate variations, which decreased R$442 million. In accordance with the Circular Letters No. 3,383 and No. 3,476 of the Central Bank of Brazil, the portion required to cover operational risk is recalculated every six months. In September 2013, this portion reached R$4,870 million, an increase of R$97 million from the previous quarter. Evolution of the Composition of the Risk Weighted Exposure Composition of the Portion to Cover Credit Risk (PEPR = 0.11x(EPR)) 1.7% 6.2% 3.2% 3.4% 4.1% 4.3% 5.3% 4.2% 3.4% 6.8% 6.6% 6.3% 6.0% 6.7% 6.7% 7.0% 3Q13 R$65.4 billion 6.0% 2Q13 R$63.4 billion 5.5% 25.5% 19.3% 25.6% 19.8% 92.1% 90.0% 90.0% 89.7% 89.6% 87.8% 89.1% 89.9% Dec/11 Mar/12 Jun/12 Sep/12 Dec/12 Mar/13 Jun/13 Sep/13 Credit Risk Operational Risk Market Risk Credit Risk (PEPR) Operational Risk (POPR) Market Risk ROA - Risk Adjusted 49.3% 49.1% Securities Retail Non Retail Other Exposure Variation 3Q13 2Q13 3Q12 3Q13-2Q13 3Q13-3Q12 ROA - Recurring Return on Assets (A) 1.5% 1.4% 1.5% 10 bps 0 bps Return on Average Risk Weighted Assets / Average Assets (B) 61.2% 60.9% 67.0% 30 bps -58 bps Leverage bps 16 bps Risk Weighted Leverage (RWA/RE) bps -20 bps Risk Adjusted ROA (A/B) 2.5% 2.3% 2.2% 20 bps 30 bps In the third quarter of 2013, the annualized recurring return on average assets reached 1.5%. The ratio between the exposure weighted by credit, operational and market risks and the average total assets reached 61.2% in the third quarter of 2013, compared to 60.9% in the previous period, an increase of 30 basis points. As a consequence, the riskadjusted ROA, which considers the return and total weighted assets that require capital allocation, was 2.5% in the third quarter of 2013, representing an increase of 20 basis points from the second quarter of
35 Ownership Structure The management of our ownership structure is mainly intended to optimize the capital allocation to the various segments comprising the conglomerate. The average acquisition cost of treasury shares, as well as the activity of options granted to conglomerate executives under the Stock Option Plan, are set out in Note 16-f of the Complete Financial Statements. The table below shows the number of shares of capital stock and treasury shares as of September 30, The average cost of the 71 million shares in Treasury was R$ per share: Number of Shares In thousands Common Shares Non-voting Shares Total Balance of Shares 2,518,215 2,509,815 5,028,030 Treasury Shares On12/31/ ,554 52,556 Purchase of treasury shares - 23,500 23,500 Exercised options - Granting of stock options - (5,061) (5,061) Disposals - Stock option plan - (4,477) (4,477) Bonus in Shares - 4,707 4,707 On 09/30/ ,223 71,225 Total Shares (-) Treasury 2,518,213 2,438,592 4,956,805 The organization chart below summarizes the current ownership structure on September 30, 2013: Moreira Salles Family % Total Egydio Souza Aranha Family 61.14% Common Shares 17.05% Non-voting Shares 34.03% Total Free Float* 38.86% Common Shares 82.95% Non-voting Shares 65.97% Total Cia. E. Johnston de Participações 50.00% Common Shares 33.47% Total Itaúsa 50.00% Common Shares 66.53% Total 38.66% Common Shares 19.64% Total IUPAR Itaú Unibanco Participações S.A % Common Shares 25.91% Total Free Float* 9.42% Common Shares 99.52% Non-voting Shares 53.75% Total Itaú Unibanco Holding S.A. (*) Excluding Controlling Stockholders and Treasury Average Daily Trading Volume (BM&FBovespa + NYSE) Non-voting Shares Mix on September 30, 2013 CAGR 05-sep/13 : 18.18% CAGR 05-sep/13 : 20.40% CAGR 05-sep/13 : 16.33% Sep/13 Foreign Investors (BM&FBovespa) 25% Foreign Investors in NYSE (ADR) 38% Brazilian Investors (BM&FBovespa) 37% NYSE (ADR) BM&FBOVESPA (Non-voting + Common) 37
36 Performance in the Stock Market Performance in the Stock Market 3Q13 Our voting and non-voting shares were traded on all BM&FBOVESPA s sessions in Additionally, our non-voting shares are included in all stock exchange indexes where financial institution shares may be listed. (R$) (R$) (US$) Non-voting Common Shares Shares ADRs ITUB4 ITUB3 ITUB Closing Price at 09/30/ Maximum price in quarter Average price in quarter Minimum price in quarter Closing Price at 06/30/ Maximum price in 12 months* Average price in 12 months Minimum price in 12 months** Closing Price at 09/30/ Change in the last 12 months 13.1% 21.7% 1.6% Change in 3Q13 9.4% 3.3% 9.3% Average daily trading financial volume - in 12 months (million) Average daily trading financial volume in 3Q13 (million) * prices on 03/11/13 for non-voting shares and common shares and on 03/08/12 for ADRs. ** prices on 10/23/12 for non-voting shares and common shares and 07/05/13 for ADRs. Market Capitalization (*) vs. Ibovespa Index As of September 30, 2013, our market capitalization was R$156 billion. When compared to the third quarter of 2003, our market capitalization grew the equivalent of 6.6 times whereas the Ibovespa grew 4.6 times. According to the information provided by Bloomberg, on September 30, 2013, we were the 22 nd largest bank in the world ranking of banks by market capitalization. CAGR 02-sep/13 :15,30% CAGR 02- sep/13 :19.11% Sep/13 Bovespa Index (thousands points) Market Capitalization (billion) (*) Average price of non-voting shares (the most liquid) at the last trading day of the period x total shares outstanding. Price/Earnings * Price/Book Value * Dec/08 Dec/09 Dec/10 Dec/11 Dec/12 Sep/13 Dec/08 Dec/09 Dec/10 Dec/11 Dec/12 Sep/13 (*) Closing price at the period-ended/earnings per share. (*) Closing price at the period-ended/book Value per share. Net Income per Share and Recurring Net Income per Share (R$) Q11 3Q11 4Q11 1Q12 2Q12 3Q12 4Q12 1Q13 2Q13 3Q13 Recurring Net Income per share Net Income per share 0.80 In the third quarter of 2013, recurring net income per share totaled R$0.81, an increase of R$0.08 from last quarter. Net income per share totaled R$0.80, an increase of R$0.12 from the same period of last year. Market Consensus Main market analysts periodically issue their recommendations on shares subject to their analyses. These recommendations help a number of investors to select the best option in which to invest. Based on information provided by Bloomberg and Thomson Analytics on October 28, we reproduce in the table below the recommendations on Itaú Unibanco Holding s non-voting shares. Thomson Bloomberg Buy Hold 3 4 Sell 0 0 Number of Analysts Based on information provided by Thomson, the average estimated target price is R$37.14, a potential appreciation of 18.1% for September According to Bloomberg, the average estimated target price for the same period is R$37.50, a potential appreciation of 19.2%. 38
37 Repurchase of Treasury Shares In the third quarter of 2013, we purchased 14,500,000 non-voting shares for the average price of R$28.02, totaling R$406.3 million. Since November 2004, Itaú Unibanco has been disclosing, on a monthly basis, on its Investor Relations website, its transactions with its own shares. The voluntary disclosure on these transactions strengthens Itaú Unibanco s commitment to the adoption of Corporate Governance best practices in its business. To learn more, please visit: > Corporate Governance > Acquisition of Own Shares. See below the transactions carried out in each month: Period Trading Volume Average Price Acquisition Cost () September 1,000, ,170 August 7,000, ,250 July 6,500, ,890 Dow Jones Sustainability World Index (DJSWI) We were chosen for the 14 th consecutive time to compose the DJSWI, the main corporate sustainability index in the world, in its 2013/2014 edition. We are the only Latin-American bank to make up the index since it was created. The new portfolio comprises 330 companies of 25 countries in the Americas, Europe, Asia, Africa and Oceania, of which only 8 are Brazilian companies. In this last edition, the bank achieved the highest rate of the banking industry in Anticrime Policy/Measures, Brand Management and Financial Stability and Systemic Risk". The index is reviewed annually based on a questionnaire sent to the companies and on publicly available information. The survey covered the 2,500 largest companies by market capitalization in the Dow Jones Global Index, representing 59 business sectors. Only the 10% best classified companies from each sector in the sustainability ranking are selected to make up the index. Selection is based on the analysis of more than 20 items with respect to company economic, social and environmental performance. Market Relations Continuing the Apimec 2013 meeting cycle throughout Brazil, until October we had held 19 of the 22 meetings scheduled for the year, 7 of them at Expo Money events, which are financial education-oriented fairs. To date, 2,757 people participated in our Apimec meetings. We also participated in all 7 Expo Money fairs carried out in Brazil this year. Apimec meetings scheduled for the fourth quarter are as follows: Apimec Meetings 4Q13 São Paulo Rio de Janeiro* Porto Alegre* * Will be held at Expo Money fairs. Main Ratings - Moody s Update November, 12-2 p.m. November, 13-7 p.m. November, 27-7 p.m. At the beginning of October, Moody s disclosed a change in the outlook of Brazil s sovereign rating from positive to stable based on the following consideration: (i) the main credit measurements are deteriorating; (ii) the economy has been growing slowly for a long time; and (iii) deterioration in the quality of the reports on government accounts. As a result of this change, the rating agency changed the outlook from positive to stable of the (i) issuer rating and longterm deposit rating in global scale and local currency and (ii) long -term deposit rating and senior and subordinated debt rating in foreign currency of Additionally, due to the agency s reassessment on the capability of the Brazilian government to provide systemic support to the financial system, Moody s downgraded: (i) the issuer long-term rating in global scale and local currency and (ii) long-term programs/long-term senior debt in global scale and foreign currency of To learn more about the ratings, please visit > Market Opinion > Ratings. Non voting Shares (PN - ITUB4) Appreciation The chart below shows the evolution of R$100 invested on September 30, 2003 through September 30, 2013, by comparing the values, with and without reinvestment of dividends, to the performance of the Ibovespa and the CDI (Interbank Deposit Certificate). CAGR: 20.17% 628 CAGR: 16.44% CAGR: 12.58% CAGR: 12.37% Itaú Unibanco's non-voting shares WITH reinvestments of dividends São Paulo Stock Exchange Index (Bovespa Index) Itaú Unibanco's non-voting shares WITHOUT reinvestments of dividends CDI 39

38 Assessment Notice of the Federal Revenue Service In August, we announced to the market that the Federal Revenue Service (RFB) sent an assessment notice amounting to approximately R$18 billion related to the corporate transaction of association between Itaú and Unibanco. The RFB does not agree with the corporate form adopted to join the operations of Itaú and Unibanco. However, the transaction form suggested by the RFB is not supported by the rules applicable to financial institutions in Brazil. Accordingly, we challenged the assessment notice, affirming that the transaction carried out was appropriate and that, therefore, the understanding of the RFB that there was a tax gain is unsupported. We understand that the risk of loss in the tax procedure in question is remote, and this understanding is supported by our attorneys and external advisors. We reaffirm that the transaction carried out in 2008 was legitimate and approved by the management bodies of the companies involved and their respective stockholders and it was subsequently approved by the proper authorities, namely the Brazilian Securities Commission (CVM), the Central Bank of Brazil (BACEN) and the Brazilian antitrust agency (CADE). Agreement between Itaú Unibanco and Fiat On August 20, we renewed, for another 10 years, the commercial cooperation agreement we have with Fiat, a leading vehicle seller in the Brazilian market. This agreement provides for exclusivity in the offer of financing in promotional campaigns of Fiat for the sale of new cars and the exclusive use of the Fiat brand in activities related to vehicle financing. Awards - Capital Markets The awards and recognition granted to Itaú in the third quarter of 2013 are presented below: 1000 Best Investment Funds 2013 Granted by Exame magazine together with the Finance Study Center of the Getúlio Vargas Foundation (FGV), this award recognized the best investment fund managers in the Brazilian market. We were recognized with the Best Manager of the Year award. In addition to this award, we were recognized in the following categories: - Funds in which investors invest between 50,000 and 250,000 Brazilian reais (selective retail); - DI and short-term funds; - Indexed stock funds; - Multimarket funds. Latin American Executive Team 2013 organized by the Institutional Investor Magazine, this ranking is achieved based on a survey conducted with over 800 managers of investment and pension funds (buy side analysts), brokers and investment banks (sell side analysts) operating in Latin America. It was disclosed on August 20, and we were the winners in six out of the eight ranking categories for financial entities: Best Investor Relations by the Sell and Buy Sides; the Best CEO by the Sell and Buy Sides; the Best Bank CFO by the Buy Side and the Best Investor Relations Professional by the Buy Side. Latin America Research Team 2013 for the first time Itaú BBA was ranked as the number one Research team of Latin America. Best Cash Management Bank in Brazil for the sixth consecutive year, Euromoney magazine, one of the most important publications on the financial market, recognized us as the best company in Brazil in Cash Management. New Hiper Brand We publicized the launch of our new credit card brand available to all Brazilian consumers, Hiper, which is accepted by more than one million establishments registered by REDE throughout Brazil. Hiper evolved from Hipercard, the largest Brazilian credit card brand, and was launched to meet the needs of consumers who seek a product with immediate benefits. The first issuer of the Hiper brand will be Itaucard for both account holders and non-account holders of the bank. Among the benefits are: - conversion of 120% of the annual fee into mobile phone credit bonus, applicable to all telephone carriers that work with the bonus system. - cards with the Itaucard 2.0. concept Redecard is now REDE We developed a new brand, a new positioning and a new business strategy. REDE, a simpler and more direct name, synthesizes the main qualities of the company, suggesting technology, agility and modernity, in addition to creating a young and connected personality. The company s focus was reviewed; we will continue to serve shop owners but we will also care about final clients by working more closely with them and offering faster and more technological services through digital and mobile media. In accordance with the objective of being the main partner of sellers of goods and services that seek to increase the potential of their business, REDE offers to its clients a number of products that follow innovative market trends. They include Mobile REDE (captures transactions through a device coupled to a smart phone or tablet for card reading or through the entry of the data on sales and the client s signature); and e-rede (in a single platform, an agile, efficient, fast and complete solution for online payments using a sound antifraud security system). To support this operation, around 300 people will reinforce the sales team. Over the past two years, around R$500 million was invested in the renewal and standardization of 75% of the machine base (50% of which is wireless equipment - POS). At the end of the first half of 2013, REDE had registered one million establishments and more than 1.7 million terminals in 89% of the Brazilian municipalities. Its transactions totaled more than R$1.6 billion. 40
39 analysis of segments, products and services 3 rd quarter of 2013
40 (This page was left in blank intentionally) 42
41 Analysis of Segments Pro Forma Adjustments Adjustments made to the balance sheet and statement of income for the year are based on managerial information from the business units. The financial statements were adjusted in order to replace the accounting stockholders equity with funding at market prices. Subsequently, the financial statements were adjusted in order to include revenues linked to allocated capital at each segment. The cost of subordinated debt and the respective remuneration at market prices were allocated to segments on a pro rata basis, in accordance with the economic allocated capital. As from the first quarter of 2013, we changed the presentation of our segments so that it is more aligned to our monitoring of the evolution of results. There have also been changes in nomenclature, in order to adapt it to our current structure: (a) Commercial Banking - Retail, (b) Consumer Credit - Retail, (c) Wholesale Banking and (d) Activities with the Market + Corporation. The results of the middle market companies, previously allocated in the former Commercial Banking segment, are now reported in the Wholesale Banking segment. The Activities with the Market + Corporation column presents the result from excess capital, excess subordinated debt and the net balance of tax assets and liabilities. It also shows the financial margin on market transactions, costs of Treasury operations, equity in the earnings of companies that are not linked to any segment and our interest in Porto Seguro. Allocated Capital Impacts related to capital allocation are considered in the Pro Forma financial statements by segment. To this end, adjustments were made to the financial statements, using a proprietary model. The economic allocated capital model (EAC) was adopted for the Pro Forma financial statements by segment, which considers, in addition to allocated capital Tier I, the allocated capital Tier II (Subordinated Debt) and the effects of the calculation of expected credit losses, in addition to that required by the Brazilian Central Bank Circular No. 2,682/99 of the CMN. Accordingly, the allocated capital considers the following components: credit risk (including expected loss), operational risk, market risk, and insurance underwriting risk. Based on this measure of capital, we determined the Risk Adjusted Return on Capital (RAROC), which corresponds to an operational performance ratio consistently adjusted to the required capital needed to support the risks of the financial positions assumed. Income Tax Rate We consider the full income tax rate, net of the tax effect of the payment of interest on net equity, for the Commercial Banking - Retail, Consumer Credit - Retail, Wholesale Banking and Activities with the Market. The difference between the amount of income tax determined by segment and the amount of the effective income tax, as indicated in the consolidated financial statement, is allocated to the Activities with the Market + Corporation segment column. 43
42 Analysis of Segments The pro forma financial statements of the Commercial Banking - Retail, Consumer Credit - Retail, Wholesale Banking and Activities with the Market + Corporation, presented below, are based on managerial information derived from internal models, so as to more accurately reflect the activities of the business units. Pro Forma Balance Sheet by Segment On September 30, 2013 (*) The Intercompany operations were eliminated in the Consolidated. (**) The Economic Capital allocated to the Activities with the Market + Corporation column contains all the excess capital of the institution so as to arrive at the accounting net equity. Pro Forma Income Statement by Segment 3 rd Quarter of 2013 Commercial Banking - Retail Consumer Credit - Retail Wholesale Banking Activities with the Market + Corporation Itaú Unibanco Assets Current and Long-Term Assets 738,109 83, , ,700 1,068,222 Cash and Cash Equivalents 12,770-1,703-14,466 Short-term Interbank Investments 270,444-24,919 4, ,263 Short-term Interbank Deposits in the Market 209,387-4,782 4, ,263 Short-term Interbank Deposits in Intercompany (*) 61,057-20, Securities and Derivative Financial Instruments 171,906-91,968 54, ,110 Interbank and Interbranch Accounts 70,090-3,865-73,878 Loan, Lease and Other Credit Operations 131,239 81, ,285 4, ,040 (Allowance for Loan Losses) (9,640) (6,577) (4,315) (62) (20,594) (Complementary Expected Loss Provisions) (5,058) (5,058) Other Assets 91,299 8,592 12,216 55, ,117 Foreign Exchange Portfolio 34,823-7,991 22,363 52,989 Others 56,476 8,592 4,225 32, ,128 Permanent Assets 9,064 2,570 1,438 1,492 14,565 Total Assets 747,173 86, , ,192 1,082,787 Liabilities and Equity Current and Long-Term Liabilities 725,525 77, ,825 87,831 1,001,600 Deposits 207, ,738 10, ,279 Deposits from Clients 191, ,681 10, ,279 Intercompany Deposits (*) 15,211-61, Deposits Received under Securities Repurchase Agreements 190,231 60,631 64,441 14, ,136 Securities Repurchase Agreements in the Market 185,305 60,631 52,125 14, ,136 Securities Repurchase Agreements - Intercompany (*) 4,926-12, Funds from Acceptances and Issue of Securities 77,372-10,523-50,672 Interbank and Interbranch Accounts 9, ,839-12,991 Borrowings and Onlendings 25,520 2,041 46,621-73,301 Derivative Financial Instruments (1,413) - 14,904-9,205 Other Liabilities 118,698 14,632 26,757 62, ,258 Foreign Exchange Portfolio 35,106-8,034 22,363 53,315 Others 83,592 14,632 18,724 40, ,943 Technical Provisions for Insurance, Pension Plans and Capitalization 98, ,758 Deferred Income ,085 Minority Interest in Subsidiaries ,842 1,842 Economic Allocated Capital - Tier I (**) 20,780 8,921 23,037 25,520 78,260 Total Liabilities and Equity 747,173 86, , ,192 1,082,787 Commercial Banking - Retail Consumer Credit - Retail Wholesale Banking Activities with the Market + Corporation Note: Non-interest Expenses item is made up of Personnel Expenses, Administrative Expenses, Other Tax Expenses and Operating Expenses. The Consolidated figures do not represent the sum of the parts, because there are transactions between the companies that were eliminated only in the Consolidated figures. Itaú Unibanco Operating Revenues 11,294 3,729 3, ,612 Managerial Financial Margin 5,998 2,286 2, ,835 Financial Margin with Clients 5,998 2,286 2, ,495 Financial Margin with the Market Banking Service Fees and Income from Banking Charges 3,219 1, ,591 Result from Insurance, Pension Plans and Capitalization Operations before Retained Claims and Selling Expenses 2, ,187 Loan and Retained Claims/ Losses net of Recovery (1,775) (1,238) (703) (40) (3,755) Expenses for Allowance for Loan Losses (2,168) (1,569) (760) (40) (4,537) Income from Recovery of Credits Written Off as Losses ,297 Retained Claims (499) 0 (16) - (515) Operating Margin 9,519 2,491 3, ,858 Other Operating Income/(Expenses) (6,612) (1,839) (1,595) 56 (9,989) Non-interest Expenses (5,711) (1,565) (1,369) (57) (8,703) Tax Expenses for ISS, PIS, Cofins and Other Taxes (642) (274) (226) 113 (1,029) Selling Expenses From Insurance (258) (258) Income before Tax and Profit Sharing 2, , ,868 Income Tax and Social Contribution (1,058) (177) (485) (77) (1,796) Minority Interests in Subsidiaries - (48) - (2) (50) Recurring Net Income 1, , ,022 (RAROC) Return on Average Tier I Allocated Capital 35.9% 19.1% 17.9% 12.0% 20.9% Risk Adjusted Efficiency Ratio (RAER) 72.7% 81.1% 58.1% 10.6% 68.4% Efficiency Ratio (ER) 56.0% 45.3% 38.4% 6.3% 48.2% 44
43 Analysis of Segments The pro forma financial statements of the Commercial Banking - Retail, Consumer Credit - Retail, Wholesale Banking and Activities with the Market + Corporation, presented below, are based on managerial information derived from internal models, so as to more accurately reflect the activities of the business units. Pro Forma Balance Sheet by Segment On June 30, 2013 (*) The Intercompany operations were eliminated in the Consolidated. (**) The Economic Capital allocated to the Activities with the Market + Corporation column contains all the excess capital of the institution so as to arrive at the accounting net equity. Pro Forma Income Statement by Segment 2 nd Quarter of 2013 Commercial Banking - Retail Commercial Banking - Retail Consumer Credit - Retail Consumer Credit - Retail Wholesale Banking Wholesale Banking Activities with the Market + Corporation Activities with the Market + Corporation Note: Non-interest Expenses item is made up of Personnel Expenses, Administrative Expenses, Other Tax Expenses and Operating Expenses. The Consolidated figures do not represent the sum of the parts, because there are transactions between the companies that were eliminated only in the Consolidated figures. Itaú Unibanco Assets Current and Long-Term Assets 739,917 84, , ,733 1,043,947 Cash and Cash Equivalents 12,313-2,358-14,671 Short-term Interbank Investments 264,430-19,132 4, ,578 Short-term Interbank Deposits in the Market 216,723-1,724 4, ,578 Short-term Interbank Deposits in Intercompany (*) 47,707-17, Securities and Derivative Financial Instruments 162,049-96,740 59, ,789 Interbank and Interbranch Accounts 66,124-3,767-69,855 Loan, Lease and Other Credit Operations 127,312 82, ,922 4, ,213 (Allowance for Loan Losses) (10,524) (6,432) (4,323) (62) (21,341) (Complementary Expected Loss Provisions) (5,058) (5,058) Other Assets 118,213 8,507 12,875 62, ,240 Foreign Exchange Portfolio 61,768-7,380 30,278 49,851 Others 56,445 8,507 5,495 32, ,389 Permanent Assets 8,611 2,351 1,333 1,439 13,734 Total Assets 748,528 86, , ,172 1,057,681 Liabilities and Equity Current and Long-Term Liabilities 727,187 77, , , ,999 Deposits 197, ,185 10, ,031 Deposits from Clients 186, ,479 10, ,031 Intercompany Deposits (*) 11,086-47, Deposits Received under Securities Repurchase Agreements 181,434 60,453 75,658 20, ,269 Securities Repurchase Agreements in the Market 175,112 60,453 36,264 20, ,269 Securities Repurchase Agreements - Intercompany (*) 6,322-39, Funds from Acceptances and Issue of Securities 80,200-9,946-53,202 Interbank and Interbranch Accounts 4, ,604-8,337 Borrowings and Onlendings 24,393 2,288 43,317-69,139 Derivative Financial Instruments (3,029) - 18,484-11,530 Other Liabilities 144,101 14,779 27,338 70, ,044 Foreign Exchange Portfolio 61,957-7,508 30,278 50,168 Others 82,144 14,779 19,831 40, ,876 Technical Provisions for Insurance, Pension Plans and Capitalization 97, ,447 Deferred Income ,105 Minority Interest in Subsidiaries ,796 1,796 Economic Allocated Capital - Tier I (**) 20,440 9,035 22,070 24,237 75,781 Total Liabilities and Equity 748,528 86, , ,172 1,057,681 Itaú Unibanco Operating Revenues 11,064 3,729 3, ,166 Managerial Financial Margin 5,844 2,380 2, ,573 Financial Margin with Clients 5,844 2,380 2, ,305 Financial Margin with the Market Banking Service Fees and Income from Banking Charges 3,122 1, ,399 Result from Insurance, Pension Plans and Capitalization Operations before Retained Claims and Selling Expenses 2, ,194 Loan and Retained Claims/ Losses net of Recovery (1,974) (1,186) (1,020) 16 (4,164) Expenses for Allowance for Loan Losses (2,356) (1,466) (1,105) 16 (4,912) Income from Recovery of Credits Written Off as Losses ,262 Retained Claims (499) - (15) - (514) Operating Margin 9,090 2,543 2, ,003 Other Operating Income/(Expenses) (6,464) (1,821) (1,510) (169) (9,965) Non-interest Expenses (5,596) (1,555) (1,289) (186) (8,626) Tax Expenses for ISS, PIS, Cofins and Other Taxes (619) (266) (221) 17 (1,090) Selling Expenses From Insurance (249) (249) Income before Tax and Profit Sharing 2, , ,038 Income Tax and Social Contribution (935) (218) (311) 72 (1,393) Minority Interests in Subsidiaries - (18) - (6) (24) Recurring Net Income 1, ,622 (RAROC) Return on Average Tier I Allocated Capital 33.1% 21.4% 13.6% 11.9% 19.3% Risk Adjusted Efficiency Ratio (RAER) 74.9% 79.2% 68.0% 22.0% 72.1% Efficiency Ratio (ER) 56.0% 44.9% 38.0% 24.0% 49.1% 45
 and very small and small companies.")
44 Analysis of Segments Commercial Banking - Retail Retail Points of Service in Brazil (*) The revenues from the Commercial Banking - Retail segment arise from the offer of banking products and services to a diversified client base, including individuals and companies. The segment includes retail, high-income and high-net worth clients (private banking) and very small and small companies. In the third quarter of 2013, recurring net income from the Commercial Banking Retail segment totaled R$1,849 million, an increase of 9.3% from the previous quarter. This increase, of R$158 million, is due to the 2.1% increase in operating revenues (the main highlight was the increase of 2.6% in the financial margin with clients) and the 10.1% decrease in loan and insurance losses, net of recovery. Other operating expenses increased 2.3% from the second quarter of 2013, mitigating the positive impact of operating revenues and of the results from loan losses and retained claims. The Commercial Banking Retail segment s annualized return on allocated capital reached 35.9% in the period, a 280 basis point increase from the previous quarter. The risk-adjusted efficiency ratio reached 72.7%. Loan Portfolio - Commercial Banking The loan portfolio totaled R$131,239 million at the end of the third quarter, increasing 3.1% when compared to the previous quarter. The coverage ratio for NPL over 90 days (with no additional allowance) remained higher than 120% in the last 2 years and reached 141% in September 2013, a decrease of 100 basis points from the previous quarter. If the additional allowance were taken into consideration, the coverage ratio would have reached 173% in September 2013, an increase of 200 basis points from June Allowance for Loan Losses and Coverage Ratio 124% 135% 124% 124% 125% 10,748 11,471 11,569 12, % 142% 141% 11,541 11,219 10,524 9,640 Dec/11 Mar/12 Jun/12 Sep/12 Dec/12 Mar/13 Jun/13 Sep/13 Allowance for Loan and Lease Losses (without complementary portion) Coverage - NPL overdue 90 days Some additional Commercial Banking - Retail Highlights: Service Network (*) Individuals Our service network covers most of the Brazilian territory and adopts a segmentation strategy that includes structures, products and services developed to meet the specific needs of our many different clients. Our segments are: Itaú, Itaú Personnalité and Itaú Private Bank. Our products are available in our service network and through the 30 Horas electronic channels and include: deposit accounts, investments, credit cards, personal loans, insurance, mortgage loans, vehicle financing and other banking products. At the end of September 2013, our service network in Brazil was comprised of 4,722 units, including regular branches and customer-service branches (CSB). In the year, 55 branches and 34 CSBs were opened. 4,701 4,694 4,714 4,719 4,731 4,706 4,711 4,722 3,820 3,826 3,844 3,848 3,855 3,847 3,860 3, Dec/11 Mar/12 Jun/12 Sep/12 Dec/12 Mar/13 Jun/13 Sep/13 Client Services Branches (CSB) (*) It does not include branches and CSBs abroad and Itaú BBA. Geographical Distribution of Service Network (*) Number of Branches and Client Service Branches (CSB) North 132 Midwest 339 Consumer Credit - Retail South 763 Northeast 362 Southeast 3,126 (*) It does not include branches and CSBs abroad and Itaú BBA. Total Points of Service 4,722 The revenues from the Consumer Credit segment arise from financial products and services offered to our non-account holder clients. In the third quarter of 2013, the segment recorded a recurring net income of R$428 million, an 11.9% decrease when compared to the second quarter. The negative impacts on the segment s net income are due to the 3.9% drop in the financial margin and to the 4.3% increase in losses from loans and retained claims net of recovery. The positive effect on the net income is due to the 6.9% increase in fees and to non-interest expenses, which remained practically unchanged when compared to the previous quarter. The return on allocated capital was 19.1% a year, and the riskadjusted efficiency ratio reached 81.1% in the third quarter of the year. Credit Portfolio- Consumer Credit Branches On September 30, 2013, the balance of the loan portfolio totaled R$81,685 million, a decrease of R$478 million when compared to June 30, The coverage ratio for NPL over 90 days reached 114% at the end of the third quarter, 700 basis points higher than in the previous quarter and 900 basis points higher than in the same period of In the last two years, this ratio remained close to 100%. 46
45 Analysis of Segments If the additional allowance were taken into consideration, the coverage ratio would have reached 128% in September 2013, 100 basis points higher than in June Allowance for Loan Losses and Coverage Ratio 105% 6,643 90% 5, % 105% 118% 110% 107% 114% 6,672 6,677 6,751 6,610 6,432 6,577 Dec/11 Mar/12 Jun/12 Sep/12 Dec/12 Mar/13 Jun/13 Sep/13 Allowance for Loan and Lease Losses (without complementary portion) Coverage - NPL overdue 90 days Wholesale Banking The revenues from the Wholesale Banking segment arise from products and services offered to middle market companies and activities of Itaú BBA, the unit responsible for commercial operations with large companies, and for investment banking services. The financial margin of the third quarter totaled R$2,837 million, an increase of 6.5% in relation to the second quarter of Banking service fees and income from banking charges amounted to R$873 million, consistent with the previous quarter. The loan and insurance losses, net of recovery, totaled R$703 million in the third quarter of 2013, a significant decrease of 31.1% when compared to the second quarter. Accordingly, the net income from the Wholesale Banking reached R$1,008 million in the third quarter of 2013, an increase of 30.2% from the previous quarter. The Wholesale Banking segment s annualized return on allocated capital reached 17.9% and the risk-adjusted efficiency ratio was 58.1%. Loan Portfolio Wholesale Banking The loan portfolio reached R$169,285 million in September 2013, an increase of 2.6% in relation to June In the last two years, the coverage ratio for NPL over 90 days remained higher than 140% and at the end of the second quarter of 2013 reached 175%, an increase of 160 basis points from the same period of the previous year. If the additional allowance were taken into consideration, the coverage ratio would have reached 237% in September 2013, 180 basis points higher than in June Allowance for Loan Losses and Coverage Ratio 180% 142% 156% 159% 3,313 3,475 3,748 3, % 165% 167% 175% 4,375 4,276 4,323 4,315 Dec/11 Mar/12 Jun/12 Sep/12 Dec/12 Mar/13 Jun/13 Sep/13 Allowance for Loan and Lease Losses (without complementary portion) Coverage - NPL overdue 90 days Middle Market Companies As from 2013, the middle market companies subsegment is part of the Itaú Unibanco s Wholesale Banking segment. This structure aims at offering more specialized services, with more agility and better product offering in order to enable a closer relationship with our clients and to increase our operations in the segment. Large Companies Our clients are the approximately 3,000 largest corporate groups in Brazil, Argentina, Chile, Colombia and Peru. We also serve over 200 financial institutions and 700 institutional investors. We offer them a wide portfolio of banking products and services, from cash management to structured operations and transactions in the Capital Markets. The loan portfolio with endorsements and sureties increased 4.2% from the second quarter of 2013, and 16.9% when compared to the same period of the previous year, reaching R$178.2 billion, and the highlights are foreign currency operations and earmarked loans. We continue to distinguish ourselves for the excellent level of quality of the credit portfolio, in which 94.6% of the credits are attributed AA, A and B ratings in accordance with the criteria set forth in Resolution No. 2,682 of the National Monetary Council. We highlight Itaú BBA s derivative operations, as we have maintained our leading position in CETIP (Clearing House for the Custody and Financial Settlement of Securities). We focused on operations that hedge our clients exposures to foreign currencies, interest rates and commodities. The volume of operations contracted between January and September 2013 was 33.9% higher than in the same period of the previous year. Investment Banking In the Investment Banking area, we highlight: Fixed Income: In the period from January to September 2013, we took part in operations with debentures, promissory notes and securitization, which totaled R$10.7 billion. In the Brazilian Financial and Capital Markets Association (ANBIMA) ranking of fixed-income distribution, we ranked first with a 23.4% market share. In international fixed-income issues, we acted as joint bookrunners of offers totaling US$18.8 billion and ranked second in issuances of Brazilian Companies in September 2013 according to BondRadar. Mergers and Acquisitions We provided financial advisory services for 26 transactions until September 2013, reaching the leading position in the Dealogic ranking in number of operations, with a total of US$9.6 billion. Equity Offerings: We ranked first according to the Brazilian Financial and Capital Markets Association (ANBIMA) ranking of September 2013, with volume of operations of R$3.2 billion. Awards Institutional Investor Rankings 2013: Itaú IBBA s team ranked first in Latin America in the renowned ranking of Institutional Investors Euromoney Magazine: Itaú BBA was awarded for the sixth consecutive year as the Best Cash Management Bank in Brazil by Euromoney magazine, one of the most important publications concerning the financial market. 47
46 Products and Services The results of each product and service are classified in the segments according to the characteristics of the operations. Accordingly, some of the products and services listed below may be included in more than one segment. Payroll Loans A payroll loan is a loan with fixed installments that is directly deducted from the borrower s payroll to the bank s account without being recorded in the debtor s account. In the last quarter of 2012, Itaú Unibanco S.A. and Banco BMG S.A. incorporated Banco Itaú BMG Consignado S.A., a financial institution controlled by Itaú Unibanco that aims at the offering, distribution and sale of payroll loans in Brazil. This operation started in December 2012 and enables us to expand our business in this segment, under our values and transparency principles, following our good management practices and policies. This association aims at diversifying our loan portfolio, supplementing our payroll loan strategy, and improving the risk profile of our individuals loan portfolio. Evolution of the Payroll Loan Portfolio and NPL In the third quarter, the payroll loan portfolio of Itaú BMG Consignado reached R$5,610 million, an increase of 46% in relation to June At the end of September 2013, total payroll loans reached R$20,579 million, an increase of 64.0% (R$8,032 million) year on year. The highlight is the increase of 185% in the portfolio of loans to retirees and pensioners of the INSS in relation to September Evolution of the Payroll Loan Portfolio +64.0% This increase in payroll loans reflected in a higher share of payroll loans within personal loans, from 30.9% in September 2012 to 43.0% in the current period. Evolution of the Share of Payroll Loans in Personal Loans Sep/13 Jun/13 Sep/12 19,550 31% 21,203 31% 30.9% 43.0% 40.4% Payroll Loans Mortgage Loans 22,740 31% 24,030 31% 25,837 30% 69.1% 57.0% 59.6% Other Personal Loans The total mortgage portfolio kept the pace of expansion that characterized the real estate market in recent quarters and reached R$31,984 million at the end of September. In the last twelve months our portfolio grew 33.1% and compared to June 2013 the growth was 8.3%. The individuals portfolio totaled R$22,515 million at the end of the third quarter, an increase of 8.1% when compared to the previous quarter and 34.9% in relation to September At the end of September 2013, the companies portfolio totaled R$9,469 million, an 8.9% increase compared to June Evolution of the Mortgage Portfolio 27,295 30% +33.1% 29,530 29% 31,984 30% 10,107 11,054 11,677 12,547 13,551 16,261 9% 18,442 21% 20,579 27% 69% 70% 69% 69% 69% 70% 70% 71% Dec/11 Mar/12 Jun/12 Sep/12 Dec/12 Mar/13 Jun/13 Sep/13 Individuals Companies 100% 100% 100% 100% 100% 91% 79% 73% Dec/11 Mar/12 Jun/12 Sep/12 Dec/12 Mar/13 Jun/13 Sep/13 Our strategy of higher growth in the INSS Beneficiaries segment, combined with the credit policies adopted, allowed the portfolio evolution to be followed by a decrease in the delinquency levels. 90-day NPL ratio (Base 100) Total Payroll Loan Portfolio Itaú BMG Consignado Itaú Unibanco Itaú Unibanco Note: Information comparable to the information of the National Financial System disclosed by the Central Bank of Brazil. In the third quarter of 2013, the volume of new mortgage loan financing contracts for individuals was R$2,844 million, whereas financing to companies amounted to R$1,745 million, totaling R$4,589 million. Volume of Originations Variation 3Q13 2Q13 3Q12 3Q13-3Q13-2Q13 3Q12 Individuals 2,844 2,687 1, % 66.2% Companies 1,745 1,777 1, % 12.9% Total 4,589 4,464 3, % 40.9% 98% of our individuals real estate loan portfolio collaterals are under the legal framework of fiduciary lien (alienação fiduciária). Since 2007, we use this framework for 100% of our origination. In the last twelve months, 100% of the new financing contracts used the Equal Amortization System, through which decreasing installments leads to a faster contract amortization, causing a more positive effect on the loan-to-value ratio (ratio between the amount of the financing and the value of the real estate properties) when compared to other amortization systems. 48
47 Analysis of Segments The loan-to-value (LTV) of the portfolio reached 42% in September 2013, remaining stable in relation to the previous quarters. In the last twelve months, the LTV of the vintages originated remained steady at approximately 60%. In the second quarter of 2013 it was 1000 basis points lower than the ratio of the Brazilian Financial System, in accordance with the last Financial Stability Report issued by the Brazilian Central Bank. The loan-to-value of our vehicle portfolio reached 75.8% in September 2013, remaining steady since December Loan to-value Portfolio (%) 76% 76% 76% 76% Loan to-value Vintage and Portfolio 60% 61% 60% 41% 42% 42% Dec/12 Mar/13 Jun/13 Sep/13 Vehicle portfolio and new financing originations Sep/12 Jun/13 Sep/ Vintage (quarterly average) Month of grant Itaú Unibanco Portfolio The 90-day NPL measured six months after the financing origination remained below the average market rate since 2012 and it did not follow the recent increase in the rate observed by the Brazilian Financial System. NPL over 90 (%) 6 months after the financing origination Source: Central Bank of Brazil Financial Stability Report. Vehicle Financing Market On August 19, 2013, we renewed, through 2023, the commercial cooperation agreement with Fiat, leading player in the Brazilian vehicle market for over 10 years. This agreement provides for exclusivity in the offer of financing and the exclusive use of the Fiat brand in activities related to financing, as mentioned in page 6 of this report. In September 2013, we returned to the leadership position regarding financing origination for new vehicles. The pace of financing origination for vehicles acquisition in this segment continues to grow with approval rates that are appropriate to the credit quality we seek for our portfolio. The vehicle financing portfolio to individuals amounted to R$42,733 million at the end of the third quarter of New vehicle financing and leasing transactions totaled R$5,194 million, which represents a 22.9% increase from the previous quarter and of 3.5% in relation to the same period of the previous year. Consortia Consortia is a self-financing system for the programmed purchase in installments of real estate and vehicles, which supplements our retail product portfolio. Since it is construed as a provision of services, consortia management does not give rise to default risk or allocation of capital credit to the bank. In the third quarter of 2013, the balance of installments receivable reached R$9.1 billion, a 17.3% increase in relation to the previous quarter and of 41.6% from the same period of In the period, we reached 351 thousand active contracts, an increase of 10.6% and 32.6% in relation to the previous quarter and to the same period of 2012, respectively. 6,207 6, , ,411 6, , , , Average Term and Down Payments (Itaú Unibanco) 4Q11 1Q12 2Q12 3Q12 4Q12 1Q13 2Q13 3Q Active contracts (in millions) Balance of installments receivable S11 2S11 1Q12 2Q12 3Q12 4Q12 1Q13 2Q13 3Q13 % Average down payment Term (months) 49
48 Products and Services Cards Through proprietary and partnership operations, we offer a wide range of credit and debit cards to more than 58.0 million current account holders and non-holders (in number of accounts). In the third quarter of 2013, the volume of transactions amounted to R$62.7 billion, an increase of 11.4% from the same period of the previous year. Credit Cards We are the leading player in the Brazilian credit card market, through Itaucard, Hiper, joint ventures and commercial agreements with leading companies in sectors as telecom, vehicles, retail and aviation tickets at the Brazilian market, totaling 32,2 million client accounts, including both account holders and non-account holders. We continue to focus on business of larger scale, in line with the efficiency-gain strategy. We also kept the more conservative financing policy in order to maintain the credit quality of our card portfolio. In the third quarter of 2013, the volume of credit card transactions amounted to R$47,329 million, which corresponds to an increase of 9.0% from the same period of the previous year , , ,743 43,417 49,363 43,810 46,681 47,329 Credit Card Transactions In the third quarter of 2013, the volume of credit card transactions was R$52.6 billion, representing 65.3% of the total volume of transactions generated by the acquiring services, an increase of 16.6% from the same period of the previous year. In relation to the second quarter of 2013, service revenues from credit cards increased R$10.7 million, or 1.7%. When compared to the same quarter of 2012, these service revenues increased R$65.5 million, or 11.6% , ,754 43,575 45, , , , ,625 4Q11 1Q12 2Q12 3Q12 4Q12 1Q13 2Q13 3Q13 Credit Card Transaction Volume () Acquiring service revenues - Credit Cards () Note: The volume of transactions and the service revenues from credit cards include 100% of REDE. Debit Card Transactions In the third quarter of 2013, the volume of debit card transactions was R$28.0 billion, representing 34.7% of the total transaction volume, an increase of 6.6% from the previous quarter and 20.0% from the same period of In relation to the third quarter of 2012, service revenues from debit cards increased 19.6%, which represented R$32.9 million year-on-year and R$16.3 million, or 8.8%, in relation to the second quarter of Q11 1Q12 2Q12 3Q12 4Q12 1Q13 2Q13 3Q13 Credit Card Transaction Volume () Card Accounts - do not include additional cards (in millions) Debit Cards 23,544 20,854 20,916 23,337 29,060 26,545 26,257 27,994 In the debit card segment, which includes only current account holders, we have 25.8 million accounts The volume of debit card transactions amounted to R$15,416 million in the third quarter of 2013, a 19.4% increase from the same period of the previous year ,857 12,138 12,130 12,916 15, ,967 14,306 15,416 4Q11 1Q12 2Q12 3Q12 4Q12 1Q13 2Q13 3Q13 Debit Card Transaction Volume () Merchant Acquires Card Accounts - do not include additional cards (in millions) 4Q11 1Q12 2Q12 3Q12 4Q12 1Q13 2Q13 3Q13 Debit Card Transaction Volume () Acquiring service revenues - Debit Cards () Note: The volume of transactions and the service revenues from credit cards include 100% of REDE. Equipment Base (*) At the end of the third quarter of 2013, our installed and active equipment base reached 1,451 thousand units, posting a growth of 4.8% from the previous quarter and 8.9% when compared to the same period of As from the second quarter of 2013, our equipment base is composed only by REDE s POS as the process of unification with Hiper POS equipment was completed. Our Merchant business comprises the process of capturing of transactions through the affiliation, management and relationship with commercial establishments through the company REDE. 1,262 1,256 1,270 1,332 1,429 1,485 Thousands of units 1,384 1,451 This quarter, the transaction volume totaled R$80.6 billion, an increase of 5.6% from the second quarter of 2013 and 17.7% from the same period of the previous year. 4Q11 1Q12 2Q12 3Q12 4Q12 1Q13 2Q13 3Q13 (*) 100% of the equipment base of REDE is able to capture Hiper card transactions. 50
49 Products and Services Wealth Management & Services (WMS) Asset Management (*) In September, 2013, we reached R$376.3 billion* in assets under management, representing 15.5% of the market. In the year, the growth totaled 9.6% and the main highlights were multimarket and money market funds. In addition to this strong local presence, we are present abroad with strategically allocated professionals, searching for investment opportunities and solutions appropriate for global clients. * Source: ANBIMA (Brazilian Financial and Capital Markets Association) Management Ranking September,2013 It includes Itaú Unibanco and Intrag. Asset Administration relation to the same period of 2012, due to a decline in the stock market, which impacted the ADR programs amount. Corporate Solutions: we offer many capital markets solutions, such as the control of stock option programs, bookkeeping, debentures, settlement and custody of promissory notes and bank credit notes. We also work as guarantee agent in operations of Project Finance, Escrow Accounts, and loan and financing contracts. We are leaders in the bookkeeping of shares, providing services to 231 companies listed on the BM&F Bovespa, representing 63.5% of the total, and we are also the leaders in the bookkeeping of debentures, acting as bookkeeper of 356 issues in September Source: Internal Financial Planning, ANBIMA (Brazilian Financial and Capital Markets Association) and Bovespa - September,2013. We have Privatization, Fixed Income and Equity Funds, Investment Clubs and Client Portfolios under administration, both in Brazil and abroad. R$ billion Dec/11 Mar/12 Jun/12 Sep/12 Dec/12 Mar/13 Jun/13 Sep/13 Managed Portfolios Investment Funds At the end of the third quarter of 2013, assets under administration totaled R$622.4 billion, a 2.3% increase from the previous quarter and 19.8% when compared to the third quarter of According to ANBIMA, in September 2013 we ranked second in the global ranking of fund administration and administered portfolios,* with a market share of 20.2%. * It includes Itaú Unibanco and Intrag Securities Services With four lines of business, the area of Securities Services serves both publicly and closely-held companies, pension funds, asset management and international investors, totaling 1,974 clients in 21 countries. We ended September 2013 with a custody market share of 23.8% and a total of R$930.6 billion in assets under custody, representing an increase of 2% from the same period of Our business lines are: Local Custody and Fiduciary Administration: we offer custody and accounting services for portfolios, investment, mutual and pension funds, services of fund administration, legal representation, rebalancing fund services and contracting of service providers. At the end of September, we had a total of R$759.3 billion under custody, representing a growth of 10% from the same period of International Custody: we offer services of custody and representation for non-resident inverstors, custody of ADR programs and also depositary services for Brazilian Depositary Receipts (BDR) programs. We ended September with R$171.3 billion of assets under custody, representing a 23% decrease in 51
50 52
51 banking & insurance operations 3 rd quarter of 2013
52 Banking & Insurance Operations We present below the financial statements and relevant financial indicators on the performance of our banking and insurance operations, which include the insurance, pension plan and capitalization operations, based on management information generated by internal models for the purpose of more accurately reflecting the performance of these operations. Managerially, we considered the proportional consolidation of our 30% interest in Porto Seguro. Beginning in 2013, we implemented some changes in the consolidation criteria for the result from insurance, pension plans and capitalization presented in this report. The purpose is to align the consolidation criteria applied to the results presented in this report to the other businesses of the bank, to better reflect how management monitors the figures of the segment. We reclassified the historical consolidation of the results of the segment so as to permit a better understanding in the analysis. Highlights We present below the main indicators of our banking and insurance operations. In this analysis, we disregarded the result of excess capital to our operations, calculated as the difference between our total capital and capital of these two businesses. The capital of our banking operations comes from our Risk Weighted Assets (RWA), considering a capital ratio of 13.75% (11% Basel with a 25% safety margin), and the managerial allocation to our insurance capital operations. (except where indicated) 3Q13 2Q13 3Q12 Statement of Income Recurring Net Income 4,022 3,622 3,412 Banking Operations 3,273 2,916 2,845 Excess Capital Insurance Operations Insurance Pension Plan Capitalization Revenues (*) 20,413 19,968 19,904 Operating Revenues _ Banking Operations (1) 17,127 16,737 16,938 Insurance Revenues (2) 3,056 3,030 2,763 Performance Ratios (%) Recurring Return on Average Equity Annualized (3) 20.9% 19.3% 18.5% Banking Operations 22.0% 20.4% 18.9% Insurance Operations 36.5% 35.3% 26.6% Efficiency Ratio (ER) (4) 48.2% 49.1% 45.0% Banking Operations 51.3% 52.2% 46.8% Insurance Operations 32.3% 33.4% 36.0% Risk Adjusted Efficiency Ratio (RAER) (5) 68.4% 72.1% 75.3% Banking Operations 71.3% 75.4% 77.7% Insurance Operations 64.2% 65.4% 71.8% Combined Ratio - Insurance Operations (6) 72.0% 73.8% 83.8% Balance of the Allowance for Loan Losses/ Credit Portfolio - Banking Operations 6.6% 7.0% 7.7% Claims Ratio - Insurance Operations (7) 32.5% 33.2% 37.8% Balance Sheet Sep 30,13 Jun 30,13 Sep 30,12 Total Assets (8) 1,082,787 1,057, ,216 Banking Operations (8) 965, , ,852 Excess Capital (8) 11,058 10,583 12,540 Insurance Operations (8) 106, ,807 94,824 Credit Portfolio 387, , ,810 Technical Provisions (8) 98,758 97,447 87,281 Insurance (8) 9,742 9,293 8,541 Pension Plan (8) 86,022 85,229 75,839 Capitalization (8) 2,993 2,925 2,900 Relevant Data Contributors to Traditional and PGBL Pension Plan (thousand) 1,503 1,469 1,303 Contributors to VGBL Pension Plan (thousand) 1,782 1,751 1,483 Certificates - Capitalization (thousand) 13,656 13,553 11,790 (*) The Consolidated does not represent the sum of banking and insurance operations, because there is a result of excess capital. 1) Operating Revenues are the sum of the Managerial Financial Margin, Banking Service Fees and Income from Banking Charges and Result from Insurance, Pension and Capitalization Operations before Retained Claims and Selling Expenses; (2) Insurance Revenues comprise the Managerial Financial Margin, Banking Service Fees and Income from Banking Charges, Earned Premiums, Pension Contributions and Capitalization Revenues; (3) Annualized Return was calculated by dividing Net Income by the Average Stockholders Equity. The quotient was multiplied by the number of periods in the year to derive the annualized rate. The calculation bases of the return were adjusted by the amount of dividends proposed after the balance sheet dates, which have not yet been approved in annual stockholders' meetings or by the Board of Directors. Does not consider the proportional consolidation of our 30% interest in Porto Seguro (4) The Efficiency Ratio was calculated by dividing Non-Interest Expenses (+) Selling Expenses from Insurance Operations by Operating Revenues (-) ISS, PIS, Cofins and Other Tax Expenses. Does not consider the proportional consolidation of our 30% interest in Porto Seguro; (5) The Risk-Adjusted Efficiency Ratio was calculated by dividing Non-Interest Expenses (+) Selling Expenses from Insurance Operations (+) Result from Loan Losses (+) Expenses with Claims by Operating Revenues (-) ISS, PIS Cofins and Other Tax Expenses. Does not consider the proportional consolidation of our 30% interest in Porto Seguro. (6) The calculation of the Combined Ratio from Insurance Operations is the sum of the following ratios: Retained Claims/ Earned Premiums, Selling Expenses/ Earned Premiums, Administrative Expenses (+) Other Operating Income and Expenses /Earned Premiums. The ratio does not take into consideration the health insurance operation and the proportional consolidation of our 30% interest in Porto Seguro; (7) The Claims Ratio was calculated by dividing Retained Claims by Earned Premiums. The ratio does not consider the proportional consolidation of our 30% interest in Porto Seguro. (8) Does not consider the proportional consolidation of our 30% interest in Porto Seguro. 54
53 Banking & Insurance Operations The Pro Forma financial statements below were prepared based on internal information from our management model for the purpose of presenting the performance of our banking and insurance operations (1). Sales Cost Model The practice in Itaú Unibanco is to assign the sales costs related to all of our products and services to the corresponding channel where it is effectively used (full allocation method). Accordingly, the selling costs related to insurance, pension plan and Statement of Income Operating Revenues Perspective Note: The Consolidated does not represent the sum of the parts, because there is a result of excess capital. The annualized Recurring Return on Average Equity of the excess capital reached 5.0% in the third quarter of 2013 The capital of our banking operations comes from our Risk Weighted Assets (RWA), considering a capital ratio of 13.75% (11% Basel with a 25% safety margin), and the managerial allocation to our insurance capital operations. (1) The Insurance Operations, in this section, include insurance, pension plan and capitalization operations. (2) Under the managerial reporting standards, both the fees and the financial margins are allocated to result from insurance, pension plans and capitalization. Evolution of Net Income and Segments Share in Net Income of Itaú Unibanco Banking Operations Consolidated The recurring net income from banking operations (banking products and services) reached R$3,273 million in the third quarter of 2013, an increase of 12.3% from the previous quarter, mainly due to the increase in operating revenues arising from the increase in the managerial financial margin, mainly with clients, and in banking service fees, and from the decrease in the result from loan losses. The share of the banking operations in total net income, without excess capital, reached 84.1% in the quarter, an increase of 100 basis points from the second quarter of capitalization products in our branch network and other electronic or physical distribution channels are recorded in our statement of income of the insurance segment. This practice has both accounting and managerial effects. Banking Operations Insurance Operations Insurance Operations Consolidated Banking Operations Insurance Operations Operating Revenues 20,413 17,127 3,056 19,968 16,737 3,030 Managerial Financial Margin (2) 11,766 11,537-11,540 11,338 - Banking Service Fees and Income from Banking Charges (2) 5,591 5,591-5,399 5,399 - Result from Insurance, Pension Plan and Capitalization (2) 3,111-3,111 3,080-3,081 Other Components of Operating Revenues (55) - (55) (51) - (51) Loan and Retained Claim Losses Net of Recovery (4,178) (3,240) (938) (4,582) (3,650) (933) Result from Loan and Lease Losses (3,240) (3,240) - (3,650) (3,650) - Retained Claims (938) - (938) (933) - (933) Operating Margin 16,235 13,888 2,118 15,385 13,088 2,098 Other Operating Expenses (10,318) (9,246) (1,062) (10,302) (9,208) (1,085) Non-interest Expenses (8,855) (8,308) (547) (8,784) (8,210) (575) Selling Expenses From Insurance (406) - (406) (401) - (401) Other Results (1,056) (937) (109) (1,117) (998) (109) Income before Tax and Profit Sharing 5,917 4,642 1,056 5,083 3,879 1,012 Income Tax and Social Contribution and Profit Sharing (1,895) (1,369) (439) (1,462) (964) (421) Recurring Net Income 4,022 3, ,622 2, Recurring Return on Average Equity Annualized 20.9% 22.0% 36.5% 19.3% 20.4% 35.3% Efficiency Ratio (ER) 47.8% 51.3% 32.3% 48.7% 52.2% 33.4% Risk Adjusted Efficiency Ratio (RAER) 69.4% 71.3% 64.2% 73.0% 75.4% 65.4% 3Q13 2Q13 Recurring net income from insurance operations (1) reached R$618 million in the third quarter of 2013, an increase of 4.5% from the previous quarter, mainly due to the increase in earned premiums and the decrease in non-interest expenses. The insurance ratio (2), which represents the share of recurring net income from Insurance, Pension Plan and Capitalization operations in relation to Itaú Unibanco s recurring net income, without excess capital, reached 15.9%, a decrease of 100 basis points from the previous quarter. The ratio of operating revenues from insurance operations to total operating revenues reached 15.0%, a decrease of 20 basis points in relation to the previous quarter ,998 2,845 2,820 2,869 2,916 3, Q12 3Q12 4Q12 1Q13 2Q13 3Q13 Recurring Net Income from Banking Operations Share of the Banking Operations (%) 2Q12 3Q12 4Q12 1Q13 2Q13 3Q13 Recurring Net Income from Insurance Operations Operating Revenues from insurance operations / Total Operating Revenues (%) Insurance Ratio (%) (1) Net income from Insurance Operations, in this section, includes net income from the insurance, pension plan and capitalization operations. (2) Insurance Ratio (%) = Insurance, Life and Pension Plan and Capitalization segment s recurring net income/ Itaú Unibanco s recurring net income, without excess capital. 55
54 Banking & Insurance Operations Evolution of Efficiency Ratio, Risk-Adjusted Efficiency Ratio and Annualized Return on Average Equity The efficiency ratio of the banking operations reached 51.3% in the third quarter of 2013, an improvement of 90 basis points from the previous quarter. This decrease was due to the increase in operating revenues (2.3% from the previous quarter), arising from the increase in the managerial financial margin and banking service fees. The risk-adjusted efficiency ratio reached 71.3% in the period, a decrease of 410 basis points from the previous quarter. This improvement is due to our strategy to increase our share in lowrisk markets, which resulted in the decrease in the expenses for allowance for loan losses, net of recovery. The annualized recurring return of banking operations reached 22.0% in the period, an increase of 160 basis points from the previous quarter. % The efficiency ratio of the insurance operations reached 32.3% in the third quarter of 2013, a decrease of 110 basis points from the previous quarter. This improvement is due to the increase in earned premiums and in the managerial financial margin and to the decrease in non-interest expenses. The risk-adjusted efficiency ratio in the third quarter of 2013 reached 64.2% in the period, a reduction of 120 basis points from the previous quarter. The loss ratio reached 32.5%, a decrease of 70 basis points from the previous quarter. The annualized recurring return of the insurance operations reached 36.5% in the period, an increase of 120 basis points from the previous quarter. % Q12 3Q12 4Q12 1Q13 2Q13 3Q13 Balance Sheet Assets Efficiency Ratio (ER) Risk Adjusted Efficiency Ratio (RAER) Recurring Return on Average Equity Annualized (Banking Operations) Consolidated (1) 2Q12 3Q12 4Q12 1Q13 2Q13 3Q13 Efficiency Ratio (ER) Risk Adjusted Efficiency Ratio (RAER) (%) Recurring Return on Average Equity Annualized (Insurance Operations) Claims Ratio (%) Note: The claims ratio does not include the Itauseg Saúde company and the proportional consolidation of our 30% interest in Porto Seguro. Sep 30,13 Jun 30,13 Banking Insurance Consolidated (1) Banking Operations Operations Operations Insurance Operations Current and Long-term Assets 1,074, , ,219 1,049, , ,518 Securities and Derivative Financial Instruments 274, , , , , ,351 Loan, Lease and Other Loan Operations 387, , , ,213 - (Allowance for Loan Losses) (25,653) (25,653) - (26,399) (26,399) - Other Assets 438, ,357 8, , ,597 8,167 Permanent Assets 13,205 14,565-12,431 13,734 - Total Assets 1,087, , ,219 1,062, , ,518 Liabilities and Equity Current and Long Term Liabilities 1,007, , , , , ,846 Deposits Received under Securities Repurchase Agreement 295, , , ,269 - Borrowings and Onlendings 73,301 73,301-69,139 69,139 - Technical Provisions for Ins., Pension Plans and Cap. 101, ,311 99,939-99,939 Other Liabilities (2) 537, ,227 4, , ,041 3,907 Minority Interest in Subsidiaries 1,842 1,842-1,796 1,796 - Stockholders' Equity 78,475 61,922 6,855 75,998 60,046 6,673 Total Liabilities and Equity 1,087, , ,219 1,062, , ,518 (1) The Consolidated does not represent the sum of banking and insurance operations, because the excess capital is allocated only in the consolidated. (2) This includes Deferred Income. On September 30, 2013, total assets from banking operations, which includes securities, derivative financial instruments and loan, lease and other loan operations, reached R$965,428 million, an increase of 2.5% from the previous quarter. Stockholders equity from banking operations reached R$61,922 million in the period, an increase of R$1,876 million, despite the impacts of the marking to market of available-for-sale securities and repurchase of shares by the treasury. Liabilities increased 2.5% in the period mainly due to the growth in savings deposits, deposits received under securities repurchase agreements and borrowings and onlendings. Total assets from insurance operations reached R$112,219 million on September 30, 2013, a growth of 1.5% from the previous quarter, mainly due to the increase of 1.4% in investments related to pension plan technical provisions, totaling R$101,311 million in the period. 56
55 Insurance, Pension Plan & Capitalization The Pro Forma financial statements below were prepared based on Itaú Unibanco s managerial information and are intended to explain the performance of the insurance-related businesses. The figures presented in this section include our 30% interest in Porto Seguro. Pro Forma Statement of Recurring Income of the Insurance, Pension Plan and Capitalization Segment 3Q13 2Q13 Note: Non-interest Expenses comprise Personnel Expenses, Other Administrative Expenses, Tax Expenses, and Other Operating Expenses. Variation 3Q13-2Q13 Earned Premiums 2,237 2, % Result of Pension Plans and Capitalization (50) -24.9% Retained Claims (938) (933) (6) 0.6% Selling Expenses (406) (401) (5) 1.4% Other Operating Income/(Expenses) of Insurance Operations (27) (29) 3-9.0% Underwriting Margin % Result from Insurance, Pension Plans and Capitalization 1,017 1,036 (19) -1.8% Managerial Financial Margin % Service Fees % Non-interest Expenses (547) (575) % Tax Expenses for ISS, PIS and Cofins and other taxes (109) (109) 1-0.6% Other Operating Income/(Expenses) (28) (22) (7) - Income Before Income Tax and Social Contribution 1,056 1, % Income Tax/Social Contribution and Profit Sharing (439) (421) (18) 4.2% Recurring Net Income % Recurring Return on Allocated Capital 36.5% 35.3% 120 bps Efficiency Ratio (ER) 32.3% 33.4% bps Recurring Net Income Composition of Recurring Net Income of Insurance, Pension Plan and Capitalization Q13 2Q % 33.1% 9.3% 36.9% % 53.8% 2Q12 3Q12 4Q12 1Q13 2Q13 3Q13 Insurance Pension Plan Capitalization In the third quarter of 2013, recurring net income of Insurance, Pension Plan and Capitalization totaled R$618 million, a growth of 4.5% from the previous quarter. The return on allocated capital reached 36.5% in the period, an increase of 120 basis points from the previous quarter. When compared to the previous quarter, the main components which influenced the net income were the increases in earned premiums and in the managerial financial margin, in addition to the decrease in non-interest expenses. The increase in banking service fees also contributed to the increase in net income. Insurance Pension Plan Capitalization In the third quarter of 2013, in the composition of recurring net income, the Insurance subsegment increased 410 basis points in relation to the previous quarter, representing 57.9% of net income. 57
56 Insurance, Pension Plan & Capitalization Efficiency Ratio In the third quarter, the efficiency ratio, in the full concept (that includes all expenses), reached 32.3%, corresponding to an improvement of 110 basis points from the previous period, mainly influenced by the increases in earned premiums and in managerial financial margin and by the decrease in non-interest expenses. The risk-adjusted efficiency ratio, which adds to the formula the impacts of risk portions associated with Insurance operations, was 64.2% in the third quarter, an improvement of 120 basis points from the second quarter of % Insurance, Pension Plan and Capitalization s Results (*) E.R. R.A.E.R. 3Q % Income before Tax and Profit Sharing 2Q12 3Q12 4Q12 1Q13 2Q13 3Q13 Income before Tax and Profit Sharing Retained Claims/ Income Efficiency Ratio (*) Net of Tax expenses for ISS, PIS and Cofins and Other Pro Forma Insurance, Pension Plan and Capitalization Balance Sheet The Balance Sheet of the Insurance, Pension Plan and Capitalization operations is presented below. On September 30, 2013, total assets amounted to R$112.2 billion, an increase of R$1,701 million from the end of the second quarter of Technical provisions totaled R$101.3 billion, a 1.4% increase from the previous quarter, mainly due to the increase in the technical provisions of the VGBL product. Sep 30,13 Jun 30,13 Variation Sep 30,13 - Jun 30,13 Insurance Pension Plan Capitalization Total Insurance Pension Plan Capitalization Total Total Assets Current and Long-Term Assets Securities 8,247 92,007 3, ,528 8,077 91,143 3, ,351 1, % Other Assets (mainly receivables from insurance) 8, ,692 8, , % Total Assets 16,939 92,007 3, ,219 16,245 91,143 3, ,518 1, % Liabilities and Equity Current and Long Term Liabilities 14,469 87,818 3, ,364 13,856 87,003 2, ,846 1, % Technical Provisions Insurance 11, ,804 11, , % Technical Provisions Pension Plans and VGBL ,022-86, ,229-85, % Technical Provisions Capitalization 14-2,993 3, ,925 2, % Other Liabilities 2,174 1, ,053 2,071 1, , % Allocated Tier I Capital 2,470 4, ,855 2,389 4, , % Total Liabilities and Equity 16,939 92,007 3, ,219 16,245 91,143 3, ,518 1, % 58
57 Insurance The figures presented in this section are part of Itaú Unibanco insurance operations and proportionally include the results of the association with Porto Seguro. Pro Forma Recurring Income Statement of Insurance Segment 3Q13 2Q13 Variation 3Q13-2Q13 Earned Premiums 2,237 2, % Retained Claims (933) (924) (8) 0.9% Selling Expenses (406) (400) (5) 1.4% Other Operating Income/(Expenses) of Insurance Operations (27) (29) 3-9.0% Underwriting Margin % Managerial Financial Margin % Service Fees % Non-interest Expenses (406) (423) % Tax Expenses for ISS, PIS and Cofins and other taxes (83) (84) 0-0.5% Other Operating Income/(Expenses) (28) (22) (7) - Income Before Income Tax and Social Contribution % Income Tax/Social Contribution and Profit Sharing (266) (239) (27) 11.2% Recurring Net Income % Recurring Return on Allocated Capital 58.9% 53.2% 570bps Efficiency Ratio (ER) 34.3% 35.7% - 140bps After a comprehensive work to simplify the portfolio and processes so that products offered to clients are more clear and appropriate to their needs, we continued to focus on effectively and efficiently using our own distribution channels. We conducted quantitative and qualitative surveys this quarter in order to better understand our clients and improve the sales process. We intensified the offering of products through channels, such as ATMs and managers. The highlights in the quarter were the individual life and personal injury products, with record sales in the month of the campaign in the branch network. The sale of the protection insurance also increased significantly both upon the opening of current accounts and at the tellers. In the year to August, 2013, our market share reached 12.6%, according to the information disclosed by the Superintendency of Private Insurance SUSEP (which regulates all insurance lines, except for Health Insurance, which is regulated by the National Health Agency ANS). Taking into consideration our 30% interest in Porto Seguro, earned premiums totaled R$5,601 million. In the third quarter of 2013, the recurring net income of Insurance operations reached R$358 million, a 12.5% increase from the previous quarter, influenced by the increase in earned premiums and in the managerial financial margin and by the decrease in non-interest expenses. Evolution of Net Income Evolution of the Composition of Earned Premiums 6.2% 6.1% 3.2% 10.5% 3.0% 4.6% 10.8% 11.6% 11.3% 25.1% 24.7% 2.5% 2.6% 23.8% 2.5% 10.1% 22.4% 2.4% 55.4% 55.1% 59.2% 54.7% 60.5% 10.8% 10.8% 23.2% 22.8% 2.5% 2.4% 59.4% 2Q12 3Q12 4Q12 1Q13 2Q13 3Q13 Life and Personal Accidents Property risk Extended Warranty General Risks DPVAT and Other Note: The chart does not include the Itauseg Saúde company and the proportional consolidation of our 30% interest in Porto Seguro. In the third quarter of 2013, earned premiums reached R$1,452 million, not including our 30% interest in Porto Seguro, an increase of 2.2% when compared to the previous quarter. Taking into consideration our 30% interest in Porto Seguro, earned premiums totaled R$2,237, an increase of 1.8% in relation to the second quarter of The consolidated underwriting margin amounted to R$685 million in the third quarter of 2013, not including our 30% interest in Porto Seguro, an increase of 2.8% when compared to the previous quarter. If the health insurance line (in process of discontinuation) were disregarded, the underwriting margin would have totaled R$705 million. In this quarter, the ratio of underwriting margin, divided by earned premiums, not including our 30% interest in Porto Seguro and the health insurance line, reached 47.2%, an increase of 30 basis points from the previous period. % 2Q12 3Q12 4Q12 1Q13 2Q13 3Q13 59
58 Insurance Evolution of the Composition of Retained Claims % in the period, a 180 basis point decrease from the previous quarter, mainly influenced by the increase in earned premiums 11.2% 11.5% 11.4% 10.9% 12.6% 11.4% 20.7% 23.0% 18.8% 15.9% 17.3% 17.6% Extended Combined Ratio % 22.5% 20.2% 32.5% 32.9% 0.7% 2.8% 2.5% 1.1% 44.8% 42.5% 35.7% 38.3% 16.5% 22.2% 2.8% 2.5% 50.8% 46.2% 72.7% 78.5% 67.4% 71.7% 68.8% 66.2% 2Q12 3Q12 4Q12 1Q13 2Q13 3Q13 Life and Personal Accidents Property risk DPVAT and Other General Risks Extended Warranty Note: The chart does not include the Itauseg Saúde company and the proportional consolidation of our 30% interest in Porto Seguro. In the third quarter of 2013, retained claims totaled R$509 million, not including our 30% interest in Porto Seguro, and increased 0.7% in relation to the previous quarter. Composition of Earned Premiums - Life 3Q13 2Q Q12 3Q12 4Q12 1Q13 2Q13 3Q13 Note: The extended combined ratio is the sum of retained claims (+) selling expenses (+) administrative expenses (+) other operating income and expenses divided by earned premiums (+) managerial financial margin (+) service fees. Note: The chart does not include the Itauseg Saúde company and the proportional consolidation of our 30% interest in Porto Seguro. The extended combined ratio, which reflects the efficiency of the operating expenses in relation to income from earned premiums, the managerial financial margin and banking service fees, reached 66.2%, in the third quarter of 2013, a decrease of 260 basis points from the previous quarter, mainly influenced by the increase in banking service fees and by the same factors that impacted the combined ratio. 3Q Credit Insurance 603 Life and Personal Accidents Insurance Technical Provisions On September 30, 2013, insurance technical provisions totaled R$9,742 million, an increase of 4.8% from the previous quarter and 14.1% from the same period of the previous year. Note: The chart does not include the proportional consolidation of our 30% interest in Porto Seguro. Combined Ratio 79.0% 19.2% 83.8% 20.9% 73.1% 20.7% 78.0% 17.7% 73.8% 72.0% 17.8% 18.0% % 8,284 8,541 9,120 9,211 9,293 9, % 25.1% 20.2% 23.2% 22.8% 21.4% 37.7% 37.8% 32.2% 37.1% 33.2% 32.5% 2Q12 3Q12 4Q12 1Q13 2Q13 3Q13 Selling Expenses/Earned Premiums Administrative Expenses and Others/Earned Premiums Insurance Claims/Earned Premiums jun/12 sep/12 dec/12 mar/13 jun/13 sep/13 Note: The chart does not include the proportional consolidation of our 30% interest in Porto Seguro. Note: The combined ratio is the sum of the following ratios: retained claims/ earned premiums, selling expenses/earned premiums and administrative expenses and other operating income and expenses /earned premiums. Note: The chart does not include the Itauseg Saúde company and the proportional consolidation of our 30% interest in Porto Seguro. The combined ratio, which reflects the efficiency of the operating expenses in relation to income from earned premiums, was 72.0% 60
59 Pension Plan Pro Forma Recurring Income Statement of Pension Plan Segment Variation 3Q13 2Q13 3Q13-2Q13 Result of Pension Plans (36) -49.6% Retained Claims (6) (8) % Selling Expenses (1) (1) 0-5.4% Underwriting Margin (7) (9) % Result from Pension Plans (33) -52.8% Managerial Financial Margin (1) -0.5% Service Fees % Non-interest Expenses (83) (88) 5-5.8% Tax Expenses for ISS, PIS and Cofins and other taxes (19) (19) (0) 1.1% Income Before Income Tax and Social Contribution (24) -6.5% Income Tax/Social Contribution and Profit Sharing (135) (145) % Recurring Net Income (14) -6.3% Recurring Return on Allocated Capital 19.6% 20.9% -130 bps Efficiency Ratio (ER) 19.5% 19.3% 20 bps Product innovation has played a significant role in the sustainable growth of our pension plan operations. For individuals, the highlights were the multi-market and multistrategy products, which allow for the investment of funds in the long-term, seeking the best short-term investment strategies. For companies, we offer specialized advisory services and develop customized solutions for each company. We establish long-term partnerships with our corporate customers, keeping a close relationship with the human resources departments and adopting a communication strategy designed for the financial education of their employees. The beginning of the third quarter was characterized by the peak of the increase in future interest rates, affecting all fixed income funds in the pension market. As from July, volatility dropped and the volume of contributions has been gradually returning to its normal levels. In August, in accordance with the National Federation of Pension and Life Insurance (FENAPREVI), our market share in plans for individuals reached 24.8%, an increase of 80 basis points when compared to the same period of the previous year. The recurring net income of the Pension subsegment amounted to R$204 million, a R$14 million decrease in relation to the previous quarter. Total contributions to pension plan in the quarter reached R$2,924 million, a decrease of 36.3% when compared to the second quarter of Net contributions, which comprise total contributions less redemptions and external portabilities, were negative by R$54 million in the third quarter. In the first nine months of 2013, net contributions totaled R$4,449 million. Taking into consideration net contributions from January to August (according to data provided by SUSEP), our market share reached 22.4% in the period. Composition of Total Contributions 4,874 4, ,393 4,368 5, ,311 5, ,914 4, ,167 2,924 2,564 2Q12 3Q12 4Q12 1Q13 2Q13 3Q Evolution of Contributions and Net Contributions Companies Individuals 3,278 3,052 4,874 4, ,052 5, ,222 5, ,282 4, (54) 2,924 In the third quarter of 2013, total contributions to pension plans for individuals decreased 38.5% when compared to the previous quarter. Total contributions to pension plan for companies totaled R$360 million, a reduction of 14.3% in the period. 4,201 4,194 5,039 4,768 3, ,380 2Q12 3Q12 4Q12 1Q13 2Q13 3Q13 Traditional and Other PGBL VGBL Net Contributions 61
60 Pension Plan & Capitalization Pension Plan Technical Provisions and Administration Fees On September 30, 2013, pension plan technical provisions totaled R$86,022 million, representing an increase of 0.9% and 13.4% when compared to June 30, 2013 and the same period of the previous year, respectively. Revenues from administration fees totaled R$283 million in the third quarter of 2013, a 1.3% increase from the second quarter. Evolution of Redemption Rate The redemption rate, which represents the ratio between redemptions and the balance of the pension plan technical provisions, reached 4.0%, an increase of 10 basis points and 130 basis points from the second quarter of 2013 and in relation to the same period of the previous year, respectively. % ,397 5,481 16, ,839 5,841 17, ,483 85,229 86,022 81,198 5,950 5,682 5,910 5,742 18,173 18,227 18,580 18, ,087 52,673 57,425 60,360 61,320 61,533 2Q12 3Q12 4Q12 1Q13 2Q13 3Q13 VGBL PGBL Traditional and Other Revenues from Service Fees 2Q12 3Q12 4Q12 1Q13 2Q13 3Q13 Redemption Rate (redemptions /pension plan technical provisions balance) Note: The charts do not include the proportional consolidation of our 30% interest in Porto Seguro. Note: The charts do not include the proportional consolidation of our 30% interest in Porto Seguro. Capitalization Pro Forma Capitalization Recurring Income Statement 3Q13 2Q13 Variation 3Q13-2Q13 Result of Capitalization (15) -11.3% Managerial Financial Margin % Non-interest Expenses (58) (64) 6-9.4% Tax Expenses for ISS, PIS and Cofins and other taxes (6) (7) 1-7.5% Income Before Income Tax and Social Contribution % Income Tax/Social Contribution and Profit Sharing (37) (36) (0) 1.4% Recurring Net Income % Recurring Return on Allocated Capital 131.2% 152.9% - 2,170 bps Efficiency Ratio (ER) 38.4% 41.0% bps At the end of the third quarter of 2013, the capitalization business had more than 13.7 million certificates outstanding. In the period between January and September 2013, 1,117 clients received prizes in the aggregate amount of R$12.5 million. The Capitalization subsegment s recurring net income reached R$56 million, a 1.3% increase from the previous quarter, mainly impacted by the increase in the managerial financial margin and the decrease in non-interest expenses. Capitalization Technical Provisions On September 30, 2013, capitalization technical provisions reached R$2,993 million, representing an increase of 2.3% from the second quarter of 2013 and an increase of 3.2% when compared to the same period of the previous year ,872 2,900 2,892 2,930 2,925 2,993 jun/12 sep/12 dec/12 mar/13 jun/13 sep/13 Capitalization Technical Provisions Number of Certificates (in million) 62

61 activities abroad 3 rd quarter of 2013
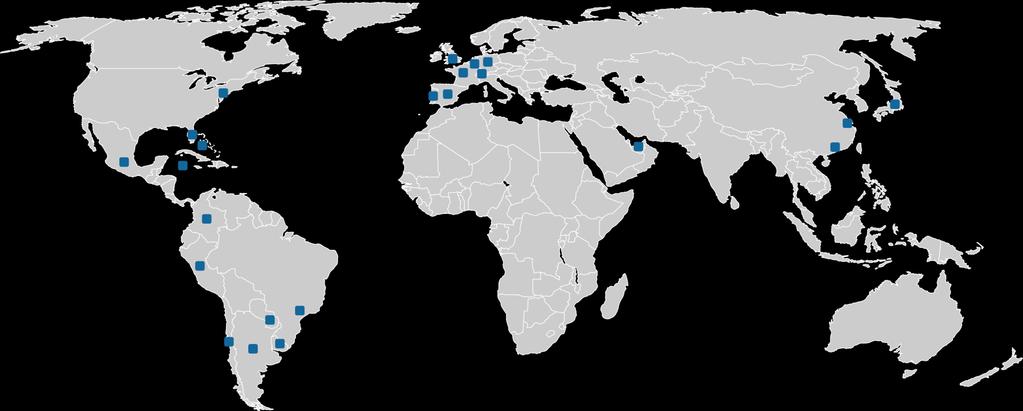


62

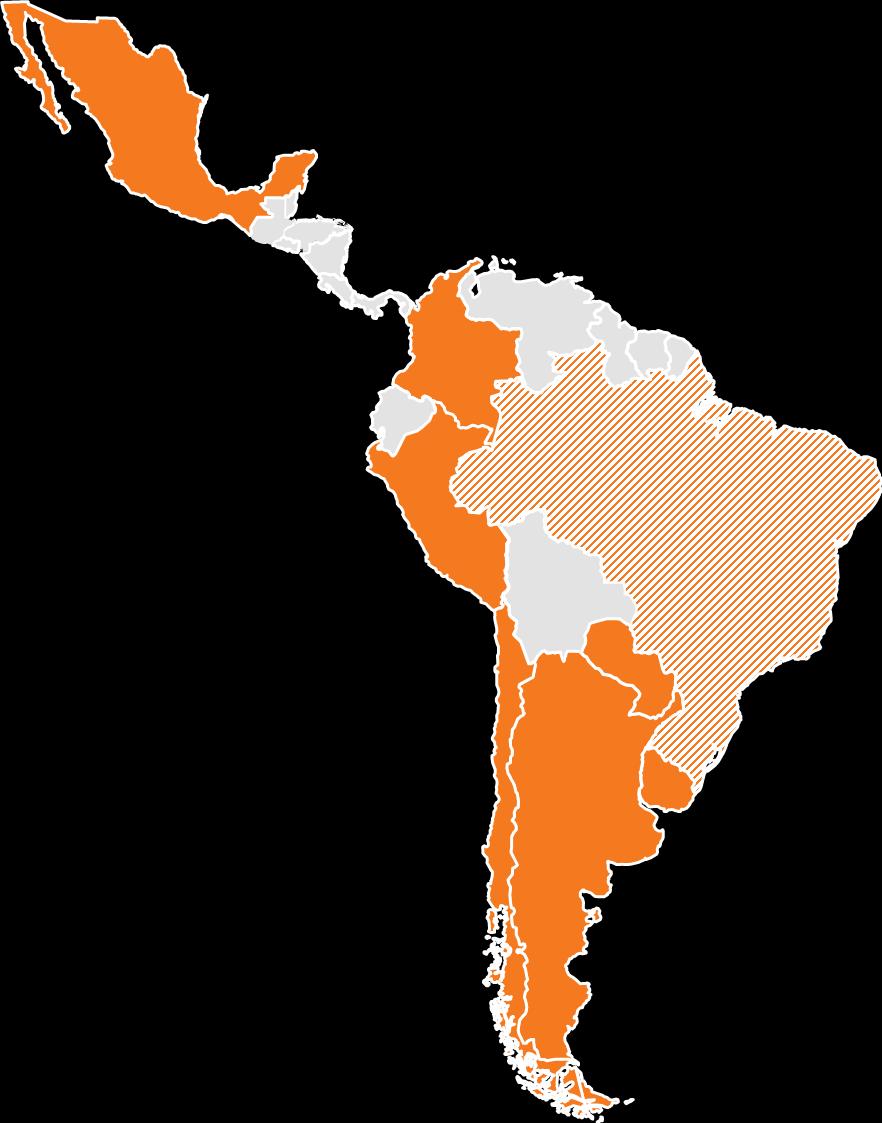


63
financial report September 30, 2013
 financial report September 30, 2013 Itaú Unibanco Holding S.A. Management Discussion & Analysis and Complete Financial Statements Contents Management Discussion & Analysis 3 Executive Summary 3 Analysis
financial report June 30, 2013 Management Discussion & Analysis and Complete Financial Statements Itaú Unibanco Holding S.A.
 financial report June 30, 2013 Itaú Unibanco Holding S.A. Management Discussion & Analysis and Complete Financial Statements Contents Management Discussion & Analysis 3 Executive Summary 3 Analysis of
financial report 1Q14 Management Discussion & Analysis and Complete Financial Statements
 financial report 1Q14 Management Discussion & Analysis and Complete Financial Statements Contents Management Discussion & Analysis 3 Executive Summary 5 Analysis of Net Income 15 Managerial Financial Margin
financial report December 31, 2012 Itaú Unibanco Holding S.A. Management Discussion & Analysis and Complete Financial Statements
 financial report December 31, 2012 Itaú Unibanco Holding S.A. Management Discussion & Analysis and Complete Financial Statements Contents Management Discussion & Analysis 3 Executive Summary 3 Analysis
financial report September 30, 2012 Itaú Unibanco Holding S.A. Management Discussion & Analysis and Complete Financial Statements
 financial report September 30, 2012 Itaú Unibanco Holding S.A. Management Discussion & Analysis and Complete Financial Statements Contents Management Discussion & Analysis 3 Executive Summary 3 Analysis
executive summary Itaú Unibanco Holding S.A. 4th quarter of 2012 Management Discussion & Analysis
 executive summary 4th quarter of 2012 Information and financial indicators of (Itaú Unibanco) are presented below: Highlights (except where indicated) 4Q12 3Q12 4Q11 2012 2011 Statement of Income Recurring
financial report 1 st quarter of 2012 Itaú Unibanco Holding S.A. Management Discussion & Analysis and Complete Financial Statements
 financial report 1 st quarter of 2012 Itaú Unibanco Holding S.A. Management Discussion & Analysis and Complete Financial Statements Contents Management Discussion & Analysis 3 Executive Summary 3 Analysis
3 rd quarter of Management Discussion & Analysis and Complete Financial Statements. Itaú Unibanco Holding S.A.
 3 rd quarter of 2011 Management Discussion & Analysis and Complete Financial Statements Itaú Unibanco Holding S.A. Contents Management Discussion & Analysis 1 Executive Summary 3 Analysis of Net income
4 th quarter of Management Discussion & Analysis and Complete Financial Statements. Itaú Unibanco Holding S.A.
 4 th quarter of 2011 Management Discussion & Analysis and Complete Financial Statements Itaú Unibanco Holding S.A. Contents Management Discussion & Analysis 1 Executive Summary 3 Analysis of Net Income
4th Quarter, Executive Summary. Itaú Unibanco Holding S.A.
 4th Quarter, 2011 Executive Summary Information and financial indicators of (Itaú Unibanco) are presented below. Highlights (except where indicated) Statement of Income Recurring Net Income 3,746 3,940
3 rd Quarter Executive Summary. Itaú Unibanco Holding S.A.
 3 rd Quarter 2010 Executive Summary Information and financial indicators of (Itaú Unibanco) from the third quarter of 2010 are presented below. (except where indicated) Highlights Statements of Income
3 rd quarter, Management Discussion & Analysis
 3 rd quarter, 2010 Management Discussion & Analysis Contents Executive Summary 3 Analysis of Net Income 10 Managerial Financial Margin 11 Results from Loan and Lease Losses 13 Banking Service Fees and
1 st Quarter Executive Summary. Itaú Unibanco Holding S.A.
 1 st Quarter 2010 Executive Summary Holding S.A. Information and financial indicators of Holding S.A. from the first quarter of 2010 are presented below. (except where indicated) Highlights Statements
Reference: Itaú Unibanco Holding S.A. Announcement to the Market
 Reference: 2 nd Quarter Result 2017 Announcement to the Market ( Company ) announces to its shareholders and the market at large that the Complete Financial Statements and the Management Discussion and
2Q17. Management Discussion & Analysis and Complete Financial Statements
 2Q17 Management Discussion & Analysis and Complete Financial Statements CONTENTS 03 Management Discussion & Analysis 05 15 Executive Summary Income Statement and Balance Sheet Analysis 16 18 22 26 29 33
1 st Quarter Management Discussion & Analisys and Complete Financial Statements. Itaú Unibanco Holding S.A.
 1 st Quarter 2010 Management Discussion & Analisys and Complete Financial Statements Itaú Unibanco Holding S.A. Itaú Unibanco Contents Management Discussion and Analysis 1 Complete Financial Statements
Quarter M nagement Discussion & Analisys and Complete Financial Statements. Itaú Unibanco Holding S.A.
 Quarter 2010 M nagement Discussion & Analisys and Complete Financial Statements Itaú Unibanco Holding S.A. Itaú Unibanco Contents Management Discussion and Analysis 1 Complete Financial Statements 53 4
Itaú Unibanco Holding S.A.
 2nd Quarter 2009 The table below shows selected information and performance indicators of (*) The result and balances of the second quarter of 2008 and from the first half of 2008, correspond to the sum
Management Discussion & Analysis and Complete Financial Statements 4Q17. Itaú Unibanco Holding S.A.
 Management Discussion & Analysis and Complete Financial Statements 4Q17 Itaú Unibanco Holding S.A. www.itau.com.br/investor-relations facebook.com/itauunibancori @itauunibanco_ri Contents Management Discussion
Management Discussion & Analysis and Complete Financial Statements 1Q18. Itaú Unibanco Holding S.A.
 Management Discussion & Analysis and Complete Financial Statements 1Q18 Itaú Unibanco Holding S.A. www.itau.com.br/investor-relations Contents Management Discussion & Analysis Page 03 Executive Summary
Management Discussion and Analysis and Complete Financial Statements. Second Quarter of 2008
 Management Discussion and Analysis and Complete Financial Statements Second Quarter of 2008 Contents Executive Summary 03 Analysis of the Consolidated Net Income 12 - Managerial Financial Margin 13 - Results
Itaú Unibanco Holding S.A.
 Itaú Unibanco Holding S.A. Management Discussion & Analysis and Complete Financial Statements 2nd Quarter 2009 Itaú Unibanco Contents Management Discussion and Analysis 1 Complete Financial Statements
Management Discussion & Analysis and Complete Financial Statements 3Q18. Itaú Unibanco Holding S.A.
 Management Discussion & Analysis and Complete Financial Statements 3Q18 Itaú Unibanco Holding S.A. www.itau.com.br/investor-relations facebook.com/itauunibancori @itauunibanco_ri Contents Management Discussion
Reference: Itaú Unibanco Holding S.A. Annual Result Announcement to the Market
 Reference: Annual Result 2017 Announcement to the Market ( Company ) announces to its shareholders and the market at large that the Complete Financial Statements and the Management Discussion and Analysis
ITAÚ UNIBANCO HOLDING S.A. CNPJ / A Publicly Listed Company NIRE
 ITAÚ UNIBANCO HOLDING S.A. CNPJ 60.872.504/0001-23 A Publicly Listed Company NIRE 35300010230 ANNOUNCEMENT TO THE MARKET Results for the 1st quarter of 2018 ( Company ) announces to its shareholders and
1 st Quarter 2013 Earnings Results
 Conference Call 1 st Quarter 2013 Earnings Results Alfredo Egydio Setubal Executive Vice-President and Investor Relations Officer May 02 2013 Highlights Recurring Net Income of R$3.5 billion, with a 0.3%
Executive Sumary. Third Quarter of 2008
 Executive Sumary Highlights - Managerial Criteria 30.0% 25.0% 20.0% 15.0% 10.0% 5.0% 24.5% 24.7% 24.1% 23.8% 24.0% 24.1% 24.8% 25.3% 26.1% 26.7% 26.9% 22.0% 23.0% 23.3% 22.7% 22.6% 22.1% 22.5% 22.2% 22.5%
ITAÚ UNIBANCO HOLDING S.A. CNPJ / A Publicly Listed Company NIRE
 ITAÚ UNIBANCO HOLDING S.A. CNPJ 60.872.504/0001-23 A Publicly Listed Company NIRE 35300010230 ANNOUNCEMENT TO THE MARKET Results for the 3rd quarter of 2018 ( Company ) announces to its shareholders and
Market Shares - Jun/2006
 June 2006 Highlights - Managerial Criteria ( except where indicated) Statements of Income 2nd Q./06 1st Q./06 2nd Q./05 1st Half/06 1st Half/05 Net Income 1,498 1,460 1,333 2,958 2,475 Managerial Financial
Management Discussion & Analysis and Complete Financial Statements 4Q18. Itaú Unibanco Holding S.A.
 Management Discussion & Analysis and Complete Financial Statements 4Q18 Itaú Unibanco Holding S.A. www.itau.com.br/investor-relations facebook.com/itauunibancori @itauunibanco_ri Management Discussion
The tables in this report show the figures in millions. However, the variations were calculated using the figures in units.
 Management Discussion & Analysis June 2006 Contents Executive Summary 03 Analysis of the Consolidated Net Income 14 - Managerial Financial Margin 14 - Results from Loan and Lease Losses 15 - Banking Service
Conference Call about 2009 Earnings Results
 Conference Call about 2009 Earnings Results Roberto Egydio Setubal CEO February 10 th, 2010 1 Highlights 1. Earnings: 4 th Q/09: Recurring Net Income of R$ 2,813 million, an increase of 4.7% compared to
1 st quarter 2016 Earnings Review Conference Call
 st quarter 206 Earnings Review Conference Call Eduardo Mazzilli de Vassimon Executive Vice-President, CFO (Chief Financial Officer) and CRO (Chief Risk Officer) Marcelo Kopel Investor Relations Officer
December Executive Summary
 December 2005 Executive Summary Highlights - Managerial Criteria (except where indicated) Net Income 1,425 1,352 1,030 5,251 3,776 Managerial Financial Margin (1) 3,650 3,331 3,396 13,272 10,634 Bank Service
The tables in this report show the figures in millions. However, the calculations of the variations and totals used figures in units.
 Management Discussion & Analysis and Complete Financial Statements March 2006 Contents Executive Summary 03 Analysis of the Consolidated Net Income 13 - Net Interest Margin 14 - Results from Doubtful Loans
Conference Call 3 rd quarter 2017 Earnings Review
 Conference Call 3 rd quarter 207 Earnings Review Candido Botelho Bracher President and CEO Caio Ibrahim David Executive Vice-President, CFO and CRO Alexsandro Broedel Lopes Executive Finance Director and
Conference Call 1 st quarter Earnings Review
 Conference Call 1 st quarter 2018 - Earnings Review Candido Botelho Bracher President and CEO Caio Ibrahim David Executive Vice-President, CFO and CRO Alexsandro Broedel Executive Finance Director and
about 3 rd Q/09 Earnings Results
 Conference Call about 3 rd Q/09 Earnings Results Alfredo Egydio Setubal Investor Relations Officer November 4 th, 2009 1 Highlights 1. Earnings: 3 rd Q/09: Recurring Net Income of R$2,687 million, an increase
Please note that the data relating to previous periods shown in this report has been recalculated, due to the exclusion of non-recurring items.
 Management Discussion & Analysis September 2006 Contents Executive Summary 03 Analysis of the Consolidated Net Income 13 - Managerial Financial Margin 13 - Results from Loan and Lease Losses 14 - Banking
Management Discussion and Analysis, Share Price and ADR Performance and Financial Statements Itaú Unibanco Holding S.A.
 Management Discussion and Analysis, Share Price and ADR Performance and Financial Statements 2011 Financial Statements 2011 Summary 3 Management Discussion & Analisys.................... 4 Performance
1 st quarter 2017 Earnings Review Conference Call
 1 st quarter 2017 Earnings Review Conference Call Candido Botelho Bracher President and CEO Caio Ibrahim David Executive Vice-President, CFO (Chief Financial Officer) and CRO (Chief Risk Officer) Marcelo
Conference Call about 4 th Quarter 2011 Earnings
 Conference Call about 4 th Quarter 2011 Earnings Results Roberto Egydio Setubal President & CEO Feb 08 2012 Highlights 1. Results: Recurring net income reached R$ 3.7 billion in the 4 th Q/11 (21.8% ROE)
3 rd QUARTER REPORT ON ECONOMIC AND FINANCIAL ANALYSIS
 3 rd QUARTER 2018 REPORT ON ECONOMIC AND FINANCIAL ANALYSIS rrrr Table of contents 1 - Press Release 3 Main Information 4 Recurring Net Income vs. Book Net Income 5 Summarized Analysis of Recurring Income
December Management Discussion & Analysis
 December 2005 Management Discussion & Analysis Contents Executive Summary 03 Analysis of the Consolidated Performance 13 - Net Interest Margin 15 - Results from Doubtful Loans 16 - Banking Service Fees
September Management Discussion & Analysis
 September 2005 Management Discussion & Analysis Contents Executive Summary 03 Analysis of the Consolidated Performance 13 - Net Interest Margin 14 - Results from Doubtful Loans 15 - Banking Service Fees
Conference Call 2017 Earnings Review
 Conference Call 2017 Earnings Review Candido Botelho Bracher President and CEO Caio Ibrahim David Executive Vice-President, CFO and CRO Alexsandro Broedel Lopes Executive Finance Director and Investor
The tables in this report are expressed in millions. However, variations and totals were calculated based on amounts expressed in whole units.
 Management Discussion and Analysis December 2004 Contents Executive Summary 87 Analysis of the Consolidated Performance 95 - Analysis of the Net Interest Margin 96 - Results from Doubtful Debts 97 - Banking
Itaú CorpBanca 2Q16. Management Discussion & Analysis
 Itaú CorpBanca 2Q16 Management Discussion & Analysis CONTENTS 03 Management Discussion & Analysis 05 Executive Summary 14 Income Statement and Balance Sheet Analysis 15 Net Interest Income 16 Credit Portfolio
ITAÚ UNIBANCO HOLDING S.A. CNPJ / A Publicly Listed Company NIRE
 ITAÚ UNIBANCO HOLDING S.A. CNPJ 60.872.504/0001-23 A Publicly Listed Company NIRE 35300010230 ANNOUNCEMENT TO THE MARKET Conference Calls of the 2nd quarter 2018 Result In accordance with the invitation
3Q Itaú CorpBanca
 Executive Summary 3Q 2016 CONTENTS 03 Management Discussion & Analysis 05 Executive Summary 14 Income Statement and Balance Sheet Analysis 15 Managerial results. Breakdown by country 17 Managerial results
gement Analysis Discussion mplete Financial Manag Stateme Discussion
 gement Discussion mplete Analysis Manag Financial Stateme Discussion Management Discussion and Analysis Complete Financial Statements March 2004 Contents Executive Summary 03 Analysis of the Consolidated
ITAÚ UNIBANCO HOLDING S.A.
 CNPJ 60.872.504/0001-23 ITAÚ UNIBANCO HOLDING S.A. A Publicly Listed Company ANNOUNCEMENT TO THE MARKET Conference Calls of the 2 nd quarter 2017 Result In accordance with the invitation extended to the
June Management Discussion & Analysis
 June 2005 Management Discussion & Analysis Contents Executive Summary 03 Analysis of the Consolidated Performance 13 - Net Interest Margin 14 - Results from Doubtful Loans 15 - Banking Service Fees 17
gement Analysis Discussion mplete Financial Manag Stateme Discussion
 gement Discussion mplete Analysis Manag Financial Stateme Discussion Management Discussion and Analysis Complete Financial Statements September 2004 Contents Executive Summary 03 Analysis of the Consolidated
Report on Financial Analysis
 10 sttrimestre 1 Quarter ϮϬϭϴ Report on Economic and Analysis RELATÓRIO DE ANÁLISE ECONÔMICA E FINANCEIRA Table of contents 1 - Press Release 3 Main Information 4 Recurring Net Income vs. Book Net Income
Banco Santander (Brasil) S.A. 1H12 BR GAAP Results July 26 th, 2012
 S.A. 1H12 BR GAAP Results July 26 th, 2012") Banco Santander (Brasil) S.A. 1H12 BR GAAP Results July 26 th, 2012 DISCLAIMER This presentation may contain certain forward-looking statements and information relating to Banco Santander (Brasil) S.A.
Banco Santander (Brasil) S.A. 1H12 BR GAAP Results July 26 th, 2012 DISCLAIMER This presentation may contain certain forward-looking statements and information relating to Banco Santander (Brasil) S.A.
3Q Itaú CorpBanca
 Executive Summary 3Q 2017 CONTENTS 05 Management Discussion & Analysis 07 Executive Summary 17 Income Statement and Balance Sheet Analysis 19 Managerial results - Breakdown by country 21 Managerial results
June 30, Executive Summary. Banco Itaú 1 Management Discussion and Analysis
 June 30, 2002 Executive Summary Banco Itaú 1 Management Discussion and Analysis Highlights (except where indicated) Consolidated Balance Sheet Jun 30, 02 Mar 31, 02 Jun 30, 02 Jun 30, 01 Total Assets 87,022
Itaú Unibanco. Itaú BBA s 13 th Annual Latam CEO Conference in NY. Candido Bracher
 Itaú Unibanco Itaú BBA s 13 th Annual Latam CEO Conference in NY Candido Bracher 2018 Agenda 1. About us 2. Context and Results 3. Future About us About us Who we are We are a universal bank, with 94 years
Management Discussion & Analysis 3Q18. itau.cl/investor-relations
 Management Discussion & Analysis 3Q18 itau.cl/investor-relations CONTENTS Contents Management Discussion & Analysis Page 5 Executive Summary Income Statement and Balance Sheet Analysis Managerial results
41.0% in 12 months and 40.8% in the quarter
 Main Recurring Net Income Efficiency Ratio (ER) Profitability 2Q18 R$5.2 billion + 9.7% in 12 months + 1.2% in the quarter 41.0% in 12 months and 40.8% in the quarter Return on Average Equity 18.5% (Year-to-Date
Executive Summary. Banco Itaú S.A. Highlights. * JCP ( Interests on Capital) * * Efficiency Ratio was calculated using the recurring net income.
 * * Efficiency Ratio was calculated using the recurring net income.") Highlights * JCP ( Interests on Capital) * * Efficiency Ratio was calculated using the recurring net income. Consolidated Balance Sheet 95,580 82,887 78,113 2,791 2,046 1,797 10,861 13,471 7,181 23,227
Highlights * JCP ( Interests on Capital) * * Efficiency Ratio was calculated using the recurring net income. Consolidated Balance Sheet 95,580 82,887 78,113 2,791 2,046 1,797 10,861 13,471 7,181 23,227
Banco Santander (Brasil) S.A. 1H11 IFRS Results
 S.A. 1H11 IFRS Results") Banco Santander (Brasil) S.A. 1H11 IFRS Results July 27 th, 2011 Table of Contents 2 Main Ideas Macroeconomic Scenario Strategy Business Results Final Remarks Main Ideas Results of 1H11 3 1 2 3 4 Commercial
Banco Santander (Brasil) S.A. 1H11 IFRS Results July 27 th, 2011 Table of Contents 2 Main Ideas Macroeconomic Scenario Strategy Business Results Final Remarks Main Ideas Results of 1H11 3 1 2 3 4 Commercial
Management Discussion and Analysis, Share Price and ADR Performance and Financial Statements Itaú Unibanco Banco Múltiplo S.A.
 Management Discussion and Analysis, Share Price and ADR Performance and Financial Statements 2008 Itaú Unibanco Banco Múltiplo S.A. Summary Management Discussion and Analysis 2 Share Price and ADR Performance
Highlights R$ Million (except where indicated)
") Highlights (except where indicated) Short Term Deposit Local Currency - Short Term - br.a-1 (1) JCP ( Interests on Capital) (*) Including savings accountholders and other non-current accountholders. We
Highlights (except where indicated) Short Term Deposit Local Currency - Short Term - br.a-1 (1) JCP ( Interests on Capital) (*) Including savings accountholders and other non-current accountholders. We
Banco do Brasil S.A. - MD&A 2Q17
 Banco do Brasil S.A. - MD&A 2Q17 This report makes references and statements, planned synergies, growth estimates, earnings and strategies projections regarding Banco do Brasil s Conglomerate. Such statements
Selected quarterly information. 3 rd quarter 2016
 Selected quarterly information 3 rd quarter 2016 Contents Ownership structure Highlights Economic performance Performance assessment ITAÚSA in the stock market Flow of dividends / Interest on capital Financial
Banco Santander (Brasil) S.A. 9M11 IFRS Results October 27 th, 2011
 S.A. 9M11 IFRS Results October 27 th, 2011") Banco Santander (Brasil) S.A. 9M11 IFRS Results October 27 th, 2011 Table of Contents 2 Highlights Macroeconomic Scenario Strategy Business Results Final Remarks Highlights 3 Annual growth of double-digit:
Banco Santander (Brasil) S.A. 9M11 IFRS Results October 27 th, 2011 Table of Contents 2 Highlights Macroeconomic Scenario Strategy Business Results Final Remarks Highlights 3 Annual growth of double-digit:
Earnings Presentation
 Earnings Presentation 4 th Quarter, 2016 Disclaimer: This presentation may include references and statements on expectations, planned synergies, growth estimates, projections of results, and future strategies
Complete Financial Statements. Economic- Financial Analysis. Additional Information. Return on Average Equity 19.7% (Net Income for the Quarter)
") Main Recurring Net Income Profitability Market Capitalization 4Q18 R$ 5.8 billion + 6.6% in the quarter + 19.9% in 12 months Return on Average Equity 19.7% (Net Income for the Quarter) R$ 242.6 billion
Main Recurring Net Income Profitability Market Capitalization 4Q18 R$ 5.8 billion + 6.6% in the quarter + 19.9% in 12 months Return on Average Equity 19.7% (Net Income for the Quarter) R$ 242.6 billion
Banco do Brasil S.A. - MD&A 2Q18
 - ~ 1$1 - Banco do Brasil S.A. - MD&A 2Q18 This report makes references and statements, planned synergies, growth estimates, earnings and strategies projections regarding Banco do Brasil s Conglomerate.
Message from the CEO
 BCO06116 BCO06116 São Paulo, February 13 th, 2014. Banco Votorantim S.A. ( BV ) announces its results for the fourth quarter (4Q13) and for the full year of 2013. All financial information herein, except
Banco do Brasil S.A. - MD&A 4Q17
 Banco do Brasil S.A. - MD&A 4Q17 This report makes references and statements, planned synergies, growth estimates, earnings and strategies projections regarding Banco do Brasil s Conglomerate. Such statements
Earnings Presentation
 Earnings Presentation 3 rd Quarter, 2016 Disclaimer: This presentation may include references and statements on expectations, planned synergies, growth estimates, projections of results, and future strategies
Earnings Summary 3Q17
 Earnings Summary Adjusted Net Income of R$7.9 billion Banco do Brasil delivered R$7.9 billion in 9M17, an increase of 45.1% in the period. This performance was primarily due to the increase in fee income,
EARNINGS RELEASE ST QUARTER
 EARNINGS RELEASE 2017 1 ST QUARTER Highlights Consolidated net income rose 7.6% year-over-year to R$ 33.3 million in. Profitability of the loan portfolio (ROAA) was 3.6% in, up 0.5 p.p. compared to. Return
Banco Santander (Brasil) S.A.
 S.A.") Banco Santander (Brasil) S.A. 9M09 IFRS Results Pro forma October 28th, 2009 Table of Contents 2 Macroeconomic Scenario and Financial System 9M09 - Strategy -Results - Business Macroeconomic Scenario 3
Banco Santander (Brasil) S.A. 9M09 IFRS Results Pro forma October 28th, 2009 Table of Contents 2 Macroeconomic Scenario and Financial System 9M09 - Strategy -Results - Business Macroeconomic Scenario 3
CONFERENCE CALL. and. November 04, 2008
 CONFERENCE CALL and Roberto Egydio Setubal Pedro Moreira Salles November 04, 2008 1 Itaú s 3 rd Quarter Results 2 Investor Relations Highlights R$ Million 3rd Qtr/08 2nd Qtr/08 Variance Jan- Sep/08 Jan-
Management Discussion and Analisys
 Management Discussion and Analisys Third Quarter of 2001 Banco Itaú S.A. Indice Banco Itaú S.A. Highlights 02 Executive Summary 03 Analysis of the Consolidated Performance 07 Result 07 Performance in the
This presentation may include references and statements, planned synergies, estimates, projections of results, and future strategy for Banco do
 This presentation may include references and statements, planned synergies, estimates, projections of results, and future strategy for Banco do Brasil, its Associated and Affiliated Companies, and Subsidiaries.
Earnings Presentation
 Earnings Presentation 2 nd Quarter 2018 Disclaimer: This presentation may include references and statements on expectations, planned synergies, growth estimates, projections of results, and future strategies
Itaú CorpBanca Colombia Institutional Presentation
 Itaú CorpBanca Colombia Institutional Presentation June 2017 Agenda 1. Itaú Unibanco 2. Itaú CorpBanca 3. Itaú CorpBanca Colombia Itaú Unibanco At a Glance Leading position in Brazil through key competitive
Banco Santander (Brasil) S.A. Results 1H10 July 29 th, 2010
 S.A. Results 1H10 July 29 th, 2010") Banco Santander (Brasil) S.A. Results 1H10 July 29 th, 2010 Disclaimer: forward-looking statements that may be written in this report related to the business outlook of Banco Santander, operating and financial
Banco Santander (Brasil) S.A. Results 1H10 July 29 th, 2010 Disclaimer: forward-looking statements that may be written in this report related to the business outlook of Banco Santander, operating and financial
SECURITIES AND EXCHANGE COMMISSION Washington, D.C FORM 6-K
 SECURITIES AND EXCHANGE COMMISSION Washington, D.C. 20549 FORM 6-K Report of Foreign Issuer Pursuant to Rule 13a-16 or 15d-16 of the Securities Exchange Act of 1934 Commission File Number 1-14640 For the
Itaú Unibanco Holding S.A. Comunicado al Mercado
 Itaú Unibanco Holding S.A. CNPJ 60.872.504/000-23 Compañía Abierta Comunicado al Mercado Teleconferencia del Resultado del 4º Trimestre de 206 Tal como se comunica en la invitación hecha a los órganos
Banco Santander (Brasil) S.A. Results 9M10 October 28 th, 2010
 S.A. Results 9M10 October 28 th, 2010") Banco Santander (Brasil) S.A. Results 9M10 October 28 th, 2010 Disclaimer: forward-looking statements that may be written in this report related to the business outlook of Banco Santander, operating and
Banco Santander (Brasil) S.A. Results 9M10 October 28 th, 2010 Disclaimer: forward-looking statements that may be written in this report related to the business outlook of Banco Santander, operating and
Earnings Presentation
 Earnings Presentation 1 st Quarter, 2017 Disclaimer: This presentation may include references and statements on expectations, planned synergies, growth estimates, projections of results, and future strategies
Banco do Brasil S.A. - MD&A 4Q16
 MD&A 4Q16 Banco do Brasil S.A. - MD&A 4Q16 This report makes references and statements, planned synergies, growth estimates, earnings and strategies projections regarding Banco do Brasil s Conglomerate.
1Q17. Earnings Release
 Earnings Release Disclaimer This presentation may include references and statements, planned synergies, estimates, projections of results, and future strategy for Banco do Brasil, its Associated and Affiliated
BR GAAP RESULTS 1Q12
 BR GAAP RESULTS 1Q12 1 CONTENTS CONTENTS MANAGERIAL ANALYSIS OF RESULTS BR GAAP KEY CONSOLIDATED DATA 03 RATINGS 04 MACROECONOMIC ENVIRONMENT 05 RECENT EVENTS 06 STRATEGY 07 XX EXECUTIVE SUMMARY 08 SANTANDER
Earnings Summary 1Q13
 1Q13 Earnings Summary BB s Adjusted Net Income reaches R$ 2.7 billion in the 1Q13 Banco do Brasil recorded adjusted net income, excluding one-off items, of R$ 2.7 billion in the 1Q13. This performance
Earnings Presentation
 Earnings Presentation 4 th Quarter 2017 Disclaimer: This presentation may include references and statements on expectations, planned synergies, growth estimates, projections of results, and future strategies
Earnings Presentation
 Earnings Presentation 1 st Quarter 2018 Disclaimer: This presentation may include references and statements on expectations, planned synergies, growth estimates, projections of results, and future strategies
Highlights of the third quarter of 2017
 Consolidated Highlights Free cash flow of R$ 500 million in 3Q17, double the amount generated in 2Q17. Selling, general and administrative expenses decrease 18% in 3Q17 compared to 3Q16, corresponding
FINANCIAL STATEMENTS September/2018 1
 FINANCIAL STATEMENTS September/2018 1 INDEX PRESS RELEASE... 7 BUSINESS ENVIRONMENT... 9 FINANCIAL HIGHLIGHTS... 9 OPERATIONAL HIGHLIGHTS... 11 GUIDANCE... 12 ANALYSIS OF PERFORMANCE... 14 MARKET SHARE...
This presentation may include references and statements, planned synergies, estimates, projections of results, and future strategy for Banco do
 This presentation may include references and statements, planned synergies, estimates, projections of results, and future strategy for Banco do Brasil, its Associated and Affiliated Companies, and Subsidiaries.
Earnings Summary 1Q14
 Earnings Summary Earnings Net Income of R$ 2.7 billion in the Banco do Brasil presents Net Income of R$ 2.7 billion in the, up 4.7% on 1Q13. This performance corresponds to ROE of 15.5%. Adjusted Net Income,
This presentation may include references and statements, planned synergies, estimates, projections of results, and future strategy for Banco do
 This presentation may include references and statements, planned synergies, estimates, projections of results, and future strategy for Banco do Brasil, its Associated and Affiliated Companies, and Subsidiaries.
Index Message from the CEO...3 Corporate Strategy...4 Financial Highlights...5 Managerial Income Statement...6
 Index Message from the CEO...3 Corporate Strategy...4 Financial Highlights...5 Managerial Income Statement...6 Net Interest Income (NII)... 8 Credit Portfolio... 9 Auto Finance Origination... 10 Delinquency
Earnings Presentation
 Earnings Presentation 1 st Quarter, 2014 Disclaimer: This presentation may include references and statements on expectations, planned synergies, growth estimates, projections of results, and future strategies