Investment Performance Review For the Quarter Ended June 30, 2017
|
|
|
- Kathlyn Davidson
- 6 years ago
- Views:
Transcription
1
2
3
4

5 Investment Performance Review Client Management Team Monique Spyke, Managing Director Izac Chyou, Senior Managing Consultant 50 California Street, Suite 2300 San Francisco, CA PFM Asset Management LLC One Keystone Plaza, Suite 300 Harrisburg, PA
6 Market Update
7 Market Update Short-Term Yields Higher but Curve Flatter in Second Quarter Treasury yields are substantially higher compared to a year ago, with short-term yields rising in response to the Fed raising rates to normalize policy, while longer-term yields have come down in response to lower inflation expectations. 2.5% 2.0% 1.5% 1.0% 0.5% U.S. Treasury Yield Curve June 30, 2017 March 31, 2017 June 30, 2016 Yield Curve History Maturity 03/31/17 06/30/17 Change 3-Mo Mo Yr Yr Yr Yr Yr Yr % 3 m 6 m 1 y 2 y 3 y 5 y 30-Yr Source: Bloomberg, as of 6/30/17. PFM Asset Management LLC 1
8 Market Update A Tale of Two Markets 2,450 U.S. Election S&P % Hundreds 2, % 2, Year U.S. Treasury 2.50% 2, % Conflicting signals from the bond and equity markets: Falling bond yields are reflecting a weakening outlook for inflation and possibly economic growth in the U.S. Equities are hitting new record highs supported by strong corporate profits, but valuations are stretched. 2, % Sep '16 Oct '16 Nov '16 Dec '16 Jan '17 Feb '17 Mar '17 Apr '17 May '17 Jun '17 Source: The WSJ Daily Shot, Bloomberg, as of 6/30/17. PFM Asset Management LLC 2
9 Market Update Economic Growth Gross domestic product increased at an annualized rate of 2.6% in the second quarter of All four major components contributed positively to economic growth, with personal consumption bouncing back and adding 1.9% to the top line. Gross private investments, net exports, and government consumption were more modest, contributing 0.7% in total to second quarter GDP. 6% 5% 4% U.S. Real GDP QoQ, SAAR Bloomberg Survey of Economists 3% 2.7% 2.7% 2.6% 2% 2.0% 1.9% 1% 0% -1% -2% Q1 Q2 Q3 Q4 Q1 Q2 Q3 Q4 Q1 Q2 Q3 Q4 Q1 Q2 Q3 Q4 Q1 Q2 Q3 Q Source: Bloomberg, as of 7/28/17. SAAR is seasonally adjusted annualized rate. Orange dashes denotes four-quarter averages. PFM Asset Management LLC 3
10 Market Update Labor Market Strength Continues The U.S. labor market continued to improve, adding 581,000 jobs in the second quarter and an average of 187,000 jobs per month over the past year. The headline unemployment rate and the labor force participation rate ticked up to 4.4% and 62.8%, respectively. The U-6 rate, which includes underemployed and discouraged workers, ended the quarter at 8.6% the lowest since Average hourly earnings an important gauge of wage growth grew 2.5% over the past 12 months. Monthly Change in Nonfarm Payrolls Unemployment Rate Nonfarm Payrolls 12-Month Moving Average 9% 400k 8.2% 300k 8% 7.5% 7% 200k 6% 6.1% 5.3% 100k 5% 4.9% 4.4% 0k Jun '12 Jun '13 Jun '14 Jun '15 Jun '16 Jun '17 4% Jun '12 Jun '13 Jun '14 Jun '15 Jun '16 Jun '17 Source: Bloomberg, as of 6/30/17. PFM Asset Management LLC 4
11 Market Update Inflation Trend Reverses 2.5% Inflation Measures (YoY) 2.70% 10-Year Treasury Yield 2.0% 1.5% 1.0% 0.5% Core CPI Core PCE 0.0% Fed's Long Term Inflation Target May '12 May '13 May '14 May '15 May '16 May ' % 2.30% 2.10% 1.90% Election 1.70% 1.50% Sep '16 Dec '16 Mar '17 Jun ' Dollar Index 2.20% Market Expectation for Inflation Over Next 5 Years % Election 1.80% 1.60% Election 94 Sep '16 Dec '16 Mar '17 Jun ' % Sep '16 Dec '16 Mar '17 Jun '17 Source: Bloomberg, as of 6/30/17. Post-election period is 11/08/16-1/20/17, post-inauguration period is 1/20/17-6/30/17. PFM Asset Management LLC 5
12 Market Update Fed Rate Hikes Expected in 2017 On June 14, the Federal Open Market Committee (FOMC) raised rates for the fourth time since the recession by 25bps, lifting its target rate to 1.00% %. Market implied probabilities indicate that there is a 52% chance of the Fed raising rates at their December meeting. Additionally, the market has priced in a 45% chance of one more hike this year. Probability of Fed Rate Hike Meeting 6/30/2017 7/26/2017 0% 9/20/ % 11/1/ % 12/13/ % 1/31/ % 60% 50% 40% 30% 20% 10% Number of Total Rate Hikes Expected in % Source: Bloomberg, based on Fed Funds Futures (Effective rate) by Bloomberg. PFM Asset Management LLC 6
13 Market Update Fed s Balance Sheet Normalization Plan At the June FOMC meeting, the Federal Reserve laid out its plan to reduce the size of its balance sheet, which stands at $4.5 trillion after multiple rounds of quantitative easing following the 2007 financial crisis. Fed officials expect to begin implementing the program this year, provided the economy evolves broadly as anticipated. The Fed plans to gradually reduce its holdings by decreasing reinvestments of principal payments on its U.S. Treasury and agency mortgage-backed securities. The pace of this decline will be limited by a cap that starts at $10 billion per month, increasing every three months until it reaches $50 billion per month. (in trillion) $5 $4 $3 $2 Fed s Total Balance Sheet Assets Treasury Mortgage-Backed Federal Agency Other Projection QE3 QE2 (in billion) Treasury Holdings Agency MBS Holdings Total Fed Assets Dec 2017 $2,465 $1,770 $4,470 Dec 2019 (Projected) $2,035 $1,410* $3,680 $1 Difference: $430 $360* $790 $ *MBS projection assumes that principal payments will always exceed the cap over the horizon period (i.e. the monthly run off amount is equal to the cap). Source: Bloomberg, The Federal Reserve, FRB of St. Louis, as of 6/15/17. Projection is based on maturity schedule of Fed s Treasury holdings and caps on reinvestments as described in FOMC s June 2017 addendum to the Policy Normalization Principles and Plans, assuming normalization begins in January PFM Asset Management LLC 7
14 Portfolio Review
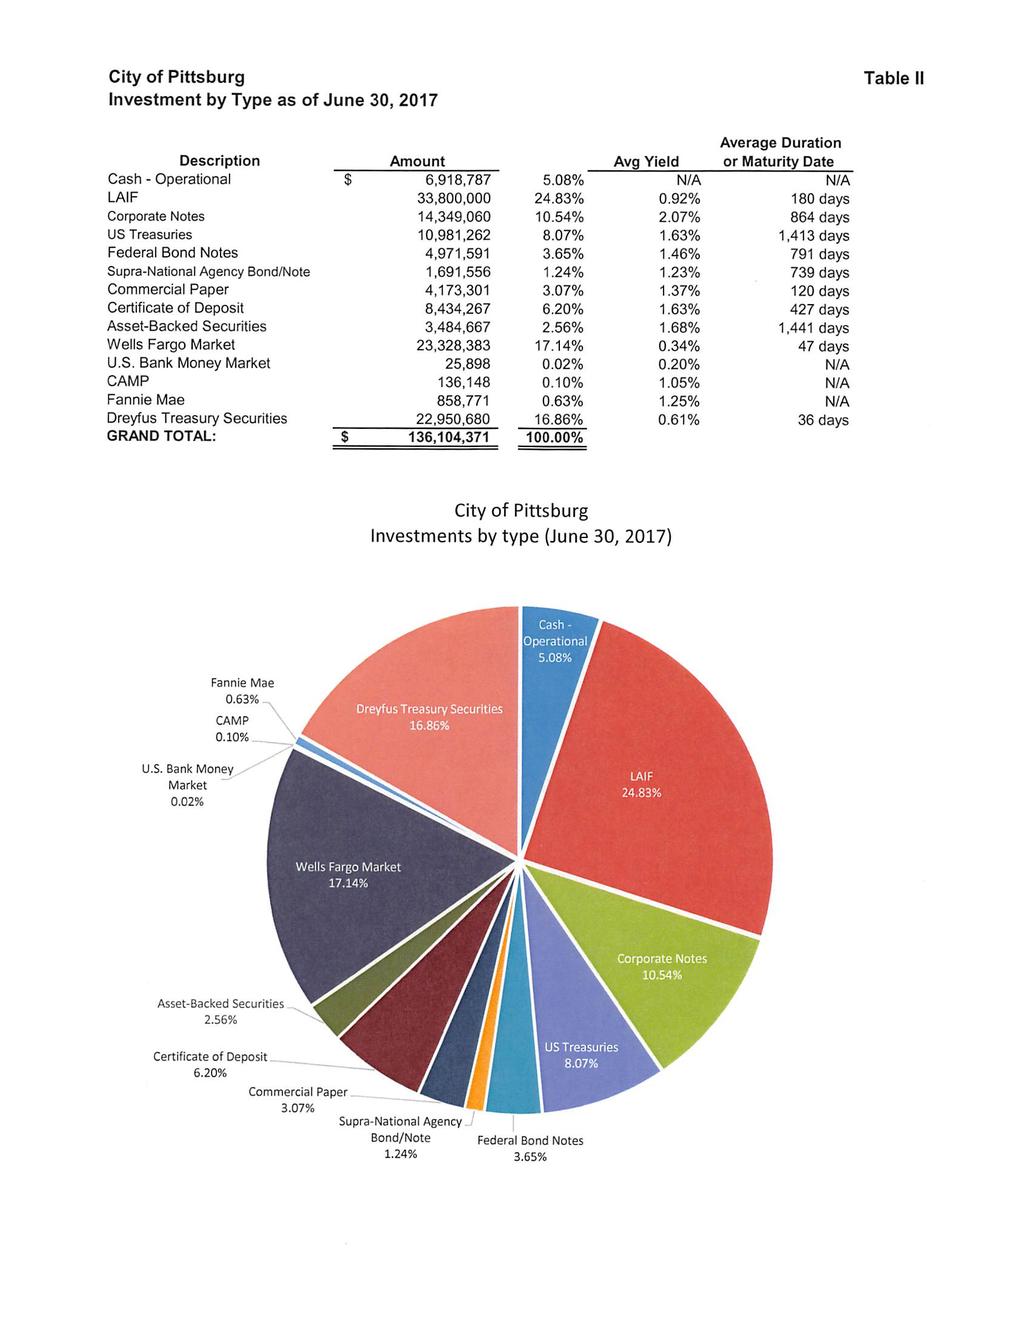
15 Sector Allocation and Compliance Security Type Original Cost Market Value % of Portfolio In Compliance Average Maturity 1 Average Yield 1 Cash Equivalents $6,918,787 $6,918, % % Money Market Funds $18,793 $18,793 <0.1% % Investment Pools $33,800,000 $33,764, % % Total Liquidity $40,737,580 $40,701, % % 2 U.S. Treasury Notes $10,981,062 $10,927, % 1, % 3 Federal Agency Securities $4,971,392 $4,956, % % Supranational Securities $1,691,556 $1,686, % % Negotiable Certificates of Deposit $8,434,267 $8,449, % % Medium-Term Corporate Notes $14,349,060 $14,141, % % Asset-Backed Securities $3,484,667 $3,482, % 1, % Commercial Paper $4,173,301 $4,186, % % Total Securities $48,085,305 $47,830, % % Total Portfolio $88,822,885 $88,532, % % Bonded Debt Portfolio $47,281,087 $47,300, % Total $136,103,972 $135,833, % 1. Averages shown are weighted averages calculated based on original cost. Average maturity is shown as days. 2. Due to different disposal values applied by Wells Fargo and PFM, original cost value of U.S. Treasury bond with CUSIP Q78 differs by $ Due to different disposal values applied by Wells Fargo and PFM, original cost value of Federal Agency bond with CUSIP 3135G0N82 differs by $ PFM Asset Management LLC 9
16 Sector Allocation and Compliance Per Issuer Issuer Original Cost Market Value % of Portfolio % Permitted by Policy In Compliance Average Maturity 1 Average Yield 1 Cash Equivalents 6,918,787 6,918, % % Bank 6,918,787 6,918, % 100% % Money Market Funds 18,793 18,793 <0.1% % Wells Fargo 18,793 18,793 <0.1% 10% % Investment Pools 33,800,000 33,764, % % Local Agency Investment Fund 33,800,000 33,764, % $65 million % U.S. Treasury Notes 10,981,062 10,927, % % U.S. Treasury 2 10,981,062 10,927, % 100% % Federal Agency Securities 4,971,392 4,956, % % FHLB 329, , % 100% % FHLMC 951, , % 100% % 3 FNMA 3,689,678 3,677, % 100% % Commercial Paper 4,173,301 4,186, % % Bank of Tokyo Mitsubishi CP 1,087,506 1,090, % 5% % BNP Paribas 939, , % 5% % Credit Agricole SA 1,391,416 1,398, % 5% % Rabobank 754, , % 5% % Negotiable Certificates of Deposit 8,434,267 8,449, % % Bank of Nova Scotia (Houston) 1,150,000 1,149, % 5% % Bank of Montreal Chicago 945, , % 5% % Canadian Imperial Bank 939, , % 5% % HSBC USA 1,150,000 1,152, % 5% % Nordea Bank 940, , % 5% % Norinchukin Bank NY 715, , % 5% % Royal Bank of Canada (New York) 695, , % 5% % Skandinaviska Enskilda NY 1,150,000 1,149, % 5% % Svenska Handelsbanken 750, , % 5% % 1. Averages shown are weighted averages calculated based on original cost. Average maturity is shown as days. Per issuer limit. 2. Due to different disposal values applied by Wells Fargo and PFM, original cost value of U.S. Treasury bond with CUSIP Q78 differs by $ Due to different disposal values applied by Wells Fargo and PFM, original cost value of Federal Agency bond with CUSIP 3135G0N82 differs by $ PFM Asset Management LLC 10
17 Sector Allocation and Compliance Per Issuer Issuer Original Cost Market Value % of Portfolio % Permitted by Policy In Compliance Average Maturity 1 Average Yield 1 Medium-Term Corporate Notes 14,349,060 14,141, % % American Express Company 429, , % 5% % American Honda Finance 299, , % 5% % Apple Inc. 1,566,302 1,574, % 5% % BB&T Bank 715, , % 5% % Bank of New York 1,000,460 1,006, % 5% % Berkshire Hathaway 294, , % 5% % John Deere 979, , % 5% % Walt Disney Corporation 149, , % 5% % General Electric 922, , % 5% % Home Depot 234, , % 5% % IBM 1,919,346 1,676, % 5% % JP Morgan Chase 1,986,282 2,001, % 5% % Pepsi Co. 354, , % 5% % State Street 463, , % 5% % Toyota 1,560,577 1,570, % 5% % Wells Fargo 1,471,910 1,456, % 5% % Asset-Backed Securities 3,484,667 3,482, % % Ally Auto 689, , % 5% % American Express Company Credit 539, , % 5% % CNH Equipment Trust 604, , % 5% % Ford Motor Credit 314, , % 5% % Honda Auto Receivables 469, , % 5% % Hyundai Auto Receivables 684, , % 5% % John Deere Owner Trust 179, , % 5% % Supranational Securities 1,691,556 1,686, % % Inter-American Development Bank 648, , % 100% % International Bank of Reconstruction and Develo 1,043,506 1,043, % 100% % Total 88,822,885 88,532, % 1. Averages shown are weighted averages calculated based on original cost. Average maturity is shown as days. Per issuer limit. PFM Asset Management LLC 11
18 Portfolio Review Portfolio Recap Short-term and long-term Treasury yields diverged during the second quarter as short-term (three years and under) yields moved higher, pricing in the Fed s June rate hike, while yields on longer-term maturities fell amid muted inflation and fading prospects for stimulative fiscal policy. As a result, the yield curve flattened, retracing all the steepening that took place following the U.S. presidential election. Our duration strategy is to remain relatively in line with the benchmark s duration unless we have a strong conviction that rates are not appropriately reflecting market risks and expectations. At quarter end, we aligned the portfolio duration with the benchmark duration since market conditions were consistent with moderate growth and the Fed is on track to gradually raise rates. Federal agency yield spreads narrowed further amid minimal new issuance, ending the quarter at historically tight levels. We maintained corporate allocations as the sector s additional income remained advantageous, and the sector benefited from further spread tightening. We participated in new AAA-rated asset-backed security (ABS) issues as ABS provide both enhanced diversification and incremental yield. In the money market space, short-term Treasury yields rose, repricing to reflect the Fed s ¼ percent June rate hike. The yield spread offered by commercial paper (CP) and certificates of deposit (CDs) tightened as the effects of money market reform and conviction about further Fed rate hikes faded. PFM Asset Management LLC 12
19 Portfolio Performance Portfolio Performance (Total Return) Annualized Return Portfolio/Benchmark Effective Duration Current Quarter 1 Year 3 Year 5 Year 10 Year Since Inception (09/30/10) * CITY OF PITTSBURG % 0.38% 1.32% 1.07% % BofA ML 0-5 Year U.S. Treasury Index % -0.30% 0.93% 0.75% % Difference 0.16% 0.68% 0.39% 0.32% % 1.4% 1.32% 1.2% 1.07% 1.16% 1.0% 0.93% 0.92% 0.8% 0.75% Total Return 0.6% 0.4% 0.2% 0.50% 0.34% 0.38% 0.0% -0.2% -0.4% -0.30% Current Quarter 1 Year 3 Year 5 Year 10 Year Since Inception CITY OF PITTSBURG BofA ML 0-5 Year U.S. Treasury Index Portfolio performance is gross of fees unless otherwise indicated. *Since Inception performance is not shown for periods less than one year. PFM Asset Management LLC 13
20 Portfolio Performance Fiscal Year Performance Dollar Return 1 FY17 FY16 FY15 Realized Gain/Loss $13,408 $115,832 $14,042 Net Interest Income $665,516 $597,660 $444,262 Realized Dollar Income $678,924 $713,492 $458,304 Income Return 1.43% 1.52% 1.09% Unrealized Gain/Loss $(497,090) $308,971 $153,225 Price Return -1.05% 0.66% 0.31% Total Dollar Return $181,834 $1,022,463 $611,529 Total Return 2,3,4 City of Pittsburg 0.38% 2.18% 1.41% BofA ML 0-5 Year U.S. Treasury Index -0.30% 1.98% 1.12% Difference 0.68% 0.20% 0.29% As of June 30, Income calculated on an amortized cost basis. 2. Performance on trade-date basis, gross (i.e., before fees), in accordance with the CFA Institute s Global Investment Performance Standards (GIPS). 3. Bank of America Merrill Lynch Indices provided by Bloomberg Financial Markets. 4. Excludes collateralized certificates of deposit, cash, and pool balances from performance, earnings, and duration computations. PFM Asset Management LLC 14
21 Portfolio Performance Portfolio Earnings Quarter-Ended June 30, 2017 Market Value Basis Accrual (Amortized Cost) Basis Beginning Value (03/30/2017) $47,615, $47,647, Net Purchases/Sales $193, $193, Change in Value $21, ($23,035.38) Ending Value (06/30/2017) $47,830, $47,817, Interest Earned $215, $215, Portfolio Earnings $237, $192, PFM Asset Management LLC 15
22 Portfolio Snapshot Credit Quality (S&P Ratings) Sector Allocation Par Value: Portfolio Statistics As of June 30, 2017 $47,640,000 Not Rated* 2.2% AAA 8.6% A 8.7% A- 6.6% A+ 14.0% U.S. Treasury 22.8% Supra-Sov / Supra-Natl Agency 3.5% Asset-Backed 7.3% Certificate of Deposit 17.7% Total Market Value: Security Market Value: Accrued Interest: Cash: Amortized Cost: Yield at Market: $48,079,744 $47,830,918 $230,034 $18,792 $47,817, % AA+ 36.5% A % AA 0.6% AA- 12.6% Federal Agency/GSE 10.4% Commercial Paper 8.8% Corporate 29.5% Yield at Cost: Effective Duration: Duration to Worst: Average Maturity: 1.71% 2.15 Years 2.18 Years 2.39 Years 32% 28% 28.7% Maturity Distribution Average Credit: ** AA 24% 20% 16% 18.4% 15.8% 18.0% 19.0% 12% 8% 4% 0% 0-1 Year 1-2 Years 2-3 Years 3-4 Years 4-5 Years > 5 Years 0.0% *Asset-backed securities rated Aaa by Moody's. ** An average of each security s credit rating assigned a numeric value and adjusted for its relative weighting in the portfolio. PFM Asset Management LLC 16
23 Portfolio Composition Sector Allocation June 30, 2017 March 31, 2017 December 31, 2016 September 30, 2016 Sector MV ($MM) % of Total MV ($MM) % of Total MV ($MM) % of Total MV ($MM) % of Total Corporate % % % % U.S. Treasury % % % % Certificate of Deposit % % % % Federal Agency/GSE % % % % Commercial Paper % % % % Asset-Backed % % % % Supra-Sov / Supra-Natl Agency % % % % Total $ % $ % $ % $ % 100% Supra-Sov / Supra-Natl Agency Asset-Backed Commercial Paper Federal Agency/GSE Certificate of Deposit U.S. Treasury Corporate 90% 80% 70% 60% 50% 40% 30% 20% 10% 0% June 2017 March 2017 December 2016 September 2016 Detail may not add to total due to rounding. PFM Asset Management LLC 17
24 Portfolio Composition Maturity Distribution As of June 30, 2017 Portfolio/Benchmark Yield at Market Average Maturity 0-1 Years 1-2 Years 2-3 Years 3-4 Years 4-5 Years >5 Years CITY OF PITTSBURG 1.64% 2.39 yrs 18.4% 28.7% 15.8% 18.0% 19.0% 0.0% BofA ML 0-5 Year U.S. Treasury Index 1.47% 2.31 yrs 22.8% 24.3% 20.7% 16.7% 15.6% 0.0% 32% 28% 28.7% 24% 20% 16% 18.4% 22.8% 24.3% 15.8% 20.7% 18.0% 16.7% 19.0% 15.6% 12% 8% 4% 0% 0-1 Years 1-2 Years 2-3 Years 3-4 Years 4-5 Years > 5 Years 0.0% 0.0% CITY OF PITTSBURG BofA ML 0-5 Year U.S. Treasury Index PFM Asset Management LLC 18
25 Portfolio Composition Sector/Issuer Distribution As of June 30, 2017 Sector / Issuer Market Value ($) % of Sector % of Total Portfolio Asset-Backed ALLY AUTO RECEIVABLES TRUST 689, % 1.4% AMERICAN EXPRESS CREDIT ACCOUN 539, % 1.1% CNH EQUIPMENT TRUST 606, % 1.3% FORD CREDIT AUTO OWNER TRUST 314, % 0.7% HONDA AUTO RECEIVABLES 469, % 1.0% HYUNDAI AUTO RECEIVABLES 682, % 1.4% JOHN DEERE OWNER TRUST 179, % 0.4% Sector Total 3,482, % 7.3% Certificate of Deposit BANK OF MONTREAL 950, % 2.0% BANK OF NOVA SCOTIA 1,149, % 2.4% CANADIAN IMPERIAL BANK OF COMMERCE 943, % 2.0% HSBC HOLDINGS PLC 1,152, % 2.4% NORDEA BANK AB 943, % 2.0% ROYAL BANK OF CANADA 696, % 1.5% SKANDINAVISKA ENSKILDA BANKEN AB 1,149, % 2.4% SVENSKA HANDELSBANKEN AB 747, % 1.6% THE NORINCHUKIN BANK 715, % 1.5% PFM Asset Management LLC 19
26 Portfolio Composition Sector / Issuer Market Value ($) % of Sector % of Total Portfolio Sector Total 8,449, % 17.7% Commercial Paper BNP PARIBAS 939, % 2.0% CREDIT AGRICOLE SA 1,398, % 2.9% MITSUBISHI UFJ FINANCIAL GROUP INC 1,090, % 2.3% RABOBANK NEDERLAND 758, % 1.6% Sector Total 4,186, % 8.8% Corporate AMERICAN EXPRESS CO 432, % 0.9% AMERICAN HONDA FINANCE 300, % 0.6% APPLE INC 1,574, % 3.3% BB&T CORPORATION 720, % 1.5% BERKSHIRE HATHAWAY INC 294, % 0.6% DEERE & COMPANY 982, % 2.1% GENERAL ELECTRIC CO 921, % 1.9% HOME DEPOT INC 235, % 0.5% IBM CORP 1,676, % 3.5% JP MORGAN CHASE & CO 2,001, % 4.2% PEPSICO INC 354, % 0.7% STATE STREET CORPORATION 463, % 1.0% THE BANK OF NEW YORK MELLON CORPORATION 1,006, % 2.1% THE WALT DISNEY CORPORATION 150, % 0.3% TOYOTA MOTOR CORP 1,570, % 3.3% PFM Asset Management LLC 20
27 Portfolio Composition Sector / Issuer Market Value ($) % of Sector % of Total Portfolio WELLS FARGO & COMPANY 1,456, % 3.0% Sector Total 14,141, % 29.6% Federal Agency/GSE FANNIE MAE 3,677, % 7.7% FEDERAL HOME LOAN BANKS 329, % 0.7% FREDDIE MAC 949, % 2.0% Sector Total 4,956, % 10.4% Supra-Sov / Supra-Natl Agency INTER-AMERICAN DEVELOPMENT BANK 643, % 1.3% INTL BANK OF RECONSTRUCTION AND DEV 1,043, % 2.2% Sector Total 1,686, % 3.5% U.S. Treasury UNITED STATES TREASURY 10,927, % 22.8% Sector Total 10,927, % 22.8% 47,830,918 Portfolio Total 100.0% 100.0% PFM Asset Management LLC 21
28 Portfolio Review Outlook and Strategy Our outlook for the third quarter is for continued modest growth in the U.S. economy, but the future path of Fed tightening is less certain as recent economic data has been disappointing, fiscal policy initiatives have stalled, and inflation remains below the Fed s 2% target. With rates priced for the current level of uncertainty, we are once again positioning the portfolio s duration to match the benchmark duration. Agency yield spreads remain at or near historically tight levels as demand remains strong while supply is minimal. Corporate yield spreads are near the tightest levels since the post-recession of We will continue to evaluate opportunities in the ABS sector, purchasing those issues we believe are well structured, offer adequate yield spreads, and which have limited extension and headline risk from expected Fed balance sheet tapering. In the money market space, yield spreads on CP and CDs have narrowed significantly from the wide levels driven by money market reform in late We will continue to monitor incoming economic data, Fed policy, and sector relationships to identify market opportunities. This will include assessing the impact of any additional policies put forth by the Trump administration. PFM Asset Management LLC 22
29 Transactions & Account Holdings 23
30 Portfolio Activity Quarterly Portfolio Transactions Trade Date Settle Date Par ($) CUSIP Security Description Coupon Maturity Date Transact Amt ($) Yield at Market Realized G/L (BV) BUY 4/3/17 4/6/17 710, FAX1 BB&T CORP NOTES 2.75% 4/1/22 716, % 4/5/17 4/6/17 1,150, GUE6 BANK OF NOVA SCOTIA HOUSTON LT CD 1.91% 4/5/19 1,150, % 4/19/17 4/20/17 955, EAEF2 FHLMC AGENCY NOTES 1.37% 4/20/20 951, % 4/27/17 5/2/17 355, DR6 PEPSICO INC 1.55% 5/2/19 354, % 5/1/17 5/2/17 1,100, CAS0 BANK OF TOKYO MITSUBISHI UFJ COMM PAPER 0.00% 1/26/18 1,087, % 5/8/17 5/10/17 715, USD1 NORINCHUKIN BANK NY CERT DEPOS 1.40% 11/10/17 715, % 5/8/17 5/10/17 1,095, V72 US TREASURY N/B NOTES 1.87% 1/31/22 1,099, % 5/22/17 5/30/17 540, JHG8 AMXCA A 1.64% 12/15/21 539, % 5/24/17 6/5/17 235, BQ4 HOME DEPOT INC CORP NOTES 1.80% 6/5/20 234, % 6/8/17 6/13/17 455, AS2 STATE STREET CORP NOTES 2.55% 8/18/20 467, % 6/20/17 6/27/17 470, BAC8 HAROT A3 1.68% 8/16/21 469, % 6/26/17 6/28/17 535, U81 US TREASURY N/B NOTES 2.00% 12/31/21 546, % 6/26/17 6/28/17 950, CCP1 BNP PARIBAS NY BRANCH COMM PAPER 0.00% 3/23/18 939, % 6/26/17 6/28/17 860, D72 US TREASURY NOTES 2.00% 8/31/21 876, % Total BUY 10,125,000 10,149, INTEREST 4/2/17 4/2/17 2,000, G6W9 GENERAL ELEC CAP CORP GLOBAL NOTES 1.62% 4/2/18 16, /3/17 4/3/17 0 MONEY0002 MONEY MARKET FUND /15/17 4/15/17 120, PAC7 ALLYA A3 1.70% 6/15/ /15/17 4/15/17 570, HAC5 ALLYA A3 1.78% 8/15/ /15/17 4/15/17 315, EAD8 FORDO 2017-A A3 1.67% 6/15/ /15/17 4/15/17 135, UAD8 HYUNDAI ABS 2016-A A3 1.56% 9/15/ /15/17 4/15/17 1,560, GM7 IBM CORP CALLABLE BONDS 7.62% 10/15/18 59, PFM Asset Management LLC 24
31 Portfolio Activity Trade Date Settle Date Par ($) CUSIP Security Description Coupon Maturity Date Transact Amt ($) Yield at Market Realized G/L (BV) 4/15/17 4/15/17 95, XAC1 JDOT 2017-A A3 1.78% 4/15/ /15/17 4/15/17 305, PAD8 HART 2017-A A3 1.76% 8/15/ /15/17 4/15/17 605, WAB2 CNH EQUIPMENT TRUST POOL 1.64% 7/15/ /15/17 4/15/17 85, NAC2 JOHN DEERE ABS 2016-B A3 1.25% 6/15/ /15/17 4/15/17 245, EAC3 HYUNDAI AUTO RECEIVABLES TRUST 1.29% 4/15/ /30/17 4/30/17 850, Q78 US TREASURY NOTES 1.37% 4/30/21 5, /30/17 4/30/17 835, Q78 US TREASURY NOTES 1.37% 4/30/21 5, /30/17 4/30/17 500, T67 US TREASURY NOTES 1.25% 10/31/21 3, /30/17 4/30/17 1,110, Q78 US TREASURY NOTES 1.37% 4/30/21 7, /1/17 5/1/17 0 MONEY0002 MONEY MARKET FUND /6/17 5/6/17 1,560, AQ3 APPLE INC GLOBAL NOTES 2.10% 5/6/19 16, /13/17 5/13/17 650, DX7 INTER-AMERICAN DEVELOPMENT BANK 1.00% 5/13/19 3, /15/17 5/15/17 85, NAC2 JOHN DEERE ABS 2016-B A3 1.25% 6/15/ /15/17 5/15/17 245, EAC3 HYUNDAI AUTO RECEIVABLES TRUST 1.29% 4/15/ /15/17 5/15/17 305, PAD8 HART 2017-A A3 1.76% 8/15/ /15/17 5/15/17 120, PAC7 ALLYA A3 1.70% 6/15/ /15/17 5/15/17 570, HAC5 ALLYA A3 1.78% 8/15/ /15/17 5/15/17 95, XAC1 JDOT 2017-A A3 1.78% 4/15/ /15/17 5/15/17 315, EAD8 FORDO 2017-A A3 1.67% 6/15/ /15/17 5/15/17 135, UAD8 HYUNDAI ABS 2016-A A3 1.56% 9/15/ /15/17 5/15/17 605, WAB2 CNH EQUIPMENT TRUST POOL 1.64% 7/15/ /17/17 5/17/17 1,150, AR41 HSBC BANK USA NA FLOATING CERT DEPOS 1.76% 11/17/17 4, /27/17 5/27/17 665, G0YT4 FANNIE MAE GLOBAL NOTES 1.62% 11/27/18 5, /30/17 5/30/17 940, A5Z7 CANADIAN IMPERIAL BANK NY CD 1.76% 11/30/18 7, /30/17 5/30/17 940, LWA6 NORDEA BANK FINLAND NY CD 1.76% 11/30/18 8, /31/17 5/31/17 365, VF4 US TREASURY NOTES 1.37% 5/31/20 2, /1/17 6/1/17 0 MONEY0002 MONEY MARKET FUND /5/17 6/5/ A5Z7 CANADIAN IMPERIAL BANK NY CD 1.76% 11/30/ /7/17 6/7/17 1,440, BGR5 WELLS FARGO & COMPANY NOTES 2.55% 12/7/20 18, /15/17 6/15/17 95, XAC1 JDOT 2017-A A3 1.78% 4/15/ PFM Asset Management LLC 25
32 Portfolio Activity Trade Date Settle Date Par ($) CUSIP Security Description Coupon Maturity Date Transact Amt ($) Yield at Market Realized G/L (BV) 6/15/17 6/15/17 315, EAD8 FORDO 2017-A A3 1.67% 6/15/ /15/17 6/15/17 85, NAC2 JOHN DEERE ABS 2016-B A3 1.25% 6/15/ /15/17 6/15/17 245, EAC3 HYUNDAI AUTO RECEIVABLES TRUST 1.29% 4/15/ /15/17 6/15/17 305, PAD8 HART 2017-A A3 1.76% 8/15/ /15/17 6/15/17 570, HAC5 ALLYA A3 1.78% 8/15/ /15/17 6/15/17 540, JHG8 AMXCA A 1.64% 12/15/ /15/17 6/15/17 120, PAC7 ALLYA A3 1.70% 6/15/ /15/17 6/15/17 605, WAB2 CNH EQUIPMENT TRUST POOL 1.64% 7/15/ /15/17 6/15/17 135, UAD8 HYUNDAI ABS 2016-A A3 1.56% 9/15/ /30/17 6/30/17 1,065, VJ6 US TREASURY NOTES 1.87% 6/30/20 9, /30/17 6/30/17 535, U81 US TREASURY N/B NOTES 2.00% 12/31/21 5, Total INTEREST 24,130, , SELL 4/3/17 4/6/17 425, G0N82 FNMA NOTES 1.25% 8/17/21 414, % (9,913.83) 4/3/17 4/6/17 285, G0N82 FNMA NOTES 1.25% 8/17/21 277, % (6,119.92) 4/5/17 4/6/17 1,150, GAS7 BANK OF NOVA SCOTIA HOUSTON YCD 1.56% 11/6/17 1,158, % 1, /19/17 4/20/17 155, UQ1 US TREASURY NOTES 1.25% 2/29/20 154, % /19/17 4/20/17 800, VF4 US TREASURY NOTES 1.37% 5/31/20 803, % 3, /28/17 5/2/17 365, G6W9 GENERAL ELEC CAP CORP GLOBAL NOTES 1.62% 4/2/18 366, % /1/17 5/2/17 1,100, BUA9 BANK TOKYO-MIT UFJ NY COMM PAPER 0.00% 7/10/17 1,097, % /8/17 5/10/17 600, G0YT4 FANNIE MAE GLOBAL NOTES 1.62% 11/27/18 607, % 1, /8/17 5/10/17 370, A8BD4 FEDERAL HOME LOAN BANKS AGCY 0.87% 6/29/18 369, % (1,329.22) 5/8/17 5/10/17 715, G6W9 GENERAL ELEC CAP CORP GLOBAL NOTES 1.62% 4/2/18 717, % 1, /22/17 5/26/17 510, G0YT4 FANNIE MAE GLOBAL NOTES 1.62% 11/27/18 516, % 1, /24/17 6/1/17 235, VJ6 US TREASURY NOTES 1.87% 6/30/20 239, % /8/17 6/13/17 460, XM7 US TREASURY NOTES 1.62% 7/31/20 464, % (4,068.76) 6/20/17 6/27/17 470, AAXX1 FEDERAL HOME LOAN BANK AGENCY 1.37% 3/18/19 471, % (74.66) PFM Asset Management LLC 26
33 Portfolio Activity Trade Date Settle Date Par ($) CUSIP Security Description Coupon Maturity Date Transact Amt ($) Yield at Market Realized G/L (BV) 6/26/17 6/28/17 665, G0YT4 FANNIE MAE GLOBAL NOTES 1.62% 11/27/18 668, % 1, /26/17 6/28/17 1,100, BUA6 BNP PARIBAS NY BRANCH COMM PAPER 0.00% 7/10/17 1,099, % /26/17 6/28/17 535, AAE46 FHLB NOTES 1.25% 1/16/19 537, % (790.76) 6/27/17 6/28/17 5, VF4 US TREASURY NOTES 1.37% 5/31/20 4, % 5.30 Total SELL 9,945,000 9,970, , PFM Asset Management LLC 27
34 Managed Account Detail of Securities Held For the Month Ending June 30, 2017 CITY OF PITTSBURG GENERAL FUNDS Security Type/Description S&P Moody's Trade Settle Original YTM Accrued Amortized Market Dated Date/Coupon/Maturity CUSIP Par Rating Rating Date Date Cost at Cost Interest Cost Value U.S. Treasury Bond / Note US TREASURY NOTES DTD 05/31/ % 05/31/ VF4 360, AA+ Aaa 12/02/15 12/04/15 357, , , US TREASURY NOTES DTD 07/01/ % 06/30/ VJ6 1,065, AA+ Aaa 09/01/15 09/03/15 1,083, ,076, ,074, US TREASURY NOTES DTD 07/31/ % 07/31/ XM7 340, AA+ Aaa 03/30/16 03/31/16 345, , , , US TREASURY NOTES DTD 02/28/ % 02/28/ B90 1,000, AA+ Aaa 10/03/16 10/05/16 1,036, , ,030, ,011, US TREASURY NOTES DTD 05/02/ % 04/30/ Q78 835, AA+ Aaa 02/01/17 02/03/17 818, , , , US TREASURY NOTES DTD 05/02/ % 04/30/ Q78 850, AA+ Aaa 01/03/17 01/05/17 833, , , , US TREASURY NOTES DTD 05/02/ % 04/30/ Q78 1,110, AA+ Aaa 06/27/16 06/29/16 1,130, , ,126, ,095, US TREASURY N/B DTD 07/31/ % 07/31/ WY2 1,135, AA+ Aaa 11/22/16 11/23/16 1,159, , ,156, ,156, US TREASURY NOTES DTD 09/02/ % 08/31/ D72 860, AA+ Aaa 06/26/17 06/28/17 871, , , , US TREASURY NOTES DTD 09/02/ % 08/31/ D72 1,225, AA+ Aaa 12/01/16 12/05/16 1,229, , ,228, ,235, US TREASURY NOTES DTD 10/31/ % 10/31/ T67 500, AA+ Aaa 03/14/17 03/16/17 481, , , , US TREASURY N/B NOTES DTD 01/03/ % 12/31/ U81 535, AA+ Aaa 06/26/17 06/28/17 541, , , US TREASURY N/B NOTES DTD 01/31/ % 01/31/ V72 1,095, AA+ Aaa 05/08/17 05/10/17 1,093, , ,093, ,096, Security Type Sub-Total 10,910, ,981, , ,964, ,927,
35 Managed Account Detail of Securities Held For the Month Ending June 30, 2017 CITY OF PITTSBURG GENERAL FUNDS Security Type/Description S&P Moody's Trade Settle Original YTM Accrued Amortized Market Dated Date/Coupon/Maturity CUSIP Par Rating Rating Date Date Cost at Cost Interest Cost Value Supra-National Agency Bond / Note INTL BANK OF RECON AND DEV SN NOTES DTD 04/19/ % 07/19/ FE8 650, AAA Aaa 04/12/16 04/19/16 648, , , , INTER-AMERICAN DEVELOPMENT BANK DTD 04/12/ % 05/13/ DX7 650, AAA Aaa 04/05/16 04/12/16 648, , , INTL BK RECON & DEVELOP NOTES DTD 03/21/ % 04/21/ FZ1 395, AAA Aaa 03/14/17 03/21/17 394, , , , Security Type Sub-Total 1,695, ,691, , ,692, ,686, Federal Agency Bond / Note FANNIE MAE BENCHMARK NOTE DTD 01/13/ % 02/19/ G0ZA4 1,955, AA+ Aaa 08/01/14 08/04/14 1,972, , ,961, ,970, FNMA BENCHMARK NOTE DTD 02/23/ % 02/26/ G0J53 675, AA+ Aaa 02/19/16 02/23/16 673, , , , FEDERAL HOME LOAN BANK AGENCY DTD 03/10/ % 03/18/ AAXX1 330, AA+ Aaa 03/23/17 03/24/17 329, , , , FNMA BENCHMARK NOTE DTD 08/02/ % 08/02/ G0N33 325, AA+ Aaa 07/29/16 08/02/16 324, , , , FNMA NOTES DTD 02/28/ % 02/28/ G0T29 605, AA+ Aaa 02/24/17 02/28/17 604, , , , FHLMC AGENCY NOTES DTD 04/20/ % 04/20/ EAEF2 955, AA+ Aaa 04/19/17 04/20/17 951, , , , FNMA NOTES DTD 08/19/ % 08/17/ G0N82 115, AA+ Aaa 09/01/16 09/02/16 114, , , Security Type Sub-Total 4,960, ,971, , ,961, ,956, Corporate Note GENERAL ELEC CAP CORP GLOBAL NOTES DTD 04/02/ % 04/02/ G6W9 920, AA- A1 07/01/15 07/07/15 922, , , ,
36 Managed Account Detail of Securities Held For the Month Ending June 30, 2017 CITY OF PITTSBURG GENERAL FUNDS Security Type/Description S&P Moody's Trade Settle Original YTM Accrued Amortized Market Dated Date/Coupon/Maturity CUSIP Par Rating Rating Date Date Cost at Cost Interest Cost Value Corporate Note JOHN DEERE CAPITAL CORP NOTE DTD 09/11/ % 08/10/ ETA7 780, A A2 09/08/15 09/11/15 779, , , , IBM CORP CALLABLE BONDS DTD 10/15/ % 10/15/ GM7 1,560, A+ A1 08/01/14 08/06/14 1,919, , ,673, ,676, JOHN DEERE CAPITAL CORP NOTE DTD 01/08/ % 01/08/ ETE9 200, A A2 01/05/16 01/08/16 199, , , , BERKSHIRE HATHAWAY INC NOTES DTD 03/15/ % 03/15/ CG4 150, AA Aa2 03/08/16 03/15/16 149, , , PEPSICO INC DTD 05/02/ % 05/02/ DR6 355, A+ A1 04/27/17 05/02/17 354, , , APPLE INC GLOBAL NOTES DTD 05/06/ % 05/06/ AQ3 1,560, AA+ Aa1 08/01/14 08/06/14 1,566, , ,562, ,574, TOYOTA MOTOR CREDIT CORP NOTES DTD 07/18/ % 07/18/ TBP9 1,560, AA- Aa3 08/01/14 08/06/14 1,560, , ,560, ,570, BERKSHIRE HATHAWAY INC CORPORATE NOTES DTD 08/15/ % 08/15/ CK5 145, AA Aa2 08/08/16 08/15/16 144, , , JPMORGAN CHASE & CO (CALLABLE) DTD 01/23/ % 01/23/ HKA7 1,995, A- A3 10/15/15 10/20/15 1,986, , ,989, ,001, AMERICAN HONDA FINANCE DTD 02/16/ % 02/14/ WBM2 300, A+ A1 02/13/17 02/16/17 299, , , , AMERICAN EXPRESS CREDIT CORP NOTES DTD 03/03/ % 03/03/ M0EE5 430, A- A2 02/28/17 03/03/17 429, , , , WALT DISNEY COMPANY CORP NOTES DTD 03/06/ % 03/04/ PDP8 150, A+ A2 03/01/17 03/06/17 149, , , HOME DEPOT INC CORP NOTES DTD 06/05/ % 06/05/ BQ4 235, A A2 05/24/17 06/05/17 234, , , STATE STREET CORP NOTES DTD 08/18/ % 08/18/ AS2 455, A A1 06/08/17 06/13/17 463, , , ,
37 Managed Account Detail of Securities Held For the Month Ending June 30, 2017 CITY OF PITTSBURG GENERAL FUNDS Security Type/Description S&P Moody's Trade Settle Original YTM Accrued Amortized Market Dated Date/Coupon/Maturity CUSIP Par Rating Rating Date Date Cost at Cost Interest Cost Value Corporate Note WELLS FARGO & COMPANY NOTES DTD 12/07/ % 12/07/ BGR5 1,440, A A2 05/06/16 05/10/16 1,471, , ,464, ,456, BANK OF NY MELLON CORP NOTES DTD 02/07/ % 02/07/ RAA5 1,000, A A1 02/07/17 02/10/17 1,000, , ,000, ,006, BB&T CORP NOTES DTD 03/21/ % 04/01/ FAX1 710, A- A2 04/03/17 04/06/17 715, , , , Security Type Sub-Total 13,945, ,349, , ,093, ,141, Commercial Paper CREDIT AGRICOLE CIB NY COMM PAPER DTD 02/06/ % 08/07/ TV78 1,400, A-1 P-1 02/07/17 02/10/17 1,391, ,398, ,398, COOPERATIEVE RABOBANK UA COMM PAPER DTD 01/06/ % 09/05/ AW58 760, A-1 P-1 02/09/17 02/09/17 754, , , BANK OF TOKYO MITSUBISHI UFJ COMM PAPER DTD 05/01/ % 01/26/ CAS0 1,100, A-1 P-1 05/01/17 05/02/17 1,087, ,090, ,090, BNP PARIBAS NY BRANCH COMM PAPER DTD 06/26/ % 03/23/ CCP1 950, A-1 P-1 06/26/17 06/28/17 939, , , Security Type Sub-Total 4,210, ,173, ,186, ,186, Certificate of Deposit NORINCHUKIN BANK NY CERT DEPOS DTD 05/10/ % 11/10/ USD1 715, A-1 P-1 05/08/17 05/10/17 715, , , , SKANDINAVISKA ENSKILDA BANKEN NY CD DTD 11/17/ % 11/16/ FBG5 1,150, A+ Aa3 11/16/15 11/17/15 1,150, , ,150, ,149, HSBC BANK USA NA FLOATING CERT DEPOS DTD 11/18/ % 11/17/ AR41 1,150, AA- Aa2 11/17/15 11/18/15 1,150, , ,150, ,152,
38 Managed Account Detail of Securities Held For the Month Ending June 30, 2017 CITY OF PITTSBURG GENERAL FUNDS Security Type/Description S&P Moody's Trade Settle Original YTM Accrued Amortized Market Dated Date/Coupon/Maturity CUSIP Par Rating Rating Date Date Cost at Cost Interest Cost Value Certificate of Deposit ROYAL BANK OF CANADA NY CD DTD 03/15/ % 03/09/ NZZ2 695, AA- Aa3 03/11/16 03/15/16 695, , , , CANADIAN IMPERIAL BANK NY CD DTD 12/05/ % 11/30/ A5Z7 940, A+ Aa3 12/01/16 12/05/16 939, , , , NORDEA BANK FINLAND NY CD DTD 12/05/ % 11/30/ LWA6 940, AA- Aa3 12/01/16 12/05/16 940, , , , SVENSKA HANDELSBANKEN NY LT CD DTD 01/12/ % 01/10/ JHB8 750, AA- Aa2 01/10/17 01/12/17 750, , , , BANK OF MONTREAL CHICAGO CERT DEPOS DTD 02/09/ % 02/07/ KRC3 945, A+ Aa3 02/08/17 02/09/17 945, , , , BANK OF NOVA SCOTIA HOUSTON LT CD DTD 04/06/ % 04/05/ GUE6 1,150, A+ A1 04/05/17 04/06/17 1,150, , ,150, ,149, Security Type Sub-Total 8,435, ,434, , ,434, ,449, Asset-Backed Security / Collateralized Mortgage Obligation JOHN DEERE ABS 2016-B A3 DTD 07/27/ % 06/15/ NAC2 85, NR Aaa 07/19/16 07/27/16 84, , , CNH EQUIPMENT TRUST POOL DTD 03/22/ % 07/15/ WAB2 605, AAA Aaa 03/15/17 03/22/17 604, , , HYUNDAI ABS 2016-A A3 DTD 03/30/ % 09/15/ UAD8 135, AAA Aaa 03/22/16 03/30/16 134, , , JDOT 2017-A A3 DTD 03/02/ % 04/15/ XAC1 95, NR Aaa 02/22/17 03/02/17 94, , , HYUNDAI AUTO RECEIVABLES TRUST DTD 09/21/ % 04/15/ EAC3 245, AAA Aaa 09/14/16 09/21/16 244, , , ALLYA A3 DTD 01/31/ % 06/15/ PAC7 120, AAA Aaa 01/24/17 01/31/17 119, , , FORDO 2017-A A3 DTD 01/25/ % 06/15/ EAD8 315, NR Aaa 01/18/17 01/25/17 314, , ,
39 Managed Account Detail of Securities Held For the Month Ending June 30, 2017 CITY OF PITTSBURG GENERAL FUNDS Security Type/Description S&P Moody's Trade Settle Original YTM Accrued Amortized Market Dated Date/Coupon/Maturity CUSIP Par Rating Rating Date Date Cost at Cost Interest Cost Value Asset-Backed Security / Collateralized Mortgage Obligation HART 2017-A A3 DTD 03/29/ % 08/15/ PAD8 305, AAA NR 03/22/17 03/29/17 304, , , ALLYA A3 DTD 03/29/ % 08/15/ HAC5 570, NR Aaa 03/21/17 03/29/17 569, , , HAROT A3 DTD 06/27/ % 08/16/ BAC8 470, AAA Aaa 06/20/17 06/27/17 469, , , AMXCA A DTD 05/30/ % 12/15/ JHG8 540, AAA NR 05/22/17 05/30/17 539, , , Security Type Sub-Total 3,485, ,484, , ,484, ,482, Managed Account Sub-Total 47,640, ,085, , ,817, ,830, Securities Sub-Total Accrued Interest Total Investments $47,640, $48,085, % $230, $47,817, $47,830, $230, $48,060,
40 Portfolio Activity IMPORTANT DISCLOSURES This material is based on information obtained from sources generally believed to be reliable and available to the public; however, PFM Asset Management LLC cannot guarantee its accuracy, completeness or suitability. This material is for general information purposes only and is not intended to provide specific advice or a specific recommendation. All statements as to what will or may happen under certain circumstances are based on assumptions, some, but not all of which, are noted in the presentation. Assumptions may or may not be proven correct as actual events occur, and results may depend on events outside of your or our control. Changes in assumptions may have a material effect on results. Past performance does not necessarily reflect and is not a guaranty of future results.the information contained in this presentation is not an offer to purchase or sell any securities. Dime à Market values that include accrued interest are derived from closing bid prices as of the last business day of the month as supplied by Interactive Data, Bloomberg, or Telerate. Where prices are not available from generally recognized sources, the securities are priced using a yield based matrix system to arrive at an estimated market value. à In accordance with generally accepted accounting principles, information is presented on a trade date basis; forward settling purchases are included in the monthly balances, and forward settling sales are excluded. à Performance is presented in accordance with the CFA Institute s Global Investment Performance Standards (GIPS). Unless otherwise noted, performance is shown gross of fees. Quarterly returns are presented on an unannualized basis. Returns for periods greater than one year are presented on an annualized basis.past performance is not indicative of future returns. à Bank of America/Merrill Lynch Indices provided by Bloomberg Financial Markets. à Money market fund/cash balances are included in performance and duration computations. à Standard & Poorʼs is the source of the credit ratings. Distribution of credit rating is exclusive of money market fund/lgip holdings. à Callable securities in the portfolio are included in the maturity distribution analysis to their stated maturity date, although, they may be called prior to maturity. à MBS maturities are represented by expected average life. PFM Asset Management LLC 34
41 Appendix GLOSSARY Ã ACCRUED INTEREST: Interest that is due on a bond or other fixed income security since the last interest payment was made. Ã AGENCIES: Federal agency securities and/or Government-sponsored enterprises. Ã AMORTIZED COST: The original cost of the principal of the security is adjusted for the amount of the periodic reduction of any discount or premium from the purchase date until the date of the report. Discount or premium with respect to short-term securities (those with less than one year to maturity at time of issuance) is amortized on a straight line basis. Such discount or premium with respect to longer-term securities is amortized using the constant yield basis. Ã BANKERS ACCEPTANCE: A draft or bill or exchange accepted by a bank or trust company. The accepting institution guarantees payment of the bill as well as the insurer. Ã COMMERCIAL PAPER: An unsecured obligation issued by a corporation or bank to finance its short-term credit needs, such as accounts receivable and inventory. Ã CONTRIBUTION TO DURATION: Represents each sector or maturity range s relative contribution to the overall duration of the portfolio measured as a percentage weighting. Since duration is a key measure of interest rate sensitivity, the contribution to duration measures the relative amount or contribution of that sector or maturity range to the total rate sensitivity of the portfolio. Ã DURATION TO WORST: A measure of the sensitivity of a security s price to a change in interest rates, stated in years, computed from cash flows to the maturity date or to the put date, whichever results in the highest yield to the investor. Ã EFFECTIVE DURATION: A measure of the sensitivity of a security s price to a change in interest rates, stated in years. Ã EFFECTIVE YIELD: The total yield an investor receives in relation to the nominal yield or coupon of a bond. Effective yield takes into account the power of compounding on investment returns, while ominal yield does not. Ã FDIC: Federal Deposit Insurance Corporation. A federal agency that insures bank deposits to a specified amount. Ã INTEREST RATE: Interest per year divided by principal amount and expressed as a percentage. Ã MARKET VALUE: The value that would be received or paid for an investment in an orderly transaction between market participants at the measurement date. Ã MATURITY: The date upon which the principal or stated value of an investment becomes due and payable. Ã NEGOTIABLE CERTIFICATES OF DEPOSIT: A CD with a very large denomination, usually $1 million or more, that can be traded in secondary markets. Ã PAR VALUE: The nominal dollar face amount of a security. PFM Asset Management LLC 35
42 CITY OF PITTSBURG Appendix GLOSSARY Ã PASS THROUGH SECURITY: A security representing pooled debt obligations that passes income from debtors to its shareholders. The most common type is the mortgage-backed security. Ã REPURCHASE AGREEMENTS: A holder of securities sells these securities to an investor with an agreement to repurchase them at a fixed price on a fixed date. Ã SETTLE DATE: The date on which the transaction is settled and monies/securities are exchanged. If the settle date of the transaction (i.e., coupon payments and maturity proceeds) occurs on a non-business day, the funds are exchanged on the next business day. Ã TRADE DATE: The date on which the transaction occurred; however, the final consummation of the security transaction and payment has not yet taken place. Ã UNSETTLED TRADE: A trade which has been executed; however, the final consummation of the security transaction and payment has not yet taken place. Ã U.S. TREASURY: The department of the U.S. government that issues Treasury securities. Ã YIELD: The rate of return based on the current market value, the annual interest receipts, maturity value, and the time period remaining until maturity, stated as a percentage on an annualized basis. Ã YTM AT COST: The yield to maturity at cost is the expected rate of return based on the original cost, the annual interest receipts, maturity value, and the time period from purchase date to maturity, stated as a percentage on an annualized basis. Ã YTM AT MARKET: The yield to maturity at market is the rate of return, based on the current market value, the annual interest receipts, maturity value and the time period remaining until maturity, stated as a percentage, on an annualized basis. PFM Asset Management LLC 36
Investment Performance Review For the Quarter Ended September 30, 2017
 Investment Performance Review Client Management Team Monique Spyke, Managing Director Izac Chyou, Senior Managing Consultant 50 California Street, Suite 2300 San Francisco, CA 94111 415-982-5544 PFM Asset
Investment Performance Review For the Quarter Ended June 30, 2017
 Investment Performance Review Investment Advisors Steven Alexander, CTP, CGFO, CPPT, Managing Director Robert Cheddar, CFA, Chief Credit Officer, Managing Director Richard Pengelly, CFA, CTP, Director
AGENDA REPORT SUMMARY. Sharif Etman, Administrative Services Director
 CONSENT CALENDAR Agenda Item # Meeting Date: September 26, 2017 AGENDA REPORT SUMMARY Subject: Quarterly Investment Portfolio Report Quarter Ended June, 2017 Prepared by: Approved by: Sharif Etman, Administrative
Town of Palm Beach, Florida
 Town of Palm Beach, Florida Investment Performance Review Investment Advisors Steven Alexander, CTP, CGFO, CPPT, Managing Director Robert Cheddar, CFA, Chief Credit Officer, Managing Director D. Scott
City of Winter Springs, Florida
 City of Winter Springs, Florida Investment Performance Review Quarter Ended December 31, 2016 Investment Advisors Steven Alexander, CTP, CGFO, CPPT, Managing Director Robert Cheddar, CFA, Chief Credit
City of Winter Springs, Florida
 City of Winter Springs, Florida Investment Performance Review Investment Advisors Steven Alexander, CTP, CGFO, CPPT, Managing Director Robert Cheddar, CFA, Chief Credit Officer, Managing Director Richard
Office of the City Manager 65 Civic Avenue Pittsburg, California Receive and File the Treasurer s Report for the Quarter Ending March 31, 2018
 Office of the City Manager 65 Civic Avenue Pittsburg, California 94565 DATE: May 21, 2018 TO: FROM: SUBJECT: Mayor and Council Members Joe Sbranti, City Manager Receive and File the Treasurer s Report
Investment Portfolio Compliance Report September 30, County of Monterey. Investment Portfolio Compliance Report. September 30, 2017
 County of Monterey Investment Portfolio Compliance Report September 30, 2017 County of Monterey Investment Portfolio Compliance Report September 30, 2017 Sarah Meacham Managing Director PFM Asset Management
City of Salem Quarterly Investment Report
 Quarterly Investment Report Quarter Ended June 30, 2017 Lauren Brant, Managing Director Allison Kaune, Senior Managing Consultant Meghna Purkayastha, Analyst PFM Asset Management LLC 650 NE Holladay St.
School District of Lake County
 School District of Lake County Investment Performance Review Quarter Ended September 30, 2016 Investment Advisors Steven Alexander, CTP, CGFO, CPPT, Managing Director James Sims, CFA, Senior Portfolio
Palm Beach County School District
 Palm Beach County School District Investment Performance Review Quarter Ended December 31, 2016 Investment Advisors Steven Alexander, CTP, CGFO, CPPT, Managing Director James Sims, CFA, Senior Portfolio
City of Winter Springs, Florida
 City of Winter Springs, Florida Investment Performance Review Investment Advisors Steven Alexander, CTP, CGFO, CPPT, Managing Director Robert Cheddar, CFA, Chief Credit Officer, Managing Director D. Scott
City of Winter Springs, Florida
 City of Winter Springs, Florida Investment Performance Review Investment Advisors Steven Alexander, CTP, CGFO, CPPT, Managing Director Robert Cheddar, CFA, Chief Credit Officer, Managing Director Richard
City of Winter Springs, Florida
 City of Winter Springs, Florida Investment Performance Review Quarter Ended March 31, 2016 Investment Advisors Steven Alexander, CTP, CGFO, CPPT, Managing Director Robert Cheddar, CFA, Chief Credit Officer,
Town of Palm Beach, Florida
 Town of Palm Beach, Florida Investment Performance Review Investment Advisors Steven Alexander, CTP, CGFO, CPPT, Managing Director Robert Cheddar, CFA, Chief Credit Officer, Managing Director D. Scott
Palm Beach County School District
 Palm Beach County School District Investment Performance Review Quarter Ended June 30, 2016 Investment Advisors Steven Alexander, CTP, CGFO, CPPT, Managing Director Robert Cheddar, CFA, Chief Credit Officer,
Town of Palm Beach, Florida
 Town of Palm Beach, Florida Investment Performance Review Investment Advisors Steven Alexander, CTP, CGFO, CPPT, Managing Director Robert Cheddar, CFA, Chief Credit Officer, Managing Director D. Scott
City of Winter Springs, Florida
 City of Winter Springs, Florida Investment Performance Review Investment Advisors Steven Alexander, CTP, CGFO, CPPT, Managing Director Robert Cheddar, CFA, Chief Credit Officer, Managing Director Richard
Investment Performance Review For the Quarter Ended March 31, 2017
 Investment Performance Review Investment Advisors Steven Alexander, CTP, CGFO, CPPT, Managing Director Robert Cheddar, CFA, Chief Credit Officer, Managing Director D. Scott Stitcher, CFA, Director Richard
Town of Palm Beach, Florida
 Town of Palm Beach, Florida Investment Performance Review Quarter Ended September 30, 2016 Investment Advisors Steven Alexander, CTP, CGFO, CPPT, Managing Director Robert Cheddar, CFA, Chief Credit Officer,
Investment Performance Review For the Quarter Ended March 31, 2017
 Investment Performance Review Investment Advisors Steven Alexander, CTP, CGFO, CPPT, Managing Director Robert Cheddar, CFA, Chief Credit Officer, Managing Director D. Scott Stitcher, CFA, Director Richard
City of Rowlett, Texas
 City of Rowlett, Texas Investment Performance Review Quarter Ended December 31, 2016 Investment Advisors Steven Alexander, CTP, CGFO, CPPT, Managing Director Robert Cheddar, CFA, Chief Credit Officer,
Investment Performance Review For the Quarter Ended December 31, 2017
 Investment Performance Review Investment Advisors Steven Alexander, CTP, CGFO, CPPT, Managing Director Robert Cheddar, CFA, Chief Credit Officer, Managing Director D. Scott Stitcher, CFA, Director Sean
City of Rowlett, Texas
 City of Rowlett, Texas Investment Performance Review Quarter Ended September 30, 2016 Investment Advisors Steven Alexander, CTP, CGFO, CPPT, Managing Director Robert Cheddar, CFA, Chief Credit Officer,
City of Fort Walton Beach, Florida
 City of Fort Walton Beach, Florida Investment Performance Review Investment Advisors Steven Alexander, CTP, CGFO, CPPT, Managing Director Robert Cheddar, CFA, Chief Credit Officer, Managing Director D.
County of Monterey. Investment Portfolio Compliance Report. February 28, PFM Asset Management LLC
 County of Monterey Investment Portfolio Compliance Report February 28, 2017 PFM Asset Management LLC 50 California Street, Suite 2300 San Francisco, CA 94111 (415) 982-5544 www.pfm.com PFM Asset Management
City of Winter Springs, Florida
 City of Winter Springs, Florida Investment Performance Review Investment Advisors Steven Alexander, CTP, CGFO, CPPT, Managing Director Robert Cheddar, CFA, Chief Credit Officer, Managing Director Richard
County of Monterey. Investment Portfolio Compliance Report. December 31, PFM Asset Management LLC
 County of Monterey Investment Portfolio Compliance Report December 31, 2016 PFM Asset Management LLC 50 California Street, Suite 2300 San Francisco, CA 94111 (415) 982-5544 www.pfm.com PFM Asset Management
CITY OF ST. LOUIS - QUARTERLY REPORT - COMBINED
 CITY OF ST. LOUIS - QUARTERLY REPORT - COMBINED Investment Performance Review Client Management Team Leslie Spencer, Senior Managing Consultant Kyle Jones, Director of Portfolio Strategies Danny A. Nelson,
Palm Beach County School District
 Palm Beach County School District Investment Performance Review Quarter Ended September 30, 2016 Investment Advisors Steven Alexander, CTP, CGFO, CPPT, Managing Director Robert Cheddar, CFA, Chief Credit
RECOMMENDATION By motion, approve the City s Quarterly Investment Report for the period ending September 30, 2017
 REPORT To the Honorable Mayor and City Council From the City Manager December 18, 2017 SUBJECT Quarterly Investment Report for Period Ending September 30, 2017 RECOMMENDATION By motion, approve the City
Investment Performance Review For the Quarter Ended September 30, 2017
 Investment Performance Review Investment Advisors Steven Alexander, CTP, CGFO, CPPT, Managing Director Robert Cheddar, CFA, Chief Credit Officer, Managing Director D. Scott Stitcher, CFA, Director Rebecca
Town of Palm Beach, Florida
 Town of Palm Beach, Florida Investment Performance Review Investment Advisors Steven Alexander, CTP, CGFO, CPPT, Managing Director Robert Cheddar, CFA, Chief Credit Officer, Managing Director D. Scott
City of Santa Rosa. Monthly Investment Report. August 31, PFM Aset Management LLC. 50 California Street Suite 2300 San Francisco, CA 94111
 City of Santa Rosa Monthly Investment Report August 31, 2017 PFM Aset Management LLC 50 California Street Suite 2300 San Francisco, CA 94111 Paulina Woo, Director 415-982-5544 pfm.com 0 City s Investment
Investment Portfolio Compliance Report July 31, County of Monterey. Investment Portfolio Compliance Report. July 31, 2017
 County of Monterey Investment Portfolio Compliance Report July 31, 2017 County of Monterey Investment Portfolio Compliance Report July 31, 2017 Sarah Meacham Managing Director 50 California Street Suite
City of Fort Walton Beach, Florida
 City of Fort Walton Beach, Florida Investment Performance Review Quarter Ended September 30, 2016 Investment Advisors Steven Alexander, CTP, CGFO, CPPT, Managing Director Robert Cheddar, CFA, Chief Credit
Investment Performance Review For the Quarter Ended June 30, 2018
 Investment Performance Review Investment Advisors Steven Alexander, CTP, CGFO, CPPT, Managing Director Robert Cheddar, CFA, Chief Credit Officer, Managing Director D. Scott Stitcher, CFA, Director Jason
Sandie Arnott TREASURER - TAX COLLECTOR
 Sandie Arnott TREASURER - TAX COLLECTOR TREASURER - TAX COLLECTOR - REVENUE SERVICES Charles M. Tovstein CHIEF INVESTMENT OFFICER Robin N. Elliott ASSISTANT TAX COLLECTOR DATE: May 9, 2018 TO: FROM: SUBJECT:
City of Fort Walton Beach, Florida
 City of Fort Walton Beach, Florida Investment Performance Review Investment Advisors Steven Alexander, CTP, CGFO, CPPT, Managing Director Robert Cheddar, CFA, Chief Credit Officer, Managing Director D.
City of San Juan Capistrano
 City of San Juan Capistrano Fourth Quarter 2013 Portfolio and Market Review Sarah Meacham, Director PFM Asset Management LLC Federal Reserve Taper Talk Drives Interest Rates The Federal Open Market Committee
Town of Palm Beach, Florida
 Town of Palm Beach, Florida Investment Performance Review Quarter Ended June 30, 2016 Investment Advisors Steven Alexander, CTP, CGFO, CPPT, Managing Director Robert Cheddar, CFA, Chief Credit Officer,
Investment Performance Review For the Quarter Ended September 30, 2018
 Investment Performance Review Investment Advisors Steven Alexander, CTP, CGFO, CPPT, Managing Director Robert Cheddar, CFA, Chief Credit Officer, Managing Director Richard Pengelly, CFA, CTP, Director
Brevard County School District
 Brevard County School District Investment Performance Review Quarter Ended December 31, 2015 Investment Advisors Steven Alexander, CTP, CGFO, CPPT, Managing Director Robert Cheddar, CFA, Chief Credit Officer,
Sandie Arnott TREASURER - TAX COLLECTOR
 Sandie Arnott TREASURER - TAX COLLECTOR TREASURER - TAX COLLECTOR - REVENUE SERVICES Charles M. Tovstein CHIEF INVESTMENT OFFICER Robin N. Elliott ASSISTANT TAX COLLECTOR DATE: January 10, 2018 TO: FROM:
City of Santa Rosa Monthly Investment Report
 City of Santa Rosa Monthly Investment Report February 28, 2018 PFM Aset Management LLC 50 California Street Suite 2300 San Francisco, CA 94111 Paulina Woo, Director 415-982-5544 pfm.com 0 City s Investment
San Mateo County. Investment Portfolio Compliance Report. October 31, 2018
 San Mateo County Investment Portfolio Compliance Report October 31, 2018 PFM Asset Management LLC 50 California Street, Suite 2300 San Francisco, CA 94111 415-982-5544 www.pfm.com Compliance Requirements
Sandie Arnott TREASURER - TAX COLLECTOR
 Sandie Arnott TREASURER - TAX COLLECTOR TREASURER - TAX COLLECTOR - REVENUE SERVICES Charles M. Tovstein CHIEF INVESTMENT OFFICER Robin N. Elliott ASSISTANT TAX COLLECTOR DATE: November 9, 2018 TO: FROM:
Investment Performance Review For the Quarter Ended September 30, 2017
 Investment Performance Review Client Management Team Monique Spyke, Managing Director Allison Kaune, Senior Managing Consultant Joseph Creason, Portfolio Manager Rachael Camacci, Client Consultant 50 California
BOARD OF SUPERVISORS Yolo County, California
 BOARD OF SUPERVISORS Yolo County, California To: Fin. Svcs. CONSENT CALENDAR Excerpt of Minute Order No. 17-126 Item No. 13, of the Board of Supervisors meeting of August 1, 2017. MOTION: Rexroad. SECOND:
Investment Performance Review For the Quarter Ended March 31, 2018
 Investment Performance Review Investment Advisors Steven Alexander, CTP, CGFO, CPPT, Managing Director Robert Cheddar, CFA, Chief Credit Officer, Managing Director D. Scott Stitcher, CFA, Director Jason
Brevard County School District
 Brevard County School District Investment Performance Review Quarter Ended June 30, 2015 Investment Advisors Steven Alexander, CTP, CGFO, CPPT, Managing Director Robert Cheddar, CFA, Chief Credit Officer,
Town of Palm Beach, Florida
 Town of Palm Beach, Florida Investment Performance Review Quarter Ended December 31, 2013 Investment Advisors Steven Alexander, CTP, CGFO, Managing Director D. Scott Stitcher, CFA, Senior Managing Consultant
City of Winter Springs, Florida
 City of Winter Springs, Florida Investment Performance Review Quarter Ended December 31, 2015 Investment Advisors Steven Alexander, CTP, CGFO, CPPT, Managing Director Robert Cheddar, CFA, Chief Credit
Investment Portfolio Compliance Report January 31, County of Monterey. Investment Portfolio Compliance Report.
 County of Monterey Investment Portfolio Compliance Report January 31, 2018 County of Monterey Investment Portfolio Compliance Report January 31, 2018 Sarah Meacham Managing Director PFM Asset Management
Investment Portfolio Compliance Report December 31, County of Monterey. Investment Portfolio Compliance Report.
 County of Monterey Investment Portfolio Compliance Report December 31, 2017 County of Monterey Investment Portfolio Compliance Report December 31, 2017 Sarah Meacham Managing Director PFM Asset Management
Palm Beach County School District
 Palm Beach County School District Investment Performance Review Quarter Ended March 31, 2008 Investment Advisors Steven Alexander, CTP, CGFO, Managing Director 300 S. Orange Avenue, Suite 1170 Orlando,
City of Santa Rosa Monthly Investment Report
 City of Santa Rosa Monthly Investment Report March 31, 2018 PFM Aset Management LLC 50 California Street Suite 2300 San Francisco, CA 94111 Paulina Woo, Director 415-982-5544 pfm.com 0 City s Investment
September 7, Board of Directors Ventura Regional Sanitation District Ventura, California INVESTMENT REPORT JUNE 30, 2017 RECOMMENDATION
 September 7, 2017 Board of Directors Ventura Regional Sanitation District Ventura, California INVESTMENT REPORT JUNE 30, 2017 RECOMMENDATION Receive and file the June 30, 2017 Investment Report. FISCAL
City of FT. Walton Beach, Florida
 City of FT. Walton Beach, Florida Investment Performance Review Investment Advisors Steven Alexander, CTP, CGFO, CPPT, Managing Director Robert Cheddar, CFA, Chief Credit Officer, Managing Director D.
CITY OF SEAL BEACH Preliminary Investment Report 1/31/2014
 CITY OF SEAL BEACH Preliminary Investment Report 1/31/2014 Investments: Book Value Market Value LAIF City 17,500,674.80 17,500,674.80 LAIF Successor Agency 115,689.54 115,689.54 CDs and Bonds 28,163,009.89
City of Winter Springs, Florida
 City of Winter Springs, Florida Investment Performance Review Quarter Ended June 30, 2015 Investment Advisors Steven Alexander, CTP, CGFO, CPPT, Managing Director Robert Cheddar, CFA, Chief Credit Officer,
Sandie Arnott TREASURER - TAX COLLECTOR
 Sandie Arnott TREASURER - TAX COLLECTOR TREASURER - TAX COLLECTOR - REVENUE SERVICES Charles M. Tovstein CHIEF INVESTMENT OFFICER Robin N. Elliott ASSISTANT TAX COLLECTOR DATE: January 10, 2019 TO: FROM:
HIGHLANDS RANCH METROPOLITAN DISTRICT BOARD MEETING ADDENDA
 HIGHLANDS RANCH METROPOLITAN DISTRICT BOARD MEETING ADDENDA November 28, 2017 Addendum documents can also be viewed at http://highlandsranch.org or http://intranet.highlandsranch.org/default.aspx Termination
Brevard County School District, Florida
 Brevard County School District, Florida Investment Performance Review Quarter Ended September 30, 2012 Investment Advisors Steven Alexander, CTP, CGFO, Managing Director D. Scott Stitcher, CFA, Senior
San Mateo County. Investment Portfolio Compliance Report. February 29, 2016
 San Mateo County Investment Portfolio Compliance Report February 29, 2016 PFM Asset Management LLC 50 California Street, Suite 2300 San Francisco, CA 94111 415-982-5544 www.pfm.com Compliance Requirements
City of Salem. Quarterly Investment Report. Quarter Ended December 31, Investment Report - Quarter Ended December 31, 2017
 Quarterly Investment Report Quarter Ended December 31, 2017 Lauren Brant, Managing Director Allison Kaune, Senior Managing Consultant Colin Donahue, Senior Analyst PFM Asset Management LLC 650 NE Holladay
San Mateo County. Investment Portfolio Compliance Report. January 31, 2016
 San Mateo County Investment Portfolio Compliance Report January 31, 2016 PFM Asset Management LLC 50 California Street, Suite 2300 San Francisco, CA 94111 415-982-5544 www.pfm.com Compliance Requirements
Presentation to the City of Los Angeles Investment Advisory Committee. August 31, 2013
 Presentation to the City of Los Angeles Investment Advisory Committee August 31, 2013 Economic Update-Overall Economy 8 U.S. GDP (Quarter over Quarter Annualized)* 6 4.9 4.9 Percent 4 2 0-2 -4 1.3 0.3
Presentation to the City of Los Angeles Treasurer on the City's General Pool Investments. March 31, 2017
 Presentation to the City of Los Angeles Treasurer on the City's General Pool Investments March 31, 2017 Economic Update: Overall Economy 8 U.S. GDP (Quarter over Quarter Annualized)* Percent 6 4 2 0-2
City of FT. Walton Beach, Florida
 City of FT. Walton Beach, Florida Investment Performance Review Investment Advisors Steven Alexander, CTP, CGFO, CPPT, Managing Director Robert Cheddar, CFA, Chief Credit Officer, Managing Director D.
Palm Beach County School District
 Palm Beach County School District Investment Performance Review Quarter Ended June 30, 2014 Investment Advisors Steven Alexander, CTP, CGFO, CPPT, Managing Director D. Scott Stitcher, CFA, Senior Managing
TABLE OF CONTENTS. Summary Portfolio Statistics Cash Flow Analysis Participant Cash Balances 06 Investment Fund Participants
 APR 2018 TABLE OF CONTENTS 03 04 05 Summary Portfolio Statistics Cash Flow Analysis Participant Cash Balances 06 Investment Fund Participants 07 07 08 Asset Allocation Asset Credit Quality Appendix 09
Presentation to the City of Los Angeles Investment Advisory Committee. September 30, 2013
 Presentation to the City of Los Angeles Investment Advisory Committee September 30, 2013 Economic Update-Overall Economy 8 U.S. GDP (Quarter over Quarter Annualized)* 6 4.9 4.9 Percent 4 2 0-2 -4 1.3 0.3
TABLE OF CONTENTS. Summary Portfolio Statistics Cash Flow Analysis Participant Cash Balances 06 Investment Fund Participants
 May 2018 TABLE OF CONTENTS 03 04 05 Summary Portfolio Statistics Cash Flow Analysis Participant Cash Balances 06 Investment Fund Participants 07 07 08 Asset Allocation Asset Credit Quality Appendix 09
BOARD OF SUPERVISORS Yolo County, California
 BOARD OF SUPERVISORS Yolo County, California To: Fin. Svcs. CONSENT CALENDAR Excerpt of Minute Order No. 17-172 Item No. 16, of the Board of Supervisors meeting of November 7, 2017. MOTION: Provenza. SECOND:
Presentation to the City of Los Angeles Treasurer on the City's General Pool Investments. April 30, 2015
 Presentation to the City of Los Angeles Treasurer on the City's General Pool Investments April 30, 2015 Economic Update-Overall Economy 8 U.S. GDP (Quarter over Quarter Annualized)* Percent 6 4 2 0-2 -4
Moving On Up Investing in Today s Rate Environment
 Moving On Up Investing in Today s Rate Environment Presented by PFM Asset Management LLC Steve Faber, Managing Director Gray Lepley, Senior Analyst, Portfolio Strategies September 18, 2018 PFM 1 Today
Presentation to the City of Los Angeles Treasurer on the City's General Pool Investments. August 31, 2016
 Presentation to the City of Los Angeles Treasurer on the City's General Pool Investments August 31, 2016 Economic Update: Overall Economy 8 U.S. GDP (Quarter over Quarter Annualized)* Percent 6 4 2 0-2
Palm Beach County School District
 Palm Beach County School District Investment Performance Review Quarter Ended March 31, 2009 Investment Advisors Steven Alexander, CTP, CGFO, Managing Director Mel Hamilton, Senior Managing Consultant
Presentation to the City of Los Angeles Investment Advisory Committee. December 31, 2014
 Presentation to the City of Los Angeles Investment Advisory Committee December 31, 2014 Economic Update-Overall Economy 8 U.S. GDP (Quarter over Quarter Annualized)* Percent 6 4 2 0-2 -4 0.2 3.1 2.7 1.4-2.7
COUNTY OF YOLO Pooled Portfolio Investment Summary For the Three Months Ended March 31, 2014
 ATTACHMENT A COUNTY OF YOLO Pooled Portfolio Investment Summary For the Three Months Ended March 31, 2014 March 31, 2014 February 28, 2014 January 31, 2014 GOVERNMENT INVESTMENT POOLS Local Agency Investment
TABLE OF CONTENTS. Summary Portfolio Statistics Cash Flow Analysis Participant Cash Balances 06 Investment Fund Participants
 NOV 2018 TABLE OF CONTENTS 03 04 05 Summary Portfolio Statistics Cash Flow Analysis Participant Cash Balances 06 Investment Fund Participants 07 07 08 Asset Allocation Asset Credit Quality Appendix 09
City of Santa Rosa Monthly Investment Report
 City of Santa Rosa Monthly Investment Report April 30, 2018 PFM Aset Management LLC 50 California Street Suite 2300 San Francisco, CA 94111 Paulina Woo, Director 415-982-5544 pfm.com 0 City s Investment
Polk County Public Schools
 Polk County Public Schools Investment Performance Review Quarter Ended June 30, 2013 Investment Advisors Steven Alexander, CTP, CGFO, Managing Director D. Scott Stitcher, CFA, Senior Managing Consultant
Presentation to the City of Los Angeles Treasurer on the City's General Pool Investments. April 30, 2017
 Presentation to the City of Los Angeles Treasurer on the City's General Pool Investments April 30, 2017 Economic Update: Overall Economy 8 U.S. GDP (Quarter over Quarter Annualized)* Percent 6 4 2 0-2
City of Santa Rosa Monthly Investment Report July 31, 2016
 City of Santa Rosa Monthly Investment Report July 31, 2016 City s Investment Objectives Investment Objectives: In accordance with the City s Investment Policy, the City s primary objectives in order of
Presentation to the City of Los Angeles Treasurer on the City's General Pool Investments. September 30, 2018
 Presentation to the City of Los Angeles Treasurer on the City's General Pool Investments September 30, 2018 Economic Update: Overall Economy 6 U.S. GDP (Quarter over Quarter Annualized)* 5 4.7 5.1 4.9
Presentation to the City of Los Angeles Treasurer on the City's General Pool Investments. July 31, 2015
 Presentation to the City of Los Angeles Treasurer on the City's General Pool Investments July 31, 2015 Economic Update-Overall Economy 8 U.S. GDP (Quarter over Quarter Annualized)* Percent 6 4 2 0-2 -4
San Mateo County. Investment Portfolio Compliance Report. January 31, 2014
 San Mateo County Investment Portfolio Compliance Report January 31, 2014 PFM Asset Management LLC 50 California Street, Suite 2300 San Francisco, CA 94111 415-982-5544 www.pfm.com Compliance Requirements
Moving On Up Today s Economic Environment
 Moving On Up Today s Economic Environment Presented by PFM Asset Management LLC Gray Lepley, Senior Analyst, Portfolio Strategies November 8, 2018 PFM 1 U.S. ECONOMY Today s Agenda MONETARY POLICY GEOPOLITICAL
City of Santa Rosa Monthly Investment Report June 30, 2016
 City of Santa Rosa Monthly Investment Report June 30, 2016 City s Investment Objectives Investment Objectives: In accordance with the City s Investment Policy, the City s primary objectives in order of
REGIONAL TRANSPORTATION COMMISSION OF WASHOE COUNTY (RTC) INVESTMENT COMMITTEE MEETING. Tuesday 2:00 p.m. October 23, 2018
 INVESTMENT COMMITTEE MEETING. Tuesday 2:00 p.m. October 23, 2018") REGIONAL TRANSPORTATION COMMISSION OF WASHOE COUNTY (RTC) INVESTMENT COMMITTEE MEETING Tuesday 2:00 p.m. October 23, 2018 PRESENT: Stephanie Haddock, CGFM, RTC Director of Finance/CFO Jelena Williams,
REGIONAL TRANSPORTATION COMMISSION OF WASHOE COUNTY (RTC) INVESTMENT COMMITTEE MEETING Tuesday 2:00 p.m. October 23, 2018 PRESENT: Stephanie Haddock, CGFM, RTC Director of Finance/CFO Jelena Williams,
Presentation to the City of Los Angeles Treasurer on the City's General Pool Investments. February 28, 2018
 Presentation to the City of Los Angeles Treasurer on the City's General Pool Investments February 28, 2018 Economic Update: Overall Economy 6 5 U.S. GDP (Quarter over Quarter Annualized)* 4.6 4.6 5.2 4
San Mateo County. Investment Portfolio Compliance Report. May 31, 2016
 San Mateo County Investment Portfolio Compliance Report May 31, 2016 PFM Asset Management LLC 50 California Street, Suite 2300 San Francisco, CA 94111 415-982-5544 www.pfm.com Compliance Requirements Overview
Polk County Public Schools
 Polk County Public Schools Investment Performance Review Quarter Ended September 30, 2013 Investment Advisors Steven Alexander, CTP, CGFO, Managing Director D. Scott Stitcher, CFA, Senior Managing Consultant
Presentation to the City of Los Angeles Investment Advisory Committee. August 31, 2014
 Presentation to the City of Los Angeles Investment Advisory Committee August 31, 2014 Economic Update-Overall Economy 8 U.S. GDP (Quarter over Quarter Annualized)* Percent 6 4 2 0-2 -4 3.2 0.2 3.1 2.7
Palm Beach County School District
 Palm Beach County School District Investment Performance Review Quarter Ended September 30, 2010 Investment Advisors Steven Alexander, CTP, CGFO, Managing Director Mel Hamilton, Senior Managing Consultant
Presentation to the City of Los Angeles Treasurer on the City's General Pool Investments. April 30, 2018
 Presentation to the City of Los Angeles Treasurer on the City's General Pool Investments April 30, 2018 Economic Update: Overall Economy 6 5 U.S. GDP (Quarter over Quarter Annualized)* 4.6 4.6 5.2 Percent
Presentation to the City of Los Angeles Treasurer on the City's General Pool Investments. August 31, 2018
 Presentation to the City of Los Angeles Treasurer on the City's General Pool Investments August 31, 2018 Q4 2010 Q1 2011 Q2 2011 Q3 2011 Q4 2011 Q1 2012 Q2 2012 Q3 2012 Q4 2012 Q1 2013 Q2 2013 Q3 2013
Presentation to the City of Los Angeles Treasurer on the City's General Pool Investments. January 31, 2018
 Presentation to the City of Los Angeles Treasurer on the City's General Pool Investments January 31, 2018 Economic Update: Overall Economy 6 5 U.S. GDP (Quarter over Quarter Annualized)* 4.6 4.6 5.2 4