WCM. Accumulate (opening coverage) Target: Euro 3.25
|
|
|
- Leslie Shepherd
- 6 years ago
- Views:
Transcription
 352 Number of shares (million) 122.0 Free Float 66.")
1 WCM Accumulate (opening coverage) Target: Euro May 2016 Price (Euro) weeks range 3.34 / 1.77 Key Data ISIN DE000A1X3X33 Reuters WCMKK.DE Bloomberg WCM GY Reporting standard IFRS Market Cap (Euro million) 352 Number of shares (million) Free Float 66.9% Free Float Market Cap (Euro million) 236 CAGR FFO after taxes ('15 -'18e) 56.0% Multiples e 2017e 2018e Market Cap/ Total revenues PE-Ratio Dividend Yield 0.0% 2.8% 3.5% 4.2% Price-to-Book-Ratio P/ NAV-ratio Key Data per share (Euro) e 2017e 2018e Earnings per share (EPS) Dividend per share (DPS) Book Value per Share (BVPS) EPRA NAV per share Financial Data (Euro '000) e 2017e 2018e Rental income 10,445 29,350 35,514 42,972 Net revaluation result 9,560 28,230 33,769 40,762 EBITDA profit 59,231 44,942 47,976 50,807 Adj. EBITDA profit (cash driven) 4,327 25,070 29,986 36,247 Operating profit (EBIT) 58,872 44,532 47,546 50,357 Net financial result -2,076-5,673-6,695-8,516 Pre-tax profit (EBT) 56,796 38,859 40,851 41,841 Taxation 879-2,845-3,505-3,635 Net profit after minorities 54,292 30,370 31,625 32,330 FFO (after tax) 7,932 21,218 25,525 30,124 Shareholders' equity (Euro million) Property portfolio (Euro million) ,004 1,255 RoE (after tax) 36.0% 10.8% 10.5% 10.1% Equity ratio (incl. equity minorities) 48.9% 37.4% 29.6% 26.1% Main Shareholders DIC Asset Gruppe 20.2% Karl P. Ehlerding 5.4% John F. Ehlerding 5.4% CEO Stavros Efremidis 1.9% Financial calendar 1Q 2016 report 27 May 2016 SRC Forum Financials & Real Estate 8 September Q 2016 report 23 September Q 2016 report 25 November 2016 Analysts Internet Dipl.-Vw. Ingmar Tripunovic, CREA Dipl.-Kfm. Stefan Scharff, CREA tripunovic@src-research.de scharff@src-research.de Portfolio outreaches Euro 500m threshold one year after the start and will grow quickly strong tenancy, low interest expenses and virtually no tax burden - Starting our coverage with Accumulate and 3.25 is a real estate investment firm focusing on commercial real estate. WCM s strategy is aiming at Core and Core Plus commercial assets, thus properties which by definition have a low risk profile due to long-term leases and a decent quality of the building with minimum capital expenditure requirements. WCM is very ambitious to accelerate the portfolio size from an initial portfolio worth Euro 81m to Euro 533m representing 50 properties as of May By keeping up this pace we are convinced that the management will reach its self-imposed target of doubling the portfolio size within the next 18 months. WCM has proven its capability of raising equity and securing external financing for future growth, is unencumbered by past loan agreements and therefore benefits from historically low interest rates (2.1% on average in 2015), is well-connected in the real estate industry and therefore capable of rapidly building up a substantial portfolio volume within a short period of time, is selfdisciplined in terms of adhering to its predetermined investment criteria and can benefit from significant future tax savings through enormous loss carry forwards. The year of 2015 was the first full fiscal year in the company s history as a real estate firm. However, since the portfolio has been successively been build up the annual results are not really a useful guidance for a future outlook. At the end of 2015, total revenues were at Euro 12.6m with rental income of Euro 9.6m and a high sustainable FFO of almost Euro 8m. The EBITDA was at Euro 4.3m resulting in a decent EBITDA-margin of 34%. Neglecting one-off operating expenses of about Euro 3.1m for transaction costs, real estate transfer tax and charged fees for the capital increase, the margin would have been even much higher at 59%. Due to the use of loss carry forwards deferred taxes positively impacted the earnings through activation of deferred taxes of c. Euro 0.9m for future tax savings. The tax loss carry forwards will help to keep the group s cash taxation at very low levels in the next years. In 2016, the annualized rental income of the past acquisitions will be entirely incorporated in the P&L. Assuming a further rising portfolio size of more than Euro 700m by end of this year, rental income might triple and the FFO might jump to Euro 21m. Low operating costs as well as a scalable platform will lead to an FFO over proportionally rising by 150% in 2016 and about 20% for the coming years 2017 and Our FFO excess return approach with conservative assumptions for the future growth comes up with a Fair Value of Euro 3.25 per WCM share and allows for almost 13% additional upside after the share already performed very well in 2015 (+84%) and in the first months of 2016 (+12%). We start the coverage with an Accumulate rating and set our target at Euro 3.25.
2 SWOT Analysis Strenghts Weaknesses Opportunities Threats WCM pursues a quite conservative investment approach targeting assets with a low risk profile characterized by a minimum occupancy rate of 80%, long-term lease agreements with solvent and credit-worthy tenants, financed with an LTV between 50% and 65% and situated in densely populated and economically strong regions. All assets are structured in SPVs. This enhances the liquidity of the asset and facilitates the disposal of a share of the equity stake only. By doing this, WCM is able to reduce the exposure to a level as desired in order to faster realize any adjustments of the portfolio mix for instance. Moreover, in the event of an asset disposal the borrowed loans will also be passed on to the buyer without releasing any prepayment penalties. The management team is highly senior and well-experienced in the German real estate sector. The CEO Mr. Stavros Efrimidis can show off more than 23 years of work experience in various positions. Prior to WCM he served as CEO for Kommunale Wohnen AG from 2007 to 2013 and oversaw its equity growth from Euro 11m to Euro 172m. After a sale to conwert Immobilien Invest SE he became CEO for conwert s operations in Germany. The members of the management team are quite familiar to each other due to successful collaborations as well as business relationships in the past. The element of trust and mutual understanding secures lean and efficient structures and the implementation of best practice principles. The workflow and processes are not well established yet and still influenced to a large extent by the habit and management attitude of each individual. Especially the quadriga which consists of the CEO and those in charge of finance, asset management and acquisition and sales share a common professional background at Kommunale Wohnen AG which can be deemed as a non-negligible key personnel risk. Future growth of the portfolio heavily relies on further capital increases. Since the management indicated a dividend policy of distributing about 50% of the FFO each year and because of little room for further stretching the balance sheet with additional debt due to an LTV with 56.4% still slightly above the target level of 55%, the company lacks internal liquidity sources. In addition to capital increases, in-kind capital contribution might be a given alternative. WCM can fully benefit from the historically low interest rates due to the proper timing of its start of operations and without any undesired heritage of previously borrowed loans. The vacancy rate as measured by EPRA taking into account potential rental income instead of lettable space is at about 4.0% on total portfolio level. Roughly two third of the properties are fully let. However from the remaining properties, mainly office type, 7 of them exhibit a vacancy rate of double digit numbers. If WCM is aiming at bringing further down in the first instance the vacancy rate of these properties at least by half, the vacancy rate on portfolio level will drop by another 1.8 percentage points down to 2.2%. Even though the management team has done well in terms of rapidly building up a substantial portfolio volume, the company may struggle with keeping up the same pace as in the previous year. Indicated by the self-imposed target of lifting up the portfolio size by another Euro 500m in the next 18 months, time needed is about 50% longer than what it took for the same size within the 12 months in The retail tenant Edeka may entail a major shortfall risk of rental income since it contributes about 25% to the overall resp. even up to 60% to the retail rental income. Competitive advantage is not secured by any technological leadership or development skills but rather is kept by management excellence of key people like CEO Stavros Efremidis. WCM s business model is straight-forward where the value add is largely contributed by careful deal sourcing and smart acquisitions which come into play right upfront of the value chain and while holding assets it is about fast reaction to tenant s needs and coordination of property and facility managers for quick implementation of appropriate measures where needed. A change in European monetary policy by the ECB regarding the termination of the currently all-time low-interest period will result in a relatively high increase of interest expenses and might also lead to higher expenses for WCM. 2 2 SRC Equity Research

3 3 3 SRC Equity Research
4 Investment Rationale The underlying fundamentals of the portfolio assets are intact and fully comply with the investment strategy: Clear office and retail real estate exposure Risk spread twice as high as cost of debt Unencumbered by unfavorable loan agreements in the past, thus low interest rates punch through by 100% The portfolio is purely commercial and well-balanced between office (63%) and retail assets (37%). As per the investment criteria WCM aims at acquiring properties with vacancy rates ranging between 5% and 15%. The current EPRA vacancy as a measure taking into account unrealized rental income instead of vacant space dropped from 4.8% at the end of 2015 to a healthy level of currently 4.0%. In the recent company presentation a showcase as exemplified by 3 office properties located in Wiesbaden, Düsseldorf and Frankfurt demonstrated WCM s strength of significantly reducing vacant space as. The combined vacancy rate has been significantly reduced from 13.7% down to 1.6%. An annualized rental income of Euro 32m relatively to a market value of Euro 532.6m results into a gross initial yield of 6.0% for the total portfolio. Taking into account the very low interest expenses at c. 2.1% there is a significant spread of at least 4% for the shareholders pocket. This spread is even higher if future rental income increases will be taken into consideration. Currently, the positive spread is leveraged up to an LTV of 56.4% at current. Shareholders can benefit from this positive spread on a long term projection since the major bulk of loans, namely more than two third, is subject for prolongation not before 2022 which results in an average time to maturity of 6.4 years at current. The tenancy schedule shows a well-diversified mix of tenants with a weighted average lease term of about 10.3 years for the total portfolio resp. 8.8% for office properties and 12.4 years for retail properties with the retail tenant Edeka having a WALT of more than 14 years. The vast majority of properties are each let to one tenant only. This single tenant structure reduces complexity and costs while increasing direct interaction with tenants in order to keep possible fluctuation and the risk of temporary vacancy low. As of now, WCM raised Euro 212.2m of equity, thereof Euro 14m as in-kind capital contribution, and sourced over 300m in debt. Both source of capital are at an all-time cheap level. Equity can be attracted at prime yields of far below 4% for office and retail assets in top German locations and debt financing is available at unprecedented low rates. Due to the start at the end of 2014 WCM is unencumbered by unfavorable loan agreements in the past and can fully benefit from excellent conditions as seen below: Source: Company Data, SRC Research 4 4 SRC Equity Research
5 Special Purpose vehicles with efficient tax structure and better exit options in the future Tax loss carry forwards significantly minimize future tax burdens All assets are indirectly held via special purpose vehicles that allows the company also to pass on the borrowed loans in the event of an asset sale via a share deal. Since the SPV is the borrower from the legal point of view, the change of the ownership does not have any impact to the existing loan agreement between the SPV as the legal entity and the financial institution. Thus, unwanted prepayment penalties are not an issue for WCM at all. Furthermore, an enormous amount of Euro 526m of loss carry forwards were right from the start at the company s disposal in order to enormously benefit from future tax savings. A projection of a 10-years business plan for the next 10 years reveals future tax savings between Euro 15m and Euro 45m based upon a portfolio volume of up to Euro 1.5bn. The 10 years business plan was projected on the basis of the portfolio as of December In the meanwhile, the composition of the portfolio has been changed through 4 divestments and 3 acquisitions; nevertheless a simple numeric analysis explains the mechanism of how tax savings will be computed and positively impact future earnings. Please note that for tax avoiding purpose, the earnings cannot fully be deducted by the available TLCF since each year the deduction is constrained by using 60% only for the earnings above Euro 1m. For the analysis, a distinction between earnings subject to corporate tax and/or trade tax has to be done. See the analysis as follows: 1) Corporate tax: TLCF of Euro 274.1m As per projection of a 10 years business plan, earnings to be subject for corporate tax are assumed to be about Euro 80.2m whereof only TLCF of Euro 52.1m are deductible from. Applying a taxation of %, active deferred tax of Euro 8.2m will be activated in the balance sheet. Source: Company Data 2) Trade tax: TLCF of Euro 252.1m Exactly the same calculation applies for the trade tax, except for other figures. Earnings to be subject for trade tax are assumed to be about Euro 54.2m whereof only TLCF of Euro 36.5m are deductible from. Applying a taxation of %, active deferred tax of Euro 5.9m will be activated in the balance sheet. Active deferred taxes amount to Euro 14.1m in total. This corresponds to activated TLCF of Euro 134.4m, thus roughly 17% of available TLCF. The ability to fully activate additional TLCF will be driven by future portfolio growth and related income. But even under the assumption of a portfolio size of Euro 1.5bn, just half of the available TLCF will be activated. For simplicity reasons, recognition of additional deferred tax assets on capital gains from asset valuations are not included in the calculation above. However the recognition of active deferred tax of Euro 26.1m after at the end of 2015 clearly indicates that capital gains will be significantly driving the recognition of additional TLCF. 5 5 SRC Equity Research

, about one third of this rental income potential has been effectively generated in 2015.")


6 Company highlights in 2015 WCM rapidly build up a portfolio with a substantial volume in terms of number of assets and market value Through the acquisition of stable income producing assets an annualized rental income of Euro 31.5m has been secured. Since the acquisitions were successively closed over the course of 2015 and due to intense management effort for vacancy reduction for some properties (see below the showcase of 3 office properties located in Wiesbaden, Düsseldorf and Frankfurt for instance), about one third of this rental income potential has been effectively generated in Long term lease agreements with weighted average lease terms of above 10 years at current for the entire portfolio. Highly solvent and creditworthy top 5 tenants such as Germany s largest supermarket corporation EDEKA, the federal state of Hesse, the strongest German DIY homestore brand OBI, the multinational recruitment company randstad and finally the globally active technology powerhouse General Electric. Vacancy has been constantly lowered up a level of 4% at current which is below the criteria as laid down for acquisitions targets. Apart from bringing in new tenants, WCM also successfully spent effort on successfully retaining existing tenants while extending the lease agreements. In other word, active asset management accounts for about Euro 3m resp. 10% of the annualized rental that has been secured in Source: Company Data At the kick-off of WCM at the end of 2014, the company could benefit of tax loss carry forwards of Euro 526.2m in total. In the recent two years this amount increased by another Euro 16m which was mainly due to additionally generated loss in the short fiscal year in 2014 and in 2015 because of cost-intensive portfolio build-up. However, about Euro 26m of TLCF so far has been already activated in the balance sheet which ultimately has a direct positive effect on the NAV. Within the year of 2015, the share price increased by about 120% from Euro to Euro Source: Onvista, SRC Research 6 6 SRC Equity Research
7 Portfolio snapshot (overview as of April 2016) WCM Beteiligungs und Grundbesitz AG Retail % Office % Office Retail held via special purpose vehicles Triangel Frankfurt Immobilien GmbH 94,9% Aschgo GmbH & Co. KG 94,0% Barisk GmbH & Co. KG 94,0% Berkles GmbH & Co. KG 94,0% Greenman 1D GmbH 94,0% Seebeck Offshore Industriepark GmbH & Co. KG PRE Real Estate PRE Real Estate Deutschland 1 ApS 94,9% PRE Real Estate Deutschland 10 ApS 94,9% PRE Real Estate Deutschland 14 ApS 94,9% PRE Real Estate WCM Deutschland A ApS 94,9% WCM Handelsmärkte GmbH & Co. KG 100,0% WCM Handelsmärkte II GmbH & Co. KG 100,0% WCM Handelsmärkte III 88,0% GmbH & Co. KG River WCM Besitzgesellschaft mbh 100,0% River Berlin Immobilien GmbH 94,9% WCM Beteiligungsges. mbh & Co. Objekte North KG 100,0% River Bonn GmbH 94,9% WCM Office 1 GmbH & Co. KG 100,0% River Düsseldorf Immobilien GmbH 94,9% 92,9% WCM Planbau GmbH 94,0% River Frankfurt Immobilien GmbH 94,9% Source: SRC Research Composition WCM s portfolio comprises 50 real estate assets wherefrom 12 are of office type and the majority of 32 are of retail type of usage. However weighted by market value resp. by rental income, the portfolio clearly dominates the portfolio with a share of 63% resp. 57% for the later. It is part of the strategy to acquire each property only indirectly by means of a special purpose vehicle which already exists due to previous acquisitions or will be set up prior to the acquisition. As of now, WCM AG is the holding company of 21 SPVs. Besides some exemptions, the SPV in general have a tax efficient structure by avoiding real estate transfer tax through the holding rate of less than 95% to the SPV. See the so-called RETT 1 -Blocker share deal structures. 1 Real Estate Transfer Tax (RETT) 7 7 SRC Equity Research

8 Brief overview Some of the main characteristics of each of the two sub-portfolios are as follows: Number of properties: Market Value: Lettable space: 12 Vacancy rate: 6.7% WALT: Average current in-place rent: Top tenant: Geographical allocation: Euro 334m 114,000 sqm 8.8 years Euro 13.4 per sqm per month office portfolio Federal state of Hesse (about 10% of total rental income) Economically attractive German top cities such Berlin, Bonn, Köln, Frankfurt, Mainz and Wiesbaden Number of properties: Market value: Lettable space: 38 Vacancy rate: 0.4% WALT: Average current in-place rent: Top tenant: Geographical allocation: Euro 199m 135,000 sqm 12.4 years Euro 8.5 per sqm per month retail portfolio EDEKA (about 25% of total rental income) greater metropolitan regions with economically attractive spending power for private consumptions 8 8 SRC Equity Research


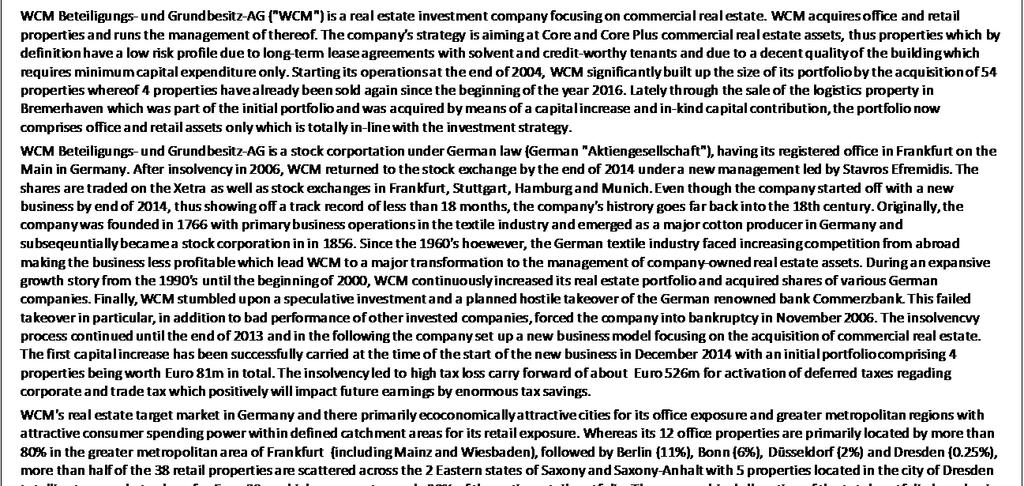
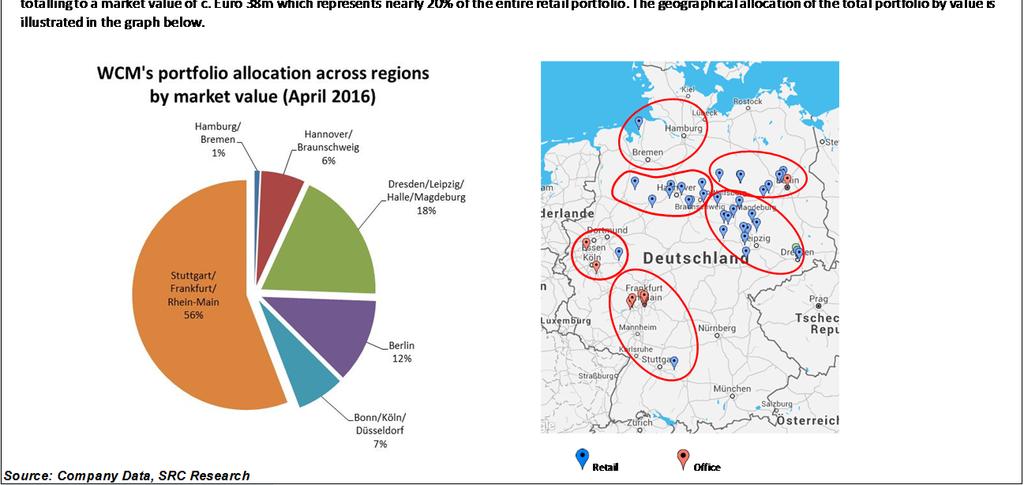
9 Geographical allocation of the real estate portfolio by regions by regions regional clusters by market value by portfolio share 9 9 SRC Equity Research

10 In terms of the lot size of the assets relatively to each other, please see the characteristics as follows: office portfolio lot size characteristics retail portfolio The rental income is by nearly two third generated from top tenants within their peers. Some minor risk may exist with regard to the high contribution from the tenant Edeka where the rental income amounts to 25% of the total rental income. However, this risk is somehow mitigated by the fact that the rental income is distributed across 20 retail properties rented out to Edeka. Source: SRC Research SRC Equity Research

11 WCM s key element of its business model fast reaction whenever deal opportunities arise and consequently having the patience for long-term value creation WCM targets real estate properties that offer a high occupancy rate and thus generate stable income through tenancy with solvent and credit-worthy tenants. In terms of quality and structure, the properties WCM is looking for should show off high quality standards, require only minor capital expenditure for refurbishment if at all and should be appropriate for an alternative third party use. Using the general risk-return matrix that applies for the range of possible real estate investment styles, WCM defines its market position in lower left corner of the matrix as seen as follows: Source: Peer Realty The management team of WCM demonstrated its capability of deal sourcing and execution in a highly competitive environment where WCM competes with a range of major institutional funds following upon a rather conservative investment strategy for their institutional clients like insurance companies and retirement pension schemes. High integration within the industry and leveraging a broad network to potential buyers and sellers is a prerequisite that finally matters in order to be successful and WCM has proven well on this issue clearly by the high pace of the portfolio build up within slightly more than a year. Once an asset has been purchased, WCM s business philosophy in general is keeping the asset within the portfolio for at least a minimum of 5 years in order to achieve value creation by proprietary and distinctive in-house management services as seen as follows: Source: Company Data, SRC Reserach SRC Equity Research
12 We forecast the FFO cash earnings for the next five years and set these returns in relation to the Cost of Equity to determine an excess return adding to NAV. Our approach is careful as we gradually increase the Cost of Equity and only expect a rather small hike for the 2019 and 2020 FFO. The FFO excess return valuation offers a 13% upside for the WCM share even after the decent share price development For the valuation of the WCM share we use a FFO excess return valuation model. We project the FFO cash earnings for the next five years and set these returns in relation to the future Cost of Equity to determine an excess return which adds to the EPRA NAV. For the years 2016 to 2018 we have our detailed projection stemming from our P & L forecast. We project the FFO to more than double in For 2017 and 2018 we project the FFO to rise by about 20% per year with a constantly growing portfolio which crosses the Euro 1bn threshold at the end of 2017 or the beginning of As we have no detailed projection for 2019 and 2020 yet, we may expect a hike of about 15% per year which is a rather cautious approach in our view. We set the Cost of Equity at 4.25% for 2016 and have a slowly rising Cost of Equity forecast for the coming years as general interest environment might return from an almost Zero interest environment and the company s risk premiums and Beta may also slowly rise as later years have a higher degree of uncertainty about the sourcing of new attractive property portfolios. Thus, the Cost of Equity in our valuation model gradually increases from 4.20% in 2016 to 5.35% in e 2017e 2018e 2019e 2020e Cost of Equity 4.20% 4.52% 4.83% 5.09% 5.35% thereof risk free 1.00% 1.20% 1.40% 1.55% 1.70% thereof risk premium 3.0% 3.1% 3.2% 3.3% 3.4% thereof Beta factor 0.20% 0.22% 0.23% 0.24% 0.25% Source: SRC Research WCM adds almost Euro 70m excess return to its NAV within the next five years. The share gained 12% since the beginning of the year and 84% in However there is still an upside potential of at least more than 10% which is also supported by a shareholders friendly dividend policy. In our valuation, for the years 2016 to 2020 WCM adds almost Euro 70m excess return to its NAV and ends up with a Fair Value of Euro 3.25 per share. This translates into an upside potential for the share price of almost 13% at the current share price level. With the number of shares of c. 122 million the current Fair Value per WCM share is at Euro The WCM share already gained 12% since the beginning of the year, after gaining 84% in 2015, but with a strong FFO generation to be continued we expect the share price to quickly climb clearly above Euro Another argument besides the decent and strongly rising FFO generation is the shareholders friendly dividend policy as the management plans to pay out about 50% of the future FFO profits. We set our 2016 dividend forecast at 8 Cents, for 2017 we expect 10 Cents and for 2018 our projection is at 12 Cents. This translates into a dividend yield between 3% and 4% at the current share price level SRC Equity Research
13 FFO excess return valuation Euro ' e 2017e 2018e 2019e 2020e CAGR 2016e e FFO 21,787 26,226 30,851 35,479 40, % y-o-y change 151.8% 20.4% 17.6% 15.0% 15.0% EPRA NAV 327, , , , , % FFO return on NAV 7.05% 8.05% 9.24% 10.09% 11.05% 12.7% Cost of Equity 4.20% 4.52% 4.83% 5.09% 5.35% thereof risk free 1.00% 1.20% 1.40% 1.55% 1.70% thereof risk premium 3.0% 3.1% 3.2% 3.3% 3.4% thereof Beta factor 0.20% 0.22% 0.23% 0.24% 0.25% Excess return 2.85% 3.53% 4.41% 5.00% 5.70% Value creation 9,333 11,439 15,146 18,005 21,556 NPV of value creation 9,169 10,911 14,025 16,188 18,816 EPRA NAV 2016e 327,492 Value creation by excess return (2016e e) 69,109 EPRA NAV including future value creation (2016e e) 396,601 Number of shares ('000) 121,965 Fair Value per share (FFO excess return valuation) 3.25 Current share price 2.89 Upside potential 12.5% Source: SRC Research SRC Equity Research
14 WCM Beteiligungs- und Grundbesitz AG 31/12 IFRS ('000) e 2017e 2018e CAGR '15 - '18e Rental income 0 10,445 29,350 35,514 42, % Operating and ancillary costs ,120-1,745-2,210 Net rental income 0 9,560 28,230 33,769 40,762 Unrealized net gains / losses from fair value measurement of investment properties 0 54,904 19,872 17,990 14,560 Other operating income 996 3,012 3,545 3,875 4,120 Staff costs ,530 1,745 1,920 2,150 Other operating expenses -1, ,578-10,785 Operating profit (EBITDA) ,231 44,942 47,976 50,807 Depreciation and amortization Operating Profit (EBIT) ,872 44,532 47,546 50,357 Financial income Financial expenses ,212-5,985-7,045-8,936 Net financial result ,076-5,673-6,695-8,516 Pre-tax profit (EBT) ,796 38,859 40,851 41, % Tax (cash and deferred) 2, ,845-3,505-3,635 Tax rate n.m. n.m. 7.3% 8.6% 8.7% Net profit before minorities 1,206 57,675 36,014 37,346 38,206 Minorities 0-3,383-5,644-5,721-5,876 Net profit after minorities 1,206 54,292 30,370 31,625 32,330 Number of shares ('000) 15,623 75, , , ,965 Earnings per share (EPS) Dividend per share (DPS) in % of FFO result 0.0% 0.0% 46.0% 47.8% 48.6% EBITDA ,231 44,942 47,976 50, % - revaluations and other adjustments 0-54,904-19,872-17,990-14,560 Adjusted EBITDA ,327 25,070 29,986 36, % Interest Coverage ratio neg FFO Calculation: Pre-tax profit ,796 38,859 40,851 41,841 Net revaluation result 0-54,904-19,872-17,990-14,560 Depreciation and amortisation Trading result 0 0-1, Non cash expenses (e.g. increase in provisions) 0 3,260 1,955 1,985 2,020 one off costs 0 3,143 1,650 1,750 1,850 result from interest derivatives FFO before tax ,654 21,787 26,226 30, % cash taxes 2, ,707-2,103-2,181 deferred taxes -2,364-1,601 1,138 1,402 1,454 FFO after taxes -1,242 7,932 21,218 25,525 30, % FFO per share Shareholders' Equity (without minorities) 30, , , , , % Shareholders' Equity (including minorities) 31, , , , ,349 EPRA NAV n.a. 290, , , , % Balance Sheet sum 43, , ,803 1,048,684 1,258,421 Equity Ratio 72.5% 48.9% 37.4% 29.6% 26.1% RoE (after tax) 8.1% 36.0% 10.8% 10.5% 10.1% -34.5% Property portfolio 17, , ,180 1,004,195 1,255,244 Book Value per share (Euro) % NAV per share (Euro) n.a % SRC Equity Research
15 SRC Research - Der Spezialist für Finanz- und Immobilienaktien - SRC - Scharff Research und Consulting GmbH Klingerstr. 23 D Frankfurt am Main Germany Fon: +49 (0)69/ Mail: scharff@src-research.de Internet: Rating chronicle: As this research report is an initiating coverage there is no rating chronicle available. Please note: The share price mentioned in this report is from 18 May WCM Beteiligungsund Grundbesitz-AG mandated SRC Research for covering the WCM share. Disclaimer 2016: This equity research report is published by: SRC-Scharff Research und Consulting GmbH, Klingerstr. 23, D Frankfurt, Germany (short name: SRC Research). All rights reserved. Although we feel sure that all information in this SRC report originates from carefully selected sources with high credibility, we cannot give any guarantee for accuracy, trueness and completeness. All opinions quoted in this report give the current judgement of the author which is not necessarily the same opinion as SRC- Scharff Research und Consulting GmbH or another staff member. All the opinions and assessment made in this report may be changed without prior notice. Within the scope of German regulative framework the author and SRC-Scharff Research und Consulting GmbH do not assume any liability for this document or its content being used. This report is solely for information purposes and does not constitute a request or an invitation or a recommendation to buy or sell any stock that is mentioned here. Private clients should obtain personal advice at their bank or investment house and should keep in mind that prices and dividends of equities can rise and fall and that nobody can give a guarantee of the future development of equities. The author of this report and the SRC-Scharff Research und Consulting GmbH commit themselves on a unsolicited basis to having no long or short-positions in equities or derivatives related to equities mentioned in this report. Reproduction, distribution or publishing this report and its content as a whole or in parts is only allowed with approval of SRC management written form. With acceptance of this document you agree with all regulations mentioned here and all general terms and conditions you will find at anytime at our website SRC Equity Research
CA Immo Buy (old: Accumulate)
") CA Immo Buy (old: Accumulate) 29 May 15 Price (Euro) 16.21 52 weeks range 18.59 / 13.47 Key Data ISIN AT0000641352 Reuters CAIV.VI Bloomberg CAI AV Reporting standard IFRS Market Cap (Euro million) 1,602
CA Immo Buy (old: Accumulate) 29 May 15 Price (Euro) 16.21 52 weeks range 18.59 / 13.47 Key Data ISIN AT0000641352 Reuters CAIV.VI Bloomberg CAI AV Reporting standard IFRS Market Cap (Euro million) 1,602
S IMMO. Accumulate (old: Buy) Target: Euro (old: Euro 16.00)
 Target: Euro (old: Euro 16.00)") S IMMO Accumulate (old: Buy) Target: Euro 17.50 (old: Euro 16.00) 06 April 2018 Price (Euro) 16.50 52 weeks range 16.50 / 11.50 Key Data Country Austria Industry Real Estate Market Segment Prime Market
S IMMO Accumulate (old: Buy) Target: Euro 17.50 (old: Euro 16.00) 06 April 2018 Price (Euro) 16.50 52 weeks range 16.50 / 11.50 Key Data Country Austria Industry Real Estate Market Segment Prime Market
conwert Immobilien Hold (unchanged) Target: Euro (unchanged)
 Target: Euro (unchanged)") conwert Immobilien Hold (unchanged) Target: Euro 16.16 (unchanged) 05 May 17 Price (Euro) 16.50 52 weeks range 17.39 / 12.51 Record year 2016 with Euro 80m FFO I and 50% increase in net profit Hold and
conwert Immobilien Hold (unchanged) Target: Euro 16.16 (unchanged) 05 May 17 Price (Euro) 16.50 52 weeks range 17.39 / 12.51 Record year 2016 with Euro 80m FFO I and 50% increase in net profit Hold and
Sparkassen Immobilien
 Sparkassen Immobilien BUY (unchanged) Target: Euro 8. (unchanged) 3 Sept 21 Price (Euro) 5.2 52 weeks range 6.2 / 4.36 Key Data Country Austria Industry Real Estate Market Segment Prime Market ISIN AT65225
S IMMO. Buy (unchanged) Target: Euro (old: Euro 20.00)
 Target: Euro (old: Euro 20.00)") S IMMO Buy (unchanged) Target: Euro 20.50 (old: Euro 20.00) Price (Euro) 16.84 52 weeks range 18.64 / 13.92 Key Data Country Austria Industry Real Estate Market Segment Prime Market ISIN AT0000652250 WKN
S IMMO Buy (unchanged) Target: Euro 20.50 (old: Euro 20.00) Price (Euro) 16.84 52 weeks range 18.64 / 13.92 Key Data Country Austria Industry Real Estate Market Segment Prime Market ISIN AT0000652250 WKN
S IMMO. Buy (old: Accumulate) Target: Euro (old: Euro 19.00)
 Target: Euro (old: Euro 19.00)") S IMMO Buy (old: Accumulate) Target: Euro 20.00 (old: Euro 19.00) 27 November 2018 Price (Euro) 15.20 52 weeks range 18.64 / 14.00 Key Data Country Austria Industry Real Estate Market Segment Prime Market
S IMMO Buy (old: Accumulate) Target: Euro 20.00 (old: Euro 19.00) 27 November 2018 Price (Euro) 15.20 52 weeks range 18.64 / 14.00 Key Data Country Austria Industry Real Estate Market Segment Prime Market
PORR Buy (unchanged) Target: Euro (old: Euro 34:00)
 Target: Euro (old: Euro 34:00)") PORR Buy (unchanged) Target: Euro 36.00 (old: Euro 34:00) 25 April 16 Price (Euro) 28.00 52 weeks range 30.50 / 20.41 Key Data Country Austria Industry Technology & Construction ISIN AT0000609607 WKN 850185
PORR Buy (unchanged) Target: Euro 36.00 (old: Euro 34:00) 25 April 16 Price (Euro) 28.00 52 weeks range 30.50 / 20.41 Key Data Country Austria Industry Technology & Construction ISIN AT0000609607 WKN 850185
UBM Development AG Buy (unchanged) Target: Euro (old: Euro 48.00)
 Target: Euro (old: Euro 48.00)") Buy (unchanged) Target: Euro 44.00 (old: Euro 48.00) 07 March 17 Price (Euro) 32.78 52 weeks range 36.00 / 26.21 Key Data Country Austria Industry Real Estate Segment Development (trading oriented) ISIN
Buy (unchanged) Target: Euro 44.00 (old: Euro 48.00) 07 March 17 Price (Euro) 32.78 52 weeks range 36.00 / 26.21 Key Data Country Austria Industry Real Estate Segment Development (trading oriented) ISIN
UBM Development AG Buy (unchanged) Target: Euro (unchanged)
 Target: Euro (unchanged)") Buy (unchanged) Target: Euro 50.00 (unchanged) Price (Euro) 37.80 52 weeks range 43.90 / 33.00 Key Data Country Austria Industry Real Estate Segment Development (trading oriented) ISIN AT0000815402 WKN
Buy (unchanged) Target: Euro 50.00 (unchanged) Price (Euro) 37.80 52 weeks range 43.90 / 33.00 Key Data Country Austria Industry Real Estate Segment Development (trading oriented) ISIN AT0000815402 WKN
Lloyd Fonds AG. Accumulate (unchanged) Target: Euro 0.75 (unchanged)
 Target: Euro 0.75 (unchanged)") Accumulate (unchanged) Target: Euro 0.75 (unchanged) 4 June 14 Price (Euro) 0.50 High / Low (52 weeks) 0.64 / 0.36 Key data Country Germany Market Segment Entry Standard Securities ID-Number 617487 ISIN
Accumulate (unchanged) Target: Euro 0.75 (unchanged) 4 June 14 Price (Euro) 0.50 High / Low (52 weeks) 0.64 / 0.36 Key data Country Germany Market Segment Entry Standard Securities ID-Number 617487 ISIN
S IMMO. Target: Euro 6.50 (unchanged) 23 November Price (Euro) weeks range 5.03 / André Hüsemann, CREA Stefan Scharff, CREA
 23 November Price (Euro) weeks range 5.03 / André Hüsemann, CREA Stefan Scharff, CREA") S IMMO BUY (unchanged) Target: Euro 6.50 (unchanged) 23 November 2012 Price (Euro) 4.90 52 weeks range 5.03 / 3.88 Key Data Country Austria Industry Real Estate Market Segment Prime Market ISIN AT0000652250
S IMMO BUY (unchanged) Target: Euro 6.50 (unchanged) 23 November 2012 Price (Euro) 4.90 52 weeks range 5.03 / 3.88 Key Data Country Austria Industry Real Estate Market Segment Prime Market ISIN AT0000652250
Buy (unchanged) Target: Euro (unchanged)
 Target: Euro (unchanged)") EYEMAXX Real Estate Buy (unchanged) Target: Euro 19.00 (unchanged) 27 June 18 Price (Euro) 1 52 weeks range 15.48 / 9.18 EYEMAXX with good news flow regarding new projects, additions to the property portfolio,
EYEMAXX Real Estate Buy (unchanged) Target: Euro 19.00 (unchanged) 27 June 18 Price (Euro) 1 52 weeks range 15.48 / 9.18 EYEMAXX with good news flow regarding new projects, additions to the property portfolio,
CA Immo Accumulate (old: Buy) Target: Euro (old: Euro 25.00)
 Target: Euro (old: Euro 25.00)") CA Immo Accumulate (old: Buy) Target: Euro 26.00 (old: Euro 25.00) 23 November 17 Price (Euro) 24.40 52 weeks range 25.48 / 16.05 Key Data ISIN AT0000641352 Reuters CAIV.VI Bloomberg CAI AV Reporting standard
CA Immo Accumulate (old: Buy) Target: Euro 26.00 (old: Euro 25.00) 23 November 17 Price (Euro) 24.40 52 weeks range 25.48 / 16.05 Key Data ISIN AT0000641352 Reuters CAIV.VI Bloomberg CAI AV Reporting standard
CA Immo Buy (unchanged) Target: Euro (old: Euro 24.00)
 Target: Euro (old: Euro 24.00)") CA Immo Buy (unchanged) Target: Euro 25.00 (old: Euro 24.00) 24 August 17 Price (Euro) 22.46 52 weeks range 22.84 / 15.63 Key Data ISIN AT0000641352 Reuters CAIV.VI Bloomberg CAI AV Reporting standard
CA Immo Buy (unchanged) Target: Euro 25.00 (old: Euro 24.00) 24 August 17 Price (Euro) 22.46 52 weeks range 22.84 / 15.63 Key Data ISIN AT0000641352 Reuters CAIV.VI Bloomberg CAI AV Reporting standard
EYEMAXX Real Estate Buy (unchanged) Target: Euro (old: Euro 12.00)
 Target: Euro (old: Euro 12.00)") EYEMAXX Real Estate Buy (unchanged) Target: Euro 14.00 (old: Euro 12.00) 04 July 16 Price (Euro) 5.68 52 weeks range 7.28 / 4.00 Key Data Country Germany Industry Real Estate Segment General Standard ISIN
EYEMAXX Real Estate Buy (unchanged) Target: Euro 14.00 (old: Euro 12.00) 04 July 16 Price (Euro) 5.68 52 weeks range 7.28 / 4.00 Key Data Country Germany Industry Real Estate Segment General Standard ISIN
OVB. Hold (unchanged) Target: Euro (unchanged) 08 May 2018
 Target: Euro (unchanged) 08 May 2018") OVB Hold (unchanged) Target: Euro 20.00 (unchanged) 08 May 2018 Price (Euro) 18.30 52 weeks range 23.50 / 17.10 Key Data Country Germany Industry Financial Services Transparency Prime Standard Internet
OVB Hold (unchanged) Target: Euro 20.00 (unchanged) 08 May 2018 Price (Euro) 18.30 52 weeks range 23.50 / 17.10 Key Data Country Germany Industry Financial Services Transparency Prime Standard Internet
EYEMAXX Real Estate Buy (unchanged) Target: Euro (unchanged)
 Target: Euro (unchanged)") EYEMAXX Real Estate Buy (unchanged) Target: Euro 12.00 (unchanged) 22 Feb 16 Price (Euro) 5.50 52 weeks range 6.31 / 4.80 Key Data Country Germany Industry Real Estate Segment General Standard ISIN DE000A0V9L94
EYEMAXX Real Estate Buy (unchanged) Target: Euro 12.00 (unchanged) 22 Feb 16 Price (Euro) 5.50 52 weeks range 6.31 / 4.80 Key Data Country Germany Industry Real Estate Segment General Standard ISIN DE000A0V9L94
C-Quadrat Accumulate (old: Hold) Target: Euro (old: Euro 27)
 Target: Euro (old: Euro 27)") C-Quadrat Accumulate (old: Hold) Target: Euro 29.00 (old: Euro 27) 23 І October І 2012 Price (Euro) 25.00 52 weeks range 30.41 / 17.25 Key data Country Austria Industry Financial Sevices Market segment
C-Quadrat Accumulate (old: Hold) Target: Euro 29.00 (old: Euro 27) 23 І October І 2012 Price (Euro) 25.00 52 weeks range 30.41 / 17.25 Key data Country Austria Industry Financial Sevices Market segment
IFM Immobilien AG. Promising 1H figures and a promising new project target price is still Target: Euro (unchanged)
") BUY (unchanged) Target: Euro 17.50 (unchanged) 01 Oct 07 Price (Euro) 11.26 52 weeks range 13.90 / 7.90 Key Data Security ID-No. A0JDU9 Reuters IFMG.DE Bloomberg IFM GY Accounting standard IFRS Market
BUY (unchanged) Target: Euro 17.50 (unchanged) 01 Oct 07 Price (Euro) 11.26 52 weeks range 13.90 / 7.90 Key Data Security ID-No. A0JDU9 Reuters IFMG.DE Bloomberg IFM GY Accounting standard IFRS Market
Retail: Potsdamer Strasse 51, Ludwigsfelde. Quarterly statement Q1/2017. WCM Beteiligungs- und Grundbesitz-Aktiengesellschaft
 Retail: Potsdamer Strasse 51, Ludwigsfelde Quarterly statement Q1/2017 WCM Beteiligungs- und Grundbesitz-Aktiengesellschaft WCM Key Figures (IFRS) as at 31 March 2017 1 January - 31 March 2017 1 January
OVB. Hold (unchanged) Target: Euro (unchanged) 26 March 2018
 Target: Euro (unchanged) 26 March 2018") OVB Hold (unchanged) Target: Euro 20.00 (unchanged) 26 March 2018 Price (Euro) 20.20 52 weeks range 23.50 / 17.11 Key Data Country Germany Industry Financial Services Transparency Prime Standard Internet
OVB Hold (unchanged) Target: Euro 20.00 (unchanged) 26 March 2018 Price (Euro) 20.20 52 weeks range 23.50 / 17.11 Key Data Country Germany Industry Financial Services Transparency Prime Standard Internet
MAXX Buy 10 EYEM. (unchanged) has also in its insupport. per year. from Eu- by the much. firm still. buy with. logistics. year. We.
 has also in its insupport. per year. from Eu- by the much. firm still. buy with. logistics. year. We.") EYEM MAXX Buy 10 July 13 (unchanged) Target: Euro 12.50 (unchanged) Price (Euro) 52 weeks range Key Data Country Industry Segment General Standard ISIN DE000A0V9L94 Sec. ID-No. A0V9L9 Symbol BNT1 Bloomberg
EYEM MAXX Buy 10 July 13 (unchanged) Target: Euro 12.50 (unchanged) Price (Euro) 52 weeks range Key Data Country Industry Segment General Standard ISIN DE000A0V9L94 Sec. ID-No. A0V9L9 Symbol BNT1 Bloomberg
OVB. Accumulate (old: Hold) Target: Euro (old: Euro 20.00) 12 May 11
 Target: Euro (old: Euro 20.00) 12 May 11") Accumulate (old: Hold) Target: Euro 22.00 (old: Euro 20.00) 12 May 11 Price (Euro) 19.40 52 weeks range 27.00 / 18.70 Key Data Country Germany Industry Financial Services Transparency Prime Standard Internet
Accumulate (old: Hold) Target: Euro 22.00 (old: Euro 20.00) 12 May 11 Price (Euro) 19.40 52 weeks range 27.00 / 18.70 Key Data Country Germany Industry Financial Services Transparency Prime Standard Internet
Retail: Jacob-Winter-Platz, Dresden. Interim statement Q3/2017. WCM Beteiligungs- und Grundbesitz-Aktiengesellschaft [1]
![Retail: Jacob-Winter-Platz, Dresden. Interim statement Q3/2017. WCM Beteiligungs- und Grundbesitz-Aktiengesellschaft [1]](/thumbs/96/127570971.jpg "Retail: Jacob-Winter-Platz, Dresden. Interim statement Q3/2017. WCM Beteiligungs- und Grundbesitz-Aktiengesellschaft [1]") Retail: Jacob-Winter-Platz, Dresden Interim statement Q3/2017 WCM Beteiligungs- und Grundbesitz-Aktiengesellschaft [1] Consolidated key figures (IRFS) as at 30 September 2017 Revenue and income 1 January
Retail: Jacob-Winter-Platz, Dresden Interim statement Q3/2017 WCM Beteiligungs- und Grundbesitz-Aktiengesellschaft [1] Consolidated key figures (IRFS) as at 30 September 2017 Revenue and income 1 January
10th Annual General Meeting. Vienna, 20 May 2011
 10th Annual General Meeting Vienna, 20 May 2011 Market overview and company development 2010 Earnings performance and balance sheet indicators 2010 Implementation of strategy Overview 1 st Quarter 2011
9M 2018 RESULTS 09 NOVEMBER 2018 TLG IMMOBILIEN AG 9M 2018 RESULTS
 TLG IMMOBILIEN AG 9M 208 RESULTS DISCLAIMER This presentation includes statements, estimates, opinions and projections with respect to anticipated future performance of TLG IMMOBILIEN ("Forward-Looking
PRELIMINARY INDICATION FOR FULL YEAR 2012 RESULT
 PRELIMINARY INDICATION FOR FULL YEAR 2012 RESULT JANUARY 2013 AGENDA OVERVIEW OF EXTRAORDINARY EFFECTS AND IMPACT ON 2012 RESULT 1 2 EBT TARGET OF 50 MIO IN 2012 WRITE DOWN OF GOODWILL AND INTANGIBLE ASSETS
Strategic Financing of a Listed Company
 Strategic Financing of a Listed Company Christian Hillermann ADLER Real Estate AG Dr. Sven Janssen Oddo Seydler Bank AG Contents ADLER Real Estate AG company presentation 1. Company highlights 2. Event
Deutsche Wohnen AG.» Company presentation. September 2012
 Deutsche Wohnen AG» Company presentation September 2012 1 » Agenda 1 Major highlights in H1/2012 2 BauBeCon acquisition 3 Proven asset and portfolio management track record in connection with the right
UBM Development AG Buy Target: Euro 63.00
 Buy Target: Euro 63.00 09 April 15 Price (Euro) 39.90 52 weeks range 41.49 / 16.50 Key Data Country Austria Industry Real Estate Segment Development ISIN AT0000815402 WKN 852735 Reuters UBMV.VI Bloomberg
Company Presentation. January 2018
 Company Presentation January 2018 Disclaimer This document is for informational purposes only. This document is not intended to form the basis of any investment decision and should not be considered as
FINANCIAL STATEMENTS. For the year ended December 31, 2013
 2013CONSOLIDATED FINANCIAL STATEMENTS For the year ended December 31, 2013 BOARD OF DIRECTORS REPORT REPORT OF THE RÉVISEUR D ENTREPRISES AGRÉÉ (INDEPENDENT AUDITOR) OF COMPREHENSIVE INCOME OF FINANCIAL
12 th Annual General Meeting. + Vienna, 8 May 2013
 12 th Annual General Meeting + Vienna, 8 May 2013 conwert is a fully integrated real estate company focusing on residential properties and apartment buildings in Germany and Austria. This focus is complemented
Prime Office REIT-AG EXCELLENCE IN GERMAN REAL ESTATE. Roadshow FY 2011 results Zurich, London, Frankfurt, Brussels, Paris and Amsterdam April 2012
 Prime Office REIT-AG EXCELLENCE IN GERMAN REAL ESTATE Roadshow FY 2011 results Zurich, London, Frankfurt, Brussels, Paris and Amsterdam April 2012 0 Disclaimer The statements contained herein may include
Deutsche Wohnen SE.» 9M 2017 results. Conference Call, 14 November 2017
 Deutsche Wohnen SE» 9M 2017 results Conference Call, 14 November 2017 1 » Agenda 1 Highlights 9M 2017 2 Portfolio 3 Financials 4 Appendix 2 » Highlights 9M 2017 Strong operating business L-f-l rental growth
S IMMO Annual results for April 2018
 S IMMO Annual results for 2017 05 April 2018 We develop value Attractive properties & real values 1.2m m² space 6.1% Rental yield EUR 1,839,680,000 IFRS Property portfolio 94.8% 73% 27% Occupancy rate
Conference call presentation Q
 Conference call presentation Q1 2018 2018 Content 2 I. TAG highlights Q1 2018 II. TAG financials Q1 2018 III. TAG portfolio Q1 2018 IV. TAG outlook FY 2018 V. Appendix 3 5 12 16 19 Portfolio details, vacancy
TLG S TENDER OFFER FOR WCM: BUILDING THE LEADING GERMAN COMMERCIAL REAL ESTATE PLATFORM
 MAY 207 TLG IMMOBILIEN AG TLG S TENDER OFFER FOR WCM: BUILDING THE LEADING GERMAN COMMERCIAL REAL ESTATE PLATFORM DISCLAIMER This presentation is for information purposes only and neither constitutes an
Q HIGHLIGHTS MEUR MEUR % MEUR MEUR 48.4 MEUR 94.8 MEUR % 1.87% +2.2% +1.9 PP +3.5% +73.8% + >100% +19.9% +81.
 Q1-2 2018 HIGHLIGHTS STRENGTHENED OPERATING PERFORMANCE Occupancy rate 94.7% Rental income MEUR 119.0 Rental income lfl MEUR 98.2 +1.9 PP +3.5% +2.2% KPIs SIGNIFICANTLY IMPROVED Results of AM MEUR 94.8
BERLINSIDERS HALF YEAR FINANCIAL REPORT
 2 0 1 7 BERLINSIDERS HALF YEAR FINANCIAL REPORT 2017 KEY FIGURES HALF YEAR FINANCIAL REPORT 2017 KEY FIGURES KEY BALANCE SHEET FIGURES In EUR thousand Jun 30, 2017 Dec 31, 2016 Fair value of properties
ANNUAL RESULTS 2015 MARCH 22, 2016
 ANNUAL RESULTS 2015 MARCH 22, 2016 01 OVERVIEW & INVESTMENT HIGHLIGHTS Overview ADO the pure-play Berlin residential specialist Investment highlights 1 2 3 4 Berlin residential pure play with a 1.5bn quality
JOINT REPORT. of the Management Board of WCM Beteiligungs- und Grundbesitz-Aktiengesellschaft. and. of the Management Board of TLG IMMOBILIEN AG
 Please note that this translation of the German-language Joint Report is for convenience purposes only. Only the German original of the Joint Report is legally valid and binding. No responsibility is assumed
S IMMO Q3 results November 2018
 S IMMO Q3 results 2018 27 November 2018 We develop value Highlights Q3 2018 Gross profit exceeds previous year s level Earnings per share increased to EUR 1.20 Record FFO I (almost +30% compared to previous
NINE MONTHS FINANCIAL RESULTS NOVEMBER 19, 2015
 NINE MONTHS FINANCIAL RESULTS NOVEMBER 19, 2015 01 ADO OVERVIEW AND INVESTMENT HIGHLIGHTS Overview ADO the pure play Berlin residential specialist Investment highlights 1 2 3 Berlin residential pure play
Agenda. About IREIT Global. Key Highlights. Portfolio Summary. Economy & Real Estate Review. Looking Ahead. Appendix : Overview of Tikehau Capital
 4Q 2017 and FY 2017 Results Presentation 14 February 2018 Agenda About IREIT Global Key Highlights Portfolio Summary Economy & Real Estate Review Looking Ahead Appendix : Overview of Tikehau Capital 2
Research Note. Fair Value REIT-AG
 Independent Research Unabhängige Finanzmarktanalyse GmbH Research Note Fair Value REIT-AG Preliminary results 2011 Please take note of the information concerning the preparation of this document, the informa-tion
BUY (previous: BUY) (previous: 3.70)
 (previous: 3.70)") October 22, 2015 Information Analysis Analysts Dipl.-Kfm. Stefan Scharff, CREA Dr. Roger Becker, CEFA +49 69 71 91 838-43, -46 stefan.scharff@bankm.de, roger.becker@bankm.de Evaluation result Fair value
October 22, 2015 Information Analysis Analysts Dipl.-Kfm. Stefan Scharff, CREA Dr. Roger Becker, CEFA +49 69 71 91 838-43, -46 stefan.scharff@bankm.de, roger.becker@bankm.de Evaluation result Fair value
13 th Kepler Cheuvreux German Corporate Conference Frankfurt, 22 January 2014 Rolf Buch, CEO
 1 Syndicate Analyst Presentation May 2013 13 th Kepler Cheuvreux German Corporate Conference Frankfurt, 22 January 2014 Rolf Buch, CEO Deutsche Annington: Innovation leader based on a long-term vision,
Fair Value REIT. Rationalising and reinvesting. Strategy: Simplify the structure and grow. Financials: Earnings to be cushioned by refinancing
 Fair Value REIT Rationalising and reinvesting Initiation of coverage Real estate FVI offers exposure to German commercial property, with creditworthy tenants in secondary, regional locations, which have
Aroundtown SA LATEST RUN RATES CONFIRM GROWTH PHASE. FIRST BERLIN Equity Research. Operational PRICE TARGET Ar ou
 FIRST BERLIN Equity Research Aroundtown SA RATING Germany / Real Estate Operational Frankfurt Stock Exchange PRICE TARGET 8.20 Bloomberg: AT1 GR update Return Potential 26.1% ISIN: LU1673108939 Risk Rating
Agenda. Key Highlights. Financial Highlights. Portfolio Summary. Economy & Real Estate Review. Looking Ahead
 1Q 2017 Results Presentation May 2017 Agenda Key Highlights Financial Highlights Portfolio Summary Economy & Real Estate Review Looking Ahead 2 Key Highlights 1Q 2017 Key Highlights Gross revenue held
CONSOLIDATED HALF-YEAR FINANCIAL REPORT
 CONSOLIDATED HALF-YEAR FINANCIAL REPORT FOR THE FIRST HALF-YEAR 2018 1 FRANKFURT AM MAIN CONSOLIDATED HALF-YEAR IFRS FINANCIAL REPORT FOR THE PERIOD 1 JANUARY TO 30 JUNE 2018 TABLE OF KEY FIGURES 1.1.
FINANCIAL RESULTS Q3 2018
 FINANCIAL RESULTS Q3 2018 November 14, 2018 OVERVIEW & INVESTMENT HIGHLIGHTS Chapter 01 Kapitel Titel ADO THE PURE PLAY BERLIN RESIDENTIAL SPECIALIST Investment highlights 1 Berlin residential pure play
Group interim report as of 30 June Creating today the city of tomorrow
 Creating today the city of tomorrow Contents 2 Group key figures 3 Group interim management report 18 Group interim financial statements 35 Further information 2 Deutsche Wohnen SE Group key figures Group
Rolling Up German Real Estate
 Rolling Up German Real Estate Initiative Immobilien-Aktie Frankfurt / Main Frank Schaich, CEO Page 1 1. Snapshot 2. Fair Value s strategy 3. Real estate portfolio 4. Direct investments 5. Participations
Next Generation Real Estate. HY 2008 Figures. Colonia Real Estate AG HY 2008 Figures 15 th of August 2008 Cologne
 Next Generation Real Estate HY 2008 Figures Colonia Real Estate AG HY 2008 Figures 15 th of August 2008 Cologne Focused and Integrated Business Model Colonia Real Estate AG Investments Management Principal
Quarterly Statement A S O F
 Quarterly Statement AS OF KEY FACTS Q3 / 2017 T 1 Key facts RESULTS OF OPERATIONS Q3 2017 Q3 2016 + / % / bp 01.01. 01.01. 30.09.2016 Rental income million 134.7 131.9 2.1 398.4 381.3 4.5 Net rental and
UBS Global Real Estate CEO/CFO Conference. December 1/2, 2015
 UBS Global Real Estate CEO/CFO Conference December 1/2, 2015 01 ADO OVERVIEW AND INVESTMENT HIGHLIGHTS Overview ADO the pure play Berlin residential specialist Investment highlights 1 2 3 Berlin residential
FIRST QUARTER 2017 INTERIM STATEMENT
 DEMIRE Deutsche Mittelstand Real Estate AG FIRST QUARTER 2017 INTERIM STATEMENT Fiscal Year January 1 Dezember 31 2017 Foreword of the Executive Board Dear Shareholders, With the quarterly statement for
3Q 2017 and 9M 2017 Results Presentation 9 November 2017
 3Q 2017 and 9M 2017 Results Presentation 9 November 2017 Agenda About IREIT Global Key Results Highlights Portfolio Summary Economy & Real Estate Review Looking Ahead Appendix : Overview of Tikehau Capital
Q1 Results Conference Call May 29, 2008
 Q1 Results 2008 Conference Call May 29, 2008 Agenda Operational Update Financial Highlights Outlook 2 Agenda Operational Update Financial Highlights Outlook 3 Portfolio Overview Deutsche Wohnen Group Residential
Q3 results November 2017
 Q3 results 2017 28 November 2017 S IMMO Our process to value creation 1 Purchase Using market niches Opportunistic buying 2 Leveraging potential Convincing track record in property development 3 Sale Country
Office Leasing and Investment Germany
 MARKET REPORT 217/218 Accelerating success. Office Leasing and Investment Germany Market Data Office Leasing TOP 7 BERLIN DÜSSELDORF FRANKFURT HAMBURG COLOGNE MUNICH STUTTGART STOCK OF OFFICE SPACE 9.52
Sandpiper Digital Payments AG
 December 18th, 2018 Research Comment Sandpiper Digital Payments AG Investment portfolio becomes more focused Rating: Speculative Buy (unchanged) Price: 0.072 Euro Price target: 0.22 Euro Analyst: Dipl.-Kfm.
CONTENT. 01 Highlights. 02 Portfolio Performance. 03 Optimisation of Financing Structure. 04 FY 2017 Results. 05 Outlook FY
 CONTENT 01 Highlights 02 Portfolio Performance 03 Optimisation of Financing Structure 04 FY 2017 Results 05 Outlook FY 2017 2 IMMOFINANZ RESTRUCTURING 5/2015 12/2017 Sale of logistics asset class - focus
FINANCIAL RESULTS Q2 2018
 FINANCIAL RESULTS Q2 2018 August 15, 2018 OVERVIEW & INVESTMENT HIGHLIGHTS Chapter 01 Kapitel Titel ADO THE PURE PLAY BERLIN RESIDENTIAL SPECIALIST Investment highlights A focused residential portfolio(,4)
H1/13 INTERIM FINANCIAL REPORT GROWING TOGETHER
 H1/13 INTERIM FINANCIAL REPORT DEVELOPING VALUE GROWING TOGETHER KWG AT A GLANCE CONSOLIDATED STATEMENT OF COMPREHENSIVE INCOME 3.6.213 3.6.212 3.6.211 Revenue in EUR million 22.5 12.7 1.1 Net basic rent
COMPANY PRESENTATION MARCH 2018 (AS PER )
") COMPANY PRESENTATION MARCH 2018 (AS PER 31.12.2017) DIC ASSET AG KEY STRENGTHS INVESTMENT HIGHLIGHTS S-DAX listed player in the commercial real estate market in Germany, fully complying to highest market
COMPANY PRESENTATION MARCH 2018 (AS PER 31.12.2017) DIC ASSET AG KEY STRENGTHS INVESTMENT HIGHLIGHTS S-DAX listed player in the commercial real estate market in Germany, fully complying to highest market
FY2017 Annual General Meeting 19 April 2018
 FY2017 Annual General Meeting 19 April 2018 Agenda Key Highlights About Tikehau Capital European Market Review Portfolio Overview Financial Highlights Conclusion 2 Key Highlights FY2017 Key Highlights
Baden-Baden CONSOLIDATED FINANCIAL STATEMENTS
 Baden-Baden CONSOLIDATED FINANCIAL STATEMENTS for the year ended December 31, 2016 Berlin CONTENT DECLARATION OF THE MEMBERS OF THE BOARD OF DIRECTORS 2-3 BOARD OF DIRECTORS REPORT 4-17 INDEPENDENT AUDITORS
Company presentation 9 monthly figures 2018 November 7, 2018
 Company presentation 9 monthly figures 2018 November 7, 2018 Company profile - strategy Develop-or-Buy-and-Hold strategy Sustainable financing strategy In-house portfolio management Long-term holding strategy
EQUINET INVESTIGATOR
 Hypoport 2 January 211 Financials Bloomberg: HYQ GR Market Cap: EUR 72m Free Float: 35% Current Share Price: EUR 11.8 Buy / Target EUR 17 Profile Hypoport is an internet-based financial services provider
Interim Report JANUARY TO SEPTEMBER 2017
 9M Interim Report JANUARY TO SEPTEMBER 2017 KEY FIGURES REVENUES AND EARNINGS in EUR k 2017 2016 ¹ 01.01. 30.09.2017 01.01. 30.09.2016 Change Revenues 163,006 163,935 0.6% Total operating performance 157,068
Fair Value REIT. Demire approach adds growth option. Investments looking forward. Potential combination with Demire. Valuation: Growth creating value
 Fair Value REIT Demire approach adds growth option Interim results and takeover approach Real estate Underlying interim results were effectively looking backwards to a period of portfolio rationalisation
Aroundtown Property Holdings Plc.
 FIRST BERLIN Equity Research Aroundtown Property Holdings Plc. RATING Germany / Real Estate Q1/17 Frankfurt Stock Exchange PRICE TARGET 6.40 Bloomberg: AT1 GR Results Return Potential 38.5% ISIN: CY0105562116
NEMETSCHEK GROUP Company Presentation. October 2015
 NEMETSCHEK GROUP Company Presentation October 2015 1 Agenda NEMETSCHEK GROUP: In brief.......3 Strategy... 6 Financials: First half of 2015.....12 NEMETSCHEK share.......21 Outlook.....25 Contact......27
Summary 1-2. Chairman's and Managing Director's report 3-9. Independent auditor s review report 10
 REPORT AND ACCOUNTS June 2018 INDEX Page Summary 1-2 Chairman's and Managing Director's report 3-9 Independent auditor s review report 10 Condensed Consolidated Statements of Financial Position 11-12 Condensed
S IMMO HY results August 2017
 S IMMO HY results 2017 29 August 2017 Ongoing success in 2017 Excellent HY results following record year 2016 Net income for the period more than tripled compared to HY 2015 Financing result improved by
ATRIUM COMPANY PRESENTATION
 ATRIUM COMPANY PRESENTATION THE LEADING OWNER & MANAGER OF CENTRAL EASTERN EUROPEAN SHOPPING CENTRES 1H2016 ATRIUM LEADING OWNER & MANAGER OF CEE SHOPPING CENTRES A UNIQUE INVESTMENT OPPORTUNITY Strong
5 November C Solarparken AG. FIRST BERLIN Equity Research
 FIRST BERLIN Equity Research 5 7C Solarparken AG 7 RATING Germany / Cleantech Primary Exchange: Frankfurt Next growth phase PRICE TARGET 3.00 Bloomberg: HRPK GF Return Potential 30.4% ISIN: DE000A11QW68
Agenda. About IREIT Global. Key Highlights. Portfolio Summary. Economy & Real Estate Review. Looking Ahead. Appendix : Overview of Tikehau Capital
 2Q 2017 and 1H 2017 Results Presentation 10 August 2017 Agenda About IREIT Global Key Highlights Portfolio Summary Economy & Real Estate Review Looking Ahead Appendix : Overview of Tikehau Capital 2 About
Mensch und Maschine SE
 Success story continues sc-consult GmbH Equity-Research Rating: Buy (unchanged) Price: 13.07 Euro Price target: 16.20 Euro Alter Steinweg 46 48143 Münster T +49(0)251 13476-93/-94 F +49(0)251 13476-92
Strong first half of 2016 on office leasing markets and investment markets
 Germany Market Report and Investment Market H1 2016 Strong first half of 2016 on office leasing markets and investment markets Susanne Kiese Head of Research Letting The German office leasing market is
BUY (previous: BUY) (previous: 3.40)
 (previous: 3.40)") June 10, 2016 Information Analysis Analysts Dipl.-Kfm. Stefan Scharff, CREA Dr. Roger Becker, CEFA +49 69 71 91 838-43, -46 stefan.scharff@bankm.de, roger.becker@bankm.de Evaluation result Fair value BUY
June 10, 2016 Information Analysis Analysts Dipl.-Kfm. Stefan Scharff, CREA Dr. Roger Becker, CEFA +49 69 71 91 838-43, -46 stefan.scharff@bankm.de, roger.becker@bankm.de Evaluation result Fair value BUY
15th Annual General Meeting June 2016
 15th Annual General Meeting + 28 June 2016 conwert is a fully integrated real estate company focusing on residential properties and apartment buildings in Austria and Germany, This focus is complemented
BUILDING THE FUTURE TOGETHER HALF YEAR REPORT AS OF JUNE 30, 2017
 HALF YEAR REPORT AS OF JUNE 30, 2017 BUILDING THE FUTURE TOGETHER To our shareholders Patrik Heider, Spokesman of the Executive Board and CFOO The Nemetschek Group has continued on its course of dynamic
This document is a non-binding translation only. For the binding document please refer to the German version, published under
 Q1 Interim Report First Quarter 2015 This document is a non-binding translation only. For the binding document please refer to the German version, published under www.adler-ag.com 2 Interim report for
1Q2018 Results Presentation 10 May2018
 1Q2018 Results Presentation 10 May2018 Agenda About IREIT Global Key Highlights Portfolio Summary European Market Review Looking Ahead Appendix : Overview of Tikehau Capital 2 About IREIT Global About
Advanced Vision Techn Buy
 16/9/13 16/11/13 16/1/14 16/3/14 16/5/14 16/7/14 16/9/14 16/11/14 16/1/15 16/3/15 16/5/15 16/7/15 MATELAN Research Update Note Closing price as of 13/8/15: 9.16 14 August 215 Company / Sector Fair Value
NOT RATED. (previously Buy) (previously 1.73) adj. net (mln ) DPS ( ) adj. EPS ( )
 (previously 1.73) adj. net (mln ) DPS ( ) adj. EPS ( )") 7 September 2010 Information analysis Analyst Dr. Roger Becker, CEFA, Biologist +49 69 71 91 838-46 roger.becker@bankm.de Evaluation result NOT RATED Fair value (previously Buy) (previously 1.73) Sales
7 September 2010 Information analysis Analyst Dr. Roger Becker, CEFA, Biologist +49 69 71 91 838-46 roger.becker@bankm.de Evaluation result NOT RATED Fair value (previously Buy) (previously 1.73) Sales
Adler Real Estate AG. Fewer vacancies, more properties. Buy (Buy) EUR (16.50 EUR ) BANKHAUS LAMPE // 1 28/03/2017
 EUR (16.50 EUR ) BANKHAUS LAMPE // 1 28/03/2017") BANKHAUS LAMPE // 1 Adler Real Estate AG Fewer vacancies, more properties 28/03/2017 Buy (Buy) 17.00 EUR (16.50 EUR ) Close 24/03/2017 13.92 EUR Bloomberg: ADL GY WKN: 500800 Sector Share price performance
BANKHAUS LAMPE // 1 Adler Real Estate AG Fewer vacancies, more properties 28/03/2017 Buy (Buy) 17.00 EUR (16.50 EUR ) Close 24/03/2017 13.92 EUR Bloomberg: ADL GY WKN: 500800 Sector Share price performance
KEY FIGURES PROFIT OR LOSS STATEMENT. For the year ended. For the three months ended. In EUR thousand March 31, 2018 March 31, 2017 Dec 31, 2017
 Three-Month Financial Report 2018 KEY FIGURES MISSION STATEMENT KEY FIGURES PROFIT OR LOSS STATEMENT For the three months ended For the year ended In EUR thousand March 31, 2018 March 31, 2017 Dec 31,
Fast and sustainable, profitable growth. Company profile (February 2019)
") Fast and sustainable, profitable growth. Company profile (February 219) Equity Story Highly profitable player with strong growth prospects on attractive real estate markets Sustainable, profitable business
Fast and sustainable, profitable growth. Company profile (February 219) Equity Story Highly profitable player with strong growth prospects on attractive real estate markets Sustainable, profitable business
Telstra Financial Analysis Report Fy2009 Fy2013
 Journal of Finance and Accounting 2015; 3(5): 150-158 Published online August 25, 2015 (http://www.sciencepublishinggroup.com/j/jfa) doi: 10.11648/j.jfa.20150305.16 ISSN: 2330-7331 (Print); ISSN: 2330-7323
PrimeCity Investment Plc
 A cc or # $TypCap$ 1628 1 0 4 2 Page 1/8 Equity flash Trading Update Real Estate BUY (BUY) Target 5.60 EUR (5.60 EUR) Price (last closing price) : 3.40 EUR Upside : 65 % Est. change 2015e 2016e FFO I PS
Evaluation result Fair value DPS. adj. net. adj. EPS ( )
") May 27, 2010 Information analysis Evaluation result Fair value Analyst BUY 1.73 Dr. Roger Becker, CEFA, Biologist +49 69 71 91 838-46 roger.becker@bankm.de (previously BUY) (previously 1.73) Acquisition
May 27, 2010 Information analysis Evaluation result Fair value Analyst BUY 1.73 Dr. Roger Becker, CEFA, Biologist +49 69 71 91 838-46 roger.becker@bankm.de (previously BUY) (previously 1.73) Acquisition
Quarterly statement
 www.deutsche-boerse.com Quarterly statement Quarter 1 / 2016 2 Deutsche Börse Group quarterly statement Q1/2016 Q1/2016: Deutsche Börse Group continues growth path Quarterly results at a glance Deutsche
2Q 2014 RESULTS ANALYST AND INVESTOR UPDATE. August 27, 2014
 2Q 214 RESULTS ANALYST AND INVESTOR UPDATE August 27, 214 1H 14 results Highlights Achievements 1H 214 Key metrics 1H 214 ( m) Strategy Sale of 25% holding in Austrian developer UBM AG reduces non-strategic
GLOBAL. Bears reflected in bond yields 31 August 2017 MARKET OVERVIEW
 UK Japan USA Index Australia Hong Kong Singapore Europe Canada SA GLOBAL MARKET OVERVIEW After ending the month of July 1.9% higher, Global REITs partially gave back the returns and closed 0.16% lower
DEMIRE Deutsche Mittelstand Real Estate AG. Fiscal Year 1 January 31 December 2017
 DEMIRE Deutsche Mittelstand Real Estate AG Third Quarter 2017 Interim Statement Fiscal Year 1 January 31 December 2017 Foreword of the Executive Board Dear Shareholders, It is with great satisfaction that