Please turn to page two.
|
|
|
- Rudolph Griffith
- 5 years ago
- Views:
Transcription

1 I will now give you an overview of our financial results for the full year and fourth quarter ended March 2014, using the document titled Consolidated Results of Operations. Please turn to page two.
2 1

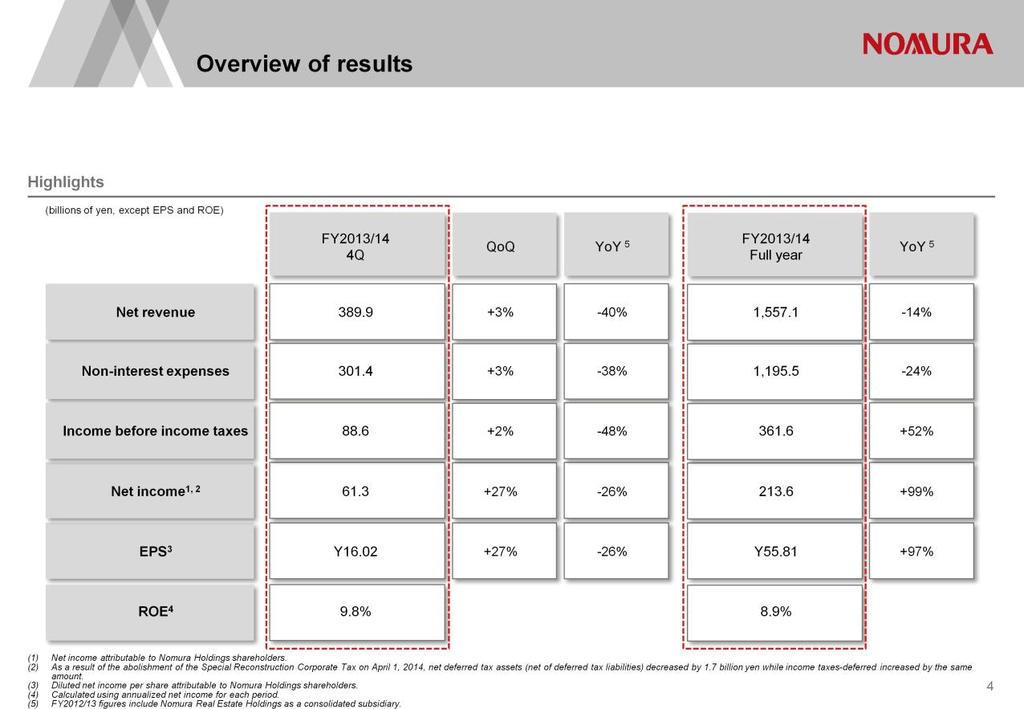
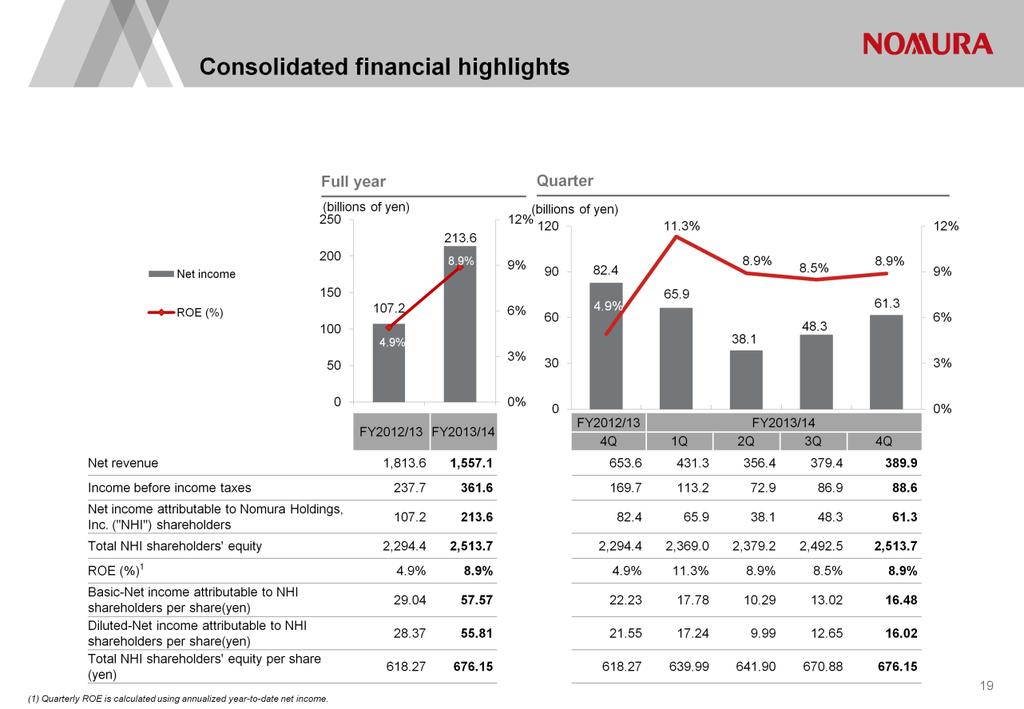
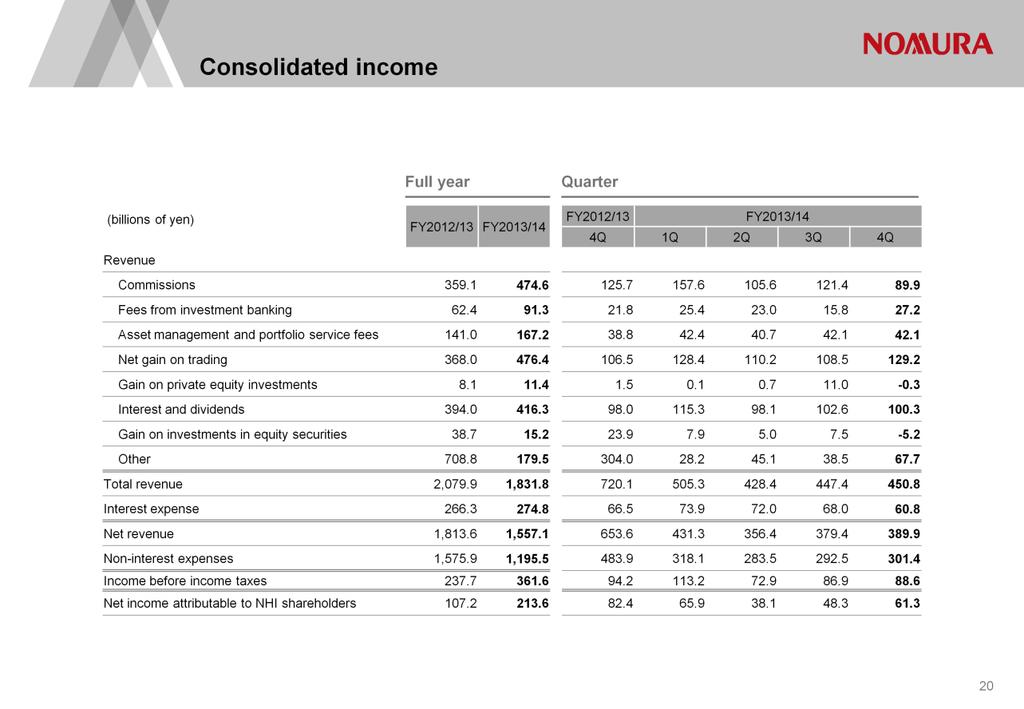
3 First, the full year results. As shown on the right, all business segments reported significantly higher pretax income, driven by the stock market rally in Japan and successful initiatives to improve profitability. As a result, Group earnings were at their highest level since the year ended March Net revenue for the full year was 1,557.1 billion yen, representing a decline of 14 percent compared to last year due to the deconsolidation of Nomura Real Estate Holdings. Excluding this, revenues increased year on year. Pretax income grew by 52 percent from the prior year to billion yen and net income roughly doubled, increasing by 99 percent to billion yen. ROE for the full year was 8.9 percent and earnings per share was yen. We have announced a year-end dividend of 9 yen per share for shareholders of record as of March 31, That takes our annual dividend to 17 yen per share, giving a dividend payout ratio of 29.5 percent. In addition, our Board of Directors today approved a resolution to set up a share buyback program in order to raise capital efficiency and ensure a flexible capital policy. The total number of shares to be repurchased is 100 million, which equates to 2.6 percent of outstanding shares, and the maximum value is 70 billion yen. Of these 100 million shares, 44 million will be used for stock options exercised in the future. The remaining 56 million will be used flexibly for various purposes related to our capital management policy. Please turn to page three for an overview of our fourth quarter results. 2

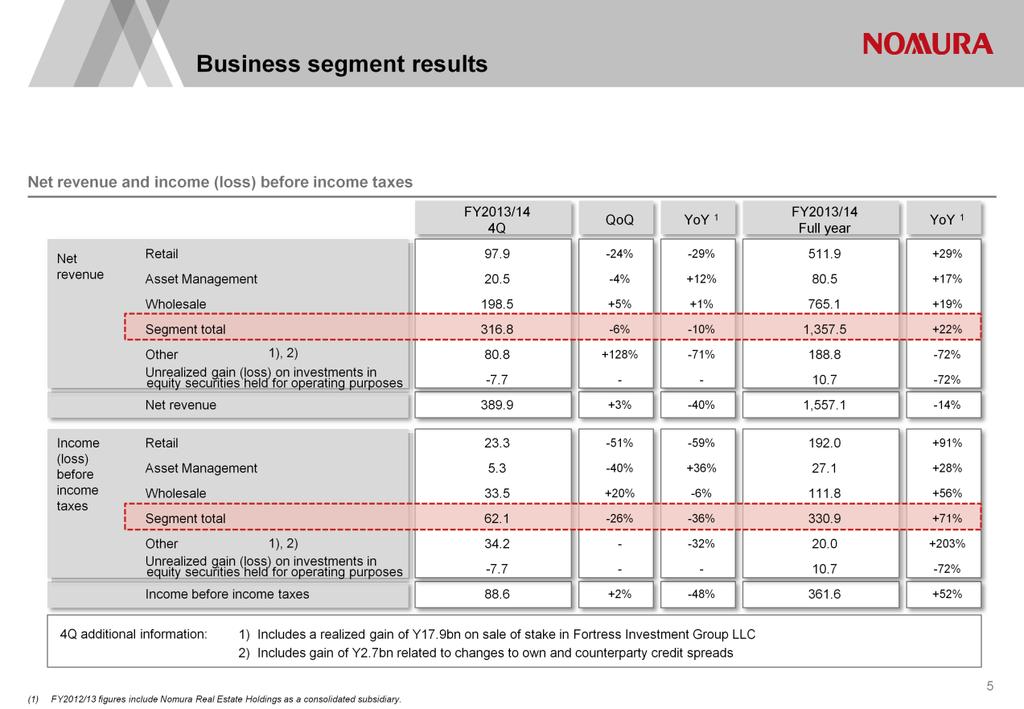
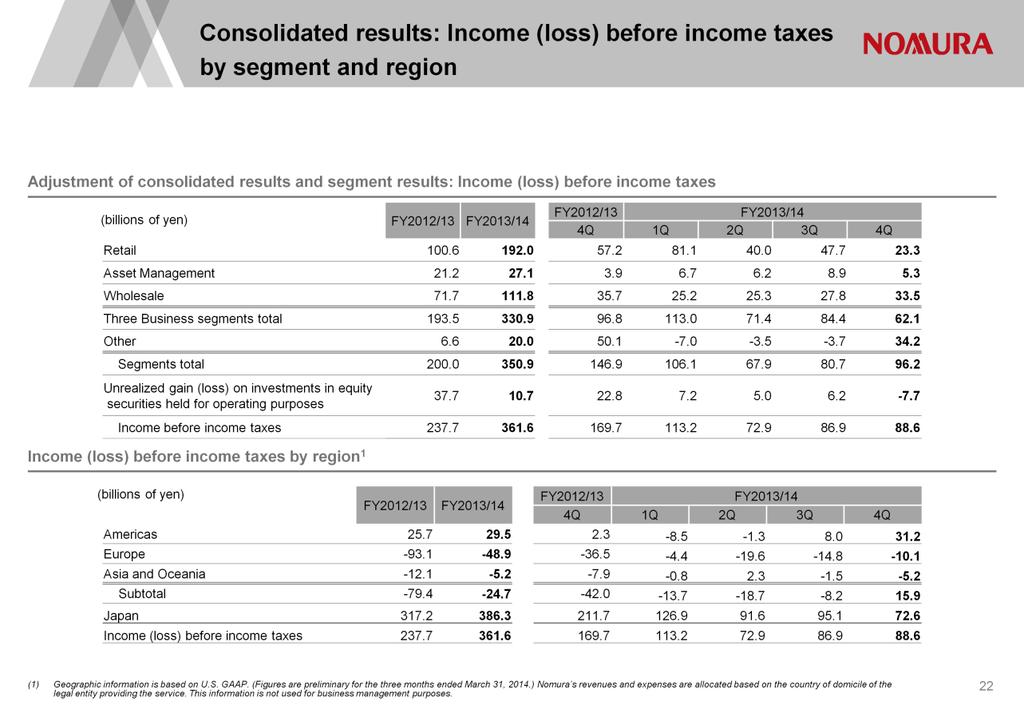
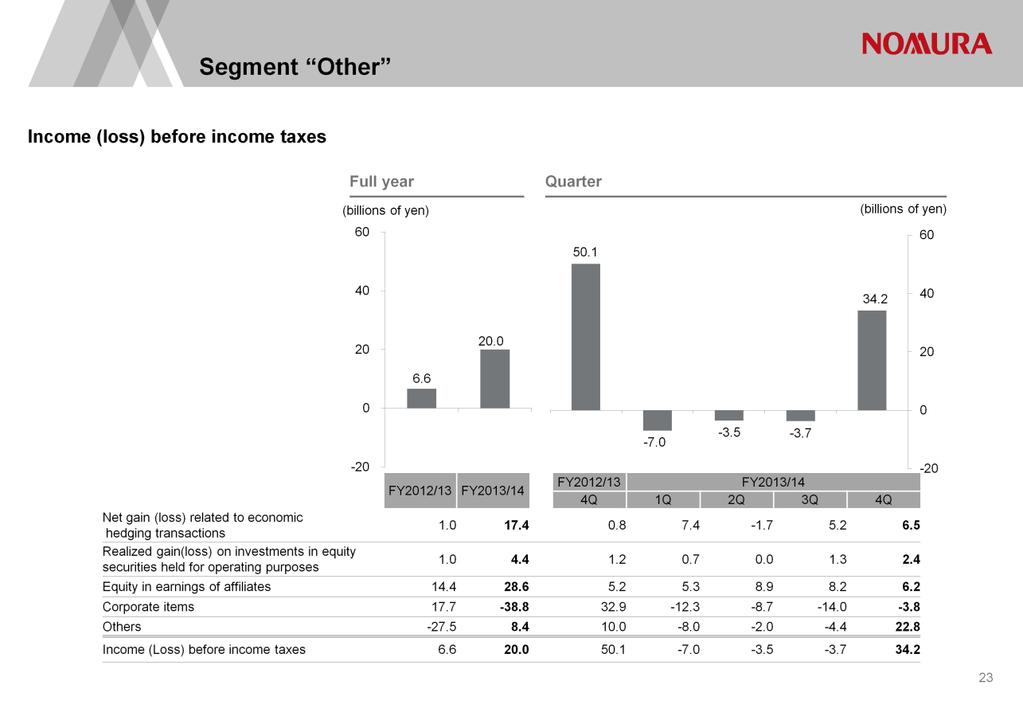
4 At the Group level, robust performance in our international operations and a realized gain on the sale of an equity stake more than offset a slowdown in Japan-related businesses, resulting in stronger revenues and pretax income compared to last quarter. International pretax income was 15.9 billion yen, a marked improvement from the pretax loss last quarter. Group net revenue was billion yen, pretax income was 88.6 billion yen, net income was 61.3 billion yen, and annualized ROE for the quarter was 9.8 percent. Pretax income from the three business segments totaled 62.1 billion yen, down 26 percent from the previous quarter. Retail reported a slowdown from the third quarter as market conditions deteriorated and demand declined following the end of tax breaks. Wholesale reported stronger pretax income driven by solid revenues in the Americas and EMEA. I will discuss each business in more detail in a moment. Pretax income in the Other segment was 34.2 billion yen. This includes a 17.9 billion yen gain from the sale of our stake in Fortress. A gain of 2.7 billion yen from changes to our own and counterparty credit spreads is also included here. Today we announced impairment charges in Nomura Holdings unconsolidated financial statements related to investments in subsidiaries. You will see in footnote 1 that the majority of the charges have been included as the financial results of these subsidiaries in our consolidated financial results through to the third quarter. Please turn to page 6 for an overview of Retail. 3
5 4
6 5

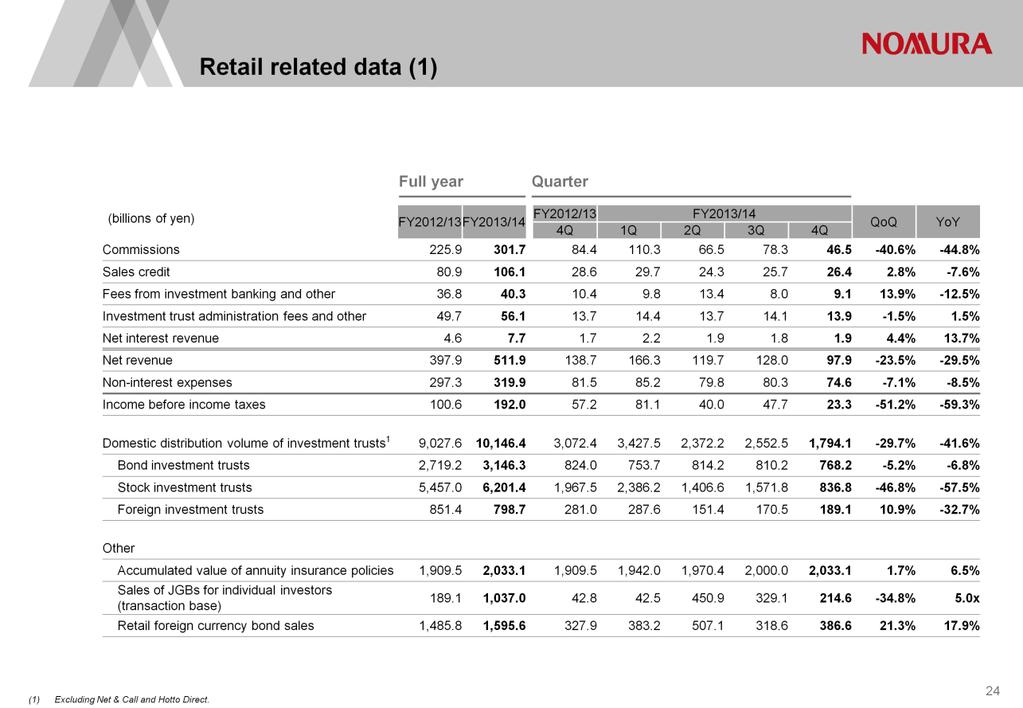
7 Full year net revenue in Retail was billion yen, an increase of 29 percent year on year. Pretax income jumped 91 percent to billion yen, which is close to record levels since the year ended March Fourth quarter net revenue was 97.9 billion yen and pretax income was 23.3 billion yen. Market uncertainty and a drop off in demand following the end of tax breaks led to lower revenues and pretax income quarter on quarter. Please turn to page seven. 6

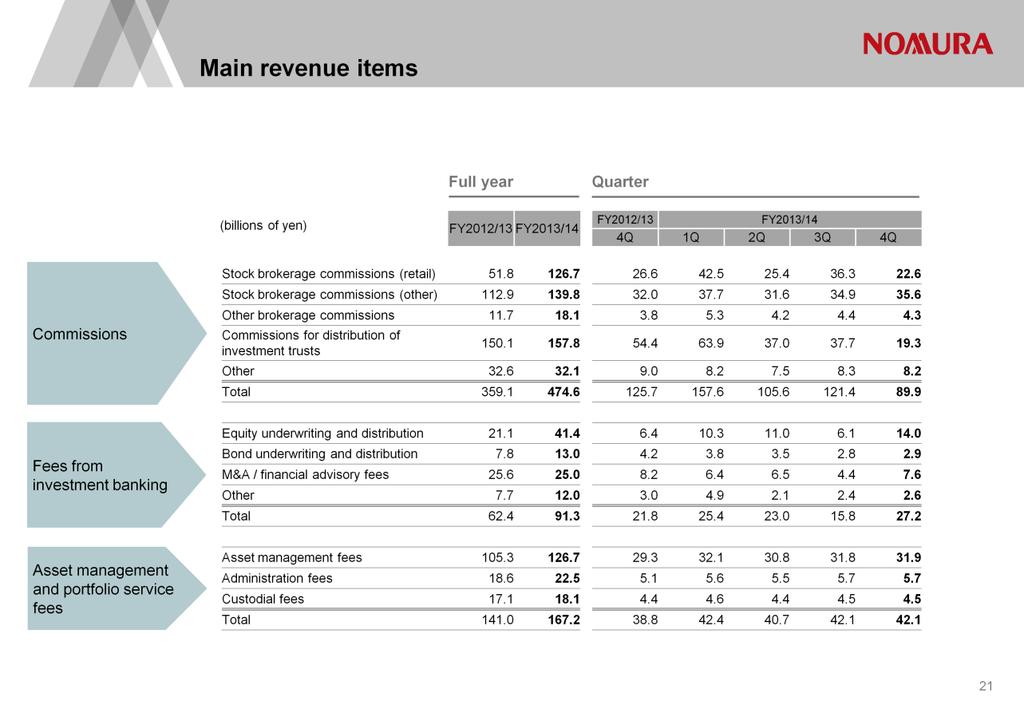
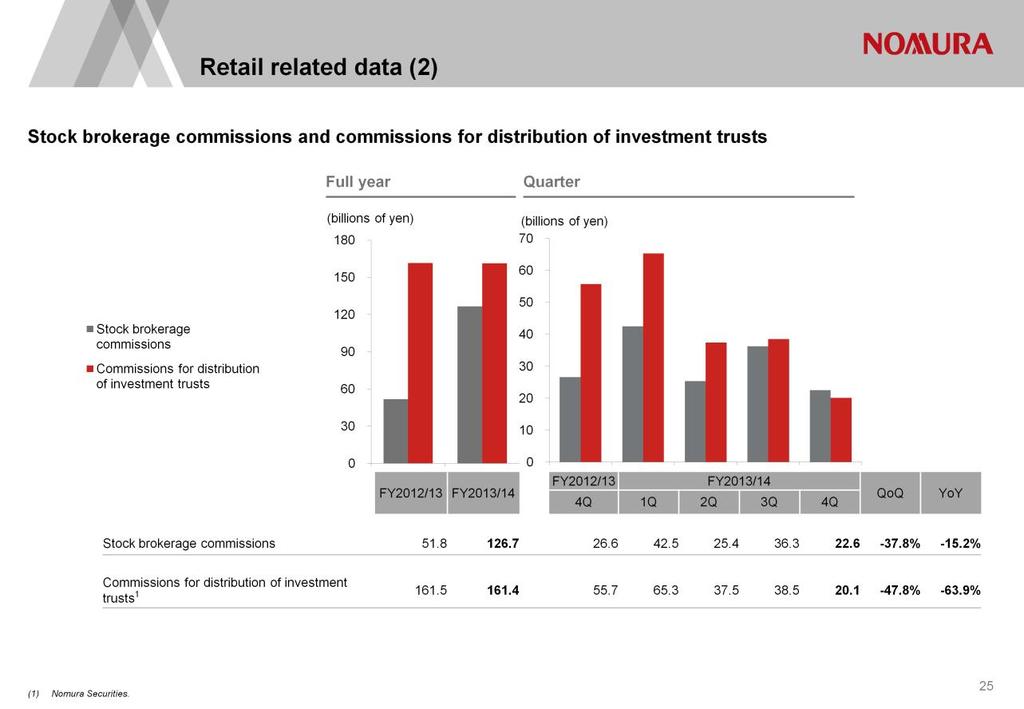
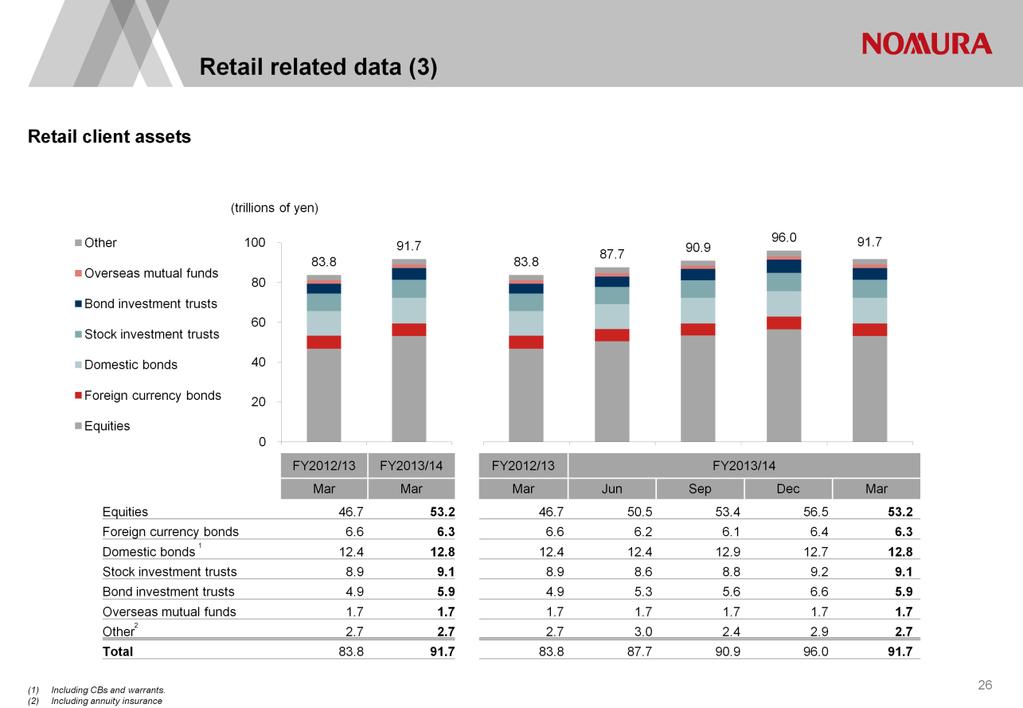
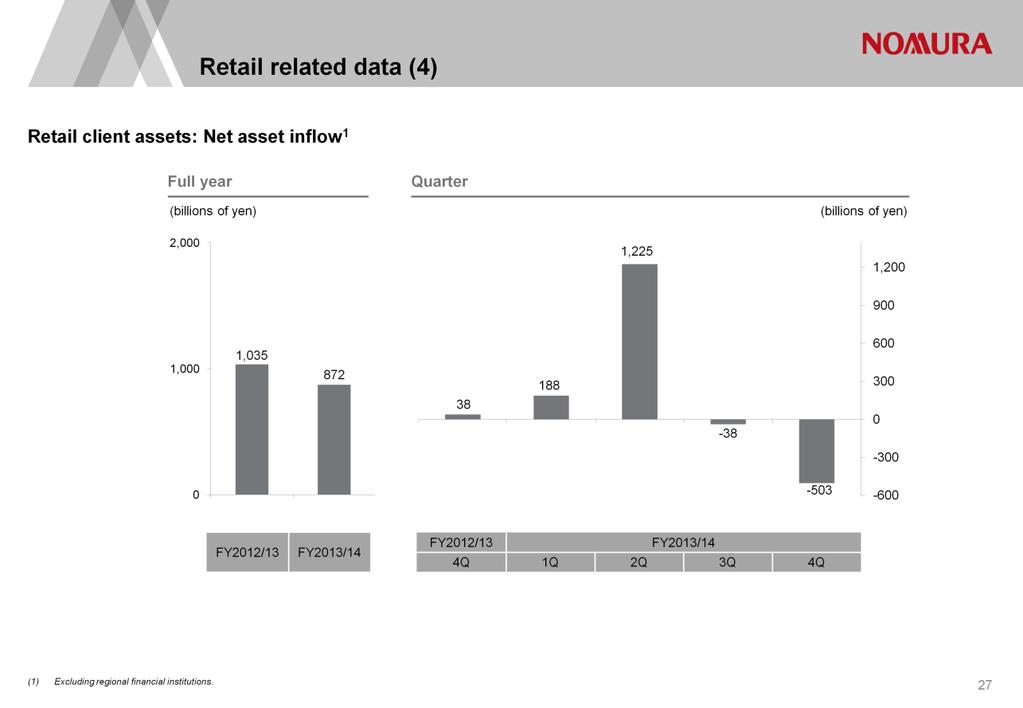
8 Looking at each product, sales of stocks and investment trusts slowed with total sales declining 23 percent from the previous quarter. As shown on the bottom left, recurring revenue showed steady growth at 54.5 billion yen on an annualized basis. Although client assets in investment trusts declined due to market factors, as shown on the bottom right, net inflows into investment trusts and discretionary accounts, both of which are sources of recurring revenue, totaled billion yen. As shown on the bottom left, Retail client assets reported net outflows of billion yen due mainly to an outflow of corporate funds related to the end of the fiscal year. The majority of these outflows have returned as inflows in April. We will continue to work towards ensuring a sustainable revenue structure by focusing more on providing consulting based services that emphasize longterm investment. Please turn to page eight for Asset Management. 7
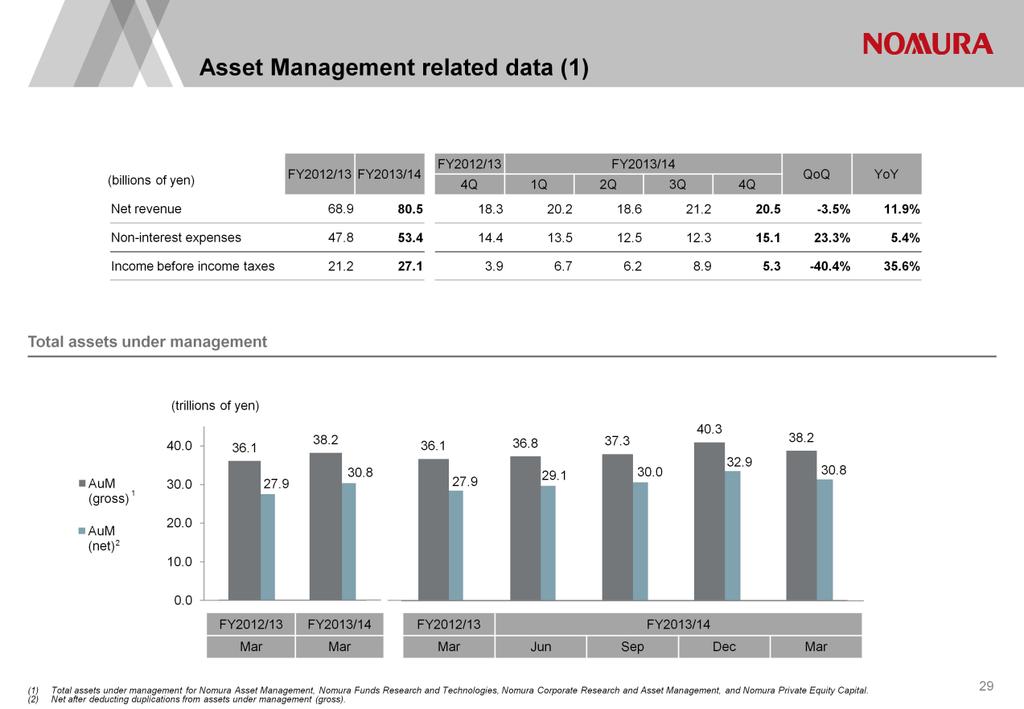
9 Full year net revenue increased 17 percent to 80.5 billion yen. Pretax income increased 28 percent year on year to 27.1 billion yen, the best year since the year ended March Fourth quarter net revenue was 20.5 billion yen, down 4 percent compared to the previous quarter which included dividend income. Revenues remained strong, supported by an increase in performance fees. Pretax income declined 40 percent sequentially to 5.3 billion yen due to a oneoff charge related to an asset revaluation. Please turn to page nine. 8

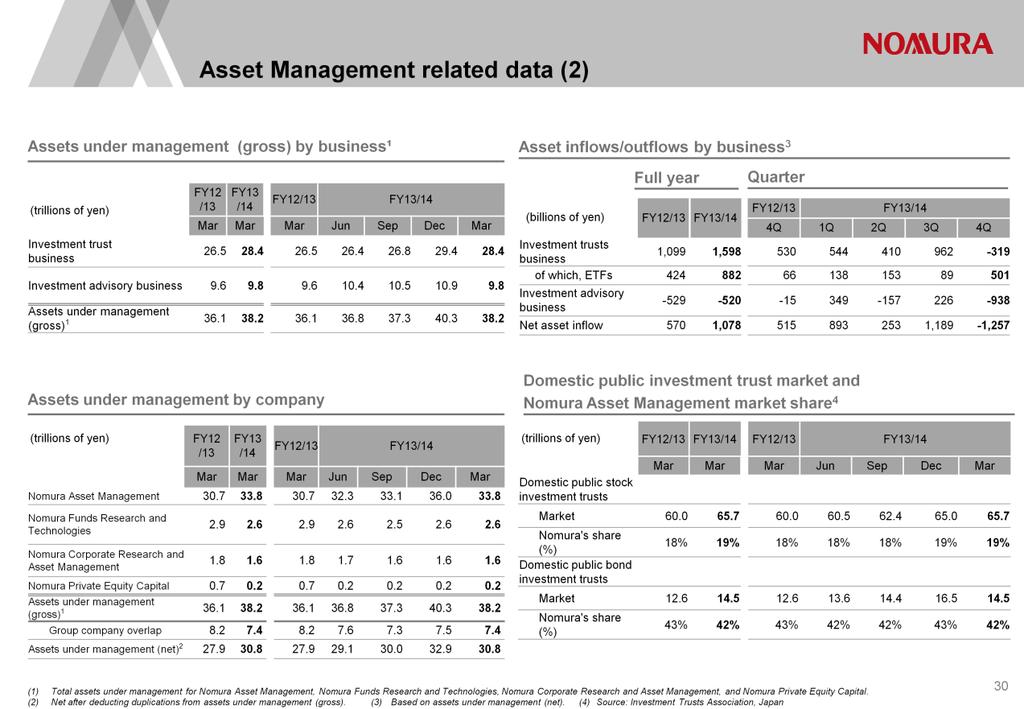
10 The graph on the bottom left shows investment trust net inflows, excluding ETFs, of 873 billion yen in the third quarter and 820 billion yen of net outflows in the fourth quarter. This is due to fluctuations in MRFs. Last quarter, clients parked funds gained from selling out of positions before the end of tax breaks into MRFs. During the fourth quarter, these funds flowed back into investment trusts, stocks including ETFs, JGBs for individuals, foreign bonds, and other products. ETFs reported net inflows of 501 billion yen, boosting assets under management in ETFs to 4 trillion yen. The acquisition of ING Group s Taiwanese subsidiary that I mentioned last quarter has been approved by local regulators and the company became a consolidated subsidiary of Nomura Holdings in April. Please turn to page 10 for an update of Wholesale. 9
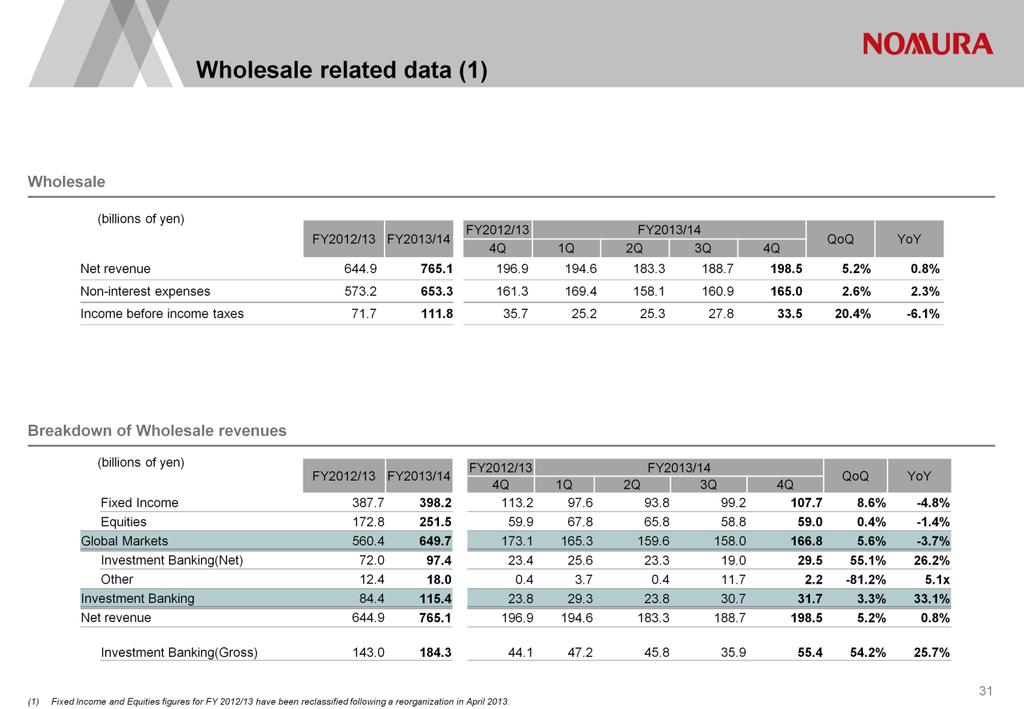
11 Full year net revenue in Wholesale was billion yen with all regions and business lines reporting stronger revenues year on year. Successful strategic refinement and cost reduction initiatives contributed to the strongest pretax income since the year ended March 2010 at billion yen. Fourth quarter net revenue increased 5 percent quarter on quarter to billion yen. Pretax income grew 20 percent to 33.5 billion yen as solid performance in the Americas and EMEA more than offset a slowdown in Japan and AEJ. Please turn to page 11 for an overview of fourth quarter results for each business line. 10

12 First, Global Markets. Fixed Income net revenue increased 9 percent to billion yen. The heat map on the top right shows a solid quarter in Rates and Securitized Products in the Americas, and resilient performance in Rates and Credit in EMEA. Japan reported higher revenues compared to the prior quarter, which was impacted by a change to our derivative valuation method. In AEJ, the FX business had a challenging quarter particularly in emerging market currencies. Equities net revenue was 59 billion yen, roughly in line with the prior quarter as stronger revenues from Cash Equities and Derivatives in the Americas and EMEA offset a slowdown in Japan and AEJ. Please turn to page 12 for Investment Banking. 11

13 Net revenue of 31.7 billion yen was 3 percent higher than the strong third quarter, which included private equity unrealized gains, reflecting a solid quarter in Japan and significant growth across all international regions. Investment Banking gross revenue, shown at the top of the graph on the top left, was 55.4 billion yen, the best quarter since December 2010 when there was a rush of equity financing among Japanese corporates. In Japan, revenues were driven by high-profile ECM deals, while revenues from new products and solutions businesses continued to grow. Internationally, net revenue roughly doubled both quarter on quarter and year on year. We executed a number of cross-border multi-product M&A deals and solutions businesses. Please turn to page 13 for an overview of expenses. 12

14 Full year group-wide expenses totaled 1,195.5 billion yen, representing a 24 percent decline compared to last year due to the deconsolidation of Nomura Real Estate Holdings. Excluding Nomura Real Estate Holdings, expenses increased by 12 percent on the back of improved performance and yen depreciation. Fourth quarter expenses edged up 3 percent quarter on quarter to billion yen. Other expenses increased 24 percent due to the one-off charge related to the revaluation of an asset held by Asset Management, the decommissioning of IT systems related to Global Markets, and higher consultant fees related to international transactions. 13

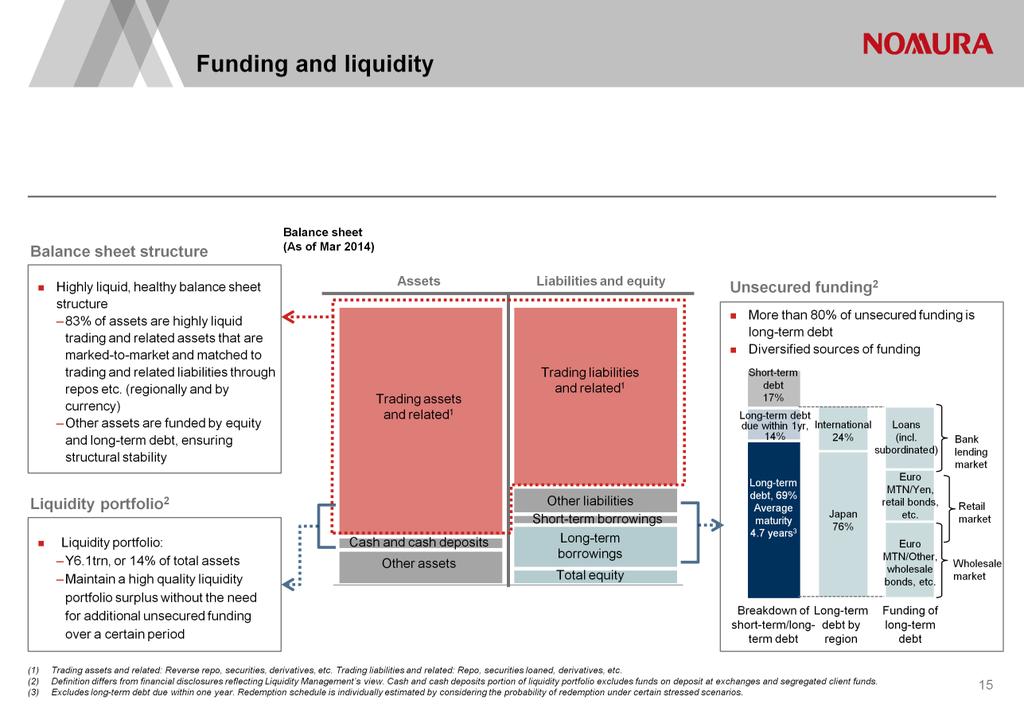
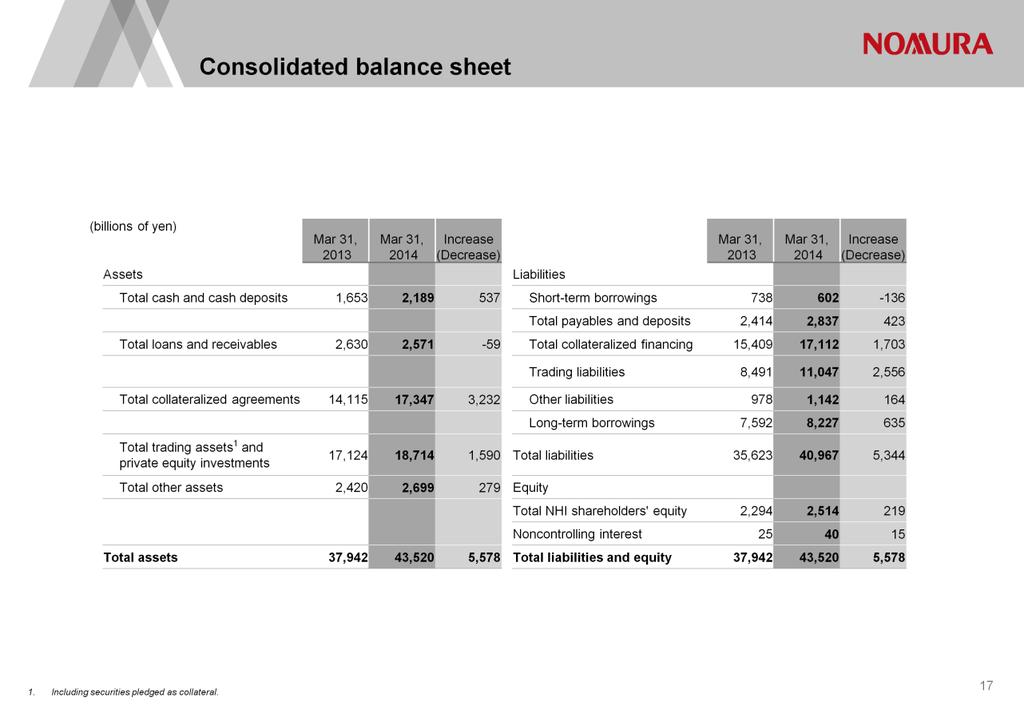
15 Page 14 shows our balance sheet. Total assets were 43.5 trillion yen. Gross leverage was 17.3 times and net leverage was 10.4 times. Our Basel 3 Tier 1 and Tier 1 common ratios were both 13.3 percent, which is an improvement from 12 percent at the end of December. This is mostly due to a decline in exposure to lower-rated counterparties, which reduced our riskweighted assets. Applying the fully loaded Basel standard to our balance sheet at the end of March gives a Tier 1 ratio of 12.2 percent. At the start of the presentation, I mentioned that we are setting up a share buyback program. We will continue to keep a close watch on the regulatory environment and deploy retained earnings required for growth, while taking a flexible approach to using surplus capital, including to enhance shareholder returns such as dividends and share buybacks. That concludes the presentation on our full year and fourth quarter results. 14
16 15

17
18 17
19 18
20 19
21 20
22 21
23 22
24 23
25 24
26 25
27 26
28 27
29 28
30 29
31 30
32 31
33 32
34 33
35
36
NOMURA Half Year Report for the 115th Fiscal Year (From April 1, 2018 to September 30, 2018)
") This document is a translation of the Japanese language original prepared solely for convenience of reference. In the event of any discrepancy between this translated document and the Japanese language
This document is a translation of the Japanese language original prepared solely for convenience of reference. In the event of any discrepancy between this translated document and the Japanese language
Consolidated Results of Operations Second quarter, year ending March 2018
 Connecting Markets East & West Consolidated Results of Operations Second quarter, year ending March 2018 (US GAAP) Nomura Holdings, Inc. October 2017 Nomura Outline Presentation Executive summary (p. 2-3)
Consolidated Results of Operations Fourth quarter, year ended March 2017
 Connecting Markets East & West Consolidated Results of Operations Fourth quarter, year ended March 2017 (US GAAP) Nomura Holdings, Inc. April 2017 Nomura Outline Presentation Executive summary (p. 2-3)
Consolidated Results of Operations Third quarter, year ending March 2017
 Connecting Markets East & West Consolidated Results of Operations Third quarter, year ending March 2017 (US GAAP) Nomura Holdings, Inc. January 2017 Nomura Outline Presentation Executive summary (p. 2)
Creditor Presentation First quarter, year ending March 2015
 Connecting Markets East & West Creditor Presentation First quarter, year ending March 2015 Nomura Holdings, Inc. August 2014 Nomura Outline Presentation Executive Summary (p. 3) Overview of Results (p.
Creditor Presentation
 Creditor Presentation Fourth Quarter, Fiscal Year Ended ch 213 Nomura Holdings, Inc. April 213 Nomura Disclaimer This document is produced by Nomura Holdings, Inc. ( Nomura ). Nothing in this document
Connecting Markets East & West. Investor Day. FY2015/16 overview of results. Takumi Kitamura CFO Nomura Holdings, Inc. April 27, 2016.
 Connecting Markets East & West Investor Day overview of results Takumi Kitamura CFO Nomura Holdings, Inc. April 27, 2016 Nomura Executive summary full year highlights Smooth start to year, but earning
Consolidated Results of Operations Third quarter, year ending March 2018
 Connecting Markets East & West Consolidated Results of Operations Third quarter, year ending March 2018 (US GAAP) Nomura Holdings, Inc. February 2018 Nomura Outline Presentation Executive summary (p. 2)
Selected Financial Information For the Fiscal Year Ended March 31, JAPAN POST BANK Co., Ltd. May 13, 2016
 Selected Financial Information For the Fiscal Year Ended March 31, 2016 JAPAN POST BANK Co., Ltd. May 13, 2016 Contents Financial Highlights 1. Overview of FY2016/3 Results P. 2 2. Trend of Net Interest
Nomura Investors Day Wholesale Division Update. April 28, President and Chief Executive Officer, Wholesale Division
 Nomura Investors Day 2010 Wholesale Division Update April 28, 2011 Jesse Bhattal Jesse Bhattal President and Chief Executive Officer, Wholesale Division Executive Summary Challenged financial performance
Presentation at Nomura Investment Forum 2014
 Connecting Markets East & West Presentation at Nomura Investment Forum 2014 Koji Nagai Group CEO Nomura Holdings, Inc. December 2, 2014 Nomura 1. Introduction Update on progress of FY2015/16 management
NOMURA HOLDINGS, INC. Financial Highlights Year ended March 2014
 News Release April 30, 2014 NOMURA HOLDINGS, INC. Financial Highlights Year ended March 2014 We are pleased to report the following consolidated financial highlights based on consolidated financial information
NOMURA HOLDINGS, INC. Financial Highlights Year ended March 2013
 News Release April 26, 2013 NOMURA HOLDINGS, INC. Financial Highlights Year ended March 2013 We are pleased to report the following consolidated financial highlights based on consolidated financial information
Deutsche Bank Management Report 2 Interim Report as of September 30, 2015 Operating and Financial Review Deutsche Bank Performance
 Deutsche Bank Management Report Interim Report as of September 30, 05 Operating and Financial Review Deutsche Bank Performance Management Report Operating and Financial Review Economic Environment The
CEO COMMENTARY FOURTH QUARTER 2017 RESULTS AND KEY METRICS. Adjusted ROE: 6.5% 2 Adjusted RoTCE ex. DTA: 8.9% 3. Adjusted Payout Ratio 187% 6
 On February 23, 2018, Citi announced that it was adjusting downward its fourth quarter and full year 2017 financial results, from those reported on January 16, 2018, due to an updated estimate for a one-time,
Fourth Quarter and Full-Year 2012 Results
 As announced on March 14, 2013, certain Credit Suisse Group entities have entered into agreements with bond investors of affiliates of National Century Financial Enterprises, Inc. (NCFE) to end all bond
UBS continues with successful execution of accelerated strategy
 Investor Relations Tel. +41-44-234 41 00 Media Relations Tel. +41-44-234 85 00 5 February 2013 News Release UBS continues with successful execution of accelerated strategy UBS full-year adjusted pre-tax
Summary of Financial Results for Fiscal 2017 <Under Japanese GAAP> May 15, 2018
 Summary of Financial Results for Fiscal 07 May 5, 08 Contents Overview of Income Statement Overview of Balance Sheet Overview of Loans Non-interest Income P. P.3 P.4 P.5 Financial
Financial and Economic Environment
 Five-Year Major Financial Data (FY 212-FY 216) Financial Data / Corporate Data Financial Review for Fiscal 216 FY 212 FY 213 FY 214 FY 215 FY 216 Currency exchange rate (USD/JPY) (yen) 94.5 12.92 12.17
Consolidated Results of Operations (US GAAP)
") Consolidated Results of Operations (US GAAP) Fourth quarter, year ended March 29 Nomura Holdings, Inc. April 29 1 1. This document is produced by Nomura Holdings, Inc. ("Nomura"). Copyright 29 Nomura Holdings,
Consolidated Results of Operations (US GAAP) Fourth quarter, year ended March 29 Nomura Holdings, Inc. April 29 1 1. This document is produced by Nomura Holdings, Inc. ("Nomura"). Copyright 29 Nomura Holdings,
1 Economic Overview. Securities Market in 2009
 1 1 Economic Overview Securities Market in 29 In retrospect, the Japanese economy in 29 experienced a severe recession in the wake of the global economic stagnation and financial uncertainty caused by
Full Year and Fourth Quarter 2018 Earnings Results
 Full Year and Fourth Quarter Earnings Results Media Relations: Jake Siewert 212-902-5400 Investor Relations: Heather Kennedy Miner 212-902-0300 The Goldman Sachs Group, Inc. 200 West Street New York, NY
Interim Report as of September 30, 2017
 Interim Report as of September 30, 2017 The Group at a glance Nine months ended Sep 30, 2017 Sep 30, 2016 Key financial information Post-tax return on average shareholders equity 3.5 % 1.0 % Post-tax return
Consolidated Balance Sheet - 1/2
 Consolidated Balance Sheet March 31, 212 ASSETS CURRENT ASSETS: Cash and cash equivalents (Notes 8 and 19) Time deposits over three months (Note 19) Receivables (Note 19): Trade notes (Note 11) Trade accounts
Private Banking pre-tax income of CHF 0.9 billion with net new assets of CHF 18.0 billion
 CREDIT SUISSE GROUP AG Paradeplatz 8 Telephone +41 844 33 88 44 P.O. Box Fax +41 44 333 88 77 CH-8070 Zurich media.relations@credit-suisse.com Switzerland Media Release Credit Suisse Group reports underlying*
NOMURA HOLDINGS, INC. Financial Summary Year ended March 31, 2017
 News Release April 27, 2017 NOMURA HOLDINGS, INC. Financial Summary Year ended 2017 We are pleased to report the following consolidated financial summary based on the consolidated financial information
Financial Summary for the 1st Half of Fiscal Year November 21, 2018
 Financial Summary for the 1st Half of Fiscal Year 2018 November 21, 2018 Financial Highlights for the 1st Half of FY2018 ~ Maintained steady profits though declined due to increased foreign currencies
This is Hirano speaking. Thank you for taking time out of your busy schedules to come to the MUFG Fiscal 2018 Interim Results Presentation.
 This is Hirano speaking. Thank you for taking time out of your busy schedules to come to the MUFG Fiscal 2018 Interim Results Presentation. As for the earnings results, Mr. Tokunari, our CFO, gave a presentation
Summary of Consolidated Financial Results for the First-Half of Fiscal Year Ending March [Japan Standards] (Consolidated) 31, 2013:
![Summary of Consolidated Financial Results for the First-Half of Fiscal Year Ending March [Japan Standards] (Consolidated) 31, 2013:](/thumbs/81/83889925.jpg "Summary of Consolidated Financial Results for the First-Half of Fiscal Year Ending March [Japan Standards] (Consolidated) 31, 2013:") October 25, 213 Summary of Consolidated Financial Results for the First-Half of Fiscal Year Ending March 31, 214 [Japan Standards] (Consolidated) Company name: MAX Co., Ltd. Stock listing: Tokyo Stock
October 25, 213 Summary of Consolidated Financial Results for the First-Half of Fiscal Year Ending March 31, 214 [Japan Standards] (Consolidated) Company name: MAX Co., Ltd. Stock listing: Tokyo Stock
CEO COMMENTARY FIRST QUARTER 2018 RESULTS AND KEY METRICS. CET1 Capital Ratio 12.1% 3. ROE: 9.7% RoTCE: 11.4% 2. Payout Ratio 71% 4
 For Immediate Release Citigroup Inc. (NYSE: C) April 13, 2018 FIRST QUARTER 2018 RESULTS AND KEY METRICS Efficiency Ratio 58% 1 ROE: 9.7% RoTCE: 11.4% 2 CET1 Capital Ratio 12.1% 3 EARNINGS PER SHARE OF
TREASURY AND FEDERAL RESERVE FOREIGN EXCHANGE OPERATIONS
 EMBARGOED: FOR RELEASE AT 4:00 P.M., EDT, THURSDAY, APRIL 27, TREASURY AND FEDERAL RESERVE FOREIGN EXCHANGE OPERATIONS During the first quarter of, the dollar appreciated 5.4 percent against the euro and
NOMURA HOLDINGS, INC. Financial Summary Year ended March 31, 2018
 News Release April 26, 2018 NOMURA HOLDINGS, INC. Financial Summary Year ended 2018 We are pleased to report the following consolidated financial summary based on the consolidated financial information
FOURTH QUARTER 2017 EARNINGS RELEASE
 FOURTH QUARTER 2017 EARNINGS RELEASE ROYAL BANK OF CANADA REPORTS FOURTH QUARTER AND 2017 RESULTS All amounts are in Canadian dollars and are based on our audited Annual and unaudited Interim Consolidated
ANNUAL REPORT 2010 MCAN MORTGAGE CORPORATION
 ANNUAL REPORT 2010 TABLE OF CONTENTS MESSAGE TO SHAREHOLDERS... 2 MANAGEMENT S DISCUSSION AND ANALYSIS OF OPERATIONS... 3 CONSOLIDATED FINANCIAL STATEMENTS...27 DIRECTORS...51 OFFICERS AND MANAGEMENT...51
DEUTSCHE BANK REPORTS SECOND QUARTER 2009 NET INCOME OF EUR 1.1 BILLION. Risk-weighted assets reduced by EUR 21 billion, or 7%, to EUR 295 billion
 Release DEUTSCHE BANK REPORTS SECOND QUARTER 2009 NET INCOME OF EUR 1.1 BILLION Net revenues of EUR 7.9 billion Income before income taxes of EUR 1.3 billion Tier 1 capital ratio of 11.0% Risk-weighted
Principal Financial Group Second Quarter 2014 Earnings Call
 Principal Financial Group Second Quarter 2014 Call July 25, 2014 Use of Non-GAAP Financial Measures A non-gaap financial measure is a numerical measure of performance, financial position, or cash flows
Mizuho Financial Group, Inc.
 UNITED STATES SECURITIES AND EXCHANGE COMMISSION Washington, D.C. 20549 FORM 6-K REPORT OF FOREIGN PRIVATE ISSUER PURSUANT TO RULE 13a-16 OR 15d-16 UNDER THE SECURITIES EXCHANGE ACT OF 1934 For the month
Financial Data: Sumitomo Mitsui Trust Holdings, Inc. ( SuMi TRUST Holdings )
") Financial Data: ( SuMi TRUST Holdings ) How to Read the Financial Statements of Trust Banks (Unaudited) 9 Management s Discussion and Analysis (Unaudited) 92 Five-Year Summary (Unaudited) 1 Consolidated
Financial Data: ( SuMi TRUST Holdings ) How to Read the Financial Statements of Trust Banks (Unaudited) 9 Management s Discussion and Analysis (Unaudited) 92 Five-Year Summary (Unaudited) 1 Consolidated
CFO statement. Balance sheet strength maintained. Results demonstrate resilience of our franchise
 CFO statement We turned in another set of record earnings despite challenging economic conditions in the second half. CFO Chng Sok Hui explains the salient aspects of the year s financial performance and
Earnings Release 2Q15
 Earnings Release 2Q15 Earnings Release 2Q15 2 Key metrics Credit Suisse (CHF million, except where indicated) Net income/(loss) attributable to shareholders 1,051 1,054 (700) 0 2,105 159 of which from
Results for the Fiscal Year Ended March May 18, 2017
 Results for the Fiscal Year Ended March 2017 May 18, 2017 Copyright 2017 JAPAN POST BANK CO., LTD. All Rights Reserved. 1 Table of Contents 1. Overview of FY2017/3 Results Overview of Business Results
Thank you, good morning everyone and welcome to our fourth quarter 2014 business review.
 Q4 2014 Earnings Call Transcript Inge Thulin & Nicholas Gangestad January 27, 2015 Slide 1, Opening Matt Ginter, Vice President, Investor Relations Thank you, good morning everyone and welcome to our fourth
Deutsche Bank reports net income of EUR 5.0 billion for the year 2009 Frankfurt, February 4, 2010
 Deutsche Bank reports net income of EUR 5.0 billion for the year 2009 Frankfurt, February 4, 2010 Income before income taxes of EUR 5.2 billion Tier 1 capital ratio of 12.6% Core Tier 1 ratio of 8.7% Leverage
NEWS RELEASE. R&I Affirms Ratings: Sumitomo Mitsui Financial Group. Rating and Investment Information, Inc. (R&I) has announced the following:
 has announced the following:") Oct 27, 2017 R&I Affirms Ratings: Sumitomo Mitsui Financial Group Rating and Investment Information, Inc. (R&I) has announced the following: SEC. COMPANY NAME CODE 8316 Sumitomo Mitsui Financial Group,
Oct 27, 2017 R&I Affirms Ratings: Sumitomo Mitsui Financial Group Rating and Investment Information, Inc. (R&I) has announced the following: SEC. COMPANY NAME CODE 8316 Sumitomo Mitsui Financial Group,
Supplemental Financial Information
 Quarterly Results (unaudited) The following represents the firm s unaudited quarterly results for 2013 and 2012. These quarterly results were prepared in accordance with U.S. GAAP and reflect all adjustments
Financial Results for 1st Half of FY 2012
 Financial Results for 1st Half of FY INDEX Ⅰ. Overviews of the Financial Results for the 1st Half Ended September 30, (Fiscal Year ) 1. Summary of Revenue and Expenses Consolidated 1 Non-consolidated 2
Second quarter 2011 results. July 26, 2011
 Second quarter 2011 results Second quarter 2011 results July 26, 2011 Cautionary statement regarding forward-looking statements This presentation contains statements that constitute forward-looking statements,
F I N A N C I A L R E S U L T S
 4Q7 January, 08 4Q7 Financial highlights Reported Excluding significant items ROTCE 8% ROTCE % Common equity Tier.% Common equity Tier.4% Net payout LTM 4 98% Net payout LTM 4 90% 4Q7 net income of $4.B
Equity Market Review and Outlook
 REVIEW AND OUTLOOK Q3 2016 Equity Market Review and Outlook By Richard Skaggs, CFA, VP, Senior Equity Strategist KEY TAKEAWAYS Stocks rallied handily in the third quarter, led by global markets. The Fed
Full Year and Fourth Quarter 2018 Earnings Results Presentation. January 16, 2019
 Full Year and Fourth Quarter 2018 Earnings Results Presentation January 16, 2019 Earnings Call Agenda 1 David M. Solomon, Chairman and Chief Executive Officer Strategic priorities Macro perspectives and
Consolidated Balance Sheet - 1/2
 Consolidated Balance Sheet March 31, ASSETS CURRENT ASSETS (Note 3): Cash and cash equivalents (Notes 9 and 21) Time deposits over three months (Note 21) Receivables (Note 21): Trade notes (Note 13) Trade
Results: BBVA earns 2.31 billion in first half (+25.9%)
") Press release 07.27.2017 January-June 2017 Results: BBVA earns 2.31 billion in first half (+25.9%) Income: Net interest income reached a seven-quarter high in Q2. In the year to June, this item, plus fees
Press release 07.27.2017 January-June 2017 Results: BBVA earns 2.31 billion in first half (+25.9%) Income: Net interest income reached a seven-quarter high in Q2. In the year to June, this item, plus fees
Modernizing Ontario s Credit Union Legislative Framework
 Modernizing Ontario s Credit Union Legislative Framework Consultation Paper on a Proposed Capital Adequacy Framework November 2017 TABLE OF CONTENTS Introduction... 1 Structure of Paper... 1 How to Participate...
THE HONGKONG AND SHANGHAI BANKING CORPORATION LIMITED 2014 CONSOLIDATED RESULTS HIGHLIGHTS
 23 February 2015 THE HONGKONG AND SHANGHAI BANKING CORPORATION LIMITED CONSOLIDATED RESULTS HIGHLIGHTS Pre-tax profit HK$111,189m (HK$144,756m in ) tributable profit HK$86,428m (HK$119,009m in ) Return
CITIGROUP REPORTS THIRD QUARTER 2014 EARNINGS PER SHARE OF $1.07; $1.15 EXCLUDING CVA/DVA 1
 For Immediate Release Citigroup Inc. (NYSE: C) October 14, 2014 CITIGROUP REPORTS THIRD QUARTER 2014 EARNINGS PER SHARE OF $1.07; $1.15 EXCLUDING CVA/DVA 1 ANNOUNCES STRATEGIC ACTIONS IN GLOBAL CONSUMER
Presentation at Nomura Investment Forum 2015
 Connecting Markets East & West Presentation at Nomura Investment Forum 2015 Koji Nagai Group CEO Nomura Holdings, Inc. December 1, 2015 Nomura 1. Reconfirming FY2019/20 management target Reconfirming FY2019/20
First quarter results demonstrate resilience of ING s portfolio of businesses
 PRESS RELEASE Amsterdam 16 May 2007 First quarter results demonstrate resilience of ING s portfolio of businesses Underlying net profit EUR 1,894 million, down 3.2% but flat excluding currency effects
JPMORGAN CHASE REPORTS 2001 FOURTH QUARTER AND FULL YEAR RESULTS
 270 Park Avenue, New York, NY 10017-2070 NYSE symbol: JPM www.jpmorganchase.com News release: IMMEDIATE RELEASE JPMORGAN CHASE REPORTS 2001 FOURTH QUARTER AND FULL YEAR RESULTS New York, January 16, 2002
News Release Contacts: Dana Ripley Jennifer Thompson Investors/Analysts (612) (612)
 (612)") News Release Contacts: Dana Ripley Jennifer Thompson Media Investors/Analysts (612) 303-3167 (612) 303-0778 U.S. BANCORP REPORTS THIRD QUARTER 2016 EARNINGS Record Earnings Per Diluted Common Share of
News Release Contacts: Dana Ripley Jennifer Thompson Media Investors/Analysts (612) 303-3167 (612) 303-0778 U.S. BANCORP REPORTS THIRD QUARTER 2016 EARNINGS Record Earnings Per Diluted Common Share of
Consolidated Financial Information <consistent with Japanese GAAP> For the nine months ended December 31, (Reference) For the fiscal
 For the fiscal") Consolidated Financial Information for the nine months ended December 31, 2006 Date: January 31, 2007 Company name (code number): Mitsubishi UFJ Financial Group, Inc. (8306)
Consolidated Financial Information for the nine months ended December 31, 2006 Date: January 31, 2007 Company name (code number): Mitsubishi UFJ Financial Group, Inc. (8306)
TREASURY AND FEDERAL RESERVE FOREIGN EXCHANGE OPERATIONS
 EMBARGOED: FOR RELEASE AT 4:00 P.M., EDT, THURSDAY, AUGUST 2, TREASURY AND FEDERAL RESERVE FOREIGN EXCHANGE OPERATIONS During the second quarter of, the dollar appreciated 3.3 percent against the euro
CITIGROUP REPORTS FIRST QUARTER 2013 EARNINGS PER SHARE OF $1.23; $1.29 EXCLUDING CVA/DVA 1 NET INCOME OF $3.8 BILLION; $4.0 BILLION EXCLUDING CVA/DVA
 For Immediate Release Citigroup Inc. (NYSE: C) April 15, 2013 CITIGROUP REPORTS FIRST QUARTER 2013 EARNINGS PER SHARE OF $1.23; $1.29 EXCLUDING CVA/DVA 1 NET INCOME OF $3.8 BILLION; $4.0 BILLION EXCLUDING
Dodd-Frank Act Company-Run Stress Test Disclosures
 Dodd-Frank Act Company-Run Stress Test Disclosures June 21, 2018 Table of Contents The PNC Financial Services Group, Inc. Table of Contents INTRODUCTION... 3 BACKGROUND... 3 2018 SUPERVISORY SEVERELY ADVERSE
As shown on page 16 of the financial supplement, we will provide further detail on Capital Markets and Banking revenues, as follows:
 Investor Relations 399 Park Avenue New York, N.Y. 10043 To: From: The Investment Community Citigroup Investor Relations Date: April 15, 2004 Re: Changes to GCIB Disclosure Format We wanted to highlight
GOLDMAN SACHS REPORTS EARNINGS PER COMMON SHARE OF $9.01 FOR 2017 EXCLUDING TAX LEGISLATION (1), EARNINGS PER COMMON SHARE WERE $19.
, EARNINGS PER COMMON SHARE WERE $19.") The Goldman Sachs Group, Inc. 200 West Street New York, New York 10282 GOLDMAN SACHS REPORTS EARNINGS PER COMMON SHARE OF $9.01 FOR 2017 EXCLUDING TAX LEGISLATION (1), EARNINGS PER COMMON SHARE WERE $19.76
The Goldman Sachs Group, Inc. 200 West Street New York, New York 10282 GOLDMAN SACHS REPORTS EARNINGS PER COMMON SHARE OF $9.01 FOR 2017 EXCLUDING TAX LEGISLATION (1), EARNINGS PER COMMON SHARE WERE $19.76
First Quarter 2018 Earnings Results
 The Goldman Sachs Group, Inc. 200 West Street New York, New York 10282 First Quarter Earnings Results Goldman Sachs Reports First Quarter Earnings Per Common Share of $6.95 and Increases the Quarterly
Summary of Financial Statements for the First Three Months Ended June 30, 2008
 July 29, Summary of Financial Statements for the First Three Months Ended June 30, Listed company s name: Listed on: 1st sections of TSE, OSE, NSE Code No.: 8606 URL: http://www.shinko-sec.co.jp/ Representative:
- Net income of EUR 393 million, due to improved earnings, realized gains on investments and lower impairments
 Société : Aegon Compartiment : Autre ISIN : NL0000303709 Diffuseur : PR Newswire Type de document : Communiqués d'information permanente / Résultats et CA Date de publication : 25/02/2010 02:00 Reports
Management s Discussion and Analysis Analysis of FY 2004 Earnings
 Management s Discussion and Analysis Analysis of FY 24 Earnings 87 Daiwa Securities Group Annual Report 25 Management s Discussion and Analysis Macroeconomic Conditions 1. Japan The domestic economy, which
Credit Suisse 14 th Annual Financial Services Forum
 Credit Suisse 14 th Annual Financial Services Forum Miami, Florida Tim O Hara, Co-head of Global Securities, Credit Suisse Disclaimer Cautionary statement regarding forward-looking statements This presentation
Strong results based on sound fundamentals
 Montrouge, 7 November 2013 Results for the third quarter and first nine months of 2013 Strong results based on sound fundamentals - growth of results in French retail banking - improvement in cost of risk
(millions of Canadian dollars) Quarter ended October 31 Year ended October % Change % Change
 Quarter ended October 31 Year ended October % Change % Change") PRESS RELEASE FOURTH QUARTER 2015 National Bank reports its results for the fourth quarter and year-end of 2015 and raises its quarterly dividend by 4% to 54 cents per share The financial information reported
PRESS RELEASE FOURTH QUARTER 2015 National Bank reports its results for the fourth quarter and year-end of 2015 and raises its quarterly dividend by 4% to 54 cents per share The financial information reported
YOUR COMPANY S FINANCIAL HEALTH 33
 YOUR COMPANY S FINANCIAL HEALTH 33 balance sheet accounts. Investing outflows on the cash flow statement will correspond to increases in the long-term asset accounts on the balance sheet, financing inflows
NET INCOME up 29% to 383m in 3Q17 and 31% to 1.151bn in 9M17
 Paris, November 7, 2017 Third-Quarter 2017 and Nine-Month 2017 Results NET INCOME up 29% to 383m in 3Q17 and 31% to 1.151bn in 9M17 3Q17 NET REVENUES UP 10% ACROSS CORE BUSINESSES, FUELED BY INVEST. SOLUTIONS
Income before income taxes. Million yen. Million yen
 FY2018 Third Quarter Consolidated Financial Results (Advantest s consolidated financial statements are prepared in accordance with IFRS) (Period ended ) January 30, 2019 Company Name : Advantest Corporation
GS Yuasa Corporation Consolidated Earnings Report for the. (Japanese GAAP)
") GS Yuasa Corporation Consolidated Earnings Report for the December 31, 2017 (Japanese GAAP) February 2, 2018 Stock listing: Tokyo Stock Exchange Securities code: 6674 URL: http://www.gs-yuasa.com/en Representative:
GS Yuasa Corporation Consolidated Earnings Report for the December 31, 2017 (Japanese GAAP) February 2, 2018 Stock listing: Tokyo Stock Exchange Securities code: 6674 URL: http://www.gs-yuasa.com/en Representative:
Manulife Financial Corporation Management s Discussion & Analysis. For the year ended December 31, 2017
 Manulife Financial Corporation Management s Discussion & Analysis For the year ended December 31, 2017 Caution regarding forward-looking statements From time to time, Manulife Financial Corporation ( MFC
Annual Media Conference
 John Cryan, Chief Executive Officer Building a better : three phases on the journey Phase 3 Sustainable growth with our clients Phase 1 Resolving legacy issues, strengthening controls Phase 2 Greater financial
SLR 6.6% 3 BOOK VALUE PER SHARE OF $71.95 TANGIBLE BOOK VALUE PER SHARE OF $
 For Immediate Release Citigroup Inc. (NYSE: C) July 13, 2018 SECOND QUARTER 2018 RESULTS AND KEY METRICS CEO COMMENTARY Efficiency Ratio 58% 1 ROE: 9.2% RoTCE: 10.8% 2 CET1 Capital Ratio 12.1% 3 SLR 6.6%
Fourth Quarter and Full-Year 2010 Results
 Fourth Quarter and Full-Year 2010 Results Zurich - Presentation to Investors and Analysts February 10, 2011 Cautionary statement Cautionary statement regarding forward-looking and non-gaap information
Mizuho Financial Group, Inc.
 UNITED STATES SECURITIES AND EXCHANGE COMMISSION Washington, D.C. 20549 FORM 6-K REPORT OF FOREIGN PRIVATE ISSUER PURSUANT TO RULE 13a-16 OR 15d-16 UNDER THE SECURITIES EXCHANGE ACT OF 1934 For the month
News release: IMMEDIATE RELEASE
 JPMorgan Chase & Co. 270 Park Avenue, New York, NY 10017-2070 NYSE symbol: JPM www.jpmorganchase.com News release: IMMEDIATE RELEASE JPMORGAN CHASE REPORTS THIRD-QUARTER 2008 NET INCOME OF $527 MILLION,
Financial Information
 Financial Information Financial Overview 174 Consolidated Seven-Year Summary 174 Performance Indicators of Major Companies 175 Management s Discussion and Analysis 176 Results 2015 176 Outlook 2016 183
UBS reports a first quarter loss of CHF 2.0 billion; quarterend BIS tier 1 ratio of 10.5%
 Media release UBS AG Tel. +41-44-234 85 00 www.ubs.com UBS reports a first quarter loss of CHF 2.0 billion; quarterend BIS tier 1 ratio of 10.5% First quarter 2009 results First quarter net loss attributable
Citigroup Inc. (Exact name of registrant as specified in its charter)
") UNITED STATES SECURITIES AND EXCHANGE COMMISSION WASHINGTON, D.C. 20549 FORM 10-Q QUARTERLY REPORT PURSUANT TO SECTION 13 OR 15(d) OF THE SECURITIES EXCHANGE ACT OF 1934 Delaware (State or other jurisdiction
UNITED STATES SECURITIES AND EXCHANGE COMMISSION WASHINGTON, D.C. 20549 FORM 10-Q QUARTERLY REPORT PURSUANT TO SECTION 13 OR 15(d) OF THE SECURITIES EXCHANGE ACT OF 1934 Delaware (State or other jurisdiction
Principal Financial Group Fourth Quarter 2014 Earnings Call
 Principal Financial Group Fourth Quarter 2014 Earnings Call January 30, 2015 Use of Non-GAAP Financial Measures A non-gaap financial measure is a numerical measure of performance, financial position, or
CEO COMMENTARY FOURTH QUARTER AND FULL YEAR 2018 RESULTS AND KEY METRICS ROE 9.4% 2018 RoTCE 10.9% Efficiency Ratio 57.
 For Immediate Release Citigroup Inc. (NYSE: C) January 14, 2019 FOURTH QUARTER AND FULL YEAR 2018 RESULTS AND KEY METRICS 2018 Efficiency Ratio 57.4% 1 2018 ROE 9.4% 2018 RoTCE 10.9% 2 CET1 Capital Ratio
Aozora Reports Net Income of 10.4 Billion for the First Three Months of FY Steady progress of 26.1% towards the full-year forecast -
 July 30, 2012 Company name: Aozora Bank, Ltd. Name of representative: Brian F. Prince, President and CEO Listed exchange: TSE, Code 8304 Enquiries: Hiroyuki Kajitani Corporate Communication Division (03
Lincoln Financial Group Reports Fourth Quarter and Full Year 2007 Results
 NEWS RELEASE Lincoln Financial Group Reports Fourth Quarter and Full Year 2007 Results Amid volatile capital markets, a record year of variable annuity and life insurance sales drove consolidated retail
Financial Summary. For the First Half Ended September 30, Shinsei Bank, Limited (Code 8303, TSE First Section)
") Financial Summary For the First Half Ended September 30, 2017 Shinsei Bank, Limited (Code 8303, TSE First Section) Contents Page 1. Financial Highlights Financial Highlights 1 2. Consolidated Information
Financial Summary For the First Half Ended September 30, 2017 Shinsei Bank, Limited (Code 8303, TSE First Section) Contents Page 1. Financial Highlights Financial Highlights 1 2. Consolidated Information
4Q18 Financial Results. January 15, 2019
 4Q8 Financial Results January 5, 209 4Q8 Financial highlights ROTCE 4% Common equity Tier 2 2.0% Net payout LTM 3 92% 4Q8 net income of $7.B and EPS of $.98 Managed revenue of $26.8B 4 Expense of $5.7B
Condensed Consolidated Financial Information
 "Performance" Through Chemistry Condensed Consolidated Financial Information (Japanese Standard) for the Fiscal Year Ended March 31, 2018 (April 1, 2017 through March 31, 2018) Note: The English version
Consolidated Financial Results for the First Quarter Ended June 30, 2008
 For Immediate Release August 5, 2008 Consolidated Financial Results for the First Quarter Ended June 30, 2008 1. Performance for the First Quarter Ended Jun. 30, 2008 (from Apr. 1, 2008 to Jun. 30, 2008)
Indonesia: Changing patterns of financial intermediation and their implications for central bank policy
 Indonesia: Changing patterns of financial intermediation and their implications for central bank policy Perry Warjiyo 1 Abstract As a bank-based economy, global factors affect financial intermediation
Financial Section. Exhibit THE BANK OF NEW YORK MELLON CORPORATION 2017 Annual Report Table of Contents. Page 2. Page
 Financial Section Exhibit 13.1 THE BANK OF NEW YORK MELLON CORPORATION 2017 Annual Report Table of Contents Financial Summary Management s Discussion and Analysis of Financial Condition and Results of
Medium-term Business Plan
 Mitsubishi UFJ Financial Group, Inc. Medium-term Business Plan Tokyo, May 15, 2012 --- Mitsubishi UFJ Financial Group, Inc. (MUFG) announced today that it has formulated its medium-term business plan for
TABLE OF CONTENTS Interim Profit Announcement 2005
 Profit Announcement For the six months ended 3 March 2005 This interim profit announcement has been prepared for distribution in the United States of America TABLE OF CONTENTS Interim Profit Announcement
CITIGROUP REPORTS SECOND QUARTER 2015 EARNINGS PER SHARE OF $1.51; $1.45 EXCLUDING CVA/DVA 1
 For Immediate Release Citigroup Inc. (NYSE: C) July 16, 2015 CITIGROUP REPORTS SECOND QUARTER 2015 EARNINGS PER SHARE OF $1.51; $1.45 EXCLUDING CVA/DVA 1 NET INCOME OF $4.8 BILLION; $4.7 BILLION EXCLUDING
BNY MELLON REPORTS FOURTH QUARTER EARNINGS OF $1.13 BILLION OR $1.08 PER COMMON SHARE
 News Release BNY MELLON REPORTS FOURTH QUARTER EARNINGS OF $1.13 BILLION OR $1.08 PER COMMON SHARE Fourth quarter results include: U.S. tax legislation estimated net benefit of $427 million, or $0.41 per
GS Yuasa Corporation Consolidated Earnings Report for the Year ended March 31, 2018 (Japanese GAAP)
") GS Yuasa Corporation Consolidated Earnings Report for the (Japanese GAAP) May 8, 2018 Stock listing: Tokyo Stock Exchange Securities code: 6674 URL: http://www.gs-yuasa.com/en/ Representative: Osamu Murao,
GS Yuasa Corporation Consolidated Earnings Report for the (Japanese GAAP) May 8, 2018 Stock listing: Tokyo Stock Exchange Securities code: 6674 URL: http://www.gs-yuasa.com/en/ Representative: Osamu Murao,