Intangibles. Financials. Our Businesses: Current Position & Future Direction. Overview
|
|
|
- Caren Carter
- 5 years ago
- Views:
Transcription

1
2 Agenda Overview Our Businesses: Current Position & Future Direction Financials Intangibles


, Morocco (Greenfield), Sudan")


3 History Key Development Stages Established with a paid up capital of SR 40m Started Jeddah Plastics factory Acquired 40% stake in Almarai Entered sugar refining business in KSA Entered oil business in Iran (Acquisition), Morocco (Greenfield), Sudan (Greenfield), Kazakhstan (Acquisition) /06 Obtained 70% of Saudi edible oil market Established edible oil refinery in Egypt Entry into retail sector through merger with Azizia Panda Formed Kinan in 2005 and disposed 70% stake in 2006


4 History Key Development Stages Started sugar and oil commercial production in Egypt and Algeria, resp. Acquired oil business in Turkey Acquisition of Giant Stores by Panda Panda established 1 st DC in Riyadh Acquired Pasta business in Egypt, the largest acquisition made by Savola Foods Launched Sweeva Sweetener Issued Sukuk worth SAR 1.5 bln, first tranche of SAR 5 bln program Acquisition of Géant operation in KSA by Panda (10 hypermarkets and 1 supermarket) Completed construction of beet sugar plant in Egypt Launch of Afia olive oil in KSA Panda signed agreement for 2 nd DC in KAEC Made the largest investment of SAR 2 bln by acquiring additional stake of 6.5% in Almarai
5 History Key Development Stages Today Savola Group is one of the top Food, Retail and Plastics Packaging player in the MENA region with leading brands


6 Key Facts Around 20,000 Employees Net Sales of SAR 27.4 bln in 2012 Countries of Operations: 8+ Market capitalization of SAR 31.5 bln (as of 28 th November 2013)


7 Our Businesses Foods (Edible Oils, Sugar, Pasta) Revenue SAR 16.4 bln Retail (Hypermarkets & Supermarkets) Revenue SAR 10.2 bln Investments (Strategic and Non-core) Value of over SAR 14 bln Plastics (Rigid & Flexible) Revenue SAR 1.1 bln
8 Our Businesses Revenue by Sector Total: SAR 25 bln Total: SAR 27 bln % 59.9% Foods Plastics Retail 36.8% 59.4% 3.9% 3.8%

9 Our Key Strengths Broad and diversified geographic footprint and product offering Extensive consumer and market understanding Market leader in high growth and fragmented markets Resilient business model based on stable revenue generation by serving consumers basic needs Strong and experienced management with outstanding historical financial track record Excellent brand awareness in all markets that Savola is operating in

10 Our Goals Increase profitability Continue to grow by investing in and focusing on core sectors Give more autonomy to subsidiaries to prepare them for potential spin-offs Maximize total shareholders return Increase dividends Reallocate cash invested from non-core investments to core sectors


11 2 Our Businesses Current Position & Future Direction
12 Savola Foods


13 Oil Value Chain Raw materials Offering Palm oil Corn oil Refining Packaging B2B/ Export Sunflower oil Soya oil B2C Brands and market positions KSA, GCC & Yemen #1 Afia, Al Arabi, Shams, Olite, Nakheel, Dalal Egypt #1 Rawabi, Afia, Ganna, Slite, Helwa Iran #1 Ladan, Aftab, Bahar Turkey #1 Yudum, Sirma Sudan #1 Sabah, Al Tayeb Algeria #2 Afia, Elio Morocco #3 Afia, Hala Kazakhstan #1 Leto, Khazayoushka


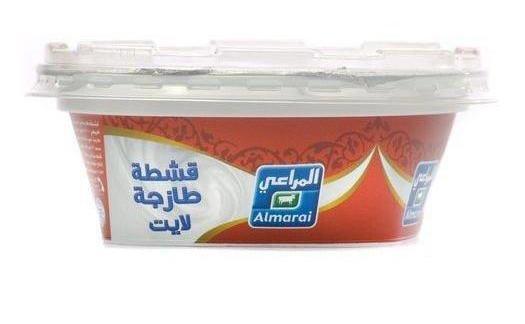
14 Sugar Value Chain Raw materials Offering Raw Cane Sugar 100% Refining B2B/ Export Beet B2C Beet sugar plant is completed and is currently going through test phase KSA, GCC & Yemen Brands and market positions #1 Al Osra, Ziadah, Safaa, Nehar, Halla, Sweeva Egypt NA Al Osra


15 Pasta Value Chain Raw materials Offering Wheat 100% Processing Unbranded Branded Brands and market positions Egypt #1 Maleka, Italiano
16 Financial Performance CAGR Revenue 21% Net income 16% , ,389 12,026 9, Revenue (SAR millions) NI (SAR millions)
17 Revenue Breakdown SFC Revenue Breakdown by Geography, 2012 (Total: SAR 16.4 bln) 3.7% 1.7% 1.1% 4.1% 5.4% 26.8% 19.3% 37.9% KSA Egypt Iran Turkey Algeria Sudan Morocco Kazakhstan
18 Volume Breakdown SFC Total Sales Volume by Geography, 2012 (Total: 3.6 mln MT) 3.1% 1.6% 1.3% 0.9% 3.0% 15.1% 48.2% 26.8% KSA Egypt Iran Turkey Algeria Sudan Morocco Kazakhstan


19 Strategic Growth Drivers 1 Diversification of product segments 2 Leveraging the value of existing brands 3 Organic growth A regional leader in basic foods across all channels 4 Selective upstream integration 5 Strategic M&A Mission is to enrich consumer cooking experience by developing ingredient solutions
20 Strategic Growth Drivers 1 Diversification of product segments 2 Leveraging the value of existing brands 3 Organic growth A regional leader in basic foods across all channels 4 Selective upstream integration 5 Strategic M&A Mission is to enrich consumer cooking experience by developing ingredient solutions

21 Example Categories Strategic Growth Drivers 1) Diversification of product segments Enter into adjacent and complementary new product categories Targeting new retail and wholesale customers to drive revenue growth and enhance profit margins Consumer Cooking / Baking Experience Cooking / Baking Ingredients Ready-to-Cook Condiments Ready-to-Eat Edible oil Sugar Savola currently plays in ingredients Pasta Rice Mayonnaise Sauces Ready-to-cook and condiments are immediate adjacencies Currently exposed through investment in Almarai Total estimated profit pool of around SAR 1.5 billion in the adjacent categories


22 Strategic Growth Drivers 2) Leveraging the value of existing brands Enhance economies of scale in marketing and advertising Facilitate establishing a foothold in new markets KSA Turkey Iran Egypt Others Afia and Ladan have been used as umbrella brands
23 Strategic Growth Drivers 3) Organic growth Large population base with high disposable incomes to drive consumption of basic commodities Exports to neighboring countries Total base for countries where Savola Food operates Population: 394 million Population Growth (2012): 1.5% Edible Oil Consumption: 8.6 million MT Sugar Consumption: 12.8 million MT Organic growth to be fueled by capacity expansion
24 Strategic Growth Drivers KSA 1 Egypt 2 3 Turkey Population: 28.7 mln Population Growth (2012): 2.1% GDP Growth: 6.0% Edible Oil Consumption: 604,200 MT Sugar Consumption: 1.2 mln MT Population: 84.0 mln Population Growth (2012): 1.8% GDP Growth: 1.5% Edible Oil Consumption: 1.9 mln MT Sugar Consumption: 2.8 mln MT Population: 74.5 mln Population Growth (2012): 1.2% GDP Growth: 2.3% Edible Oil Consumption: 2.2 mln MT Sugar Consumption: 2.3 mln MT Kazakhstan Iran Population: 16.4 mln Population Growth (2012): 1.2% GDP Growth: 5.9% Population: 75.6 mln Population Growth (2012): 1.1% GDP Growth: 2.0% Edible Oil Consumption: 346,300 MT Sugar Consumption: 480,000 MT 7 Edible Oil Consumption: 1.8 mln MT Sugar Consumption: 2.5 mln MT Sudan 7 Morocco 6 5 Algeria Population: 45.7 mln Population Growth (2012): 2.5% GDP Growth: -7.3% Edible Oil Consumption: 421,500 MT Sugar Consumption: 1.3 mln MT Population: 32.6 mln Population Growth (2012): 0.9% GDP Growth: 3.7% Edible Oil Consumption: 621,900 MT Sugar Consumption: 750,000 MT Population: 36.5 mln Population Growth (2012): 1.4% GDP Growth: 3.1% Edible Oil Consumption: 675,000 MT Sugar Consumption: 1.5 mln MT
25 Strategic Growth Drivers Export potential to neighbouring countries Example: Iraq Oils & Fats Volume (in 000 Tons) For example Iraq Fragmented market with no sophisticated player Proximity to Jeddah plant Brand awareness of Afia % 75% +3% % 75% % 75% CAGR Ghee +3% Oil +3% Branding capabilities and know how Illustrative purposes only Large and fragmented markets with no sophisticated player
 Malaysia (387%) United States (87%) Indonesia (400%) Argentina, Brazil Origination Markets Destination Markets Local farming substantial but countries still relies on imports to")
 India (47%) Turkey / Kazakhstan (40-50%) Sudan (60%) Limited Egypt (15%) Upstream")
26 Strategic Growth Drivers 4) Selective upstream integration Net Exporter Markets Description Local farming larger than local consumption Government incentives aligned to favor exports Markets (% seeds locally produced) Malaysia (387%) United States (87%) Indonesia (400%) Argentina, Brazil Origination Markets Destination Markets Local farming substantial but countries still relies on imports to meet demand Government incentives aligned to protect local farmers Little to no local farming industry exists Government encourages imports to secure appropriate level of supply and to protect consumer prices Competition is from local players Selected upstream integration in Sudan and Egypt Croatia (56%) India (47%) Turkey / Kazakhstan (40-50%) Sudan (60%) Limited Egypt (15%) Upstream Arabia (0%) integration Iran (15%) in Sudan and Morocco / Algeria Egypt (below 5%)
 52 28 24 SAR 22 bln SAR 12 bln SAR 10 bln Large profit pool where Savola is not currently present For illustrative purposes")
27 Strategic Growth Drivers 5) Strategic M&A Total packaged food market Food Categories in GCC Overlapping with Savola / Almarai businesses Other Categories Total B2C market size SAR 80 bln SAR 46 bln SAR 34 bln Number of Categories Profit Pool (Gross Profit) SAR 22 bln SAR 12 bln SAR 10 bln Large profit pool where Savola is not currently present For illustrative purposes only


28 Azizia Panda United Company


29 Distribution Center Retail Value Chain Vendors / 51% Super Super Selling area/store: 1,800-2,500 m 2 Whole Sale Sales intensity: SAR 396 /m 2 /week New Capex per store: SAR 8-12 mln Hyper Hyper 49% Selling area per store: 3,000-12,000 m 2 Sales intensity: SAR 353 /m 2 /week New Capex per store: SAR mln Consumers Present in 33 cities across KSA L2L increase of 5.8% in 2012 Present across KSA with exceptional distribution network

30 Key Facts Present in 33 cities across KSA L2L increase of 6% in 2012 Customer count of over 91 million Customer footfall of over 220 million Present across KSA with exceptional distribution network
31 Key Facts Customer Count Number of Stores and Selling Area CAGR 14% CAGR Selling Area 23% 497,000 m 2 83 Mn 44 Mn 176,000 m Hypermarkets Supermarkets
32 Financial Performance CAGR Revenue 12% Net income 121% ,311 8,183 9,182 10, Revenue (SAR millions) NI (SAR millions)

33 Strategic Growth Drivers 1 Organic growth 2 Adapting to the demands of customers 3 State of the art Distribution 4 Expansion of non-food lines 5 Expansion of Panda branded product lines 6 New retail formats Our vision is to be the number 1 mass market retailer in the region
34 Large and young population expected to drive modern retail demand Strategic Growth Drivers 1 Organic growth 2011 Population Total 28.7 mln 11% 9% 10% 23% 30% 51% 19% 18% 48% 16% 24% 41% Saudis Non-Saudis Total <20 years years Total population is expected to reach 32.8 mln by % of total population is below 30 years of age, of which 50% are females 23% more married couples (11.9 mln) by 2020 Family size has declined (9.3 in 1970s to around 5.3 now)
35 Modern retail share out of the total grocery retail is expected to increase Strategic Growth Drivers Grocery Retail Market Size SAR bln CAGR 7.3% 11.3% 1 Organic growth F 2012 P 2013 P 2014 P 2015 P 2016 P Small Grocery & Others Hypermarkets Supermarkets 5.8%


36 Meeting customers needs is our priority Strategic Growth Drivers 2 Adapting to the demands of customers Panda ranked # 1 in lowest cost of shopping by offering the best prices to customers and special offers It continues to have good value for money and lowest prices compared to competitors


37 Strategic Growth Drivers 3 State of the art Distribution Distribution center (DC) in Riyadh: Largest DC in the region Built up area of around 92,500 m 2 Super flat floors Setting up 2 nd DC in KAEC with built up area of over 67,000 m 2 Second largest fleet size in KSA with over 380 vehicles Excellent distribution network provides ability to be a national player


38 Increase in non-food sales mix will improve overall margins Strategic Growth Drivers Panda has formulated a long-term strategy to increase the non-food sales 4 Expansion of nonfood lines


39 Increase in private label sales mix will improve overall margins Strategic Growth Drivers Panda plans to increase the range of Panda branded products 5 Expansion of Panda branded product lines
40 Panda entered into convenient store format with the brand name My Panda Strategic Growth Drivers Modern grocery formats underpenetrated 24% 41% 62% 36% 25% 16% 6 New retail formats 57% 23% 19% 36% 23% 15% 39% 25% Avg. 24% 59% UAE Italy Spain UK KSA Small Grocery Retails Hypermarkets Supermarkets


41 Savola Packaging Systems


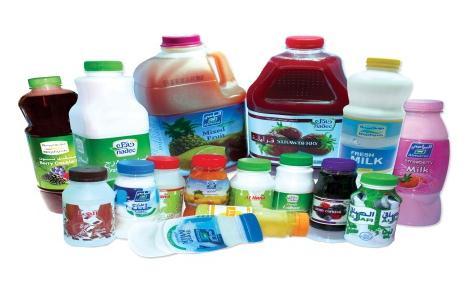
42 Plastics Value Chain Raw materials Processing Offering PET 80% Flexible Packaging PP PE Rigid Packaging Flexible packaging Food Home Other 20% Rigid Packaging PET bottles HDPE bottles Others


43 Key Facts Operating 9 Factories in 3 cities across KSA & Egypt Recognized by SABIC as No. 1 customer in Polyethylene One of The Three Largest Plastics Converter In ME * Ranked 45 Globally in Rigid Packaging * Ref. : ARAB PLAST 2013 (Arab International Plastics & Rubber Industry Trade Show and Conferences )

 12% 112 114 123 88% 101 KSA Egypt 2009 2010 2011")
44 Savola Plastics operates in 2 countries (KSA and Egypt) and exports to 35 countries Key Facts SPS Volume Sales by Geography, 2012 (Total: 123,000 MT) SPS Volume Growth ( 000 MT) 12% % 101 KSA Egypt
45 Financial Performance CAGR Revenue 12% ,002 1, Revenue (SAR millions) NI (SAR millions)


46 Also, consolidate industry in KSA and Egypt through M&A Strategic Growth Drivers Organic growth Push organic sales in KSA and Egypt Increase primary flexible packaging in KSA and enter flexible packaging in Egypt Export to Europe Leverage on cost advantage to grow stretch film business in European markets
47 Savola Plastics is dominant in the food and beverage businesses Strategic Growth Drivers Market size (SAR blns) and Savola market share (%) Rigid Flexible Total Market Size Savola Share Market Size Savola Share Market Size Savola Share KSA % % % Egypt % 1.8 0% %

48 4. Low delivered cost 2. Low Energy Cost Strategic Growth Drivers Total market of around 1.8 mln tonnes in Europe for plastic film Basic raw material prices higher in Europe by around 15-20% 1. Low Resin Cost Total delivered cost from KSA to Europe is less by 10-20% for film as compared to European players Significant cost advantage Electricity cost in KSA is less by around 25% as compared to Europe 3. Small Lead Time Lead time from China to Western Europe 3 weeks more from KSA KSA and Egypt have significant cost advantage over European players


49 Savola Investments
50 Strategic Investments Investment Net profit 2012 (SAR mlns) Ownership as of 31 Dec Market value* of Savola holdings (SAR mlns) Almarai 1, % 11,778 Herfy % 1,864 Kinan/ Masharef % NA *Market value as of 28 th November 2013 Investments which are complimentary to the Group s core operating sectors
51 Non-core investments to be exited overtime Non-core Investments All numbers are in SAR millions All book values as of 31 st December , KEC EEC Taameer Mutoun Intaj Joussour Swicorp Other Total Listed Un-listed % Ownership 11.4% 0.88% 5% 80% 50% 15% 15%
52 Exited investments worth around SAR 2.3 billion since 2009 Investments Strategy Investment Asfan - In-kind contribution to Masharef project Executed strategy Land Mutoun Yasmine Riyadh & Hanaki Jeddah Medina land - Sold to Kinan with realized capital gain of SAR 76 mln and SAR 77 mln in Agreement signed to sell to KEC with expected capital gain of SAR 231 mln - Sale and leaseback of freehold properties with few remaining properties Private Equity Funds (Intaj, Joussour, Swicorp) KEC EEC Herfy - Ensuring to exit at the right time by maximizing returns - Currently under lock-up period - Sold c. 90% of investment in Q with capital gain of SAR 47 mln - IPO ed in 2010 at a P/E of around 12.5 times - Currently owning 49% of the company

53 3 Financials
54 Revenue Growth SAR mlns CAGR 21.3% 25,196 27,391 21,029 17,917 10,410 13, Foods Retail Plastics Strong and consistent revenue growth
55 Income from Core Operations SAR mlns CAGR 23.2% 1,355 1, , (G) Net income from operations has grown consistently
56 RONCE has increased over the past few years due to focus on core businesses Return on Net Capital Employed SAR blns 11.4% RONCE 13.8% Reallocation of capital from noncore investments to core businesses 15.0 NCE Non-Core Assets NCE Core Businesses
57 Total Shareholders Return Total shareholders return over 16% SAR per share Share price Dividend per share
58 Savola Group Share Price Share price increase of 35% , % 6,791 Oct-12 Nov-12 Dec-12 Jan-13 Feb-13 Mar-13 Apr-13 May-13 Jun-13 Jul-13 Aug-13 Sep-13 Oct-13 Savola Index Tadawul Index
59 Healthy balance sheet with large amount of unutilized bank lines Debt Position Net Debt/EBITDA Debt to equity ratio
60 Strong cash flow generation Cash Flow Bridge SAR mlns 1, ,204 3,409 4,669 2,366 1,866 1, Cash Dec Cash from operations Investments sold Dividends received Borrowings/ Others New investments Capex Dividends paid Cash Dec Source of funds Use of proceeds


61 Reliance on non-managed businesses has reduced over time Non-managed Businesses SAR mlns Managed Non Managed ,131

62 4 Intangibles


 Shareholder Birr")

63 Savola Ethics and Values Balanced Way 1 We will continue to adhere to our ethics and values framework 2 We will ensure that we build a live, inspiring model of our ethics and values for the future generations of Savola Taqwa (Empathy) Community Amanah (Honesty) Shareholder Birr (Fairness) Employee 3 We will continue to maintain good and sincere intentions Mujahadah (Personal Control)

64 175 persons graduated from Makeen program in 2012 Corporate Social Responsibility Makeen center for training and employing persons with disabilities Accessibility program Participating in Injaz programs Supporting various organizations


65 Pledges and Bridges Accessibility Awareness Post employment Family Workshop Sessions Training on to visits Disability Prepare Program and follow the Confidence Workplace up 175 beneficiaries graduated from the program in 2012

 in 2013")


66 Recognition for Intangibles Forbes ranked Savola as No. 1 among the Top 500 companies (Food Industry sector) in 2013 across Arab World Savola MD awarded CEO excellence award in 2013 by The Middle East Excellence Awards Institute Savola Group ranked No. 2 among Arab World and No. 1 in KSA publicly listed companies in Corporate Governance and Transparency by Standard & Poor s and Hawkamah Institute
67 Appendix - Financial Results
68 Annual Financials (all figures are in SAR millions) Segment Wise Financials December 2012 December 2011 Revenue Gross Profit EBIT Net Income EBITDA Revenue Gross Profit EBIT Net Income EBITDA Food Oil-Mature Markets 9,008 1,593 1, ,134 7,958 1, Oil-Start-up Markets* 1, , Total Oil 10,565 1,819 1, ,256 9,312 1, Sugar 5, , Pasta Total Foods 16,389 2,310 1, ,701 15,224 1,777 1, ,240 Retail KSA 9,529 2, ,560 1, Gulf Total Retail 10,157 2, ,182 2, Packaging 1, , Real Estate Franchising Herfy Al Marai-Savola Share HQ/Elimination/Impairments (207) (0) (17) (188) 12 (258) (30) (14) (25) 11 Total 27,391 4,762 2,456 1,402 3,020 25,196 3,971 1,801 1,202 2,332 Adjustments Impairments 0 33 Capital gains (47) (153) Adjusted Profit 1,355 1,082 * Start-up markets include Algeria, Morocco and Sudan
69 Quarterly Financials (all figures are in SAR millions) Segment Wise Financials Q Q Revenue Gross Profit EBIT Net Income EBITDA Revenue Gross Profit EBIT Net Income EBITDA Food Oil-Mature Markets 2, , Oil-Start-up Markets* Total Oil 3, , Sugar 1, , Pasta Total Foods 4, , Retail KSA 2, , Gulf Total Retail 2, , Packaging Real Estate 0 0 (0) (0) (0) 0 0 (1) (1) (1) Franchising Herfy Al Marai-Savola Share HQ/Elimination/Impairments (52) (4) (16) (78) (9) (76) 4 (18) (76) (10) Total 7,190 1, ,723 1, * Start-up markets include Algeria, Morocco and Sudan
70 Quarterly Financials (all figures are in SAR millions) Segment Wise Financials Q Revenue Gross Profit EBIT Net Income EBITDA Food Oil-Mature Markets 1, Oil-Start-up Markets* Total Oil 2, Sugar Pasta Total Foods 3, Retail KSA 2, Gulf Total Retail 2, Packaging Real Estate 0 0 (2) (2) (2) Franchising Herfy Al Marai-Savola Share HQ/Elimination/Impairments (40) (0) 47 (20) 54 Total 6,320 1, * Start-up markets include Algeria, Morocco and Sudan
71 THANK YOU
Intangibles. Financials. Our Businesses: Current Position & Future Direction. Overview
 Agenda 1 2 3 4 Overview Our Businesses: Current Position & Future Direction Financials Intangibles History Key Development Stages Established with a paid up capital of SR 40m Started Jeddah Plastics factory
Intangibles. Financials. Our Businesses: Current Position & Future Direction. Overview
 Agenda 1 2 3 4 Overview Our Businesses: Current Position & Future Direction Financials Intangibles History Key Development Stages Established with a paid up capital of SR 40m Started Jeddah Plastics factory
Intangibles. Financials. Our Businesses: Current Position & Future Direction. Overview
 Agenda 1 2 3 4 Overview Our Businesses: Current Position & Future Direction Financials Intangibles History Key Development Stages Established with a paid up capital of SR 40m Started Jeddah Plastics factory
Intangibles. Financials. Our Businesses: Current Position & Future Direction. Overview
 Agenda 1 2 3 4 Overview Our Businesses: Current Position & Future Direction Financials Intangibles History Key Development Stages Established with a paid up capital of SR 40m Started Jeddah Plastics factory
Investors Presentation February 2012
 Investors Presentation February 2012 Contents 1. Overview 2. Strategy and Growth 3. Financial Highlights and Projections 4. Our Intellectual Assets Note: The financials for 2011 in the presentation are
Investors Presentation October 2011
 Investors Presentation October 2011 Contents 1. Overview 2. Strategy and Growth 3. Financial Highlights and Projections 4. Our Intellectual Assets Appendix Quarterly results 2 Where we are now, and how
Savola Group Investor Presentation. April 2010
 Savola Group Investor Presentation April 2010 2 Contents Overview Strategy and Growth Savola Blue Oceans Financial Highlights and projections Intellectual Assets 3 Where we are now, and how we got here
SAVOLA GROUP COMPANY (Saudi Joint Stock Company)
") SAVOLA GROUP COMPANY (Saudi Joint Stock Company) UNAUDITED INTERIM CONDENSED CONSOLIDATED FINANCIAL STATEMENTS For the Three-Month Period Ended March 31, 2009 ABCD KPMG Al Fozan & Al Sadhan Al Dainy Plaza
SAVOLA GROUP COMPANY (Saudi Joint Stock Company) UNAUDITED INTERIM CONDENSED CONSOLIDATED FINANCIAL STATEMENTS For the Three-Month Period Ended March 31, 2009 ABCD KPMG Al Fozan & Al Sadhan Al Dainy Plaza
and announces SR 952 Millions in net profits for 2009
 Savola Quarterly Newsletter 4th Quarter 2009 Issued by the Savola Group to enhance corporate communication with its Shareholders, Investors and all Stakeholders through furnishing them with its latest
2008A 2009E 2010E 2011E CAGR
 CONSUMER / RETAIL 16 June 2009 Savola Group Company Overweight Price (SR) 24.5 12-month target price# (SR) 27.1 Potential upside/downside (%) 11 Conglomerate Discount holds back valuation We believe Savola
SAVOLA GROUP COMPANY (Saudi Joint Stock Company) UNAUDITED INTERIM CONDENSED CONSOLIDATED FINANCIAL STATEMENTS
 UNAUDITED INTERIM CONDENSED CONSOLIDATED FINANCIAL STATEMENTS") SAVOLA GROUP COMPANY (Saudi Joint Stock Company) UNAUDITED INTERIM CONDENSED CONSOLIDATED FINANCIAL STATEMENTS For the Three-Month and Six-Month Periods Ended June 30, 2008 SAVOLA GROUP COMPANY (A Saudi
SAVOLA GROUP COMPANY (Saudi Joint Stock Company) UNAUDITED INTERIM CONDENSED CONSOLIDATED FINANCIAL STATEMENTS For the Three-Month and Six-Month Periods Ended June 30, 2008 SAVOLA GROUP COMPANY (A Saudi
UNAUDITED INTERIM CONSOLIDATED FINANCIAL STATEMENTS FOR THE THREE-MONTH PERIOD AND YEAR ENDED DECEMBER 31, 2013 AND LIMITED REVIEW REPORT
 UNAUDITED INTERIM CONSOLIDATED FINANCIAL STATEMENTS FOR THE THREE-MONTH PERIOD AND YEAR ENDED DECEMBER 31, 2013 AND LIMITED REVIEW REPORT UNAUDITED INTERIM CONSOLIDATED FINANCIAL STATEMENTS FOR THE THREE-MONTH
SAVOLA GROUP COMPANY (A Saudi Joint Stock Company)
") SAVOLA GROUP COMPANY (A Saudi Joint Stock Company) UNAUDITED INTERIM CONDENSED CONSOLIDATED FINANCIAL STATEMENTS For the three-month and six-month periods ended June 30, 2010 ABCD KPMG Al Fozan & Al Sadhan
SAVOLA GROUP COMPANY (A Saudi Joint Stock Company) UNAUDITED INTERIM CONDENSED CONSOLIDATED FINANCIAL STATEMENTS For the three-month and six-month periods ended June 30, 2010 ABCD KPMG Al Fozan & Al Sadhan
SAVOLA GROUP COMPANY (Saudi Joint Stock Company)
") SAVOLA GROUP COMPANY (Saudi Joint Stock Company) UNAUDITED INTERIM CONDENSED CONSOLIDATED FINANCIAL STATEMENTS For the Three-Month and Six-Month Periods Ended June 30, 2009 ABCD KPMG Al Fozan & Al Sadhan
SAVOLA GROUP COMPANY (Saudi Joint Stock Company) UNAUDITED INTERIM CONDENSED CONSOLIDATED FINANCIAL STATEMENTS For the Three-Month and Six-Month Periods Ended June 30, 2009 ABCD KPMG Al Fozan & Al Sadhan
SAVOLA GROUP COMPANY (Saudi Joint Stock Company) CONSOLIDATED FINANCIAL STATEMENTS December 31, 2008 with AUDITORS REPORT
 CONSOLIDATED FINANCIAL STATEMENTS December 31, 2008 with AUDITORS REPORT") SAVOLA GROUP COMPANY (Saudi Joint Stock Company) CONSOLIDATED FINANCIAL STATEMENTS December 31, 2008 with AUDITORS REPORT ABCD KPMG Al Fozan & Al Sadhan Al Dainy Plaza Al Madinah Road P. O. Box 55078 Jeddah
SAVOLA GROUP COMPANY (Saudi Joint Stock Company) CONSOLIDATED FINANCIAL STATEMENTS December 31, 2008 with AUDITORS REPORT ABCD KPMG Al Fozan & Al Sadhan Al Dainy Plaza Al Madinah Road P. O. Box 55078 Jeddah
SAVOLA GROUP COMPANY (Saudi Joint Stock Company) UNAUDITED INTERIM CONDENSED CONSOLIDATED FINANCIAL STATEMENTS
 UNAUDITED INTERIM CONDENSED CONSOLIDATED FINANCIAL STATEMENTS") SAVOLA GROUP COMPANY (Saudi Joint Stock Company) UNAUDITED INTERIM CONDENSED CONSOLIDATED FINANCIAL STATEMENTS For the Three-Month and Nine-Month Periods Ended September 30, 2008 ABCD KPMG Al Fozan & Al
SAVOLA GROUP COMPANY (Saudi Joint Stock Company) UNAUDITED INTERIM CONDENSED CONSOLIDATED FINANCIAL STATEMENTS For the Three-Month and Nine-Month Periods Ended September 30, 2008 ABCD KPMG Al Fozan & Al
SAVOLA GROUP COMPANY (A Saudi Joint Stock Company)
") CONDENSED CONSOLIDATED INTERIM FINANCIAL STATEMENTS - (UNAUDITED) For the three-month period ended March 31, 2018 together with the Independent Auditors Review Report CONDENSED CONSOLIDATED INTERIM FINANCIAL
CONDENSED CONSOLIDATED INTERIM FINANCIAL STATEMENTS - (UNAUDITED) For the three-month period ended March 31, 2018 together with the Independent Auditors Review Report CONDENSED CONSOLIDATED INTERIM FINANCIAL
SAVOLA GROUP COMPANY (A Saudi Joint Stock Company) CONSOLIDATED FINANCIAL STATEMENTS December 31, 2009 with INDEPENDENT AUDITORS REPORT
 CONSOLIDATED FINANCIAL STATEMENTS December 31, 2009 with INDEPENDENT AUDITORS REPORT") SAVOLA GROUP COMPANY (A Saudi Joint Stock Company) CONSOLIDATED FINANCIAL STATEMENTS December 31, 2009 with INDEPENDENT AUDITORS REPORT ABCD KPMG Al Fozan & Al Sadhan Al Dainy Plaza Al Madinah Road P.
SAVOLA GROUP COMPANY (A Saudi Joint Stock Company) CONSOLIDATED FINANCIAL STATEMENTS December 31, 2009 with INDEPENDENT AUDITORS REPORT ABCD KPMG Al Fozan & Al Sadhan Al Dainy Plaza Al Madinah Road P.
SAVOLA GROUP COMPANY (A Saudi Joint Stock Company) CONSOLIDATED FINANCIAL STATEMENTS December 31, 2010 with INDEPENDENT AUDITORS REPORT
 CONSOLIDATED FINANCIAL STATEMENTS December 31, 2010 with INDEPENDENT AUDITORS REPORT") SAVOLA GROUP COMPANY (A Saudi Joint Stock Company) CONSOLIDATED FINANCIAL STATEMENTS December 31, 2010 with INDEPENDENT AUDITORS REPORT ABCD KPMG Al Fozan & Al Sadhan Al Dainy Plaza Al Madinah Road P.
SAVOLA GROUP COMPANY (A Saudi Joint Stock Company) CONSOLIDATED FINANCIAL STATEMENTS December 31, 2010 with INDEPENDENT AUDITORS REPORT ABCD KPMG Al Fozan & Al Sadhan Al Dainy Plaza Al Madinah Road P.
CONSOLIDATED GROUP RICE PASTA
 CONSOLIDATED GROUP RICE PASTA ANNUAL REPORT Business areas 59 Pasta, sauces and others This division is represented by the companies new world pasta (leader in the United States and Canada), Panzani (no.
Conference Call First Quarter 2014 Financial Results. Presentation3
 Conference Call First Quarter 204 Financial Results Presentation3 May 2, 204 Agenda 2 Presentation3 Agenda 2 3 4 5 6 Opening Remarks Global Alimentos Acquisition Q4 Highlights Operating and Financial Review
SAVOLA GROUP COMPANY (Saudi Joint Stock Company)
") SINDI & BATTERJEE Member of Kreston International SAVOLA GROUP COMPANY (Saudi Joint Stock Company) Unaudited Interim Condensed Consolidated Financial Statements for the Three Months and for the Year Ended
SINDI & BATTERJEE Member of Kreston International SAVOLA GROUP COMPANY (Saudi Joint Stock Company) Unaudited Interim Condensed Consolidated Financial Statements for the Three Months and for the Year Ended
ROADSHOW FRANKFURT 1
 ROADSHOW FRANKFURT 1 1. SONAE AT A GLANCE 2 WE ARE A RETAIL COMPANY Market leader in food and specialized retail formats With Board control of a Shopping Centre and a Telecommunications business SONAE
CSP Program March Indofood Agri Resources Ltd
 CSP Program March 2014 Indofood Agri Resources Ltd Disclaimer Please note that the information is provided for you by way of information only. All the information, report and analysis were and should be
INVESTOR PRESENTATION Q3, 2018
 INVESTOR PRESENTATION Q3, 2018 SABIC AT A GLANCE Top 3 Largest global chemical companies 1 Top 3 Chemical Brand Value 2 Global Headquarters 100+ Countries of sales Production, Distribution, Storage Facilities
Tesco in Asia key messages
 Tesco in Asia key messages Laurie McIlwee, Group Finance Director Tesco in Asia 2010, 21st 23rd November With a population of more than 3.2 billion, Asia offers enormous opportunity China Tesco is a leading
SAVOLA GROUP COMPANY (Saudi Joint Stock Company)
") SINDI & BATTERJEE Member of kreston International P.O. Box 16415 P.O. Box 6685 Jeddah 21464 Jeddah 21452 Saudi Arabia Saudi Arabia SAVOLA GROUP COMPANY (Saudi Joint Stock Company) Unaudited Interim Condensed
SINDI & BATTERJEE Member of kreston International P.O. Box 16415 P.O. Box 6685 Jeddah 21464 Jeddah 21452 Saudi Arabia Saudi Arabia SAVOLA GROUP COMPANY (Saudi Joint Stock Company) Unaudited Interim Condensed
SAVOLA GROUP COMPANY (A Saudi Joint Stock Company)
") CONSOLIDATED FINANCIAL STATEMENTS together with the Independent Auditors Report CONSOLIDATED FINANCIAL STATEMENTS - FOR THE YEAR ENDED DECEMBER 31, 2017 INDEX Page Independent auditor s report on consolidated
CONSOLIDATED FINANCIAL STATEMENTS together with the Independent Auditors Report CONSOLIDATED FINANCIAL STATEMENTS - FOR THE YEAR ENDED DECEMBER 31, 2017 INDEX Page Independent auditor s report on consolidated
SAVOLA GROUP COMPANY (Saudi Joint Stock Company)
") SINDI & BATTERJEE Member of Kreston International SAVOLA GROUP COMPANY (Saudi Joint Stock Company) Unaudited Interim Condensed Consolidated Financial Statements for the Three Months Ended March 31, 2006
SINDI & BATTERJEE Member of Kreston International SAVOLA GROUP COMPANY (Saudi Joint Stock Company) Unaudited Interim Condensed Consolidated Financial Statements for the Three Months Ended March 31, 2006
Switzerland Economic Update QNB Group. September 2014
 Switzerland Economic Update QNB Group September 14 Switzerland Overview Switzerland s efficient capital markets, highly skilled human capital and low corporate tax rates make it the world's most competitive
Nigeria Economic Update QNB Group. September 2014
 Nigeria Economic Update QNB Group September 21 Nigeria Overview A rebasing of GDP in 213 has made Nigeria the biggest economy in Africa with the largest population; the economy is growing rapidly but remains
SAVOLA GROUP COMPANY (A Saudi Joint Stock Company)
") CONDENSED CONSOLIDATED INTERIM FINANCIAL STATEMENTS - (UNAUDITED) For the three month period ended March 31, 2017 together with the Independent Auditors Review Report CONDENSED CONSOLIDATED INTERIM FINANCIAL
CONDENSED CONSOLIDATED INTERIM FINANCIAL STATEMENTS - (UNAUDITED) For the three month period ended March 31, 2017 together with the Independent Auditors Review Report CONDENSED CONSOLIDATED INTERIM FINANCIAL
Huhtamaki roadshow presentation. Investor Relations Copenhagen Jan 8, 2010
 Huhtamaki roadshow presentation Investor Relations Copenhagen Jan 8, 2010 Huhtamaki in brief A leading manufacturer of consumer and specialty packaging with head office in Espoo, Finland Net sales EUR
Institutional Presentation. March
 Institutional Presentation March 2013 Marisa at a glance Largest women fashion and lingerie retailer in Brazil 64 years of track record Focus on the middle class National footprint 2 Multiformat store
Turkey s Largest Food Company
 Turkey s Largest Food Company F o u r t h Q u a r t e r 2 0 1 5 F i n a n c i a l R e s u l t s M a r c h 3, 2 0 1 6 Borsa Istanbul: ULKER ULKER.TI (Bloomberg) ULKER IS (Reuters) www.ulkerbiskuvi.com.tr
SAVOLA GROUP COMPANY (Saudi Joint Stock Company)
") SAVOLA GROUP COMPANY (Saudi Joint Stock Company) Consolidated Financial Statements for the Years ended December 31, 2004 and 2003 and Independent Auditors' Report ABDUL MAJEED H. AJOOZAH P.O. Box 16415
SAVOLA GROUP COMPANY (Saudi Joint Stock Company) Consolidated Financial Statements for the Years ended December 31, 2004 and 2003 and Independent Auditors' Report ABDUL MAJEED H. AJOOZAH P.O. Box 16415
ROADSHOW LONDON. London I 19 November
 ROADSHOW LONDON London I 19 November 2010 1 1. SONAE AT A GLANCE 2 WE ARE A RETAIL COMPANY Market leader in food and specialized retail formats With Board control of a Shopping Centre and a Telecommunications
SAVOLA GROUP COMPANY (Saudi Joint Stock Company)
") SINDI & BATTERJEE Member of Kreston International P.O. Box 16415 P.O. Box 6685 Jeddah 21464 Jeddah 21452 Saudi Arabia Saudi Arabia SAVOLA GROUP COMPANY (Saudi Joint Stock Company) Unaudited Interim Condensed
SINDI & BATTERJEE Member of Kreston International P.O. Box 16415 P.O. Box 6685 Jeddah 21464 Jeddah 21452 Saudi Arabia Saudi Arabia SAVOLA GROUP COMPANY (Saudi Joint Stock Company) Unaudited Interim Condensed
WILMAR INTERNATIONAL LIMITED ANNUAL GENERAL MEETING. 28 April 2016
 WILMAR INTERNATIONAL LIMITED ANNUAL GENERAL MEETING 28 April 2016 IMPORTANT NOTICE Information in this presentation may contain projections and forward looking statements that reflect the Company s current
Turkey s Largest Food Company
 Turkey s Largest Food Company F i r s t H a l f 2017 F i n a n c i a l R e s u l t s A u g 16, 2 0 1 7 Borsa Istanbul: ULKER ULKER.TI (Bloomberg) ULKER IS (Reuters) www.ulkerbiskuvi.com.tr Disclaimer This
FONTERRA INTERIM RESULTS 2014
 FONTERRA INTERIM RESULTS 2014 Market Briefing FONTERRA CO-OPERATIVE GROUP LIMITED Overview John Wilson Chairman 2 Working Area Safee Copy Frame. This denotes working area and must be deleted before final
Almarai Company. Fiscal Year 2018 and Fourth Quarter 2018
 Fiscal Year 2018 and Fourth Quarter 2018 Disclaimer Information contained in this presentation is subject to change without further notice, its accuracy is not guaranteed and it may not contain all material
SAVOLA GROUP COMPANY (A Saudi Joint Stock Company)
") UNAUDITED INTERIM CONSOLIDATED FINANCIAL STATEMENTS For the three-month period and year ended December 31, 2016 with INDEPENDENT AUDITORS REVIEW REPORT UNAUDITED INTERIM CONSOLIDATED FINANCIAL STATEMENTS
UNAUDITED INTERIM CONSOLIDATED FINANCIAL STATEMENTS For the three-month period and year ended December 31, 2016 with INDEPENDENT AUDITORS REVIEW REPORT UNAUDITED INTERIM CONSOLIDATED FINANCIAL STATEMENTS
Fixed Income Presentation 3Q17
 Fixed Income Presentation 3Q17 1 Agenda 1. Company Overview 2. Investment Highlights 3. Operating and Financial Highlights 2 Section 1 Company Overview 3 Company Overview Company Overview Competitive Advantages
Forward looking statements
 Presentation to investors April 2008 1 Forward looking statements 2 This document contains certain forward-looking statements concerning Groupe DANONE. Although Groupe DANONE believes its expectations
Q Sales January 22 nd 2019
 Q4 20 Sales January 22 nd 2019 Highlights Solid sales growth in Q4 and FY 20: +1.9% LFL in Q4 and +1.4% in FY Group sales up +1.9% LFL vs +1.1% over first 9 months Food e-commerce sales up by more than
Middle East and North Africa Regional Economic Outlook
 Regional Economic Outlook Morocco Algeria Tunisia Libya Lebanon Egypt Syria Iraq Iran Jordan Saudi Kuwait Arabia Bahrain Afghanistan Pakistan Mauritania Sudan Djibouti Qatar Yemen Oman United Arab Emirates
Conference Call Second Quarter 2013 Financial Results. Presentation3
 Conference Call Second Quarter 2013 Financial Results Presentation3 August 2, 2013 Agenda 1 Agenda 1 2 Opening Remarks 2Q13 Highlights 3 Operating and Financial Review 4 Closing Remarks 5 Q&A 2 1 Alicorp
GLOBAL CONSUMER & RETAIL. London I 22 September
 GLOBAL CONSUMER & RETAIL CONFERENCE London I 22 September 2010 1 1. SONAE AT A GLANCE 2 WE ARE A RETAIL COMPANY Market leader in food and specialized retail formats With Board control of a Shopping Centre
Agenda. Financial Review. Review of Operations. Future Plans and Strategies. Open Forum
 22 October 2009 1 Disclaimer The information contained in this presentation is intended solely for your personal reference. Such information is subject to change without notice, its accuracy is not guaranteed
Current trends in generic medicines in the Middle East: challenges and opportunities. Mazen Darwazah Vice Chairman, Hikma Pharmaceuticals PLC
 Current trends in generic medicines in the Middle East: challenges and opportunities Mazen Darwazah Vice Chairman, Hikma Pharmaceuticals PLC Middle East and North African pharmaceutical markets Middle
Development of Economy and Financial Markets of Kazakhstan
 Development of Economy and Financial Markets of Kazakhstan National Bank of Kazakhstan Macroeconomic development GDP, real growth, % 116 112 18 14 1 113,5 11,7 216,7223,8226,5 19,8 19,8 19,3 19,619,7 199,
Huhtamaki roadshow presentation. Investor Relations Q1 2009
 Huhtamaki roadshow presentation Investor Relations 2009 Huhtamaki in brief A leading manufacturer of consumer and specialty packaging with head office in Espoo, Finland Net sales EUR 2.3 billion in 65
Luis Henrique. Guimarães CEO
 Luis Henrique Guimarães CEO Disclaimer This presentation contains estimates and forward-looking statements regarding our strategy and opportunities for future growth. Such information is mainly based on
Fixed Income Presentation 1Q18
 Fixed Income Presentation 1Q18 1 Agenda 1. Company Overview 2. Investment Highlights 3. Operating and Financial Highlights 2 Section 1 Company Overview 3 Company Overview Company Overview Competitive Advantages
Arçelik Financial Results
 Arçelik 2015 Financial Results 4Q15 developments Key developments Strong growth in international sales, both organic and FX related Record breaking monthly international sales in October and November Good
Bunge Sugar & Bioenergy OTC Pricing Solutions. Bangkok, 20 th September 2010.
 Bunge Sugar & Bioenergy OTC Pricing Solutions Bangkok, 20 th September 2010. Forward Looking Statements Today s presentation includes forward-looking statements that reflect Bunge s current views with
Almarai Company. Annual Results 2017
 Annual Results 2017 Disclaimer Information contained in this presentation is subject to change without further notice, its accuracy is not guaranteed and it may not contain all material information concerning
Rising Middle East Stock Markets
 Rising Middle East Stock Markets Index, January 2002 = 100 1400 1200 1000 800 600 400 200 Egypt Israel Jordan Kuwait Saudi Arabia U.A.E. 0 2003 2004 2005 2006 Source: Bloomberg Capital Access Index 2006
Nestlé India Limited 20th Financial Analysts Meet - Gurgaon 30th November 2011
 Nestlé India Limited 20 th Financial Analysts Meet - Gurgaon 30 th November 2011 Disclaimer This presentation may contain statements which reflect Management s current views and estimates and could be
Travel Insurance and Assistance
 Travel Insurance and Assistance Worldwide research covering over 40 countries Series Prospectus Finaccord 1 Prospectus contents Page What is the research? Which countries are covered What methodology has
AXA. Jean-Laurent Granier. Chairman & CEO of AXA Global P&C CEO of the Mediterranean and Latin American Region Member of the Management Committee
 AXA Jean-Laurent Granier Chairman & CEO of AXA Global P&C CEO of the Mediterranean and Latin American Region Member of the Management Committee March 27, 2014 Morgan Stanley European Financials Conference
Investor. Presentation
 Dubai Financial Market Investor a Presentation 2 0 1 6 www.dfm.ae This Investor Presentation has been prepared by Dubai Financial Market PJSC ( DFM or the Company ) for investors, solely for informational
German Investment Seminar 2011 Commerzbank AG New York January 10-11, 2011
 German Investment Seminar 2011 Commerzbank AG Mark Langer Chief Financial Officer Dennis Weber Head of Investor Relations New York January 10-11, 2011 German Investment Seminar, Commerzbank HUGO BOSS January
Yara International ASA Third Quarter results 2013
 Yara International ASA Third Quarter results 213 18 October 213 IR-Date: 213-1-18 1 Summary third quarter Strong results despite weaker commodity fertilizer markets 17% increase in deliveries including
McCormick & Company, Inc. Fourth quarter 2010 financial results and business outlook January 26, 2011
 McCormick & Company, Inc. Fourth quarter 2010 financial results and business outlook January 26, 2011 The following slides accompany a January 26, 2011 presentation to investment analysts. This information
Yara International ASA First Quarter results 2013
 Yara International ASA First Quarter results 213 22 April 213 1 Summary first quarter Strong results with stable margins Strong cash flow Fertilizer deliveries close to last year despite late spring Record
AXA. Henri de Castries. Chairman & CEO. London - October 2, Sanford C. Bernstein Strategic Decisions Conference
 AXA Henri de Castries Chairman & CEO London - October 2, 2013 Sanford C. Bernstein Strategic Decisions Conference Cautionary note concerning forward-looking statements Certain statements contained herein
Palestine Securities Exchange PSE
 Palestine Securities Exchange PSE Contents Palestine Economy Foreign investment in Palestine Market Highlights Company Highlights Why Invest in Palestine Contacts 3 4 5-8 9-14 15-21 22 2 Millions (US$)
Egypt Resilience and Potential
 Egypt Resilience and Potential INTERNATIONAL BANKING FORUM 2011 Brescia, 16-17 June 2011 Issa, Ahmed Head of Financial Institutions Group Commercial International Bank Agenda o January 25 th February 11
Russia: Macro Outlook for 2019
 October 2018 Russia: Macro Outlook for 2019 Natalia Orlova Head of Alfa Bank Macro Insights +7 495 795 36 77 norlova@alfabank.ru Egypt Saudi Arabia Brazil S. Africa UAE Iraq China Japan US Mexico UK Russia
Investors Presentation. Kuwait Telecommunications Company K.S.C.P
 Investors Presentation Kuwait Telecommunications Company K.S.C.P Table of content VIVA s History in Brief 3 Key Milestones 4 Vision and Values 5 Shareholders' Structure 6 Population & Penetration 7 Competitive
Named by Forbes Magazine One of America's Best Managed Companies in 2005 and One of America s Best Big Companies in 2006
 Named by Forbes Magazine One of America's Best Managed Companies in 2005 and One of America s Best Big Companies in 2006 June 2006 1 Forward-Looking Statements and Discussion of and Reconciliation of Non-GAAP
Business & Operating Review
 Business & Operating Review 0 This presentation may contain financial or business projections regarding recent acquisitions, their financial or business impact, management expectations and objectives regarding
DeA Capital. XXXXXXXXXXX [TITOLO] DeA Capital update
![DeA Capital. XXXXXXXXXXX [TITOLO] DeA Capital update](/thumbs/91/105675078.jpg "DeA Capital. XXXXXXXXXXX [TITOLO] DeA Capital update") DeA Capital XXXXXXXXXXX [TITOLO] DeA Capital update Milan - July 2014 1 1 DeA Capital at a glance Private equity Direct investments Food retail 2.5 bn sales Private healthcare 1.7 bn revenues Fund Investments
DeA Capital XXXXXXXXXXX [TITOLO] DeA Capital update Milan - July 2014 1 1 DeA Capital at a glance Private equity Direct investments Food retail 2.5 bn sales Private healthcare 1.7 bn revenues Fund Investments
Q Results presentation
 Q1 2016 Results presentation 12 May 2016 1 Disclaimer This presentation (the "Presentation") has been prepared and is issued by, and is the sole responsibility of Telepizza Group, S.A. ( Telepizza" or
D U B A I F I N A N C I A L M A R K E T. HSBC MENA Business Leader Equity Investor Forum
 D U B A I F I N A N C I A L M A R K E T HSBC MENA Business Leader Equity Investor Forum Dubai - October 2010 1 Contents 1. UAE Financial Sector Vision and Strategy 2. UAE Capital Markets 3. Dubai Financial
DeA Capital. XXXXXXXXXXX [TITOLO] DeA Capital update
![DeA Capital. XXXXXXXXXXX [TITOLO] DeA Capital update](/thumbs/91/105675082.jpg "DeA Capital. XXXXXXXXXXX [TITOLO] DeA Capital update") DeA Capital XXXXXXXXXXX [TITOLO] DeA Capital update September 2014 1 1 DeA Capital at a glance Private Equity Direct investments Food retail 2.5 bn sales Private healthcare 1.7 bn revenues Fund Investments
DeA Capital XXXXXXXXXXX [TITOLO] DeA Capital update September 2014 1 1 DeA Capital at a glance Private Equity Direct investments Food retail 2.5 bn sales Private healthcare 1.7 bn revenues Fund Investments
Investor Presentation. August 2013
 Investor Presentation August 013 1 Some of the information in this presentation may contain projections or other forward-looking statements regarding future events or the future financial performance of
Almacenes Exito. Casino s Analyst Day December 10-11, 2009
 Almacenes Exito Casino s Analyst Day December 10-11, 2009 1 Agenda Almacenes Exito in a snapshot Colombia: Macroeconomic Overview and Retail Market Our Strategy Financial Highlights Opportunities going
SAVOLA GROUP COMPANY (A Saudi Joint Stock Company)
") CONSOLIDATED FINANCIAL STATEMENTS together with the Independent Auditors Report CONSOLIDATED FINANCIAL STATEMENTS FOR THE YEAR ENDED DECEMBER 31, 2018 INDEX Page Independent auditor s report on consolidated
CONSOLIDATED FINANCIAL STATEMENTS together with the Independent Auditors Report CONSOLIDATED FINANCIAL STATEMENTS FOR THE YEAR ENDED DECEMBER 31, 2018 INDEX Page Independent auditor s report on consolidated
Polyplex (Thailand) Public Limited Company
 Public Limited Company") Polyplex (Thailand) Public Limited Company Presentation at the SET Opportunity Day Monday, 19 th March 2012 Website : www.polyplexthailand.com Contents BOPET Film Industry Polyplex group Polyplex Competitive
Polyplex (Thailand) Public Limited Company Presentation at the SET Opportunity Day Monday, 19 th March 2012 Website : www.polyplexthailand.com Contents BOPET Film Industry Polyplex group Polyplex Competitive
Food for Thought. Saudi Agriculture and Food Sector
 Food for Thought Saudi Agriculture and Food Sector Detailed Coverage 2017 Food provides essential nutrients needed by living beings for survival, therefore food has a definite demand irrespective of the
Palestine Securities Exchange PSE
 Palestine Securities Exchange PSE Contents Palestine Economy Foreign investment in Palestine Market Highlights Company Highlights Why Invest in Palestine Contacts 3 4 5-8 9-14 15-21 22 2 Palestine Economy
Travel Insurance and Assistance
 Travel Insurance and Assistance Worldwide research covering over 40 countries Series Prospectus Finaccord Web: www.finaccord.com. E-mail: info@finaccord.com 1 Prospectus contents Page What is the research?
INVESTOR PRESENTATION JANUARY 2018
 INVESTOR PRESENTATION JANUARY 2018 0 FORWARD-LOOKING STATEMENTS Forward-Looking Statements This presentation contains forward-looking statements that are subject to risks and uncertainties. All statements
REAL ESTATE INVESTMENT TRUSTS INSIGHTS ON SAUDI ARABIA Q1 2018
 COMMERCIAL RESEARCH REAL ESTATE INVESTMENT TRUSTS INSIGHTS ON SAUDI ARABIA Q1 2018 Key findings In Saudi Arabia, six new REITs have been listed on the Tadawul, taking the total number of listed REITs on
Takaful Business Challenges and Opportunities
 Life Insurance Conference 2012 Takaful Business Challenges and Opportunities 9 November 2012 Amara Sanctuary Resort Sentosa, Singapore By: Hans De Cuyper Chief Executive Officer Etiqa Insurance & Takaful
DeA Capital. XXXXXXXXXXX [TITOLO] DeA Capital at a glance
![DeA Capital. XXXXXXXXXXX [TITOLO] DeA Capital at a glance](/thumbs/91/106044031.jpg "DeA Capital. XXXXXXXXXXX [TITOLO] DeA Capital at a glance") DeA Capital XXXXXXXXXXX [TITOLO] DeA Capital at a glance March 2015 1 1 DeA Capital at a glance Alternative Asset Management 10.5 bln AuM RE services Real estate funds Private equity funds, FoFs Project,
DeA Capital XXXXXXXXXXX [TITOLO] DeA Capital at a glance March 2015 1 1 DeA Capital at a glance Alternative Asset Management 10.5 bln AuM RE services Real estate funds Private equity funds, FoFs Project,
1H 2018 Results Presentation
 1H 2018 Results Presentation Agenda of the presentation 1. Executive Summary 2. Summary of Eurocash parts (segments) 3. Market overview 4. Eurocash Financials 2 1. Executive summary WHOLESALE - STRONG
2017 HALF-YEAR RESULTS
 I 1 I 2017 HALF-YEAR RESULTS July 27, 2017 Emmanuel Faber, CEO Cécile Cabanis, CFO I 2 I This document is presented by Danone. It contains certain forward-looking statements concerning Danone. In some
Investor Presentation. June 2018
 Investor Presentation June 2018 Contents Bank Muscat Introduction Operating environment Bank Muscat business - Overview Financial Performance Annexure Note: The financial information is updated as of 30
Making it happen. 6 March 2018
 Making it happen 6 March 2018 LEGAL NOTICE This presentation has been prepared to inform investors and prospective investors in the secondary markets about the Group and does not constitute an offer of
Danone Model in Motion
 Danone Model in Motion Franck Riboud Sept 7 th, 2011 2 Disclaimer This document contains certain forward-looking statements concerning DANONE. Although DANONE believes its expectations are based on reasonable
Q Investor Presentation
 Q1-2016 Investor Presentation Kuwait Telecommunications Company K.S.C.P Table of content VIVA s History in Brief 2 Key Milestones 3 Vision and Values 4 Shareholders' Structure 5 Population & Penetration
COMPANY PRESENTATION. November /
 ...... COMPANY PRESENTATION November / 2017 1...... ...... FOOD FOR THE WELL-BEING OF SOCIETY AND PEOPLE S HAPPINESS This is the greater purpose that inspires the Company s mission. 2...... ...... AGENDA
Commodity Profile of Wheat for August 2017
 (as on 17.8.217) Commodity Profile of Wheat for August 217 Contents 1. Wheat estimates for India... 2 2. Wheat estimates for the World... 2 3. India s Wheat Production, Area under Cultivation and Yield...
Commodity Profile of Wheat for June 2017
 (as on 23.6.217) Commodity Profile of Wheat for June 217 Contents 1. Wheat estimates for India... 2 2. Wheat estimates for the World... 2 3. India s Wheat Production, Area under Cultivation and Yield...
DeA Capital. XXXXXXXXXXX [TITOLO] DeA Capital at a glance. March 2016 Star Conference Milano
![DeA Capital. XXXXXXXXXXX [TITOLO] DeA Capital at a glance. March 2016 Star Conference Milano](/thumbs/91/106044091.jpg "DeA Capital. XXXXXXXXXXX [TITOLO] DeA Capital at a glance. March 2016 Star Conference Milano") DeA Capital XXXXXXXXXXX [TITOLO] DeA Capital at a glance March 2016 Star Conference Milano 1 1 DeA Capital at a glance Alternative Asset Management 9.5 bln AuM RE services Real estate funds Private equity
DeA Capital XXXXXXXXXXX [TITOLO] DeA Capital at a glance March 2016 Star Conference Milano 1 1 DeA Capital at a glance Alternative Asset Management 9.5 bln AuM RE services Real estate funds Private equity
Travel Insurance and Assistance
 Travel Insurance and Assistance Worldwide research covering over 40 countries Series Prospectus Finaccord Ltd., 2016 Web: www.finaccord.com. E-mail: info@finaccord.com 1 Prospectus contents Page What is