Invesco Balanced-Risk Commodity Strategy Annual Update
|
|
|
- Adele McCarthy
- 5 years ago
- Views:
Transcription
1


2 Invesco Balanced-Risk Commodity Strategy Annual Update Water and Power Employees Retirement Plan August 8, 2018 For one-on-one U.S. institutional investor use only. All material presented is compiled from sources believed to be reliable and current, but accuracy cannot be guaranteed. This is being provided for informational purposes only, is not to be construed as an offer to buy or sell any financial instruments and should not be relied upon as the sole factor in any investment making decision. This should not be considered a recommendation to purchase any investment product. As with all investments there are associated inherent risks. This does not constitute a recommendation of any investment strategy for a particular investor. Investors should consult a financial professional before making any investment decisions if they are uncertain whether an investment is suitable for them. Please read all financial material carefully before investing. For additional educational information about the strategy, contact Invesco. Past performance is not indicative of future results. This portfolio is actively managed. Portfolio holdings and characteristics are subject to change. The opinions expressed herein are based on current market conditions and are subject to change without notice. These opinions may differ from those of other Invesco investment professionals. Investment products offered are Not FDIC Insured, May Lose Value, and are Not Bank Guaranteed. Invesco Advisers, Inc. is an investment adviser and does not sell securities. US /18
3 Table of contents Company Overview Investment Process and Discipline Market Overview Water & Power Employees Retirement Plan Performance Review Fee Schedule Additional Information and Disclosures Glossary of Investment Terms 2


4 Introduction Michael McHugh, CFA Client Portfolio Manager, Invesco Global Asset Allocation Joined Invesco in 1998 and the Global Asset Allocation team in Began working in the financial industry in in 1996 as a financial advisor for American Express Financial Advisors, Inc. Received his B.S. in business information systems from Bellevue University. He is a CFA charter holder and holds the Series 3, 7, 30, 63 and 66 registrations. Delia M. Roges Managing Director, Public Funds Sales & Service Team Joined Invesco in Over 20 years of institutional investment management experience. Serves on the Board of Regents Loyola Marymount University and the Board of Visitors at the School of Education at Loyola Marymount University. Received her B.B.A. in Finance from Loyola Marymount University and her M.B.A. from the University of Southern California. 3
5 Depth of investment capabilities Our wide range of investment capabilities is designed to support a variety of financial objectives Invesco offers a wide range of single-country, regional and global capabilities across major equity, fixed income and alternative asset classes, delivered through a diverse set of investment vehicles. A wide range of investment capabilities Equity Fixed Income and Balanced Alternative Money Market AUM: $431.2 B AUM: $304.5 B AUM: $57.7 B AUM: $144.2 B Market cap Investment style Global/regional/ single country Developed/emerging Sector Quantitative Directional long/ short (130/30) Cash management Duration Sector Investment grade/ high yield Global/regional Developed/emerging Tax-free bonds Active balanced Risk parity (risk premia capture) Target maturity Target risk Traditional balanced Absolute return Market neutral Multistrategy Global macro Private equity Fund of funds Buyout, emerging Commodities Financial structures Bank loans Credit arbitrage Opportunistic Real estate Public real estate securities Private direct US, Asian, European, global Delivered to investors through diverse investment vehicles Institutional separate accounts Collective trusts Funds (open/closed end, on/offshore) Exchange-traded funds (ETFs) Unit investment trusts (UITs) Private placements Sub-advised Separately managed accounts/unified managed accounts Variable insurance funds Customized solutions Source: Invesco Ltd. All data as of Dec. 31, 2017 and includes all assets under advisement, distributed and overseen by Invesco. Invesco Distributors, Inc. is the US distributor for Invesco Ltd. s retail products. Not all investors are eligible to invest in each investment vehicle. Specific residency restrictions apply to offshore funds. Invesco s variable insurance funds are used solely as investment vehicles by insurance company separate accounts to fund variable insurance products. Invesco Distributors, Inc. does not offer any variable products. Investment vehicles listed, including ETFs, in and of themselves, do not qualify as diversified investment strategies. For more information, contact your Invesco representative. 4
6 Invesco Global Asset Allocation Investment strategies Research Focus Risk Allocation and Management - balance risk exposures and create well-defined risk budgets Purpose-built Portfolios - improve the expected Sharpe Ratio within asset classes Tactical Allocation emphasize attractive assets and deemphasize unattractive assets Asset Class Focus Equities Fixed Income Commodities Implement primarily with futures and other derivatives providing ample liquidity though will adjust where client outcomes require (e.g., income) Client Outcomes Balanced Core Balanced-Risk Allocation (9/08)* $19.0 Billion Commodities Balanced-Risk Commodity (9/08)* $2.8 Billion Equities Defensive Growth (12/17)* $13.6 Million Global Macro Macro Allocation (9/12)* $0.9 Billion Income Multi-Asset Income (12/11)* $0.7 Billion $25.9 Billion AUM** Source: Invesco as of 06/30/18. *Inception dates. **Total GAA assets include $2.5 billion managed in multi-asset portfolios. 5
7 Invesco Global Asset Allocation Team summary Deep, Experienced Team Long Tenure Low Turnover Team Members Years with Invesco Research & PM Changes Research & PM CPM, Implementation, Business Support Total Team Research & PM CPM, Implementation, Business Support Research & Inception Added Resources Lost Resources Current Average Experience Senior Portfolio Managers Member Role Strats Owned 2 Yrs Exp Ttl / IVZ Scott Wolle CIO 25 / 17 Mark Ahnrud Sr. PM 31 / 16 Senior PM Changes Total Team Research & PM CPM, Implementation, Business Support Chris Devine Sr. PM 20 / 18 Scott Hixon Sr. PM, Hd of Research 24 / 22 Christian Ulrich Sr. PM 29 / 16 4 Research & Inception Added Resources Lost Resources Current Source: Invesco. As of 06/30/18. 1 Since Invesco Balanced-Risk Allocation inception 09/30/ % of 4 key strategies that each team member invests in. indicates all strategies, indicates none of the strategies. 6
8 Invesco Global Asset Allocation Key Invesco contacts Delia Roges Managing Director, Invesco Public Funds 101 California Street, Suite 1800 San Francisco, CA Michael McHugh, CFA Client Portfolio Manager, Invesco Global Asset Allocation 11 Greenway Plaza, Suite 1000 Houston, TX George Avery Client Portfolio Manager, Invesco Global Asset Allocation 1555 Peachtree Street, NE Atlanta, GA Mark Ahnrud, CFA Senior Portfolio Manager, Invesco Global Asset Allocation 1555 Peachtree Street, NE Atlanta, GA Scott Wolle, CFA Chief Investment Officer, Invesco Global Asset Allocation 1555 Peachtree Street, NE Atlanta, GA Source: Invesco. As of 06/30/18. 7
9 Table of contents Company Overview Investment Process and Discipline Market Overview Water & Power Employees Retirement Plan Performance Review Fee Schedule Additional Information and Disclosures Glossary of Investment Terms 8
10 Invesco Balanced-Risk Commodity Strategy Investment objective Strategy objectives The investment objective is to provide total return. Outperform the Bloomberg Commodity Index by 5% per year over a full market cycle Seeks better risk diversification and smaller drawdowns than common benchmarks Additional benefits No lock-up Daily liquidity Transparency Please see the derivatives and leverage risk disclosures in the additional information section of this document. 9
11 Invesco Balanced-Risk Commodity Strategy Investment universe Agriculture/ Livestock Energy Industrial Precious Soy Meal WTI Crude Copper Gold Soybeans Brent Crude Aluminum Silver Soybean Oil Gasoline Nickel* Sugar Heating Oil Zinc* Assets Corn Wheat Cotton Gas Oil Natural Gas Coffee Cocoa** Live Cattle** Lean Hogs** Universe covers each of the four major complexes Minimum liquidity of $1 billion trading volume standardized for 10% volatility for strategic assets Source: Invesco. As of 06/30/18. *Tactical assets only. **Limited allocation 10
12 Invesco Balanced-Risk Commodity Strategy Drivers of return: four key sources Structural Sources Tactical Sources Term Structure Weighting Equal Risk Contribution Optimal Roll Tactical Allocation Long-term returns driven by average term structure which is determined by scarcity and difficulty of storage Take advantage of low correlation between assets and across complexes to manage overall risk exposure Term structure of commodity futures creates opportunity to achieve higher returns than available through front-month investments Alter exposure to commodities based on three considerations: Supply and demand balance Economic environment Price trends 11
13 Invesco Balanced-Risk Commodity Strategy Investment process Strategic 1 Asset The universe of 23 assets is evaluated based on two key concepts; term Selection structure (TS) and equal risk contribution (ERC). 2 Portfolio The strategic allocation is built by balancing the risk contribution from the term Construction structure (TS) and equal risk contribution (ERC) concepts. Tactical 3 Tactical Take advantage of optimal roll as well as short- to medium-term tactical Allocation opportunities with 3% ex-ante risk target. Final portfolio Four targeted sources of return Target return objective of Bloomberg Commodity Index +5% Source: Invesco. For illustrative purposes only. 12
14 Invesco Balanced-Risk Commodity Strategy Step one: Asset selection- term structure Focus on Term Structure Strategic Commodity Selection 20% 15% Backwardation Universe Define universe of commodities: Liquid commodities Average Annualized Excess Return (%) Gasoline 10% Soymeal 5% Copper Brent Soybean Silver Gasoil Heating Oil Gold Live Cattle Sugar 0% WTI Crude Oil SoyBean Oil -5% Cotton Aluminum Corn Coffee -10% Wheat Contango -15% Natural Gas -20% -20% -15% -10% -5% 0% 5% 10% 15% Backwardation Contango 100% 0% Term Structure Adjustment Top 30% get a weight multiplier of 1.0 and the bottom 30% are excluded Commodities between the 30 th and 70 th percentile are ranked according to their term structure Strategic allocation based on term structure to emphasize commodities that are scarce or difficult to store Average Annualized Term Structure (%) Sources: Invesco analysis and Bloomberg L.P. Time period represented: 09/30/90 12/31/17. Backwardation refers to a status where prices of futures contracts with a longer maturity are lower than the spot price of the commodity. Contango refers to a status where prices of futures contracts with a longer maturity are higher than the spot price of the commodity. Excess return relative to cash. For illustrative purposes only. Past performance cannot guarantee future results. 13
15 Invesco Balanced-Risk Commodity Strategy Step one: Term structure weighting Benchmark Excess Returns Tertile Excess Returns Annualized Excess Return (%) Annualized Excess Return (%) GSCI Light Energy* Bloomberg** -6 Top 30% Middle 40% Bottom 30% Term structure is an important influence on long-term commodity returns. Sources: Bloomberg Commodity Index, GSCI Light Energy Commodity Index and Invesco analysis. Period covered: 01/31/91 12/31/17. *Inception date is 5/01/91. **Inception date 7/14/98. Performance prior to inception dates is back-tested and not actual performance. Index returns are not representative of strategy returns and provide no assurance of future performance. Returns are in excess of cash. Past performance cannot guarantee future results. 14
16 Invesco Balanced-Risk Commodity Strategy Step one: Asset selection low complex correlation 1.00 Correlation Within Commodity Complexes* Average correlation Across Complexes Agriculture Energy Industrial Precious *GSCI Index. Past performance is not a guarantee of future results. For illustrative purposes only. Sources: Invesco analysis and DataStream. Time period represented: 09/30/90 12/31/17. Inception date is 05/07/07. Performance prior to inception dates is back-tested and not actual performance. 15
17 Invesco Balanced-Risk Commodity Strategy Step one: Asset selection equal risk contribution Bloomberg Commodity Index Asset Weight Risk Contribution (%) Weight (%) Precious 15 Industrial 17 Agriculture/ Livestock 36 Energy 32 Asset weights drive risk allocation Industrial 15 Precious 9 Energy 49 Agriculture/ Livestock 27 Equal Risk Contribution Risk Contribution (%) Asset Weight Agriculture/ Livestock 25 Precious 25 Energy 25 Industrial 25 Risk allocation drives asset weights Weight (%) Precious 28 Industrial 23 Agriculture/ Livestock 28 Energy 21 Sources: Invesco analysis and DataStream. As of 12/31/17. 16
18 Invesco Balanced-Risk Commodity Strategy Step two: Portfolio construction combined approach Summary Annualized Risk & Return by Commodity Allocation Approach (1/91 12/17) 12% The strategic combination of TS and ERC reduces both volatility and material concentration in unattractive assets. The combination is riskbalanced so each concept contributes equally to the Annualized Return 10% 8% 6% 4% 2% Higher return, similar risk and beta. TS & ERC ß = 0.91 ERC ß = 0.81 BCOM ß = 1.0 TS ß = 1.05 strategic allocation. 0% 0% 5% 10% 15% 20% 25% Annualized Risk ß = 1.0 Bubble size reflects beta to Bloomberg Commodity Index (BCOM). Bubble to left reflects a beta of 1.0. TS stands for Term Structure, ERC for Equal Risk Contribution and BCOM for Bloomberg Commodity Index. Sources: CRB, Bloomberg L.P., Datastream, Invesco analysis. Bloomberg Commodity Index used as a proxy for portfolios. Inception date 7/14/98. Performance prior to inception dates is back-tested and not actual performance. Index returns are not representative of strategy returns and provide no assurance of future performance. 17
19 Invesco Balanced-Risk Commodity Strategy Step three: Tactical allocation - optimal roll yield Term Structure Optimal Roll vs. Front Month: Excess Return and Risk Contract Price on 02/28/ Annualized Excess Return (%) 5 0 Optimal Roll 5.45 / Front Month / /16 06/16 08/16 10/16 12/16 02/17 Contract Expiration Standard Deviation (Risk) Sources: Invesco analysis and DataStream. Data from 12/31/91 to 12/31/17. For illustrative purposes only. Front Month return is the GSCI Crude Oil excess return. Optimal Roll return is the Deutsche Bank Optimum Yield Light Crude Oil excess return. Past performance is not a guarantee of future results. 18
20 Invesco Balanced-Risk Commodity Strategy Step three: Tactical allocation - signal generation Supply and Demand Objectively determine the supply demand balance and understand the impact on future prices 1.0 Composite Tactical Strategy - Signal Allocation Range Maximum Bullish + Economic Environment Measure the impact of the economic environment on asset prices Target Strategy Neutral + Investor Positioning = Composite Signal Take advantage of behavioral biases as expressed in shortand intermediate-term price movements Combine the signals into a composite score -1.0 Maximum Bearish Each asset is modeled individually relative to cash Model signals implemented monthly 3% risk target Source: Invesco analysis. For illustrative purposes only. Although every effort will be made, it cannot be guaranteed that the stated targets will be reached. 19
21 Invesco Balanced-Risk Commodity Strategy Step three: Tactical allocation - decision diversification Max. Net Investment (%) Tactical Range Allocation Range 0 Min. Low-Risk Uncorrelated Assets A B C D E High-Risk Correlated Asset D 20% E 20% A 20% Risk Allocation C 20% B 20% Net Notional Exposure (%) Tactical 75% 125% Balance risk among available decisions Unique operating range for each allocation decision Investment process determines positioning within operating range Tactical process results in net notional exposure that can range from 75% to 125% invested Source: Invesco analysis. For illustrative purposes only. Although every effort will be made, it cannot be guaranteed that the stated targets will be reached. 20
22 Invesco Balanced-Risk Commodity Strategy Step three: Risk contribution and notional exposure Risk Contribution (%) Agriculture 75% Energy 50 50% Industrial 25 25% Precious 0 Oct-08 Jan-09 Apr-09 Jul-09 Oct-09 Jan-10 Apr-10 Jul-10 Oct-10 Jan-11 Apr-11 Jul-11 Oct-11 Jan-12 Apr-12 Jul-12 Oct-12 Jan-13 Apr-13 Jul-13 Oct-13 Jan-14 Apr-14 Jul-14 Oct-14 Jan-15 Apr-15 Jul-15 Oct-15 Jan-16 Apr-16 Jul-16 Oct-16 Jan-17 Apr-17 Jul-17 Oct-17 Jan-18 Apr-18 Jul-18 Total Notional Exposure (%) Oct-08 Jan-09 Apr-09 Jul-09 Oct-09 Jan-10 Apr-10 Jul-10 Oct-10 Jan-11 Apr-11 Jul-11 Oct-11 Jan-12 Apr-12 Jul-12 Oct-12 Jan-13 Apr-13 Jul-13 Oct-13 Jan-14 Apr-14 Jul-14 Oct-14 Jan-15 Apr-15 Jul-15 Oct-15 Jan-16 Apr-16 Jul-16 Oct-16 Jan-17 Apr-17 Jul-17 Oct-17 Jan-18 Apr-18 Jul-18 Source: Invesco analysis. The risk contributions represent each asset class as a percentage of the total portfolio standard deviation in the month in which it was implemented. Notional exposure in the month in which it was implemented. Data as of 06/30/18. 21
23 Table of contents Company Overview Investment Process and Discipline Market Overview Water & Power Employees Retirement Plan Performance Review Fee Schedule Additional Information and Disclosures Glossary of Investment Terms 22
24 Invesco Balanced-Risk Commodity Strategy Representative commodity performance returns Agriculture Energy Industrial Precious 2Q 2018 (%) Year (%) Sources: Bloomberg L.P., GSCI and Invesco analysis. Data as of 06/30/18 based on continuous future return indices. Commodities represented by the S&P GSCI sub-indices. Past performance is not a guarantee of future results. 23
25 Invesco Balanced-Risk Commodity Strategy Directional tactical model signals 1.0 April July Tactical Model Signal Agriculture Energy Industrial Precious Target Risk Contribution (%) Total Notional Weight (%) April 2018 July 2018 April 2018 July 2018 Agriculture Energy Industrial Precious Total Source: Invesco analysis. *Not included in strategic allocation. Tactical model signal represents the magnitude of overweights/underweights of each asset relative to its strategic allocation from a risk perspective in the month in which it was implemented. -1 is the maximum underweight, 0 represents neutral and +1 is the maximum overweight. Each signal is mapped based on the determined tactical allocation ranges for each asset. 24
26 Table of contents Company Overview Investment Process and Discipline Market Overview Water & Power Employees Retirement Plan Performance Review Fee Schedule Additional Information and Disclosures Glossary of Investment Terms 25
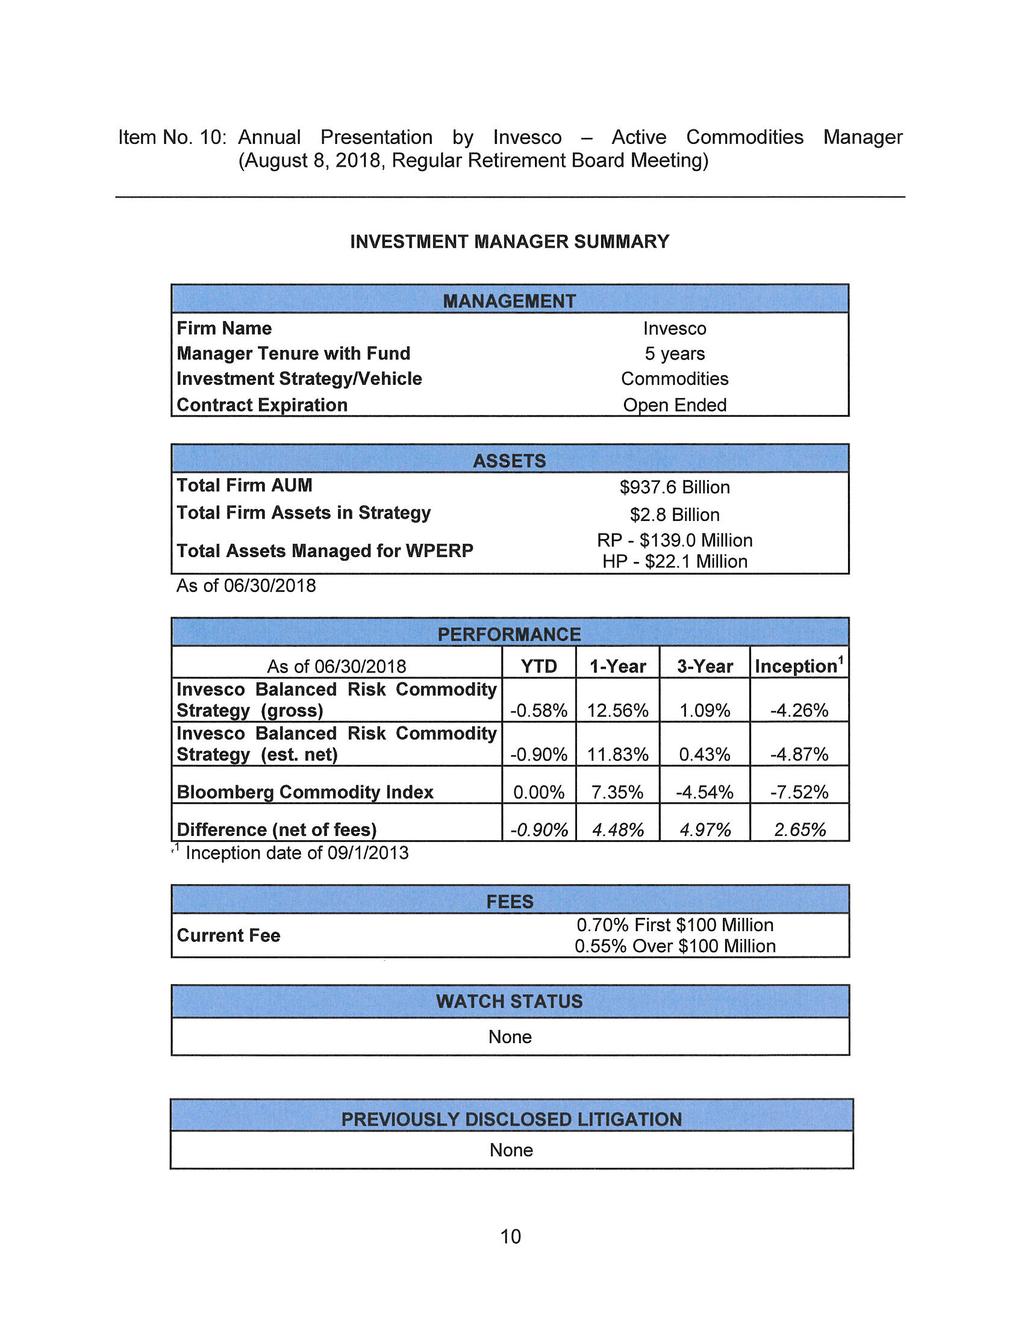
27 Invesco Balanced-Risk Commodity Trust Water & Power Employees Retirement Plan account portfolio summary Total Account Summary Month/ Year Market Value ($) Portfolio (gross %) Gross Excess Return Portfolio (net %) Net Excess Return Benchmark 1 (%) 06/ ,042,003 (4.58) (1.08) (4.63) (1.13) (3.50) 05/ ,708, / ,443, (0.34) 2.19 (0.39) / ,314,101 (0.10) 0.52 (0.15) 0.47 (0.62) 02/ ,450,150 (1.25) 0.48 (1.31) 0.42 (1.73) 01/ ,218, (1.01) 0.92 (1.07) / ,858, / ,416, (0.46) 10/ ,600, / ,654,627 (1.95) (1.81) (2.01) (1.86) (0.15) 08/ ,239, / ,566, Client Performance Chart (%) 1 Portfolio (gross) Portfolio (net) Benchmark 15 Return (%) QTD YTD 1 Year 3 Years Since Inception (08/22/13) Performance Table (%) Period Portfolio (gross %) Gross Excess Return Portfolio (net %) Net Excess Return Benchmark 1 QTD (0.20) (0.60) (0.36) (0.76) 0.40 YTD (0.58) (0.58) (0.91) (0.91) (0.00) 1 Year years (4.54) Since Inception (3.90) 3.37 (4.57) 2.70 (7.27) All data as of 06/30/18. Source: Invesco analysis. Water & Power s combined account fee schedule is 70 bp on the first $100mm and 55 bp thereafter. 1 Bloomberg Commodity Index. The Dow Jones-UBS Commodity Index changed it s name to the Bloomberg Commodity Index on July 1,
28 Invesco Institutional Trust Balanced-Risk Commodity Fund Water & Power Retiree Health Benefits Fund portfolio summary Total Account Summary Month/ Year Market Value ($) Portfolio (gross %) Gross Excess Return Portfolio (net %) Net Excess Return Benchmark 1 (%) 06/ ,109,765 (4.53) (1.03) (4.57) (1.08) (3.50) 05/ ,158, / ,653, (0.26) 2.27 (0.31) / ,139,788 (0.13) 0.49 (0.18) 0.44 (0.62) 02/ ,168,974 (1.25) 0.48 (1.29) 0.44 (1.73) 01/ ,448, (1.03) 0.91 (1.08) / ,236, / ,353, (0.46) 10/ ,236, / ,600,450 (1.93) (1.79) (1.98) (1.83) (0.15) 08/ ,006, / ,468, Client Performance Chart (%) 1 Portfolio (gross) Portfolio (net) Benchmark 15 Return (%) QTD YTD 1 Year 3 Years Since Inception (08/21/13) Performance Table (%) Period Portfolio (gross %) Gross Excess Return Portfolio (net %) Net Excess Return Benchmark 1 QTD (0.14) (0.54) (0.27) (0.67) 0.40 YTD (0.57) (0.57) (0.84) (0.84) (0.00) 1 Year years (4.54) Since Inception (4.05) 3.23 (4.57) 2.71 (7.28) All data as of 06/30/18. Source: Invesco analysis. Water & Power s combined account fee schedule is 70 bp on the first $100mm and 55 bp thereafter. 1 Bloomberg Commodity Index. The Dow Jones-UBS Commodity Index changed it s name to the Bloomberg Commodity Index on July 1,
29 Invesco Balanced-Risk Commodity Strategy Composite Performance attribution 1 year absolute attribution (gross %) 1 year relative attribution to BCOM (gross %) Cash Precious 8.09 Energy Industrial Agriculture / Livestock Tactical Allocation Total Cash Precious Energy Industrial 3.56 Agriculture/ Livestock Tactical Allocation Total 3 year absolute attribution (gross %) 3 year relative attribution to BCOM (gross %) Cash 0.31 Precious Energy 0.82 Industrial Agriculture / Livestock Tactical Allocation Total Cash 0.17 Precious 1.59 Energy Industrial 1.85 Agriculture / Livestock Tactical Allocation Total Source: Invesco analysis. Data as of 06/30/18. Note: Returns are gross of fees; net returns will be lower. *Composite Inception 09/30/2008. Past performance is not a guarantee of future results. 28
30 Invesco Balanced-Risk Commodity Strategy Performance attribution Since Inception return attribution (gross %) Since Inception return attribution (gross %) Water & Power Employees Retirement Plan Water & Power Retiree Health Benefits Plan Cash Precious Energy Industrial Agriculture/ Livestock Tactical Allocation Total Cash Precious Energy Industrial Agriculture/ Livestock 1.75 Tactical Allocation Total Since Inception relative attribution to BCOM (gross%) Water & Power Employees Retirement Plan Since Inception relative attribution to BCOM (gross%) Water & Power Retiree Health Benefits Plan Cash Precious 1.46 Energy Industrial 1.56 Agriculture/ Livestock 1.72 Tactical Allocation 3.27 Total Cash Precious Energy Industrial 1.48 Agriculture/ Livestock Tactical Allocation Total Source: Invesco analysis and gross of fees. Data as of 06/30/18. *Portfolio performance inception: 09/01/13. Note: Returns are gross of fees; net returns will be lower. Past performance is not a guarantee of future results. 29
31 Invesco Balanced-Risk Commodity Fund Asset growth Portfolio Changes (Retirement Plan) Amount Initial Value Invested as of 8/22/13 $105,761,290 Net Additions/(Withdrawals) $47,000,000 Income Received $0 Market Appreciation $(13,719,287) Market Value as of 6/30/18 $139,042,003 Portfolio Changes (Retiree Health Benefits Fund) Amount Initial Value Invested as of 8/21/13 $18,499,898 Net Additions/(Withdrawals) $6,500,000 Income Received $0 Market Appreciation $(2,890,134) Market Value as of 6/30/18 $22,109,765 Past performance is not indicative of future results. 30
32 Invesco Balanced-Risk Commodity Strategy Asset allocation versus the Bloomberg Commodity Index Invesco Strategic Tactical Total Bloomberg Agriculture/Livestock 40.82% -9.67% 31.15% 34.82% Cocoa 0.07% 0.00% 0.07% 0.00% Coffee 1.79% -1.46% 0.33% 2.30% Corn 2.00% -1.36% 0.64% 6.19% Cotton 8.35% 0.34% 8.69% 1.54% Lean Hogs 0.20% -0.38% -0.18% 2.19% Live Cattle 0.72% -1.77% -1.05% 3.80% Soybean 7.80% -1.25% 6.55% 5.33% Soybean Oil 1.80% -1.36% 0.44% 2.39% Soymeal 7.96% -0.14% 7.82% 3.07% Sugar 8.17% -1.73% 6.44% 2.83% Kansas Wheat 0.00% 0.00% 0.00% 1.44% Wheat 1.96% -0.56% 1.40% 3.74% Energy 22.19% 9.48% 31.67% 34.01% Gas Oil 1.99% 1.67% 3.66% 0.00% Natural Gas 2.80% 2.09% 4.89% 8.35% Brent Crude Oil 4.77% 1.06% 5.83% 8.87% WTI Crude Oil 3.02% 1.52% 4.54% 8.51% Heating Oil 1.74% 1.59% 3.33% 3.92% Unleaded Gasoline 7.87% 1.55% 9.42% 4.36% Precious 17.61% -9.51% 8.10% 14.56% Silver 6.51% -6.31% 0.20% 3.39% Gold 11.10% -3.20% 7.90% 11.17% Industrial 19.38% -3.74% 15.64% 16.62% Copper 12.12% -0.86% 11.26% 6.48% Aluminum 7.26% -1.16% 6.10% 4.30% Nickel 0.00% -0.74% -0.74% 3.24% Zinc 0.00% -0.98% -0.98% 2.60% Grand Total % % 86.56% % Sources: Invesco analysis and Bloomberg. Past allocations are not a guarantee of future allocations. Data as of 06/30/18. 31
33 Table of contents Company Overview Investment Process and Discipline Market Overview Water & Power Employees Retirement Plan Performance Review Fee Schedule Additional Information and Disclosures Glossary of Investment Terms 32
34 Water and Power Employees Retirement Plan Fee Schedule Management Fee: o 70 basis points on the first $100 million o 55 basis points thereafter 33
35 Table of contents Company Overview Investment Process and Discipline Market Overview Water & Power Employees Retirement Plan Performance Review Fee Schedule Additional Information and Disclosures Glossary of Investment Terms 34
36 Invesco Balanced-Risk Commodity Strategy Why even talk about commodities? Z Score: GSCI Light Energy Inverted Z Score and Forward Excess 1 Returns Excess Return Z Score Dec-74 Commodities inexpensive Commodities expensive Jun-78 Dec-81 Jun-85 Dec-88 Jun-92 Dec-95 Jun-99 Dec-02 Jun-06 Dec-09 Jun-13 Dec-16 5 Year Forward Annualized Rtn 30% 20% 10% 0% -10% -20% -30% Dec-74 Jun-78 Dec-81 Low index level Positive forward returns High index level Negative forward returns Jun-85 Dec-88 Jun-92 Dec-95 Jun-99 Dec-02 Jun-06 Dec-09 Jun-13 Dec Excess Return Z Score Sources: DataStream and Invesco analysis. Data from 12/31/74 to 12/31/17. GSCI Light Energy inception date is 5/01/91. Performance prior to inception dates is back-tested and not actual performance. Index returns are not representative of strategy returns and provide no assurance of future performance. Past performance cannot guarantee future results. 1 Excess return above Treasury bills. 35
37 Why continue to hold commodities? 125% Historical Bloomberg Commodity Index excess returns over every 5-year period since % 85% 65% Excess Return 45% 25% 5% -15% -35% YTD % -75% Year YTD Sources: Bloomberg L.P., and Invesco analysis. The inception date of the Bloomberg Commodity Index is 7/14/98. Performance prior to inception is backtested. Period covered: 1/1/91 06/30/18. Each line represents excess return of the Bloomberg Commodity Index above cash over a 5-year period. Based on monthly returns. Past performance cannot guarantee future results. An investment cannot be made in an index. 36
38 Invesco Balanced-Risk Commodity Strategy Term structure - based asset selection for strategic allocation Strategic Commodity Selection 100% 70% 30% 0% Soy Meal Brent Crude Heating Oil Soybeans Gold Soybean Oil Unleaded Gasoline Silver Aluminum Cotton WTI Crude Coffee Sugar Corn Wheat Copper Gas Oil Natural Gas Source: Invesco analysis. As of 06/30/18. For illustrative purposes only. 37
39 Invesco disclaimer For one-one-one Institutional Investor use only. All material presented is compiled from sources believed to be reliable and current, but accuracy cannot be guaranteed. This is not to be construed as an offer to buy or sell any financial instruments and should not be relied upon as the sole factor in an investment making decision. As with all investments there are associated inherent risks. Please obtain and review all financial material carefully before investing. Past performance is not indicative of future results. This does not constitute a recommendation of the suitability of any investment strategy for a particular investor. The opinions expressed herein are based on current market conditions and are subject to change without notice. Derivatives Risk The Invesco Balanced-Risk Commodity Strategy invests (directly or indirectly) a substantial portion of its assets in "derivatives" so-called because their value "derives" from the value of an underlying asset (including an underlying security), reference rate or index the value of which may rise or fall more rapidly than other investments. The strategy invests principally in exchange-traded futures across a diverse mix of assets including equities, bonds and commodities. The Invesco Balanced-Risk Commodity Strategy is a long-only strategy, so the portfolio will hold no net short positions at any time. For some derivatives, it is possible to lose more than the amount invested in the derivative. If the portfolio uses derivatives to "hedge" a portfolio risk, it is possible that the hedge may not succeed. This may happen for various reasons, including unexpected changes in the value of the rest of the portfolio. Over the counter derivatives are also subject to counterparty risk, which is the risk that the other party to the contract will not fulfill its contractual obligation to complete the transaction with the Fund. Leverage Risk The Invesco Balanced-Risk Commodity Strategy employs leverage as a fundamental element within the investment strategy. The implementation of a risk parity strategy requires the use of leverage in order to increase the risk of the government bond allocation in the strategy so that it can be balanced against the portfolio s exposure to stocks and commodities. The use of derivatives facilitates the ability to create the desired level of leverage in the portfolio. Leverage may cause the portfolio to be more volatile than if the portfolio had not been leveraged because leverage can exaggerate the effect of any increase or decrease in the value of securities held by the portfolio. 38
40 Table of contents Company Overview Investment Process and Discipline Market Overview Water & Power Employees Retirement Plan Performance Review Fee Disclosure Additional Information and Disclosures Glossary of Investment Terms 39
41 Glossary of Investment Terms Backwardation. A status where prices of futures contracts with a longer maturity are lower than the spot price of the commodity. Contango. A status where prices of futures contracts with a longer maturity are higher than the spot price of the commodity. Front Month. Used in futures trading to refer to the contract month with an expiration date closest to the current date, which is often in the same month. Futures Contract. A financial contract obligating the buyer to purchase an asset (or the seller to sell an asset), such as a physical commodity or a financial instrument, at a predetermined future date and price. Futures contracts detail the quality and quantity of the underlying asset; they are standardized to facilitate trading on a futures exchange. Roll Yield. The amount of return generated in a backwardated futures market that is achieved by rolling a short-term contract into a longer-term contract and profiting from the convergence toward a higher spot price. Spot Price. The current price at which a particular security can be bought or sold at a specified time and place. A security's spot price is regarded as the explicit value of the security at any given time in the marketplace. Standard Deviation. Standard deviation measures a fund s range of total returns and identifies the spread of a fund s short-term fluctuations. Term Structure. Term Structure of futures contracts refers to the price curve formed by the prices of futures contracts over various expiration months. Optimal Roll. Optimizing the roll yield by choosing the most attractive futures contract. 40


42 Thank you US /18
BROAD COMMODITY INDEX
 BROAD COMMODITY INDEX COMMENTARY + STRATEGY FACTS APRIL 2017 80.00% CUMULATIVE PERFORMANCE ( SINCE JANUARY 2007* ) 60.00% 40.00% 20.00% 0.00% -20.00% -40.00% -60.00% -80.00% ABCERI S&P GSCI ER BCOMM ER
USCF Dynamic Commodity Insight Monthly Insight September 2018
 Key Takeaways The US Commodity Index Fund (USCI) and the USCF SummerHaven Dynamic Commodity Strategy No K-1 Fund (SDCI) gained 1.94% and 1.84%, respectively, last month as September was the best month
MANAGED FUTURES INDEX
 MANAGED FUTURES INDEX COMMENTARY + STRATEGY FACTS JUNE 2018 CUMULATIVE PERFORMANCE ( SINCE JANUARY 2007* ) 120.00% 100.00% 80.00% 60.00% 40.00% 20.00% 0.00% AMFERI BARCLAY BTOP50 CTA INDEX S&P 500 S&P
First Trust Global Tactical Commodity Strategy Fund (FTGC) Consolidated Portfolio of Investments March 31, 2018 (Unaudited) Stated.
 Consolidated Portfolio of Investments March 31, 2018 (Unaudited) Stated.") Consolidated Portfolio of Investments Principal Description Stated Coupon Stated Maturity TREASURY BILLS 80.1% $ 48,000,000 U.S. Treasury Bill (a)... (b) 04/12/18 $ 47,978,254 10,000,000 U.S. Treasury
Consolidated Portfolio of Investments Principal Description Stated Coupon Stated Maturity TREASURY BILLS 80.1% $ 48,000,000 U.S. Treasury Bill (a)... (b) 04/12/18 $ 47,978,254 10,000,000 U.S. Treasury
First Trust Global Tactical Commodity Strategy Fund (FTGC) Consolidated Portfolio of Investments September 30, 2017 (Unaudited) Stated.
 Consolidated Portfolio of Investments September 30, 2017 (Unaudited) Stated.") Consolidated Portfolio of Investments Principal Description Stated Coupon Stated Maturity TREASURY BILLS 61.0% $ 30,000,000 U.S. Treasury Bill (a)... (b) 10/19/17 $ 29,987,055 15,000,000 U.S. Treasury
Consolidated Portfolio of Investments Principal Description Stated Coupon Stated Maturity TREASURY BILLS 61.0% $ 30,000,000 U.S. Treasury Bill (a)... (b) 10/19/17 $ 29,987,055 15,000,000 U.S. Treasury
Bache Commodity Index SM. Q Review
 SM Bache Commodity Index SM Q3 2009 Review The Bache Commodity Index SM Built for Commodity Investors The Bache Commodity Index SM (BCI SM ) is a transparent, fully investable commodity index. Its unique
MANAGED FUTURES INDEX
 MANAGED FUTURES INDEX COMMENTARY + STRATEGY FACTS JANUARY 2019 CUMULATIVE PERFORMANCE ( SINCE JANUARY 2007* ) 140.00% 120.00% 100.00% 80.00% 60.00% 40.00% 20.00% 0.00% AMFERI BARCLAY BTOP50 CTA INDEX S&P
6,479,864 (Cost $6,480,320) (c) Net Other Assets and Liabilities 26.1%... 2,286,259 Net Assets 100.0%... $ 8,766,123
 (c) Net Other Assets and Liabilities 26.1%... 2,286,259 Net Assets 100.0%... $ 8,766,123") Consolidated Portfolio of Investments Principal TREASURY BILLS 73.9% Description Stated Coupon Stated Maturity $ 1,000,000 U.S. Treasury Bill (a) (b) 4/12/18 $ 999,547 1,500,000 U.S. Treasury Bill (a)
Consolidated Portfolio of Investments Principal TREASURY BILLS 73.9% Description Stated Coupon Stated Maturity $ 1,000,000 U.S. Treasury Bill (a) (b) 4/12/18 $ 999,547 1,500,000 U.S. Treasury Bill (a)
ETF.com Presents INSIDE COMMODITIES WEEK
 ETF.com Presents INSIDE COMMODITIES WEEK A Practical Guide to Commodity Investing: 5 Things Every Investor Needs to Know November 17, 2014 swaps John T. Hyland, CFA Chief Investment Office United States
MANAGED FUTURES INDEX
 MANAGED FUTURES INDEX COMMENTARY + STRATEGY FACTS JULY 2018 CUMULATIVE PERFORMANCE ( SINCE JANUARY 2007* ) 120.00% 100.00% 80.00% 60.00% 40.00% 20.00% 0.00% AMFERI BARCLAY BTOP50 CTA INDEX S&P 500 S&P
NASDAQ Commodity Index Family
 Index Overview NASDAQ Commodity Index Family The NASDAQ Commodity Index Family provides a broad way to track U.S. dollar denominated commodities traded on U.S. and U.K. exchanges. NASDAQ s transparent
BROAD COMMODITY INDEX
 BROAD COMMODITY INDEX COMMENTARY + STRATEGY FACTS JULY 2018 100.00% 80.00% 60.00% 40.00% 20.00% 0.00% -20.00% -40.00% -60.00% CUMULATIVE PERFORMANCE ( SINCE JANUARY 2007* ) -80.00% ABCERI S&P GSCI ER BCOMM
MANAGED FUTURES INDEX
 MANAGED FUTURES INDEX COMMENTARY + STRATEGY FACTS SEPTEMBER 2018 CUMULATIVE PERFORMANCE ( SINCE JANUARY 2007* ) 140.00% 120.00% 100.00% 80.00% 60.00% 40.00% 20.00% 0.00% AMFERI BARCLAY BTOP50 CTA INDEX
UBS Bloomberg CMCI. a b. A new perspective on commodity investments.
 a b Structured investment products for investors in Switzerland and Liechtenstein. For marketing purposes only. UBS Bloomberg CMCI A new perspective on commodity investments. UBS Bloomberg CMCI Index Universe
MANAGED FUTURES INDEX
 MANAGED FUTURES INDEX COMMENTARY + STRATEGY FACTS JULY 2017 CUMULATIVE PERFORMANCE ( SINCE JANUARY 2007* ) 120.00% 100.00% 80.00% 60.00% 40.00% 20.00% 0.00% AMFERI BARCLAY BTOP50 CTA INDEX S&P 500 S&P
MANAGED FUTURES INDEX
 MANAGED FUTURES INDEX COMMENTARY + STRATEGY FACTS JANUARY 2018 CUMULATIVE PERFORMANCE ( SINCE JANUARY 2007* ) 120.00% 100.00% 80.00% 60.00% 40.00% 20.00% 0.00% AMFERI BARCLAY BTOP50 CTA INDEX S&P 500 S&P
THE ALTERNATIVE BENCHMARK COMMODITY INDEX: A FACTOR-BASED APPROACH TO COMMODITY INVESTMENT
 THE ALTERNATIVE BENCHMARK COMMODITY INDEX: A FACTOR-BASED APPROACH TO COMMODITY INVESTMENT AIA RESEARCH REPORT Revised Oct 2015 Contact: Richard Spurgin ALTERNATIVE INVESTMENT ANALYTICS LLC 400 AMITY STREET,
Quarterly Commentary. Strategic Commodity Fund DBCMX/DLCMX
 Quarterly Commentary Strategic Commodity Fund DBCMX/DLCMX June 30, 2017 333 S. Grand Ave., 18th Floor Los Angeles, CA 90071 (213) 633-8200 Quarterly Commentary Overview A few main themes dominated headlines
2018 Strategic Commodity Webcast Recap
 Growth Rate (January 31, 1991 - January 08, 2018) GDP Year -over-year % Change December 31, 1999 - December 31, 2017 Source: Bloomberg, DoubleLine GDP = gross domestic product, YoY = year-over-year 6 5
BROAD COMMODITY INDEX
 BROAD COMMODITY INDEX COMMENTARY + STRATEGY FACTS JANUARY 2018 100.00% 80.00% 60.00% 40.00% 20.00% 0.00% -20.00% -40.00% -60.00% CUMULATIVE PERFORMANCE ( SINCE JANUARY 2007* ) -80.00% ABCERI S&P GSCI ER
BROAD COMMODITY INDEX
 BROAD COMMODITY INDEX COMMENTARY + STRATEGY FACTS JUNE 2017 80.00% CUMULATIVE PERFORMANCE ( SINCE JANUARY 2007* ) 60.00% 40.00% 20.00% 0.00% -20.00% -40.00% -60.00% -80.00% ABCERI S&P GSCI ER BCOMM ER
BROAD COMMODITY INDEX
 BROAD COMMODITY INDEX COMMENTARY + STRATEGY FACTS AUGUST 2018 120.00% 100.00% 80.00% 60.00% 40.00% 20.00% 0.00% -20.00% -40.00% -60.00% CUMULATIVE PERFORMANCE ( SINCE JANUARY 2007* ) -80.00% ABCERI S&P
26th International Aluminium Conference Moscow. Christoph Eibl Chief Executive September 2012
 26th International Aluminium Conference Moscow Christoph Eibl Chief Executive September 2012 Preferences Aluminium form a Fund Manager s point of view As a strategic investor (i.e. long only) fundamentals
5,493,033 (Cost $5,492,519) (c) Net Other Assets and Liabilities 24.2%... 1,749,230 Net Assets 100.0%... $ 7,242,263
 (c) Net Other Assets and Liabilities 24.2%... 1,749,230 Net Assets 100.0%... $ 7,242,263") Consolidated Portfolio of Investments Principal TREASURY BILLS 75.8% Description Stated Coupon Stated Maturity $ 1,000,000 U.S. Treasury Bill (a)... (b) 10/19/17 $ 999,569 2,500,000 U.S. Treasury Bill
Consolidated Portfolio of Investments Principal TREASURY BILLS 75.8% Description Stated Coupon Stated Maturity $ 1,000,000 U.S. Treasury Bill (a)... (b) 10/19/17 $ 999,569 2,500,000 U.S. Treasury Bill
Weekly Flows by Sector (US$mn) Top 5 Inflows/Outflows (US$mn) Top 5 / Bottom 5 Performers. TOTAL Diversified Energy Industrial
 Top 5 Inflows/Outflows (US$mn) Top 5 / Bottom 5 Performers. TOTAL Diversified Energy Industrial") Weekly Flows by Sector (US$mn) TOTAL Diversified Energy Industrial Precious -81 Agriculture Livestock Equities FX -3-38 -1 2 8 5 75-1 -5 5 1 Top 5 Inflows/Outflows (US$mn) Agriculture Copper USD Coffee
Weekly Flows by Sector (US$mn) TOTAL Diversified Energy Industrial Precious -81 Agriculture Livestock Equities FX -3-38 -1 2 8 5 75-1 -5 5 1 Top 5 Inflows/Outflows (US$mn) Agriculture Copper USD Coffee
DIVERSIFIED PROGRAM COMMENTARY + PORTFOLIO FACTS JULY 2018 INVEST WITH AUSPICE. AUSPICE Capital Advisors
 DIVERSIFIED PROGRAM COMMENTARY + PORTFOLIO FACTS 100% CUMULATIVE PERFORMANCE ( SINCE JANUARY 2007* ) 80% 60% 40% 20% 0% AUSPICE DIVERSIFIED BARCLAY BTOP50 CTA INDEX S&P 500 S&P / TSX 60 Correlation 0.69-0.20-0.11
USCF Mutual Funds TRUST USCF Commodity Strategy Fund
 Filed pursuant to Rule 497(e) Securities Act File No. 333-214468 Investment Company Act File No. 811-23213 USCF Mutual Funds TRUST USCF Commodity Strategy Fund Class A Shares (USCFX) and Class I Shares
Stated Coupon. Notional. Value
 Consolidated Portfolio of Investments Principal Description Stated Coupon Stated Maturity TREASURY BILLS 50.1% $ 1,000,000 U.S. Treasury Bill (a)... (b) 4/12/2018 $ 999,547 2,000,000 U.S. Treasury Bill
/ CRB Index May 2005
 May 2005 / CRB Index Overview: Past, Present and Future Founded in 1957, the Reuters CRB Index has a long history as the most widely followed Index of commodities futures. Since 1961, there have been 9
OVERVIEW OF THE BACHE COMMODITY INDEX SM
 OVERVIEW OF THE BACHE COMMODITY INDEX SM March 2010 PFDS Holdings, LLC One New York Plaza, 13th Fl NY, NY 10292-2013 212-778-4000 Disclaimer Copyright 2010 PFDS Holdings, LLC. All rights reserved. The
BZX Information Circular EDGA Information Circular BYX Information Circular EDGX Information Circular
 BZX Information Circular 17-064 EDGA Information Circular 17-064 BYX Information Circular 17-064 EDGX Information Circular 17-064 Date: May 23, 2017 Re: GraniteShares ETF Trust Pursuant to the Rules of
DIVERSIFIED PROGRAM COMMENTARY + PORTFOLIO FACTS MARCH 2018 INVEST WITH AUSPICE. AUSPICE Capital Advisors
 DIVERSIFIED PROGRAM COMMENTARY + PORTFOLIO FACTS 100% CUMULATIVE PERFORMANCE ( SINCE JANUARY 2007* ) 80% 60% 40% 20% 0% AUSPICE DIVERSIFIED BARCLAY BTOP50 CTA INDEX S&P 500 S&P / TSX 60 Correlation 0.70-0.20-0.12
Catalyst Macro Strategy Fund
 Catalyst Macro Strategy Fund MCXAX, MCXCX & MCXIX 2015 Q3 About Catalyst Funds Intelligent Alternatives We strive to provide innovative strategies to support financial advisors and their clients in meeting
FuturesCom Morning Investment Comments Tuesday November 13, 2018
 THIS PUBLICATION IS SUBJECT TO REVISIONS AND CONTAINS THE VIEW AND OPINIONS OF THE AUTHOR, EXCEPT WHERE OPINIONS ARE ATTRIBUTED TO OTHER SOURCES. WRITTEN PERMISSION IS REQUIRED PRIOR TO ANY DISTRIBUTION
26th International Copper Conference Madrid. Christoph Eibl Chief Executive March 2013
 26th International Copper Conference Madrid Christoph Eibl Chief Executive March 2013 Preferences Copper form a Fund Manager s point of view As a strategic investor (i.e. long only) fundamentals rule Deficit
Goldman Sachs Commodity Index
 600 450 300 29 Jul 1992 188.3 150 0 Goldman Sachs Commodity Index 31 Oct 2007 598 06 Feb 2002 170.25 Average yearly return = 23.8% Jul-94 Jul-95 Jul-96 Jul-97 Jul-98 Jul-99 Jul-00 Jul-01 Jul-02 Jul-03
FINAL DISCLOSURE SUPPLEMENT Dated February 24, 2011 To the Disclosure Statement dated January 24, 2011
 FINAL DISCLOSURE SUPPLEMENT Dated February 24, 2011 To the Disclosure Statement dated January 24, 2011 Union Bank, N.A. Market-Linked Certificates of Deposit, due August 28, 2013 (MLCD No. 109) Quarterly
THE BACHE COMMODITY INDEX SM : A FACTOR-BASED APPROACH TO COMMODITY INVESTMENT
 THE BACHE COMMODITY INDEX SM : A FACTOR-BASED APPROACH TO COMMODITY INVESTMENT AIA RESEARCH REPORT Revised September 2009 Contact: Richard Spurgin ALTERNATIVE INVESTMENT ANALYTICS LLC 29 SOUTH PLEASANT
USCF ETF Trust (Exact Name of Registrant as Specified in Charter)
") As filed with the Securities and Exchange Commission on April 24, 2018 Securities Act Registration No. 333-196273 Investment Company Act Registration No. 811-22930 SECURITIES AND EXCHANGE COMMISSION Washington,
As filed with the Securities and Exchange Commission on April 24, 2018 Securities Act Registration No. 333-196273 Investment Company Act Registration No. 811-22930 SECURITIES AND EXCHANGE COMMISSION Washington,
Macquarie Diversified Commodity Capped Building Block Indices. Index Manual May 2016
 Macquarie Diversified Commodity Capped Building Block Indices Manual May 2016 NOTICES AND DISCLAIMERS BASIS OF PROVISION This Manual sets out the rules for the Macquarie Building Block Indices (each, an
MANAGED FUTURES INDEX
 MANAGED FUTURES INDEX COMMENTARY + STRATEGY FACTS NOVEMBER 2018 CUMULATIVE PERFORMANCE ( SINCE JANUARY 2007* ) 140.00% 120.00% 100.00% 80.00% 60.00% 40.00% 20.00% 0.00% AMFERI BARCLAY BTOP50 CTA INDEX
File No GRANITESHARES FUNDS. Prospectus. October 27, 2017
 File No. 333-214796 GRANITESHARES FUNDS Prospectus October 27, 2017 GRANITESHARES FUNDS GraniteShares Bloomberg Commodity Broad Strategy No K-1 ETF GraniteShares S&P GSCI Commodity Broad Strategy No K-1
Principles of Portfolio Construction
 Principles of Portfolio Construction Salient Quantitative Research, February 2013 Today s Topics 1. Viewing portfolios in terms of risk 1. The language of risk 2. Calculating an allocation s risk profile
FuturesCom Morning Investment Comments Friday October 26, 2018
 THIS PUBLICATION IS SUBJECT TO REVISIONS AND CONTAINS THE VIEW AND OPINIONS OF THE AUTHOR, EXCEPT WHERE OPINIONS ARE ATTRIBUTED TO OTHER SOURCES. WRITTEN PERMISSION IS REQUIRED PRIOR TO ANY DISTRIBUTION
Key Commodity Themes. Maxwell Gold Director of Investment Strategy. Gradient Investments Elite Advisor Forum October 5 th, 2017
 Key Commodity Themes Maxwell Gold Director of Investment Strategy Gradient Investments Elite Advisor Forum October 5 th, 2017 2001 2002 2002 2003 2004 2005 2006 2007 2007 2008 2009 2010 2011 2012 2012
FuturesCom Morning Investment Comments Tuesday November 20, 2018
 THIS PUBLICATION IS SUBJECT TO REVISIONS AND CONTAINS THE VIEW AND OPINIONS OF THE AUTHOR, EXCEPT WHERE OPINIONS ARE ATTRIBUTED TO OTHER SOURCES. WRITTEN PERMISSION IS REQUIRED PRIOR TO ANY DISTRIBUTION
FINAL DISCLOSURE SUPPLEMENT Dated June 25, 2015 To the Disclosure Statement dated March 30, 2015
 FINAL DISCLOSURE SUPPLEMENT Dated June 25, 2015 To the Disclosure Statement dated March 30, 2015 MUFG Union Bank, N.A. Average Return Market-Linked Certificates of Deposit, due June 30, 2021 (MLCD No.
CAX Commodity Arbitrage Index. Objectives and Guidelines. Copyright 2009 Alternative-Index Ltd 1
 CAX Commodity Arbitrage Index Objectives and Guidelines Copyright 2009 Alternative-Index Ltd www.alternative-index.com 1 Index Objectives Provide an investable benchmark with daily liquidity that covers
Carry. Ralph S.J. Koijen, London Business School and NBER
 Carry Ralph S.J. Koijen, London Business School and NBER Tobias J. Moskowitz, Chicago Booth and NBER Lasse H. Pedersen, NYU, CBS, AQR Capital Management, CEPR, NBER Evert B. Vrugt, VU University, PGO IM
Weekly Flows by Sector (US$mn) Top 5 Inflows/Outflows (US$mn) Top 5 / Bottom 5 Performers. Diversified Energy Industrial
 Top 5 Inflows/Outflows (US$mn) Top 5 / Bottom 5 Performers. Diversified Energy Industrial") Weekly Flows by Sector (US$mn) TOTAL -22 Diversified Energy Industrial Precious -165 Agriculture Livestock Equities FX -4-2 -39-1 8 1-3 -2-1 1 Top 5 Inflows/Outflows (US$mn) Coffee Soybeans Cotton USD
Weekly Flows by Sector (US$mn) TOTAL -22 Diversified Energy Industrial Precious -165 Agriculture Livestock Equities FX -4-2 -39-1 8 1-3 -2-1 1 Top 5 Inflows/Outflows (US$mn) Coffee Soybeans Cotton USD
Managed futures: An alternative investment strategy in which futures contracts are used as part of the investment strategy. 2
 WisdomTree Managed Futures Strategy Funds WTMF MANAGED FUTURES CAN PROVIDE MULTI-LEVEL DIVERSIFICATION Institutional investors have long utilized managed futures strategies as a way to achieve diversification
FuturesCom Morning Investment Comments Monday October 29, 2018
 THIS PUBLICATION IS SUBJECT TO REVISIONS AND CONTAINS THE VIEW AND OPINIONS OF THE AUTHOR, EXCEPT WHERE OPINIONS ARE ATTRIBUTED TO OTHER SOURCES. WRITTEN PERMISSION IS REQUIRED PRIOR TO ANY DISTRIBUTION
Commitment to investment excellence
 Bank of America/Merrill Lynch Banking and Financial Services Conference Commitment to investment excellence Martin L. Flanagan President and Chief Executive Officer Invesco Ltd. November 15, 2011 All information
Commodities How to Leverage Opportunity
 Commodities How to Leverage Opportunity Investment Conference, Boston, March 2010 Peter Königbauer Senior Portfolio Manager For Broker/Dealer Use Only and Not to be Distributed to the Public Agenda Commodity
FuturesCom Morning Investment Comments Tuesday September 18th, 2018
 THIS PUBLICATION IS SUBJECT TO REVISIONS AND CONTAINS THE VIEW AND OPINIONS OF THE AUTHOR, EXCEPT WHERE OPINIONS ARE ATTRIBUTED TO OTHER SOURCES. WRITTEN PERMISSION IS REQUIRED PRIOR TO ANY DISTRIBUTION
DIVERSIFIED PROGRAM COMMENTARY + PORTFOLIO FACTS JANUARY 2018 INVEST WITH AUSPICE. AUSPICE Capital Advisors
 DIVERSIFIED PROGRAM COMMENTARY + PORTFOLIO FACTS 100% CUMULATIVE PERFORMANCE ( SINCE JANUARY 2007* ) 80% 60% 40% 20% 0% AUSPICE DIVERSIFIED BARCLAY BTOP50 CTA INDEX S&P 500 S&P / TSX 60 Correlation 0.69-0.24-0.13
DIVERSIFIED PROGRAM COMMENTARY + PORTFOLIO FACTS APRIL 2018 INVEST WITH AUSPICE. AUSPICE Capital Advisors
 DIVERSIFIED PROGRAM COMMENTARY + PORTFOLIO FACTS 100% CUMULATIVE PERFORMANCE ( SINCE JANUARY 2007* ) 80% 60% 40% 20% 0% AUSPICE DIVERSIFIED BARCLAY BTOP50 CTA INDEX S&P 500 S&P / TSX 60 Correlation 0.70-0.20-0.12
FuturesCom Morning Investment Comments Wednesday September 19th, 2018
 THIS PUBLICATION IS SUBJECT TO REVISIONS AND CONTAINS THE VIEW AND OPINIONS OF THE AUTHOR, EXCEPT WHERE OPINIONS ARE ATTRIBUTED TO OTHER SOURCES. WRITTEN PERMISSION IS REQUIRED PRIOR TO ANY DISTRIBUTION
Description of the. RBC Commodity Excess Return Index and RBC Commodity Total Return Index
 Description of the RBC Commodity Excess Return Index and RBC Commodity Total Return Index This document contains information about the RBC Commodity Excess Return Index and RBC Commodity Total Return Index,
THIS PUBLICATION IS SUBJECT TO REVISIONS AND CONTAINS THE VIEW AND OPINIONS OF THE AUTHOR, EXCEPT WHERE OPINIONS ARE ATTRIBUTED TO OTHER SOURCES.
 THIS PUBLICATION IS SUBJECT TO REVISIONS AND CONTAINS THE VIEW AND OPINIONS OF THE AUTHOR, EXCEPT WHERE OPINIONS ARE ATTRIBUTED TO OTHER SOURCES. WRITTEN PERMISSION IS REQUIRED PRIOR TO ANY DISTRIBUTION
DIVERSIFIED PROGRAM COMMENTARY + PORTFOLIO FACTS JANUARY 2019 INVEST WITH AUSPICE. AUSPICE Capital Advisors
 DIVERSIFIED PROGRAM COMMENTARY + PORTFOLIO FACTS 100% CUMULATIVE PERFORMANCE ( SINCE JANUARY 2007* ) 80% 60% 40% 20% 0% AUSPICE DIVERSIFIED BARCLAY BTOP50 CTA INDEX S&P 500 S&P / TSX 60 Correlation 0.69-0.18-0.11
FuturesCom Morning Investment Comments Wednesday January 9th, 2019
 THIS PUBLICATION IS SUBJECT TO REVISIONS AND CONTAINS THE VIEW AND OPINIONS OF THE AUTHOR, EXCEPT WHERE OPINIONS ARE ATTRIBUTED TO OTHER SOURCES. WRITTEN PERMISSION IS REQUIRED PRIOR TO ANY DISTRIBUTION
Consolidated Schedule of Investments January 31, 2018 (Unaudited)
") Consolidated Schedule of Investments January 31, 2018 (Unaudited) Interest Rate Maturity Date Principal Amount Value U.S. Treasury Securities 29.81% U.S. Treasury Bills 13.56% (a) U.S. Treasury Bills (b)
Consolidated Schedule of Investments January 31, 2018 (Unaudited) Interest Rate Maturity Date Principal Amount Value U.S. Treasury Securities 29.81% U.S. Treasury Bills 13.56% (a) U.S. Treasury Bills (b)
Weekly Flows by Sector (US$mn) Top 5 Inflows/Outflows (US$mn) Top 5 / Bottom 5 Performers TOTAL. Diversified Energy Industrial Precious
 Top 5 Inflows/Outflows (US$mn) Top 5 / Bottom 5 Performers TOTAL. Diversified Energy Industrial Precious") Weekly Flows by Sector (US$mn) TOTAL Diversified Energy Industrial Precious Agriculture Livestock Equities FX -5-4 9 1 7 12 48 69-5 5 1 Top 5 Inflows/Outflows (US$mn) Industrial metals Energy Copper USD
Weekly Flows by Sector (US$mn) TOTAL Diversified Energy Industrial Precious Agriculture Livestock Equities FX -5-4 9 1 7 12 48 69-5 5 1 Top 5 Inflows/Outflows (US$mn) Industrial metals Energy Copper USD
NOT FDIC INSURED NO BANK GUARANTEE MAY LOSE VALUE. Highbridge Dynamic Commodities Strategy Fund
 NOT FDIC INSURED NO BANK GUARANTEE MAY LOSE VALUE Highbridge Dynamic Commodities Strategy Fund Agenda Insight Commodities have historically exhibited low correlation to other investments A diversified
Volatility Index (AIMFV)
") A.I.. Managed aged Futures Volatility Index (AIMFV) Methodology and Maintenance v.073115 Table of Contents Executive Summary 3 Introduction 4 Description of the A.I. Managed Futures Volatility Index 5
A.I.. Managed aged Futures Volatility Index (AIMFV) Methodology and Maintenance v.073115 Table of Contents Executive Summary 3 Introduction 4 Description of the A.I. Managed Futures Volatility Index 5
Smart Beta Dashboard. Thoughts at a Glance. January By the SPDR Americas Research Team
 By the SPDR Americas Research Team Thoughts at a Glance 2017 marked another year of factor performance shifts. s comeback in the US on the heels of the US election and the potential for a Trump-flation
DIVERSIFIED PROGRAM COMMENTARY + PORTFOLIO FACTS NOVEMBER 2017 INVEST WITH AUSPICE. AUSPICE Capital Advisors
 DIVERSIFIED PROGRAM COMMENTARY + PORTFOLIO FACTS 100% CUMULATIVE PERFORMANCE ( SINCE JANUARY 2007* ) 80% 60% 40% 20% 0% AUSPICE DIVERSIFIED BARCLAY BTOP50 CTA INDEX S&P 500 S&P / TSX 60 Correlation 0.69-0.24-0.13
BETASHARES AGRICULTURE ETF CURRENCY HEDGED (SYNTHETIC) ASX CODE: QAG BETASHARES CRUDE OIL INDEX ETF CURRENCY HEDGED (SYNTHETIC) ASX CODE: OOO
 ASX CODE: QAG BETASHARES CRUDE OIL INDEX ETF CURRENCY HEDGED (SYNTHETIC) ASX CODE: OOO") BETASHARES FUNDS PRODUCT DISCLOSURE STATEMENT BETASHARES AGRICULTURE ETF CURRENCY HEDGED (SYNTHETIC) ASX CODE: QAG BETASHARES CRUDE OIL INDEX ETF CURRENCY HEDGED (SYNTHETIC) ASX CODE: OOO BETASHARES COMMODITIES
BETASHARES FUNDS PRODUCT DISCLOSURE STATEMENT BETASHARES AGRICULTURE ETF CURRENCY HEDGED (SYNTHETIC) ASX CODE: QAG BETASHARES CRUDE OIL INDEX ETF CURRENCY HEDGED (SYNTHETIC) ASX CODE: OOO BETASHARES COMMODITIES
FuturesCom Morning Investment Comments Friday December 28th, 2018
 THIS PUBLICATION IS SUBJECT TO REVISIONS AND CONTAINS THE VIEW AND OPINIONS OF THE AUTHOR, EXCEPT WHERE OPINIONS ARE ATTRIBUTED TO OTHER SOURCES. WRITTEN PERMISSION IS REQUIRED PRIOR TO ANY DISTRIBUTION
go about choosing a commodity investment product especially when we have recently seen a proliferation of these products?
 white paper 2010 THE NEXT GENERATION OF COMMODITY INVESTING STRATEGIES Executive summary Spurred by global demand trends and concerns about inflation, more and more investors are turning to commodities
Invesco expanding suite of liquid alternatives with new mutual funds
 Press Release For immediate release Invesco expanding suite of liquid alternatives with new mutual funds Delivering innovative alternative strategies to the retail marketplace backed by 30 years of experience
Commitments of Traders: Commodities
 Commitments of Traders: Commodities Leveraged funds positioning covering the week ending March 6, 218 Ole S. Hansen Head of Commodity Strategy 6-Mar-18 Change Change Change Change Pct 1 yr high 1 yr low
Index Description MS HDX RADAR 2 MSDY Index
 Dated as of August 3, 2017 Index Description MS HDX RADAR 2 MSDY Index This document (the Index Description ) sets out the current methodology and rules used to construct, calculate and maintain the MS
ETF Securities Weekly Flows Analysis Profit taking in precious metals continues
 James Butterfill Head of Research and Investment Strategy research@etfsecurities.com 2 May 217 ETF Securities Weekly Flows Analysis Profit taking in precious metals continues Profit taking in precious
Green Investment Management, Inc.
 Complete List of Composites 7/12/2017 Complete List of Composites Composite Name GIM Composites Tax Aware 50/50 Tax Aware 60/40 Tax Aware 75/25 Tax Free Bond Guardian Composites Alternatives Balanced 60/40
Market Outlook Considerations Week Beginning April 30, 2018
 Market Outlook Considerations Week Beginning April 30, 2018 DISCLAIMER-FOR-EDUCATIONAL-PURPOSES-ONLY Bobby Coats, Ph.D. Professor Economics Department of Agricultural Economics and Agribusiness University
Market Outlook Considerations Week Beginning April 23, 2018
 Market Outlook Considerations Week Beginning April 23, 2018 DISCLAIMER-FOR-EDUCATIONAL-PURPOSES-ONLY Bobby Coats, Ph.D. Professor Economics Department of Agricultural Economics and Agribusiness University
Global economy on track for solid recovery
 Global economy on track for solid recovery World real GDP grew by 5 percent in 20 Real GDP growth, percent 8 6 4 2 0-2 -4 Emerging and developing economies Advanced economies World -6 1980 1985 1990 1995
Market Outlook Considerations Week Beginning May 14, 2018
 Market Outlook Considerations Week Beginning May 14, 2018 DISCLAIMER-FOR-EDUCATIONAL-PURPOSES-ONLY Bobby Coats, Ph.D. Professor Economics Department of Agricultural Economics and Agribusiness University
Weekly Flows by Sector (US$mn) Top 5 Inflows/Outflows (US$mn) Top 5 / Bottom 5 Performers. Diversified Energy Industrial
 Top 5 Inflows/Outflows (US$mn) Top 5 / Bottom 5 Performers. Diversified Energy Industrial") Weekly Flows by Sector (US$mn) TOTAL -153 Diversified Energy Industrial Precious -195 Agriculture Livestock Equities FX -2-3 -1 3 2 26-3 -2-1 1 Top 5 Inflows/Outflows (US$mn) EUR JPY Cotton Agriculture
Weekly Flows by Sector (US$mn) TOTAL -153 Diversified Energy Industrial Precious -195 Agriculture Livestock Equities FX -2-3 -1 3 2 26-3 -2-1 1 Top 5 Inflows/Outflows (US$mn) EUR JPY Cotton Agriculture
Equinox Campbell Strategy Fund Portfolio Holdings as of October 31, 2017 (Based on Net Assets)
") Equinox Campbell Strategy Fund Portfolio Holdings as of October 31, 2017 (Based on Net Assets) Description Market Value () Percentage Equinox Campbell Ltd Controlled Foreign Corporation $96,112,731 25.07%
Equinox Campbell Strategy Fund Portfolio Holdings as of October 31, 2017 (Based on Net Assets) Description Market Value () Percentage Equinox Campbell Ltd Controlled Foreign Corporation $96,112,731 25.07%
ETFs 304: Effectively Using. Alternative, Leveraged & Inverse ETFs. Dave Nadig. Paul Britt, CFA Senior ETF Specialist ETF.com
 ETFs 304: Effectively Using Dave Nadig Chief Investment Officer ETF.com Alternative, Leveraged & Inverse ETFs Paul Britt, CFA Senior ETF Specialist ETF.com ETFs 304 - Questions 1. Do geared ETFs have a
Hedge Fund Index Replication. September 2013
 Hedge Fund Index Replication September 2013 Introduction Hedge Fund Investing What products enable hedge fund investing? Build and manage your own portfolio of HFs Select and allocate to Funds of HFs (FoFs)
Bache Commodity Index SM:
 Bache Bache Commodity Index SM: A Factor-Based Approach to Commodity Investment Research Report Authors: Hossein Kazemi, Ph.D. kazemi@alternativeanalytics.com George Martin martin@alternativeanalytics.com
Over the last several years, the rapid rise
 Going Long on Index investing has long been popular in the securities markets. Now it is coming into fashion in the futures world, and bringing a new source of liquidity to commodity futures contracts.
p r e s e n t i n g r e s e a r c h o n c o n t e m p o r a r y a n d e m e r g i n g p o r t f o l i o c o n s t r u c t i o n i s s u e s
 p r e s e n t i n g r e s e a r c h o n c o n t e m p o r a r y a n d e m e r g i n g p o r t f o l i o c o n s t r u c t i o n i s s u e s VOLUME THREE ISSUE TWO SUMMER 2006/07 5th ANNUAL PORTFOLIOCONSTRUCTION
Grant Park Multi Alternative Strategies Fund. Why Invest? Profile Since Inception. Consider your alternatives. Invest smarter.
 Consider your alternatives. Invest smarter. Grant Park Multi Alternative Strategies Fund GPAIX Executive Summary November 206 Why Invest? 30 years of applied experience managing funds during multiple market
Commodities. Sandra Ebner,, CFA Senior Portfolio Manager Deka Investment GmbH. May, 2010
 Commodities Sandra Ebner,, CFA Senior Portfolio Manager Deka Investment GmbH May, 2010 Long-term structural changes cause higher trendgrowth in commodity demand, but 7 5 Emerging markets are growing faster
Invesco Premium Income Fund
 Invesco Premium Income Fund Balanced Income A multi-asset strategy designed using risk-balancing principles that seeks income and an increase in value during periods of economic strength and seeks protection
Consolidated Schedule of Investments January 31, 2018 (Unaudited)
") Consolidated Schedule of Investments January 31, 2018 (Unaudited) Interest Rate Maturity Date Principal Amount Value U.S. Treasury Securities 33.16% U.S. Treasury Bills 13.04% (a) U.S. Treasury Bills 1.11%
Consolidated Schedule of Investments January 31, 2018 (Unaudited) Interest Rate Maturity Date Principal Amount Value U.S. Treasury Securities 33.16% U.S. Treasury Bills 13.04% (a) U.S. Treasury Bills 1.11%
Market Outlook Considerations Week Beginning April 2, 2018
 Market Outlook Considerations Week Beginning April 2, 2018 DISCLAIMER-FOR-EDUCATIONAL-PURPOSES-ONLY Bobby Coats, Ph.D. Professor Economics Department of Agricultural Economics and Agribusiness University
Market Outlook Considerations Week Beginning March 26, 2018
 Market Outlook Considerations Week Beginning March 26, 2018 DISCLAIMER-FOR-EDUCATIONAL-PURPOSES-ONLY Bobby Coats, Ph.D. Professor Economics Department of Agricultural Economics and Agribusiness University
IQ GLOBAL RESOURCES ETF (GRES) AND IQ REAL RETURN ETF (CPI) BOTH OUTPERFORM BENCHMARKS AT 3-YEAR ANNIVERSARY
 AND IQ REAL RETURN ETF (CPI) BOTH OUTPERFORM BENCHMARKS AT 3-YEAR ANNIVERSARY") IQ GLOBAL RESOURCES ETF (GRES) AND IQ REAL RETURN ETF (CPI) BOTH OUTPERFORM BENCHMARKS AT 3-YEAR ANNIVERSARY GRES has proven itself as an outperforming commodity ETF with low volatility; CPI has proven
IQ GLOBAL RESOURCES ETF (GRES) AND IQ REAL RETURN ETF (CPI) BOTH OUTPERFORM BENCHMARKS AT 3-YEAR ANNIVERSARY GRES has proven itself as an outperforming commodity ETF with low volatility; CPI has proven
Q2 Quarterly Market Review Second Quarter 2015
 Q2 Quarterly Market Review Second Quarter 2015 Quarterly Market Review Second Quarter 2015 This report features world capital market performance and a timeline of events for the past quarter. It begins
Morgan Stanley Wealth Management Due Diligence Meeting
 Morgan Stanley Wealth Management Due Diligence Meeting Commodities: Taking Advantage of Supply and Demand Fiona English, Client Portfolio Manager 24 26 April 2013, Milan Page 1 I For broker/dealer use
Commitments of Traders: Commodities
 Commitments of Traders: Commodities Leveraged funds positioning covering the week ending June 19, 218 Ole S. Hansen Head of Commodity Strategy 19-Jun-18 Change Change Change Change Pct 1 yr high 1 yr low
Commitments of Traders: Commodities
 Commitments of Traders: Commodities Leveraged funds positioning covering the week ending June 26, 218 Ole S. Hansen Head of Commodity Strategy 26-Jun-18 Change Change Change Change Pct 1 yr high 1 yr low
Pricing Supplement Dated November 16, 2012
 Pricing Supplement Dated November 16, 2012 To the Product Prospectus Supplement ERN-COMM-1 Dated February 24, 2011, Prospectus Supplement Dated January 28, 2011, and Prospectus Dated January 28, 2011 $4,834,000
White Paper Commodities as a Asset Class
 White Paper Commodities as a Asset Class As consumers, we feel the impacts of commodities whether it is at the gas pump, grocery store or in our energy bills. As investors, we need to know what they offer