Consolidated Financial Highlights
|
|
|
- Rudolf Harper
- 5 years ago
- Views:
Transcription
1
2 Consolidated Financial Highlights EXEDY CORPORATION AND CONSOLIDATED SUBSIDIARIES Years ended March 31, 2010 and % Charge / For the year: Net sales \ 152,671 \ 196,452 $ 2,362, % Net income 5,524 13, , % At yearend: Total assets 153, ,417 1,977, % Net assets 109, ,820 1,404, % Per share data: Net income \ \ $ % Net assets 2, , % Cash dividends % Note : Dollar figures are translated, for convenience only, at the rate of \ to U.S. $1.00.

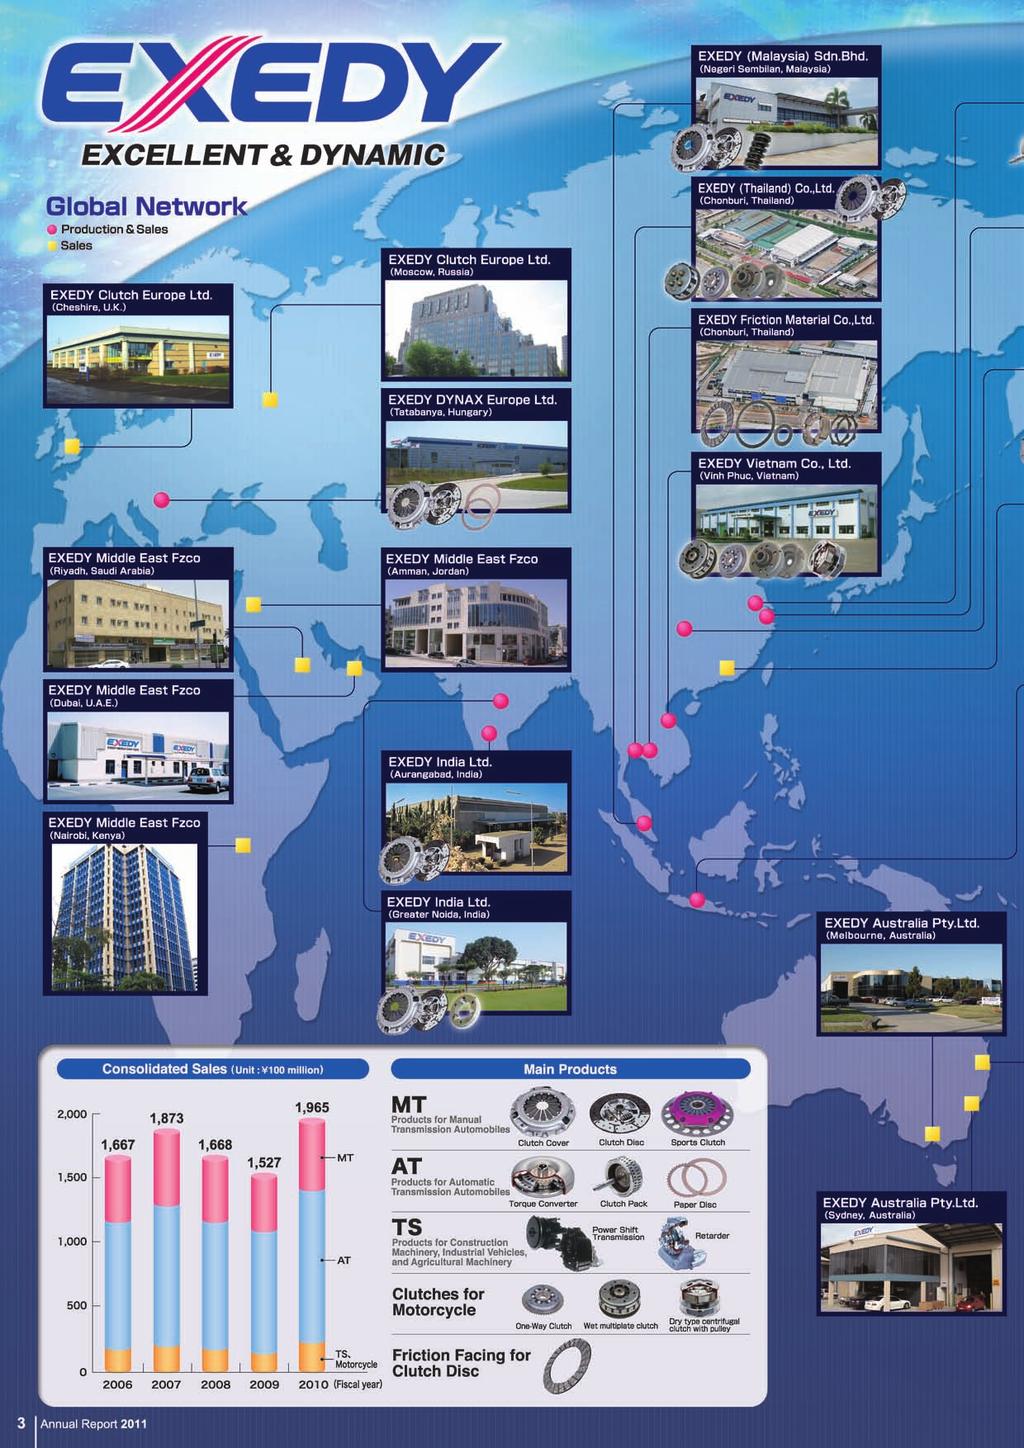
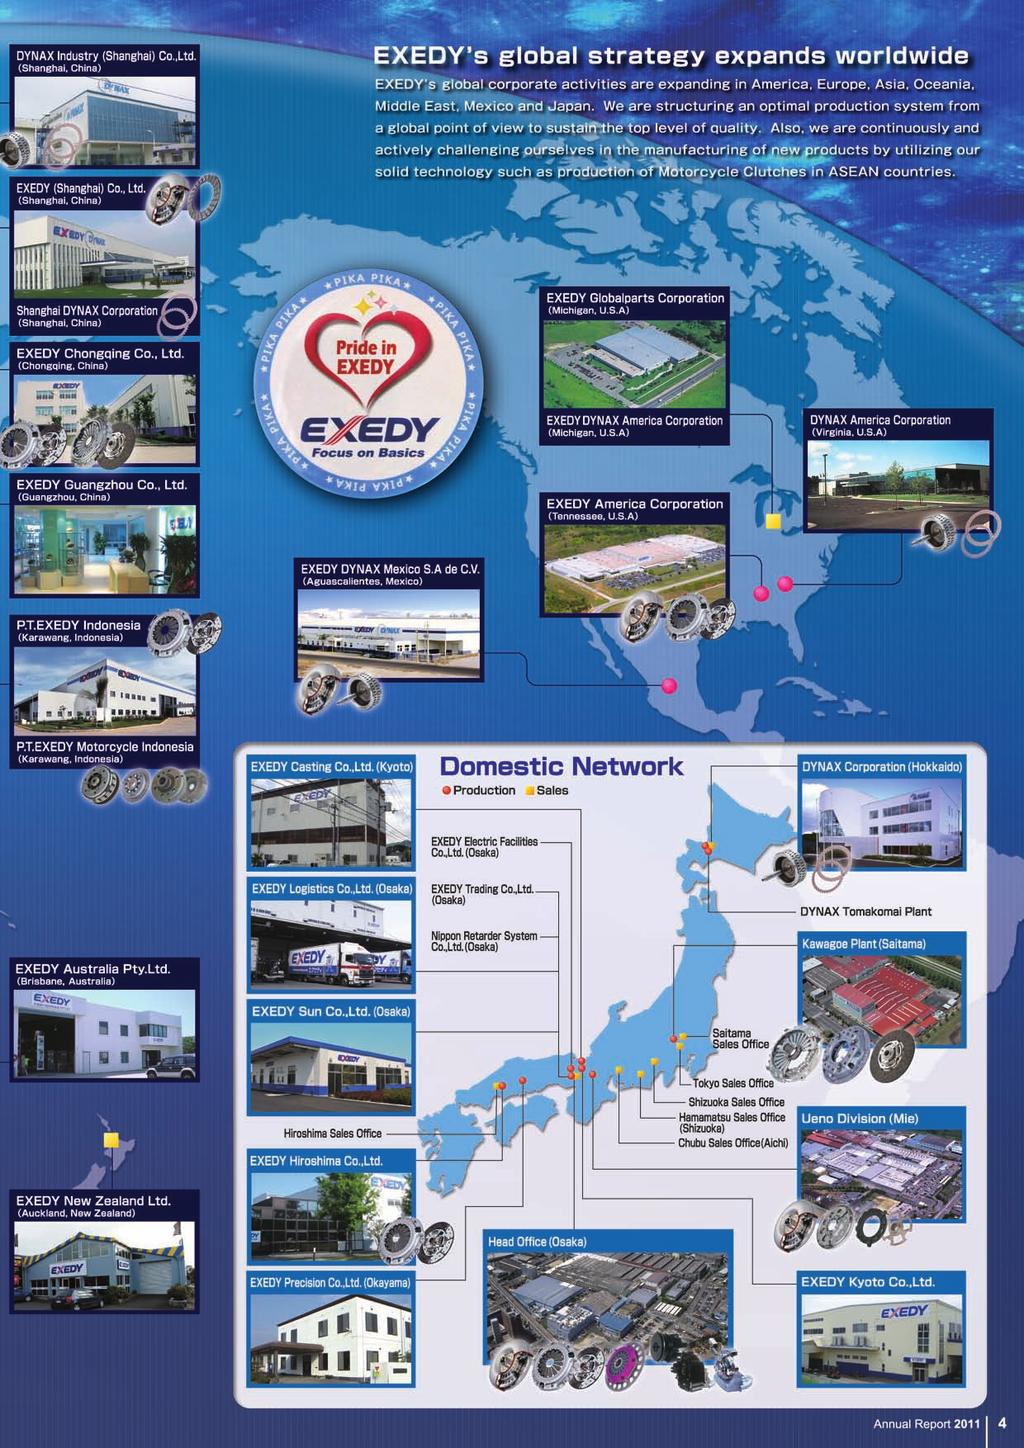
3 Business Operations Review of Fiscal Year Ended March 31, The fall of the Lehman Brothers had taken a toll on automobile makers and resulted in an economic slowdown worldwide where as increasing domestic demand in China and Asia is expected to continue. While the EXEDY Group benefited from the recovery in orders for the most of the year, the Tohoku earthquake that had devastated eastern Japan had as well affected our domestic business as we ended the 2010 year. We have taken action by implementing successful costcutting activities which contributed to our positive results in the fiscal year. For the consolidated results of the fiscal year under review, net sales had risen to billion (an increase of 28.7% from the previous fiscal year), operating income increased to 21.4 billion (an increase of 97.2% from the previous fiscal year), ordinary income climbed to 20.8 billion (an increase of 96.3% from the previous fiscal year), and net income edged to 13.0 billion (an increase of 135.8% from the previous fiscal year). Outlook of Fiscal Year Ended March 31, 2012 The Tohoku earthquake that had taken place in eastern Japan has decreased domestic orders and has left car markers as well as transmission makers out of key materials that were being sourced from the Tohoku area. Eventhough the recovery of the area will take time, the automotive industry is recovering faster than expected. In this situation, for the consolidated results of fiscal, we forecast a net sales of billion (an increase of 1.8% from the previous fiscal year), an operating income of 18.0 billion (a decrease of 15.9% from the previous fiscal year), an ordinary income of 17.9 billion (a decrease of 14.1% from the previous fiscal year), and a net income of 11.5 billion (a decrease of 11.7% from the previous fiscal year). September, Haruo Shimizu President and Chief Executive Officer From left to right: Katsumi Shintou (Director), Masayuki Matsuda (Director), Etsuji Terada (Director), Haruo Shimizu (President and Chief Executive Officer), Hisayasu Masaoka (Director), Hidehito Hisakawa (Director), Hideki Miura (Director) Annual Report 2
4
5


6
7 Consolidated FiveYear Summary EXEDY CORPORATION AND CONSOLIDATED SUBSIDIARIES Years ended March For the year: Net sales \ 166,745 \ 187,303 \ 166,750 \ 152,671 \ 196,452 $ 2,362,622 Net income 10,497 11,658 5,441 5,524 13, ,633 At yearend: Total assets \ 144,073 \ 158,147 \ 136,907 \ 153,426 \ 164,417 $ 1,977,354 Current assets 70,265 82,000 59,871 81,478 91,136 1,096,043 Property, plant and equipment 65,011 68,220 70,140 64,986 65, ,470 Current liabilities 32,932 37,207 24,115 32,911 36, ,828 Longterm debt 2,727 2,966 2,627 3,099 4,200 50,511 Net assets 99, , , , ,820 1,404,931 Net assets / Total assets 64.3 % 64.6 % 70.9 % 67.0 % 67.0 % 67.0 % Retained earnings 75,049 84,934 87,588 92, ,979 1,238,473 Per share data: Net income \ \ \ \ \ $ 3.23 Net income diluted Net assets 1, , , , , Note : Dollar figures are translated, for convenience only, at the rate of \ to U.S. $1.00. Financial Section Consolidated FiveYear Summary Consolidated Balance Sheets Consolidated Statements of Income Consolidated Statements of Changes in Net Assets Consolidated Statements of Cash Flows Notes to Consolidated Financial Statements Independent Auditors' Report Corporate Data
8 Consolidated Balance Sheets EXEDY CORPORATION AND CONSOLIDATED SUBSIDIARIES As of March 31, 2010 and ASSETS 2010 Current Assets: Cash and cash equivalents [Notes 1(q) and 17] \ 25,597 \ 30,038 $ 361,251 Time deposits ,403 Notes and accounts receivable (Notes 17 and 19) Trade 33,394 33, ,627 Nonconsolidated subsidiaries and affiliates Allowance for doubtful accounts (87 ) (82 ) (986 ) Inventories (Note 2) 16,455 21, ,346 Deferred tax assets (Note 8) 2,417 2,819 33,903 Shortterm loans ,568 Other current assets 2,406 3,146 37,835 Total current assets 81,478 91,136 1,096,043 Property, Plant and Equipment (Note 4 ) : Land 8,275 8,166 98,208 Buildings and structures 41,732 42, ,374 Machinery and vehicles 106, ,490 1,292,724 Tools and furniture 37,263 38, ,917 Construction in progress 2,052 6,367 76, , ,869 2,439,796 Less accumulated depreciation (131,213 ) (137,474 ) (1,653,326 ) Total property, plant and equipment 64,986 65, ,470 Investments and Other Assets: Investments in securities (Notes 3 and 17) 1,137 1,494 17,968 Investments in and loans to nonconsolidated subsidiaries and affiliates ,455 Longterm loans ,696 Deferred tax assets (Note 8) 2,793 2,144 25,785 Other assets 2,269 3,404 40,937 Total investments and other assets 6,962 7,886 94,841 Total Assets \ 153,426 \ 164,417 $1,977,354 The accompanying notes to the consolidated financial statements are an integral part of these statements. 7
9 LIABILITIES AND NET ASSETS 2010 Current Liabilities: Shortterm borrowings including current portion of longterm debt (Notes 4, 6 and 17) \ 4,722 \ 3,465 $ 41,672 Notes and accounts payable (Note 17) Trade 16,496 19, ,808 Construction 724 1,591 19,134 Nonconsolidated subsidiaries and affiliates Accrued expenses (Note 17) 6,098 7,126 85,701 Accrued income taxes 3,902 3,844 46,230 Other current liabilities ,886 Total current liabilities 32,911 36, ,828 Longterm Liabilities: Longterm debt (Notes 4, 6 and 17) 3,099 4,200 50,511 Deferred tax liabilities (Note 8) 1,069 1,145 13,770 Employees' severance and retirement benefits (Note 9) 6,106 5,044 60,661 Retirement benefits for directors and corporate auditors Other longterm liabilities 989 1,043 12,545 Total longterm liabilities 11,419 11, ,595 Contingent Liabilities (Note 19) Net Assets Shareholders' Equity (Note 18): Common stock Authorized 168,000 thousand shares in 2010 and Issued 48,594 thousand shares in 2010 and 8,284 8,284 99,627 Capital surplus 7,541 7,541 90,691 Retained earnings 92, ,979 1,238,473 Treasury stock 12 thousand shares in 2010 and 288 thousand shares in (39) (804) (9,669) Total shareholders' equity 107, ,000 1,419,122 Accumulated Other Comprehensive Income Net unrealized holding gains on other securities ,293 Foreign currency translation adjustments [Note 1(c)] (5,477) (8,240) (99,098) Total accumulated other comprehensive income (5,158) (7,883) (94,805) Minority Interests 6,328 6,703 80,614 Total net assets 109, ,820 1,404,931 Total Liabilities and Net Assets \ 153,426 \ 164,417 $ 1,977,354 8
10 Consolidated Statements of Income EXEDY CORPORATION AND CONSOLIDATED SUBSIDIARIES Years ended March 31, 2010 and 2010 Net Sales \ 152,671 \ 196,452 $ 2,362,622 Cost of Sales 122, ,344 1,832,159 Gross profit 30,296 44, ,463 Selling, General and Administrative Expenses (Note 10) 19,445 22, ,145 Operating income 10,851 21, ,318 Other Income (Expenses) : Interest and dividend income Interest expense (334) (323) (3,885) Losses on sale or disposal of property, plant and equipment (612) (32) (385) Equity in gains of nonconsolidated subsidiaries and affiliates Foreign exchange gains (losses), net 101 (860) (10,343) Gains on reversal of allowance for doubtful accounts Gains on reversal of reserve for warranty ,141 Impairment losses on property, plant and equipment (Note 5) (571) Other, net ,146 (675) (385) (4,630) Income before income taxes and minority interests 10,176 21, ,688 Income Taxes (Note 8) Current 4,498 6,504 78,220 Deferred (35) 225 2,706 Income before Minority Interests 5,713 14, ,762 Minority Interests in Net Income of Consolidated Subsidiaries 189 1,258 15,129 Net Income \ 5,524 \ 13,024 $ 156,633 Per Share Data (Note 14) : Net income \ \ $ 3.23 Net income diluted Cash dividends The accompanying notes to the consolidated financial statements are an integral part of these statements. 9
11 Consolidated Statements of Comprehensive Income EXEDY CORPORATION AND CONSOLIDATED SUBSIDIARIES Years ended March 31, 2010 and 2010 Income before Minority Interests \ 5,713 \ 14, ,762 Other Comprehensive Income Net unrealized holding gains on other securities Foreign currency translation adjustments 820 (3,122) (37,547) Share of other comprehensive income of associates accounted for using equity method Total other comprehensive income 1,156 (3,083) (37,078) Comprehensive Income \ 6,869 \ 11,199 $ 134,684 Comprehensive Income attribute to: Owners of the parent 6,607 10, ,860 Minority interests ,824 Consolidated Statements of Changes in Net Assets EXEDY CORPORATION AND CONSOLIDATED SUBSIDIARIES Years ended March 31, 2010 and Shareholders' equity Accumulated other comprehensive income Common stock Capital surplus Retained earnings Treasury stock Total shareholders' equity Net unrealized holding gains on other securities Foreign currency translation adjustments Minority interests Total Net Assets Balance as of March 31, 2009 Increase for unification of accounting policies \ 8,284 \ 7,541 \ 87,588 \ (38) \ 103,375 \ 127 \ (6,368) \ 6,115 \ 103,249 applied to foreign subsidiaries Net income Purchase of treasury stock Cash dividends paid Other, net Balance as of March 31, 2010 Net income Purchase of treasury stock Cash dividends paid Other, net 8,284 7,541 5,524 (972) 92,140 13,024 (2,185) (1) (39) (765) 5,524 (1) (972) 107,926 13,024 (765) (2,185) (5,477) (2,763) 213 6, ,524 (1) (972) 1, ,096 13,024 (765) (2,185) (2,350) Balance as of March 31, \ 8,284 \ 7,541 \ 102,979 \ (804) \ 118,000 \ 357 \ (8,240) \ 6,703 \ 116,820 Shareholders' equity Accumulated other comprehensive income Common stock Capital surplus Retained earnings Treasury stock Total shareholders' equity Net unrealized holding gains on other securities Foreign currency translation adjustments Minority interests Total Net Assets Balance as of March 31, 2010 Net income Purchase of treasury stock Cash dividends paid Other, net Balance as of March 31, $ 99,627 $ 90,691 $ 99,627 $ 90,691 $ 1,108, ,633 (26,278) $ 1,238,473 $ (469) (9,200) $ (9,669) $ 1,297, ,633 (9,200) (26,278) $ 1,419,122 $ 3,836 $ (65,869) $ 76, $ 4,293 (33,229) $ (99,098) 4,510 $ 80,614 $ 1,312, ,633 (9,200) (26,278) (28,262) $ 1,404,931 The accompanying notes to the consolidated financial statements are an integral part of these statements. 10
12 Consolidated Statements of Cash Flows EXEDY CORPORATION AND CONSOLIDATED SUBSIDIARIES Years ended March 31, 2010 and 2010 Cash Flows from Operating Activities: Income before income taxes and minority interests \ 10,176 \ 21,011 $ 252,688 Adjustments for : Depreciation and amortization 11,994 11, ,359 Losses on sale or disposal of property, plant and equipment Impairment losses on property, plant and equipment 571 Decrease in allowance for doubtful accounts (16) (0) (0) Increase (decrease) in employees' severance and retirement benefits 545 (1,062) (12,772) Interest and dividend income (77) (78) (938) Interest expense ,885 Decrease (increase) in notes and accounts receivables (8,588) (814) (9,790) Increase in inventories (1,716) (5,644) (67,877) Increase (decrease) in notes and accounts payables 3,145 3,453 41,527 Other, net 2, ,302 Subtotal 19,162 29, ,408 Interest and dividend income received ,251 Interest paid (323) (316) (3,801) Income taxes paid 547 (6,449) (77,559) Net cash provided by operating activities 19,514 22, ,299 Cash Flows from Investing Activities: Increase in time deposits (290) (460) (5,532) Decrease in time deposits ,729 Payments for purchases of property, plant and equipment (7,565) (13,965) (167,949) Proceeds from sales of property, plant and equipment ,257 Payments for acquisitions of intangible assets (262) (826) (9,934) Payments for purchases of investment in securities (10) (286) (3,440) Payments for additional portions of consolidated subsidiaries (42) (439) (5,280) Payments for acquisitions of consolidated subsidiaries(note 8) (448) Additions to loans receivable (28) (52) (625) Collection of loans receivable ,526 Other, net (82) (58) (697) Net cash used in investing activities (8,594) (14,713) (176,945) Cash Flows from Financing Activities: Increase (decrease) in shortterm borrowings, net (403) (420) (5,051) Proceeds from longterm loans payable 913 2,018 24,269 Repayments of longterm loans payable (955) (1,153) (13,867) Payments for acquisitions of treasury stock (1) (765) (9,200) Cash dividends paid (972) (2,186) (26,290) Cash dividends paid to minority shareholders (434) (368) (4,426) Other, net (11) (6) (71) Net cash used in financing activities (1,863) (2,880) (34,636) Effect of Exchange Rate Changes on Cash and Cash Equivalents 205 (774) (9,308) Net Increase in Cash and Cash Equivalents 9,262 4,441 53,410 Cash and Cash Equivalents at Beginning of Year 16,335 25, ,841 Cash and Cash Equivalents at End of Year \ 25,597 \ 30,038 $ 361,251 The accompanying notes to the consolidated financial statements are an integral part of these statements. 11
13 Notes to Consolidated Financial Statements EXEDY CORPORATION AND CONSOLIDATED SUBSIDIARIES 1. Summary of Significant Accounting and Reporting Policies (a) Basis of presenting the consolidated financial statements The accompanying consolidated financial statements of Exedy Corporation ( the Company") and its consolidated subsidiaries have been prepared in accordance with the provisions set forth in the Financial Instruments and Exchange Law in Japan and its related accounting regulations, and in conformity with accounting principles generally accepted in Japan ( Japanese GAAP ), which are different in certain respects as to application and disclosure requirements from International Financial Reporting Standards. The accounts of the Company s overseas subsidiaries are prepared in accordance with either International Financial Reporting Standards or U.S. generally accepted accounting principles, with consolidation adjustments for the specified six items, which are described in Practical Solution on Unification of Accounting Policies Applied to Foreign Subsidiaries for Consolidated Financial Statements( PITF No.18 ), as applicable. The accompanying consolidated financial statements have been restructured and translated into English from the consolidated financial statements of the Company prepared in accordance with Japanese GAAP and filed with the appropriate Local Finance Bureau of the Ministry of Finance as required by the Financial Instruments and Exchange Law in Japan. Certain supplementary information included in the statutory Japanese language consolidated financial statements, but not required for fair presentation, is not presented in the accompanying consolidated financial statements. The translation of the amounts into U.S. dollar amounts is included solely for the convenience of readers outside Japan, using the prevailing exchange rate at March 31,, which was to U.S. $1.00. The convenience translation should not be construed as representation that the amounts have been, could have been, or could in the future be, converted into at this or any other rate of exchange. (b) Principles of consolidation The accompanying consolidated financial statements include the accounts of the Company and significant companies over which the Company has power of control through majority voting rights or the existence of certain conditions evidencing control by the Company. The consolidated financial statements include the accounts of the Company and its 29 (28 as of March 31, 2010) significant majority owned subsidiaries. Investments in nonconsolidated subsidiaries and affiliates over which the Company has the ability to exercise significant influence over operating and financial policies of the investees, are accounted for using the equity method. Investments in 5 (4 as of March 31, 2010) nonconsolidated subsidiaries and 1 (1 as of March 31, 2010) affiliate are accounted for using the equity method. In the elimination of investments in consolidated subsidiaries, the assets and liabilities of the subsidiaries, including the portion attributable to minority shareholders, are valued using the fair value at the time the Company acquired control of the respective subsidiary. Material intercompany balances, transactions and profits have been eliminated in consolidation. All the overseas subsidiaries except for 1 consolidated subsidiary, are consolidated using a fiscal period ending December 31. Significant transactions occurring from January 1 to March 31, the Company s fiscal yearend, are adjusted for in the consolidated financial statements. (c) Translation of foreign currencies Monetary assets and liabilities denominated in foreign currency are translated into at current rates at each balance sheet date and the resulting translation gains or losses are charged to income for the current period. The balance sheets of consolidated overseas subsidiaries are translated into at the yearend rates except for shareholders' equity accounts, which are translated at historical rates. Income statements of consolidated overseas subsidiaries are translated at the average rates during the year. Translation adjustments resulting from translating financial statements whose accounts are denominated in foreign currencies are not included in the determination of net income but are reported as Foreign currency translation adjustments in a component of net assets and minority interests. (d) Securities Securities consist principally of marketable and nonmarketable equity securities. Other securities with available fair market value are stated at fair market value. Net unrealized holding gains and losses on these securities are reported, net of applicable income taxes, as a separate component of net assets. Realized gains and losses on the sale of such securities are computed using the moving average cost method. Other securities with no available fair market value are stated at moving average cost, net of the amount considered uncollectible. If the fair market value of other securities declines significantly, such securities are stated at fair market value and the difference between the fair market value and the carrying amount is recognized as a loss in the period of decline. If the net asset value of other securities with no available fair market value declines significantly, such securities should be written down to the net asset value by charging to income. (e) Derivatives All derivatives are stated at fair value. (f) Inventories Inventories possessed for selling except for supplies are mainly stated at the lower of cost (firstin, firstout) or net realizable value at March 31,. Supplies are mainly stated at cost determined by the last purchase cost method. (g) Property, plant and equipment The Company and its domestic consolidated subsidiaries compute the depreciation of property, plant and equipment by using the decliningbalance method and its overseas consolidated subsidiaries mainly by using the straightline method. The depreciation of buildings acquired by the Company and its domestic consolidated subsidiaries on and after April 1, 1998 is computed by using the straightline method. Estimated useful lives of property, plant and equipment are as follows: Buildings and structures years Machinery and vehicles years Tools and furniture years Maintenance and repairs including minor renewals and betterments are charged to income as incurred. (h) Software Software is amortized using the straightline method over the useful lives (35 years) of the software. (i) Leases Finance leases, except for certain immaterial leases, are capitalized and depreciated over lease terms, as applicable. However, as permitted, the Company and consolidated domestic subsidiaries account for finance leases commencing prior to April 1, 2008 which do not transfer ownership of the leased property to the lessee as operating lease with disclosure of certain as if capitalized information in Note 7. 12
14 (j) Income taxes The Company and its consolidated subsidiaries recognize the tax effects of temporary differences between the carrying amounts of assets and liabilities for tax and financial reporting purposes. The asset and liability approach is used to recognize deferred tax assets and liabilities for the expected future tax consequences of temporary differences between the carrying amounts of assets and liabilities for financial reporting purposes and the amounts used for income tax purposes. (k) Allowance for doubtful accounts The Company and its consolidated subsidiaries provide for doubtful accounts principally at an amount computed based on the historical bad debt ratio during a certain reference period plus the estimated uncollectible amount based on the analysis of individual accounts. (l) Employees' severance and retirement benefits The Company and its consolidated subsidiaries provide for employees' severance and retirement benefits at the end of the fiscal year based on the estimated amounts of projected benefit obligation and the fair value of the plan assets at that date. Actuarial differences are fully amortized in the year following the year in which the actuarial differences are recognized. Prior service costs are recognized in expenses in the year in which they are incurred. (Changes in accounting policies) Effective from the fiscal year ended March 31, 2010, the Company and consolidated domestic subsidiaries adopted the Partial Amendments to Accounting Standard for Retirement Benefits (Part 3) (Accounting Standards Board of Japan ( ASBJ ) Statement No.19 issued on July 31, 2008). The new accounting standard requires domestic companies to use the rate of return on longterm government or giltedged bonds as of the end of the fiscal year for calculating the projected benefit obligation of a definedbenefit plan. Previously, domestic companies were allowed to use a discount rate determined by taking into consideration fluctuations in the yield of longterm government or giltedged bonds over a certain period. This change had no material impact on the consolidated financial statements for the year ended March 31, (m) Retirement benefits for directors and corporate auditors Domestic consolidated subsidiaries have unfunded retirement allowance plans for directors and corporate auditors. The amounts required under the plans have been fully accrued. (Additional information) The Company abolished the practice of providing for retirement benefits for directors and corporate auditors based on the resolution for the abolishment of the institution for retirement benefits for directors and corporate auditors at the ordinary general meeting of the shareholders on June 24, As a result of this resolution, the estimated future payment of \401 million was transferred from retirement benefits for directors and corporate auditors to other longterm liabilities. (n) Accounting for consumption taxes Consumption taxes withheld upon sale and consumption taxes paid by the Companies on their purchases of goods and services are not included in the amounts of respective revenue or cost or expense items in the accompanying consolidated statements of income. (o) Per share data The computation of net income per share is based on the weighted average number of shares outstanding during each year, excluding the Company s treasury stock, and based on net income attributed to ordinary shareholders, excluding bonuses to directors and corporate auditors, etc. The computation of net assets per share is based on the number of shares of common stock outstanding at the yearend, excluding the Company s treasury stock, and based on net assets attributed to ordinary shareholders, excluding minority interests. Cash dividends per share shown in the statements of income are the amounts applicable to the respective years. (p) Goodwill Goodwill, except for minor goodwill is amortized by the straightline method over five years. Minor goodwill is expensed as incurred. (q) Cash and cash equivalents Cash and cash equivalents include cash on hand, demand deposits and shortterm investments which have maturities of three months or less when purchased, are easily convertible into cash and have few risks of fluctuation in value. (r) Reclassification Certain comparative figures have been reclassified to conform to the current year s presentation. (s) Changes in accounting policies Asset Retirement Obligations Effective April 1, 2010, the Company and its consolidated domestic subsidiaries adopted Accounting Standards for Asset Retirement Obligations (ASBJ Statement No.18 issued on March 31, 2008) and Guidance on Accounting Standards for Assets Retirement Obligations (ASBJ Guidance No. 21, issued on March 31, 2008). The effect on operating income, income before income taxes and minority interests, and net income as a result of applying the new accounting standard has been immaterial. Presentation of Comprehensive Income Effective March 31,, the Company adopted Accounting Standard for Presentation of Comprehensive Income (ASBJ Statement No. 25 on June 30, 2010) and Revised Accounting Standard for Consolidated Financial Statements (ASBJ Statement No. 22, revised on June 20, 2010). As a result of the adoption of these standards, the Company has presented the consolidated statement of comprehensive income in the consolidated financial statements for the fiscal year ended March 31,. The consolidated balance sheet and the consolidated statement of changes in net assets as of and for the fiscal year ended March 31, 2010 have been modified to conform with the new presentation rules of. In addition, the Company has presented the consolidated statement of comprehensive income for the fiscal year ended March 31, 2010 as well as that for the fiscal year ended March 31,. (t) Supplemental information Disclosures about Segments of an Enterprise and Related Information Effective April 1, 2010, the Company adopted Accounting Standard for Disclosures about Segments of an Enterprise and Related Information (ASBJ Statement No. 17 on March 27, 2009) and Guidance on Accounting Standard for Disclosures about Segments of an Enterprise and Related Information (ASBJ Guidance No. 20, issued on March 21, 2008). 13
15 2. Inventories Inventories as of March 31, 2010 and were as follows: 2010 Finished goods Workin process Raw materials Supplies \ 7,312 3,458 4,605 1,080 \ 16,455 \ 10,227 4,082 5,678 1,245 \ 21,232 $ 122,995 49,092 68,286 14,973 $ 255,346 The ending inventory balance represents after writedown of book value when their carrying amounts become unrecoverable, and the writedown recognized at cost of sales were \203 million and \260 million ($3,127 thousand) as of March 31, 2010 and, respectively. 3. Securities Other securities with book values (fair values) exceeding acquisition costs as of March 31, 2010 and were as follows: March 31, 2010 Acquisition cost Book value Difference Equity securities Interestbearing securities Others \ 334 \ 334 \ 910 \ 910 \ 576 \ 576 March 31, 2010 Acquisition cost Book value Difference Acquisition cost Book value Difference Equity securities Interestbearing securities Others \ 644 \ 644 \ 1,286 \ 1,286 \ 642 \ 642 $ 7,745 $ 7,745 $ 15,466 $ 15,466 $ 7,721 $ 7,721 Other securities with book values (fair values) not exceeding acquisition costs as of March 31, 2010 and were as follows: March 31, 2010 Acquisition cost Book value Difference Equity securities Interestbearing securities Others \ 197 \ 197 \ 159 \ 159 \ (38) \ (38) March 31, 2010 Acquisition cost Book value Difference Acquisition cost Book value Difference Equity securities Interestbearing securities Others \ 174 \ 174 \ 140 \ 140 \ (34) \ (34) $ 2,093 $ 2,093 $ 1,684 $ 1,684 $ (409) $ (409) The book value of securities with no available fair values as of March 31, 2010 and were as follows: 2010 Other securities with no fair value Nonlisted equity securities \ 68 \ 68 $
16 4. Assets Pledged as Collateral The following assets were pledged as collateral for \107 million and \179 million ($2,153 thousand) of secured loans from governmentsponsored agencies as of March 31, 2010 and, respectively : 2010 Accounts receivable and inventories Land Buildings and structures, net \ \ 97 \ 94 \ 94 $ 1,130 $ 1,130 As is customary in Japan, shortterm and longterm bank loans are made under general agreements which provide that additional security and guarantees for present and future indebtedness will be given at the request of the bank under certain circumstances, and that any collateral so furnished will be applicable to all indebtedness to that bank. To date, the Company and its consolidated subsidiaries have not received any such requests from their banks. 5. Impairment of Fixed Assets The Company and its consolidated subsidiaries evaluated the profitability in each business category, which is Manual automotive drivetrain operations, Automatic automotive drivetrain operations, Industrial drivetrain operations and Other (Plants and other facilities). Accounting for impairment of fixed assets shall be applied only when the investment may not be recoverable in the business. In the year ended March 31, 2010, the result indicates impairment in industrial machine drivetrain business due to deterioration of business environment and can not recover the investment through the future. Therefore the Company and its consolidated subsidiaries recognized impairment losses on those assets where the recoverable value was less than the net book value. The recoverable value of assets was based on value in use. Impairment losses were recognized for the excess of the net book value over the recoverable value. Moreover, the Company and its consolidated subsidiaries has some assets which belong to Manual automotive drivetrain category and there is no prospect for use. Therefore, the Company and its consolidated subsidiaries recognized impairment losses on those assets where the recoverable value was less than the net book value. The recoverable value of assets was based on net selling price. Impairment losses were recognized for the excess of the net book value over the recoverable value. Impairment losses on fixed assets for the year ended March 31, 2010 were as follows: March 31,2010 Asset Group Asset Type Usage Industrial machine drivetrain Buildings and structures Machinery and vehicles Tools and furniture Construction in progress Intangible assets Production \ MT Machinery and vehicles Idle 9 \ Shortterm Borrowings and Longterm Debt Shortterm borrowings and longterm debt as of March 31, 2010 and were as follows: 2010 Weighted average interest rates Year due Shortterm borrowings Current portion of longterm debt Current portion of lease obligation Longterm debt Lease obligations Other interest bearing debt \ 3,371 1, , \ 7,923 \ 2, , \ 7,795 $ 33,374 8, , $ 93, % Average interest rates for lease obligations are omitted because lease obligations include assumed interest amounts. 15
17 Annual maturities of longterm debt and lease obligations as of March 31, were as follows: Longterm dept Years ending March and thereafter \ 1,844 1, \ 4,200 $ 22,177 16,368 6,963 5,003 $ 50,511 Lease obligation Years ending March and thereafter \ \ 27 $ $ Leases (a) Finance leases As discussed in Note 1 (i), finance leases commenced prior to April 1, 2008 which do not transfer ownership of leased assets to lessees are accounted for as operating leases. Information relating to finance leases, except those leases for which the ownership of the leased assets is considered to be transferred to the lessee, is described below. Pro forma information regarding leased property such as acquisition cost, accumulated depreciation, accumulated losses on impairment and future minimum lease payments under finance leases that do not transfer the ownership of the leased property to the lessee for the years ended March 31, 2010 and were as follows: March 31, Acquisition cost Accumulated depreciation Accumulated losses on impairment Balance Machinery and vehicles Tools and furniture \ \ 256 \ \ 146 \ \ \ \ 110 March 31, Acquisition cost Accumulated depreciation Accumulated losses on impairment Balance Acquisition cost Accumulated depreciation Accumulated losses on impairment Balance Machinery and vehicles Tools and furniture \ \ 176 \ \ 105 \ \ \ \ 71 $ 962 1,155 $ 2,117 $ $ 1,263 $ $ $ $ 854 The scheduled maturities of future lease payments, on such lease contracts for the years ended March 31, 2010 and were as follows: 2010 Due within one year Due over one year \ \ 110 \ \ 71 $ $ 854 Lease payments for the year \ 50 \ 30 $ 361 The amounts of acquisition costs and future minimum lease payments under finance leases included the interest expense portions. Depreciation expenses, which are not reflected in the accompanying consolidated statements of income, calculated by the straightline method, would have been \50 million and \30 million ($ 361thousand) for the years ended March 31, 2010and, respectively. The Company had no leased assets on which impairment should have been recognized for the years ended March 31, 2010 and. 16
18 (b) Operating leases The scheduled maturities of future lease payments under noncancelable operating leases as of March 31, 2010 and, were as follows: 2010 Due within one year Due over one year \ 6 16 \ 22 \ 8 22 \ 30 $ $ Income Taxes Significant components of the Company and consolidated subsidiaries' deferred tax assets and liabilities as of March 31, 2010 and were as follows: 2010 Deferred tax assets: Employees' severance and retirement benefits Net operating losses carried forward Accrued bonuses to employees Impairment losses on property, plant and equipment Unrealized profit eliminated in consolidation (inventories) Losses on devaluation of inventories Unrealized profit eliminated in consolidation (fixed assets) Accrued warranty costs Accrued enterprise tax Retirement benefits for directors and corporate auditors Accounts payable Depreciation Other Total deferred tax assets Valuation allowance Deferred tax assets \ 2,466 1, ,741 (2,014) 6,727 \ 2,038 1,169 1, ,062 (1,509) 6,553 $ 24,510 14,059 12,977 7,925 5,917 5,664 4,498 3,945 3,103 2,622 11,737 96,957 (18,148) 78,809 Deferred tax liabilities: Depreciation and amortization Retained earnings of overseas subsidiaries Reserve for advanced depreciation Net unrealized holding gains on other securities Other Total deferred tax liabilities Valuation allowance Deferred tax liabilities (1,144) (795) (326) (220) (101) (2,586) (2,586) (1,038) (1,001) (329) (251) (119) (2,738) (2,738) (12,483) (12,038) (3,957) (3,019) (1,431) (32,928) (32,928) Net deferred tax assets \ 4,141 \ 3,815 $ 45,881 The Company and its consolidated subsidiaries are subject to a number of taxes based on income, which, in the aggregate, indicate a statutory tax rate in Japan of approximately 40.4% for the years ended March 31, 2010 and. The following table summarizes the significant differences between the statutory tax rate and the Company's effective tax rate for financial statement purposes for the years ended March 31, 2010 and : Statutory tax rate Adjustments for: Nondeductible expenses Per capita inhabitants tax Tax credit for research and development expenses Different tax rates applied to overseas subsidiaries Increase(decrease) of retained earnings of overseas subsidiaries Dividend Increase in valuation allowance Other Effective tax rate % (2.7) (3.8) % 40.4 % (1.5) (5.3) 1.0 (1.9) (1.0) %
19 9. Employees' Severance and Retirement Benefits The Company and its domestic consolidated subsidiaries have adopted defined benefit retirement plans: cash balance plans and lumpsum payment plans, as well as defined contribution pension plans. The liability for employees' severance and retirement benefits included in the liabilities section of the consolidated balance sheets as of March 31, 2010 and consisted of the following: 2010 Projected benefit obligation Fair value of plan assets Unrecognized actuarial differences Employees' severance and retirement benefits \ (11,601) 5,968 (5,633) (473) \ (6,106) \ (11,679) 6,446 (5,233) 189 \ (5,044) $ (140,457) 77,523 (62,934) 2,273 $ (60,661) Included in the consolidated statements of income for the years ended March 31, 2010 and were employees' severance and retirement benefit expenses comprised of the following: 2010 Service costs Interest costs Expected return on plan assets Amortization of actuarial differences Employees' severance and retirement benefit expenses Others \ (101) 1,134 1, \ 1,987 \ (119) (473) \ 364 $ 6,434 2,778 (1,431) (5,688) 2,093 2,285 $ 4,378 (Note) "Others" represents the payments to defined contribution pension plans. Assumptions used in the calculation of the above information were as follows: Method of attributing the projected benefits to periods of service Discount rate Expected rate of return on plan assets Amortization of prior service costs Amortization of actuarial differences 2010 Straightline basis 2.0% 2.0% 1 year 1 year Straightline basis 2.0% 2.0% 1 year 1 year 10. Research and development expenses Research and development expenses are charged to income as incurred. Research and development expenses charged to income for the years ended March 31, 2010 and were as follows: 2010 Research and development expenses \ 4,370 \ 4,596 $ 55,274 18
20 11. Derivatives The following table provides information on derivative instruments as of March 31, 2010 and. March 31, 2010 Contract amount Fair value Gain (Loss) Forward exchange contracts: To sell To sell Euro To sell Japanese Yen To buy To buy Thai bahts To buy Japanese Yen \ 1, \ 1,343 \ (22) (1) 0 (2) (2) (0) \ (27) \ (22) (1) 0 (2) (2) (0) \ (27) March 31, Contract amount Fair value Gain (Loss) Contract amount Fair value Gain (Loss) Forward exchange contracts: To sell To sell Euro To buy To buy Thai bahts To buy Japanese Yen \ \ 1,081 \ (4) (4) (4) (1) (0) \ (13) \ (4) (4) (4) (1) (0) \ (13) $ 8,082 1,395 2, $ 13,001 $ (48) (48) (48) (12) (0) $ (156) $ (48) (48) (48) (12) (0) $ (156) 12. Segment Information (a) General information about reportable segments The Company and its consolidated subsidiaries are mainly engaged in the manufacture and sale of automotive parts. From the aspects of function, technological specification and productive structure, the product lines of the Company are classified roughly into 2 group, "Manual Transmission Parts" and "Automatic Transmission Parts". The Company in cooperation with its consolidated subsidiaries design business strategy and conduct business for these 2 product lines inside Japan and overseas. And concerning these 2 product lines, separate financial information is accessible among the constituent units of the Company and that are subject to periodical examination, in order for the Board of Directors of the Company to determine the allocation of management resources. Accordingly, the reportable segments of the Company are composed of 2 segments, "MT (Manual automotive drivetrain related business)" which manufactures and sells Manual Transmission Parts and "AT (Automatic automotive drivetrain related business)" which manufactures and sells Automatic Transmission Parts. (b) Basis of measurement about reported segment profit or loss, segment assets, segment liabilities and other material items The accounting policies of the reportable segment are mainly consistent to what described in Note 1 "Summary of Significant Accounting and Reporting Policies". The segment profit (loss) is based on operating income before amortization of goodwill. The prices of the goods traded or transferred among the segments are mainly determined considering market prices of the goods. (c) Information about reported segment profit or loss, segment assets, segment liabilities and other material items Reported segment information for the years ended 31, 2010 and was as follows : Sales: Manual automotive drivetrain operations Automatic automotive drivetrain operations Reporting segment total Other operations Sub Total Eliminations (intersegment net sales) Operating Costs and Expenses: Manual automotive drivetrain operations Automatic automotive drivetrain operations Reporting segment total Other operations Sub Total Nonallocated operating expenses and eliminations \ 45,733 95, ,384 17, ,267 (6,596) \ 152,671 \ 39,837 90, ,271 17, ,850 (6,030) \ 141,820 \ 57, , ,105 27, ,069 (9,617) \ 196,452 \ 47, , ,490 25, ,922 (8,866) \ 175, $ 689,705 1,452,267 2,141, ,308 2,478,280 (115,658) $ 2,362,622 $ 576,259 1,329,814 1,906, ,857 2,211,930 (106,626) $ 2,105,304 19
21 Operating Income: Manual automotive drivetrain operations Automatic automotive drivetrain operations Reporting segment total Other operations Sub Total Nonallocated operating expenses and eliminations Assets: Manual automotive drivetrain operations Automatic automotive drivetrain operations Reporting segment total Other operations Sub Total Corporate and eliminations Depreciation and Amortization: Manual automotive drivetrain operations Automatic automotive drivetrain operations Reporting segment total Other operations Sub Total Corporate and eliminations Capital Expenditures: Manual automotive drivetrain operations Automatic automotive drivetrain operations Reporting segment total Other operations Sub Total Corporate and eliminations \ 5,896 5,217 11, ,417 (566) \ 10,851 \ 41,524 73, ,519 17, ,915 20,511 \ 153,426 \ 3,032 7,937 10,969 1,142 12,111 (117) \ 11,994 \ 1,527 3,270 4,797 1,597 6,394 (103) \ 6,291 \ 9,433 10,182 19,615 2,532 22,147 (751) \ 21,396 \ 43,033 78, ,970 20, ,960 21,457 \ 164,417 \ 2,861 7,820 10,681 1,067 11,748 6 \ 11,754 \ 4,266 9,218 13,484 2,291 15,775 (62) \ 15,713 $ 113, , ,899 30, ,350 (9,032) $ 257,318 $ 517, ,332 1,466, ,435 1,719, ,052 $ 1,977,354 $ 34,408 94, ,455 12, , $ 141,359 $ 51, , ,165 27, ,717 (745) $ 188,972 (Note) 1. "Other operations" is the business segment which doesn't attribute to any reportable segments, and contain industrial machine drivetrain operation, clutches for motorcycle operation, transport operation, etc. 2. The contents of Adjustments are as follows : (a) "Nonallocated operating expenses and eliminations" of Operationg Income \(751) million consists of "Elimination of intersegment transactions" \179 million, "Amortization of goodwill" \(130) million,"companywide expense" which is not allocated to reportable segments \(848) million and "other adjstments" \48 million. "Companywide expense" mainly consists general and administrative expenses and expence for newproduct development not attributable to any reportable segments. (b) "Corporate and eliminations" of Assets \21,457 million consists of "Companywide assets" which is not allocated to reportable segments \23,371 million, "Elimination of intersegment transaction" \(2,190) million "unamortized balance of goodwill" \518 million and "other adjstments" \242 million. "Companywide assets" mainly consists of the cash and cash equivalents and securities that are not attributable to any reportable segments. (c) "Corporate and eliminations" of Capital Expenditures \(62) million consists of "Adjustment of unrealized gain for intersegmnet transaction of fixed assets" \(62) million. 3. The segment income is adujted to accord with operating income of "consolidated statement of income". (1) Information about products and services Due to the segment of products and services are same as the reportable segment, description of this item is omitted. (2) Information about geographic areas for the years ended March 31, was as follows : Sales: Japan America AsiaOceania Other Tangible Assets: Japan America AsiaOceania Other \ 89,646 36,994 60,400 9,412 \ 196,452 \ 38,098 7,816 19, \ 65,395 $ 1,078, , , ,193 $ 2,362,622 $ 458,184 93, ,597 4,690 $ 786,470 The Company's operations are classified into geographical areas as follows: Japan, America (including Mexico), AsiaOceania (Thailand, Malaysia, China, Korea, Indonesia, Vietnam, Australia, United Arab Emirates, New Zealand and India) and Other (Europe). (3) Information about major customer for the years ended March 31 was as follows : Company Name Sales Segment JATCO Corporation AT and MT \ 29,892 $ 359,495 20
22 13. Related Party Transactions For the years ended March 31, 2010 and, the Company and its consolidated subsidiaries had operational transactions with Aisin AW Co., Ltd and Aisin Holdings of America, Inc., which are subsidiaries of Aisin Seiki Co., Ltd. which holds 33.4% of the Company's voting rights. A summary of the significant transactions between the Company and its consolidated subsidiaries and such companies for the years ended March 31, 2010 and were as follows: March 31, Subjects Categories Name Address The Company Other related company's subsidiary Aisin AW Co., Ltd. Anjo City Aichi pref. Capital U.S.dollars \ 26,480 Operation Manufacturing automotive parts Voting rights (%) Relationship Business relationship Sale of products Trade Sale of products Concurrently serving as directors Amount U.S.dollars \ 4,059 Accounts Accounts receivable Advanced received Balance U.S.dollars \ 1,021 \ 5 Dynax Corporation Other related company's subsidiary Aisin AW Co., Ltd. Anjo City Aichi pref. \ 26,480 Manufacturing automotive parts Sale of products Sale of products \ 2,192 Accounts receivable \ 537 Exedy America Corporation Other related company's subsidiary Aisin Holdings of America, Inc. Indiana U.S.A. $ 282,290 Administration of overall North American operations 40% Dept Interest expense \ 37 Longterm debt \ 1,547 March 31, Subjects Categories Name Address The Company Other related company's subsidiary Aisin AW Co., Ltd. Anjo City Aichi pref. Capital U.S.dollars \ 26,480 $ 318,461 Operation Manufacturing automotive parts Voting rights (%) Relationship Business relationship Sale of products Trade Sale of products Concurrently serving as directors Amount U.S.dollars \5,693 $68,467 Accounts Accounts receivable Advanced received Balance U.S.dollars \ 1,239 $ 14,901 \ 8 $ 96 Dynax Corporation Other related company's subsidiary Aisin AW Co., Ltd. Anjo City Aichi pref. \ 26,480 $ 318,461 Manufacturing automotive parts Sale of products Sale of products \2,941 $35,370 Accounts receivable \ 609 $ 7,324 Exedy America Corporation Other related company's subsidiary Aisin Holdings of America, Inc. Indiana U.S.A. $ 282,290 Administration of overall North American operations 40% Dept Interest expense \12 $144 Longterm debt \ 1,369 $ 16,464 (Transaction terms and policy determination thereof) With regard to sale of products and debt, prices and other transaction terms are determined by negotiation in consideration of market situations. Consumption taxes are included in the balance, but not in the trade amounts. 14. Per Share Data Per share data for the years ended March 31, 2010 and were as follows : 2010 Net income Net income diluted Net assets \ , \ , $ Diluted net income per share is not disclosed because potentially dilutive securities have not been issued. The information on which per share data was calculated for the years ended March 31, 2010 and was as follows: 2010 Net income per share of common stock Net income Amounts not attributed to ordinary shareholders Net income attributed to ordinary shareholders \ 5,524 \ 5,524 \ 13,024 \ 13,024 $ 156,633 $ 156,633 The weighted average number of shares 48,582 48,539 21
23 15. Changes in Net Assets (a) Shares issued / Treasury stock March 31, 2010 Number of shares as of March 31, 2009 Increase Decrease Number of shares as of March 31, 2009 Shares issued: Common stock 48,594 48,594 48,594 48,594 Treasury stock: Common stock The increase of treasury stock common stock 0 thousand is due to purchase of the stocks less than standard unit 8 hundred. March 31, Number of shares as of March 31, 2010 Increase Decrease Number of shares as of March 31, Shares issued: Common stock 48,594 48,594 48,594 48,594 Treasury stock: Common stock The increase of treasury stock common stock 275 thousand is due to openmarket purchase of treasury stock pursuant to a resolution of the board of directors meeting held on January 27, The increase of treasury stock common stock 1 thousand is due to purchase of the stocks less than standard unit 6 hundred. (b) Dividends (1) Dividends March 31, 2010 Resolution Ordinary general meeting of the shareholders on June 24, 2009 Board of Directors' meeting on October 29, 2009 Type of shares Cash dividends paid Dividends per share () Cutoff date Effective date Common stock \ 486 \ 10.0 March 31, 2009 June 25, 2009 Common stock \ 486 \ 10.0 September 30, 2009 November 27, 2009 March 31, Resolution Type of shares Cash dividends paid Cash dividends paid () () Cutoff date Effective date Ordinary general meeting of the shareholders on June 24, 2010 Common stock \ 1,215 $ 14,612 \ 25.0 $ 0.30 March 31, 2010 June 25, 2010 Board of Directors' meeting on October 28, 2010 Common stock \ 972 $ 11,690 \ 20.0 $ 0.24 September 30, 2010 November 26, 2010 (2) Dividends, of which cutoff date was in the year ended March 31,, and effective date of which will be in the year ending March 31, 2012 Resolution Type of shares Cash dividends paid Source of dividends Cash dividends paid () () Cutoff date Effective date Ordinary general meeting of the shareholders on June 28, Common stock \ 1,449 $ 17,426 Retained earnings \ 30.0 $ 0.36 March 31, June 29, 22
 Consolidated FiveYear Summary EXEDY CORPORATION AND CONSOLIDATED SUBSIDIARIES Years ended March 31 FY2012 FY2013 FY2014 For the year: Net sales \ 202,236 \ 234,262 \ 256,011 \ 268,752 \ 266,121 $ 2,372,063
ANNUAL REPORT 2016 Year Ended March 31, 2016
 ANNUAL REPORT 2016 Year Ended March 31, 2016 Consolidated Financial Highlights EXEDY CORPORATION AND CONSOLIDATED SUBSIDIARIES Years ended March 31, 2015 and 2016 % Change / For the year: Net sales \ 256,011
Consolidated Balance Sheets Osaka Gas Co., Ltd. and Consolidated Subsidiaries March 31, 2010 and 2011
 Consolidated Balance Sheets Osaka Gas Co., Ltd. and Consolidated Subsidiaries March 31, 2010 and 2011 Assets Fixed Assets Property, plant and equipment (Note 9) Production facilities 90,195 84,785 $ 1,019,663
Financial Information 2018 CONTENTS
 Financial Information CONTENTS Consolidated Balance Sheets P. 1 Consolidated Statements of Income P. 3 Consolidated Statements of Comprehensive Income P. 3 Consolidated Statements of Changes in Net Assets
Consolidated Balance Sheets SUBARU CORPORATION AND CONSOLIDATED SUBSIDIARIES As of March 31, 2017 and 2016
 Consolidated Balance Sheets 112.2 SUBARU CORPORATION AND CONSOLIDATED SUBSIDIARIES As of March 31, 2017 and 2016 U.S. dollars (Note 1) ASSETS Current assets: Cash and deposits (Note 4 and 5) 658,822 507,553
Notes to Consolidated Financial Statements
 ANRITSU CORPORATION AND CONSOLIDATED SUBSIDIARIES Years ended March 31, 2010, 2009 and 2008 1. BASIS OF PRESENTING CONSOLIDATED FINANCIAL STATEMENTS The accompanying consolidated financial statements of
THE KINKI SHARYO CO., LTD. AND CONSOLIDATED SUBSIDIARIES CONSOLIDATED FINANCIAL STATEMENTS AND INDEPENDENT AUDITORS' REPORT
 THE KINKI SHARYO CO., LTD. AND CONSOLIDATED SUBSIDIARIES CONSOLIDATED FINANCIAL STATEMENTS AND INDEPENDENT AUDITORS' REPORT Years ended March 31, 2013 and 2012 ASSETS THE KINKI SHARYO CO., LTD. AND CONSOLIDATED
Notes to Consolidated Financial Statements
 Notes to Consolidated Financial Statements 1. Basis of presenting consolidated financial statements On June 27, 2001, the Ordinary General Meeting of Shareholders of Toyoda Automatic Loom Works, Ltd. approved
CONSOLIDATED FINANCIAL STATEMENTS
 TSUBAKIMOTO CHAIN CO. and Consolidated Subsidiaries CONSOLIDATED FINANCIAL STATEMENTS Year Ended March 31, 2017 with Independent Auditor s Report Consolidated Balance Sheet TSUBAKIMOTO CHAIN CO. and Consolidated
Consolidated Financial Statements KYUDENKO CORPORATION. Years ended March 31, 2009 and 2008 with Report of Independent Auditors
 Consolidated Financial Statements KYUDENKO CORPORATION Years ended March 31, 2009 and 2008 with Report of Independent Auditors KYUDENKO CORPORATION and Consolidated Subsidiaries Consolidated Balance Sheets
Financial Performance (Consolidated)
") Financial Performance (Consolidated) Operating Results Net Sales Net sales totaled 212,957 million (US$2,004 million), up 487 million, or 0.2%, year on year. This was due to higher sales in the Industrial
Financial Performance (Consolidated) Operating Results Net Sales Net sales totaled 212,957 million (US$2,004 million), up 487 million, or 0.2%, year on year. This was due to higher sales in the Industrial
Notes to Consolidated Financial Statements
 1. Basis of Presenting Consolidated Financial Statements The accompanying consolidated financial statements of CASIO COMPUTER CO., LTD. ( the Company ) and its consolidated subsidiaries have been prepared
SUMITOMO DENSETSU CO., LTD. Non-consolidated Financial Statements
 SUMITOMO DENSETSU CO., LTD. Non-consolidated Financial Statements Independent Auditors' Report To the Shareholders and Board of Directors of Sumitomo Densetsu Co., Ltd. We have audited the accompanying
THE KINKI SHARYO CO., LTD. AND CONSOLIDATED SUBSIDIARIES CONSOLIDATED FINANCIAL STATEMENTS AND INDEPENDENT AUDITORS' REPORT
 THE KINKI SHARYO CO., LTD. AND CONSOLIDATED SUBSIDIARIES CONSOLIDATED FINANCIAL STATEMENTS AND INDEPENDENT AUDITORS' REPORT Years ended March 31, 2014 and 2013 ASSETS THE KINKI SHARYO CO., LTD. AND CONSOLIDATED
SAKATA INX CORPORATION NOTES TO CONSOLIDATED FINANCIAL STATEMENTS
 SAKATA INX CORPORATION NOTES TO CONSOLIDATED FINANCIAL STATEMENTS 1. Basis of Presenting Consolidated Financial Statements The accompanying consolidated financial statements of SAKATA INX CORPORATION (the
Consolidated Financial Statements
 Consolidated Financial Statements For the Year Ended March 31, 2017 (April 1, 2016 March 31, 2017) ALPS ELECTRIC CO., LTD. AND CONSOLIDATED SUBSIDIARIES CONSOLIDATED BALANCE SHEET ALPS ELECTRIC CO., LTD.
Financial Section Consolidated Statements of Cash Flows
 Consolidated Statements of Cash Flows Years Ended March 31, 2004 and Cash flows from operating activities: Income before income taxes and other items Adjustments to reconcile income before income taxes
Sekisui Chemical Integrated Report Financial Section. Financial Section
 Sekisui Chemical Integrated Report 2018 Financial Section Financial Section 77 Financial Highlights (6 years) 78 Consolidated Financial Statements 78 Consolidated Balance Sheet 80 Consolidated Statement
CHUGOKU MARINE PAINTS, LTD. Consolidated Financial Statements for the years ended March 31, 2017 and 2016
 CHUGOKU MARINE PAINTS, LTD. Consolidated Financial Statements for the years ended Consolidated Balance Sheets U.S. Dollars (Note 4) ASSETS Current assets: Cash on hand and in banks (Notes 17 and 19) 36,918
SAKATA INX CORPORATION CONSOLIDATED BALANCE SHEETS Years ended December 31, 2016 and 2015
 SAKATA INX CORPORATION CONSOLIDATED BALANCE SHEETS Years ended December 31, 2016 and 2015 ASSETS Current assets: Cash and deposits (Note 6) 9,297 7,889 Notes and accounts receivable - trade (Notes 5, 6
Notes to Consolidated Financial Statements
 01 Mazda Motor Corporation and Consolidated Subsidiaries 1 BASIS OF PRESENTING CONSOLIDATED FINANCIAL STATEMENTS The accompanying consolidated financial statements of Mazda Motor Corporation (the Company
Sekisui Chemical Integrated Report Financial Section
 Sekisui Chemical Integrated Report 2017 Financial Section Financial Section 77 Financial Highlights (6 years) 78 Consolidated Financial Statements 78 Consolidated Balance Sheet 80 Consolidated Statement
Calsonic Kansei Corporation and Consolidated Subsidiaries. Consolidated Financial Statements. March 31, 2011, 2010 and 2009
 Calsonic Kansei Corporation and Consolidated Subsidiaries Consolidated Financial Statements March 31, 2011, 2010 and 2009 Ell EnNsraYouNc Report of Independent Auditors The Board of Directors Calsonic
Annual Report
 Annual Report 2014 2014 Financial Highlights Report of independent Auditors Consolidated Balance Sheets Consolidated Statements of Income Consolidated Statements of Comprehensive Income Consolidated Statements
TSUBAKIMOTO CHAIN CO.
 TSUBAKIMOTO CHAIN CO. and Consolidated Subsidiaries CONSOLIDATED FINANCIAL STATEMENTS Years ended March 31, 2015 and 2014, with Report of Independent Auditors 2 Consolidated Balance Sheet TSUBAKIMOTO CHAIN
YEAR ENDED MARCH 31, 2011 ICOM INCORPORATED
 YEAR ENDED MARCH 31, 2011 ICOM INCORPORATED Financial Highlights ICOM INCORPORATED AND SUBSIDIARIES Years ended March 31, 2011, 2010 and 2009 2011 2010 2009 2011 Net sales 22,540 23,640 29,575 $ 271,109
SATORI ELECTRIC CO., LTD. and Consolidated Subsidiaries Years ended May 31
 By maintaining a constant grasp of the precise needs of the market, the Satori Group centered on SATORI ELECTRIC CO., LTD. has served as an efficient distribution channel between manufacturers and users
Financial Section Consolidated Statements of Cash Flows
 Consolidated Statements of Cash Flows Years Ended March 31, and Cash flows from operating activities: Income before income taxes and other items Adjustments to reconcile income before income taxes and
Consolidated Financial Statements KYUDENKO CORPORATION. Years ended March 31, 2004 and 2003 with Report of Independent Auditors
 Consolidated Financial Statements KYUDENKO CORPORATION Years ended March 31, 2004 and 2003 with Report of Independent Auditors Report of Independent Auditors The Board of Directors KYDENKO CORPORATION
Annual Report Financial Information
 Annual Report 2015 Financial Information Consolidated Balance Sheets Terumo Corporation and subsidiaries March 31, 2015 and 2014 Assets Current Assets: Cash and deposits (Notes 2 and 18) 129,679 95,619
ANNUAL REPORT 2017 FINANCIAL INFORMATION
 ANNUAL REPORT 2017 FINANCIAL INFORMATION Consolidated Balance Sheets and subsidiaries March 31, 2017 and 2016 Assets Current Assets: Cash and deposits (Notes 2 and 18) 105,388 149,672 Notes and accounts
THE KINKI SHARYO CO., LTD. AND CONSOLIDATED SUBSIDIARIES CONSOLIDATED BALANCE SHEETS 31st March, 2004 and ASSETS
 THE KINKI SHARYO CO., LTD. AND CONSOLIDATED SUBSIDIARIES CONSOLIDATED BALANCE SHEETS 31st March, 2004 and 2005 ASSETS LIABILITIES, MINORITY INTERESTS AND SHAREHOLDERS' EQUITY Current Assets: Current Liabilities:
ONOKEN CO., LTD. and Consolidated Subsidiaries. Consolidated Balance Sheets
 ONOKEN CO., LTD. and Consolidated Subsidiaries Consolidated Balance Sheets March 31, 2009 2008 2009 (Millions of yen) (Thousands of U.S. dollars) (Note 1) Assets Current assets: Cash and time deposits
YEAR ENDED MARCH 31, 2017 ICOM INCORPORATE
 YEAR ENDED MARCH 31, 2017 ICOM INCORPORATE Financial Highlights ICOM INCORPORATED AND SUBSIDIARIES Years ended March 31, 2017, 2016 and 2015 2017 2016 2015 2017 Net sales 24,092 26,875 26,399 $ 214,762
Notes to Consolidated Financial Statements
 Notes to Consolidated Financial Statements Years Ended March 31, and 1. BASIS OF PRESENTING CONSOLIDATED FINANCIAL STATEMENTS The accompanying consolidated financial statements have been prepared in accordance
Management s Disucussion and Analysis
 Management s Disucussion and Analysis [Overview of Performance] During the current consolidated fiscal year, the Japanese economy weakened due to deteriorating business performance and employment conditions
MODEC, INC. and Subsidiaries. Consolidated Financial Statements As of December 31, 2003 and 2002
 MODEC, INC. and Subsidiaries Consolidated Financial Statements As of December 31, 2003 and 2002 MODEC, INC. and Subsidiaries CONSOLIDATED BALANCE SHEETS December 31, 2003 and 2002 A S S E T S Japanese
Annual Report 2015 Fiscal year ended March 31, 2015
 Annual Report 2015 Fiscal year ended March 31, 2015 CONTENTS FINANCIAL HIGHLIGHTS 1 REPORT OF INDEPENDENT AUDITORS 2 CONSOLIDATED BALANCE SHEETS 3 CONSOLIDATED STATEMENTS OF INCOME 5 CONSOLIDATED STATEMENTS
Consolidated Financial Statements KYUDENKO CORPORATION. Years ended March 31, 2017 and 2016
 Consolidated Financial Statements KYUDENKO CORPORATION Years ended March 31, 2017 and 2016 KYUDENKO CORPORATION Consolidated Balance Sheet March 31, (Thousands of (Note 4) Assets Current assets: Cash
NOTES TO THE CONSOLIDATED FINANCIAL STATEMENTS
 NOTES TO THE CONSOLIDATED FINANCIAL STATEMENTS Note 1 BASIS OF PREPARING CONSOLIDATED FINANCIAL STATEMENTS The accompanying consolidated financial statements of Fuji Electric Holdings Co., Ltd. (the Company
Annual Report From April 1,2017 to March 31,2018
 Annual Report 2018 From April 1,2017 to March 31,2018 Financial Section Consolidated Balance Sheets 2 Consolidated Statements of Income 4 Consolidated Statements of Comprehensive Income 5 Consolidated
CONSOLIDATED BALANCE SHEET
 MODEC, INC. and Subsidiaries CONSOLIDATED BALANCE SHEET June 30, 2005 A S S E T S Japanese yen CURRENT ASSETS: Cash and time deposits 10,529,955 $ 95,182 Accounts receivable trade 12,063,379 109,043 Inventories
Consolidated Financial Statements
 Consolidated Financial Statements MODEC, INC. and Consolidated Subsidiaries For the Years ended December 31, 2014 and 2013 Together with Independent Auditor s Report MODEC, INC. and Consolidated Subsidiaries
Report of Independent Auditors
 Report of Independent Auditors The Board of Directors JALUX Inc. We have audited the accompanying consolidated balance sheets of JALUX Inc. and consolidated subsidiaries as of 2009 and 2008, and the related
CKD Corporation and Consolidated Subsidiaries. Consolidated Financial Statements for the Years Ended March 31, 2010 and 2009
 CKD Corporation and Consolidated Subsidiaries Consolidated Financial Statements for the Years Ended March 31, 2010 and 2009 CKD Corporation and Consolidated Subsidiaries Consolidated Balance Sheets March
Consolidated Financial Review
 Consolidated Financial Review Fiscal year 2000, ended March 31, 2001, was notable for the major restructuring actions taken in the year associated with the launch of Mazda s mid-term Millennium Plan. Financial
Consolidated Balance Sheets Consolidated Statements of Income...4. Consolidated Statements of Changes in Equity...5 6
 Contents Consolidated Balance Sheets...2 3 Consolidated Statements of Income...4 Consolidated Statements of Changes in Equity...5 6 Consolidated Statements of Cash Flows...7 Notes to Consolidated Financial
See accompanying notes.
 THE KINKI SHARYO CO., LTD. AND CONSOLIDATED SUBSIDIARIES CONSOLIDATED BALANCE SHEETS 31st March, 2005 and 2006 ASSETS LIABILITIES, MINORITY INTERESTS AND SHAREHOLDERS' EQUITY Current Assets: Current Liabilities:
Consolidated Balance Sheets Mitsui O.S.K. Lines, Ltd. March 31, 2007 and 2006
 Consolidated Balance Sheets Mitsui O.S.K. Lines, Ltd. March 31, 2007 and 2006 ASSETS Current assets: Cash and cash equivalents......................................... 51,383 60,267 $ 435,265 Marketable
CKD Corporation and Consolidated Subsidiaries. Consolidated Financial Statements for the Years Ended March 31, 2009 and 2008
 CKD Corporation and Consolidated Subsidiaries Consolidated Financial Statements for the Years Ended March 31, 2009 and 2008 CKD Corporation and Consolidated Subsidiaries Consolidated Balance Sheets March
Consolidated Balance Sheets
 Consolidated Balance Sheets ANRITSU CORPORATION AND CONSOLIDATED SUBSIDIARIES March 31, 2005 and 2004 (Note 1) 2005 2004 2005 ASSETS Current assets: Cash 31,845 32,830 $ 296,729 Marketable securities (Note
The investments in 20% to 50% owned companies ( Affiliated companies ) are, with minor exceptions, accounted for under the equity method.
 are, with minor exceptions, accounted for under the equity method.") 1. Major policies in preparing the consolidated financial statements: The accompanying consolidated financial statements of CAPCOM CO., LTD. (the Company ) and its subsidiaries have been prepared on the
1. Major policies in preparing the consolidated financial statements: The accompanying consolidated financial statements of CAPCOM CO., LTD. (the Company ) and its subsidiaries have been prepared on the
Notes to the Consolidated Financial Statements 1. Basis of Presenting Financial Statements (d) Allowance for Doubtful Accounts (e) Inventories
 Allowance for Doubtful Accounts (e) Inventories") Notes to the Consolidated Financial Statements Konica Minolta Holdings, Inc. and Consolidated Subsidiaries For the fiscal years ended March 31, 2008 and 2007 1. Basis of Presenting Financial Statements
Notes to the Consolidated Financial Statements Konica Minolta Holdings, Inc. and Consolidated Subsidiaries For the fiscal years ended March 31, 2008 and 2007 1. Basis of Presenting Financial Statements
Consolidated Balance Sheets
 Consolidated Balance Sheets (March 31, 2009 and 2010) (Note 1) 2009 2010 2010 ASSETS Cash and due from banks (Note 3, 4, 12 and 19) 125,465 151,438 $ 1,628 Call loans and bills purchased (Note 19) 23,569
Consolidated Balance Sheets
 Consolidated Balance Sheets Terumo Corporation and subsidiaries March 31, 2013 and 2012 Assets Current Assets: Cash and deposits (Notes 2 and 17).................................... 78,201 78,767 Notes
Consolidated Financial Statements. MODEC, INC. and Consolidated Subsidiaries
 Consolidated Financial Statements MODEC, INC. and Consolidated Subsidiaries For the years ended December 31, 2015 and 2014 MODEC, INC. and Consolidated Subsidiaries CONSOLIDATED BALANCE SHEETS December
Notes to Consolidated Financial Statements Hitachi Chemical Co., Ltd. and Consolidated Subsidiaries For the Years Ended March 31, 2005, 2004 and 2003
 Notes to Consolidated Financial Statements Hitachi Chemical Co., Ltd. and Consolidated Subsidiaries For the Years Ended March 31, 2005, 2004 and 2003 1. BASIS OF PRESENTATION AND SUMMARY OF SIGNIFICANT
Consolidated Financial Statements
 Consolidated Financial Statements Mitsui E&S Holdings Co., Ltd. and Consolidated Subsidiaries For the Years ended March 31, and Together with Independent Auditor s Report Financial Data Consolidated Balance
Consolidated Balance Sheets
 42 CONTENTS Consolidated Balance Sheets Mazda Motor Corporation and Consolidated Subsidiaries March 31, 2015 and 2014 (Note 1) ASSETS 2015 2014 2015 Current assets: Cash and cash equivalents 529,148 479,754
Contents. Consolidated Balance Sheets Consolidated Statements of Income...4. Consolidated Statements of Changes in Equity...
 Contents Consolidated Balance Sheets...2 3 Consolidated Statements of Income...4 Consolidated Statements of Changes in Equity...5 6 Consolidated Statements of Cash Flow...7 SUMIKIN BUSSAN CORPORATION and
Notes to Financial Statements
 Showa Denko K.K. and Consolidated Subsidiaries 1. BASIS OF REPORTING FINANCIAL STATEMENTS The accompanying consolidated financial statements have been prepared in accordance with accounting principles
Notes to Consolidated Financial Statements Sakata Inx Corporation and Consolidated Subsidiaries
 Notes to Consolidated Financial Statements Sakata Inx Corporation and Consolidated Subsidiaries 1. BASIS OF PRESENTING CONSOLIDATED FINANCIAL STATEMENTS Sakata Inx Corporation (the Company ) and its consolidated
FINANCIAL SECTION 2015 CONTENTS
 FINANCIAL SECTION 2015 CONTENTS 2 Consolidated Balance Sheets 4 Consolidated Statements of Income 5 Consolidated Statements of Comprehensive Income 6 Consolidated Statements of Changes in Net Assets 7
Quarterly Consolidated Balance Sheets (Unaudited)
") Quarterly Consolidated Balance Sheets (Unaudited) 31 March 2016 30 September 2016 30 September 2016 ASSETS Current assets: Cash and cash equivalents 16,922 21,251 $ 210,406 Short-term investments 794 786
Quarterly Consolidated Balance Sheets (Unaudited) 31 March 2016 30 September 2016 30 September 2016 ASSETS Current assets: Cash and cash equivalents 16,922 21,251 $ 210,406 Short-term investments 794 786
NOF CORPORATION Consolidated Financial Statements
 NOF CORPORATION Consolidated Financial Statements As of March 31, ASSETS NOF CORPORATION and Subsidiaries Consolidated Balance Sheet Current assets: Cash and time deposits (Notes 19 and 21) 30,077 19,081
MODEC, INC. and Consolidated Subsidiaries. Consolidated Financial Statements As of December 31, 2007 and 2006
 MODEC, INC. and Consolidated Subsidiaries Consolidated Financial Statements As of December 31, 2007 and 2006 MODEC, INC. and Consolidated Subsidiaries CONSOLIDATED BALANCE SHEETS December 31, 2007 and
2
 Consolidated Financial Statements NHK Spring Co., Ltd. and Consolidated Subsidiaries For the years ended March 31, 2018 and 2017 with Independent Auditor s Report 1 2 NHK Spring Co., Ltd. and Consolidated
Consolidated Financial Statements
 Consolidated Financial Statements Consolidated Financial Statements Consolidated Balance Sheet MANDOM CORPORATION and its Consolidated Subsidiaries As of March 31, 2016 Assets CURRENT ASSETS: Cash and
NOTES TO CONSOLIDATED FINANCIAL STATEMENTS
 NOTES TO CONSOLIDATED FINANCIAL STATEMENTS Asahi Group Holdings, Ltd. and Consolidated Subsidiaries 1. Basis of Presenting Consolidated Financial Statements The accompanying consolidated financial statements
2
 Consolidated Financial Statements NHK Spring Co., Ltd. and Consolidated Subsidiaries For the years ended March 31, 2017 and 2016 with Independent Auditor s Report 1 2 NHK Spring Co., Ltd. and Consolidated
MODEC, INC. and Consolidated Subsidiaries. Consolidated Financial Statements As of December 31, 2006 and 2005
 MODEC, INC. and Consolidated Subsidiaries Consolidated Financial Statements As of December 31, 2006 and 2005 MODEC, INC. and Consolidated Subsidiaries CONSOLIDATED BALANCE SHEETS December 31, 2006 and
FINANCIAL SECTION CONTENTS. Five-Year Summary Consolidated Financial Statements... 26
 ANNUAL REPORT 2017 FINANCIAL SECTION CONTENTS Five-Year Summary... 25 Consolidated Financial Statements... 26 Consolidated Balance Sheets... 26 Consolidated Statements of Income and Consolidated Statements
See accompanying notes. Consolidated Balance Sheets The Kiyo Bank, Ltd. and its consolidated subsidiaries As of March 31, 2018 and 2017
 Consolidated Balance Sheets The Kiyo Bank, Ltd. and its consolidated subsidiaries As of March 31, 2018 and 2017 U.S. dollars (Note 1) Assets: Cash and due from banks (Note 3) 621,370 671,707 $ 5,848,738
NOTES TO CONSOLIDATED FINANCIAL STATEMENTS
 NOTES TO CONSOLIDATED FINANCIAL STATEMENTS Seven & i Holdings Co., Ltd. and its consolidated subsidiaries 1. Basis of Presentation of Consolidated Financial Statements The accompanying Consolidated Financial
P010-E652 SHIMADZU REPORT Financial Section
 P010-E652 SHIMADZU REPORT 2017 Financial Section Shimadzu Corporation Consolidated Subsidiaries Consolidated Balance Sheet (Note 3) ASSETS CURRENT ASSETS: Cash cash equivalents (Note 13)... 52,763 43,509
NOTES TO CONSOLIDATED FINANCIAL STATEMENTS
 Bridgestone Corporation and Subsidiaries NOTE 1 NATURE OF OPERATIONS Bridgestone Corporation and its subsidiaries (hereinafter referred to collectively as the Companies ) engage in developing, manufacturing
Notes to Consolidated Financial Statements Years ended March 31, 2002, 2001 and 2000
 Notes to Consolidated Financial Statements Years ended March 31, 2002, 2001 and 2000 1. Basis of financial statements Sumitomo Realty & Development Co., Ltd. (the Company ), and its consolidated domestic
1. Basis of Presenting the Consolidated Financial Statements
 1. Basis of Presenting the Consolidated Financial Statements The accompanying consolidated financial statements of THE NIPPON ROAD CO., LTD. (the Company ) and its consolidated subsidiaries (hereinafter
CONSOLIDATED FINANCIAL STATEMENTS
 CONSOLIDATED FINANCIAL STATEMENTS LTD. and Consolidated Subsidiaries Consolidated Balance Sheet March 31, U.S. Dollars (Note 1) ASSETS 2016 CURRENT ASSETS: Cash and cash equivalents (Note 15) 77,051 67,133
(c) Cash and Cash Equivalents (d) Allowance for Doubtful Accounts (e) Inventories (f) Property, Plant and Equipment (a) Principles of Consolidation
 Cash and Cash Equivalents (d) Allowance for Doubtful Accounts (e) Inventories (f) Property, Plant and Equipment (a) Principles of Consolidation") NOTES TO THE CONSOLIDATED FINANCIAL STATEMENTS Konica Minolta Holdings, Inc. and Consolidated Subsidiaries For the fiscal years ended March 31, 2005 and 2004 1. BASIS OF PRESENTING FINANCIAL STATEMENTS
NOTES TO THE CONSOLIDATED FINANCIAL STATEMENTS Konica Minolta Holdings, Inc. and Consolidated Subsidiaries For the fiscal years ended March 31, 2005 and 2004 1. BASIS OF PRESENTING FINANCIAL STATEMENTS
Annual Report From April 1,2015 to March 31,2016
 Annual Report 2016 From April 1,2015 to March 31,2016 Financial Section Consolidated Balance Sheets 2 Consolidated Statements of Income 4 Consolidated Statements of Comprehensive Income 5 Consolidated
Financial Section Consolidated Balance Sheets
 Financial Section Consolidated Balance Sheets For more details about the financial information contained in this annual report, please refer to the financial information that has been made public on the
March 31, (Thousands of U.S. dollars) $ 42,903 63,527 9,385 (1,025) (8,069) (7,552) 3,613 3,177 (3,232) 7,936 2,962 (8) (3,578) 6,133 3,641
 $ 42,903 63,527 9,385 (1,025) (8,069) (7,552) 3,613 3,177 (3,232) 7,936 2,962 (8) (3,578) 6,133 3,641") Clarion Co., Ltd. and Subsidiaries Clarion Co., Ltd. and Subsidiaries Statements of Cash Flows Notes to the Financial Statements Cash flows from operating activities: Income before income taxes and minority
Clarion Co., Ltd. and Subsidiaries Clarion Co., Ltd. and Subsidiaries Statements of Cash Flows Notes to the Financial Statements Cash flows from operating activities: Income before income taxes and minority
Management s Discussion and Analysis
 FINANCIAL SECTION 41 Management s Discussion and Analysis 43 Operating Risks 44 Financial Summary 46 Consolidated Balance Sheet 48 Consolidated Statement of Income 48 Consolidated Statement of Comprehensive
Financial Section. Five-Year Summary
 Financial Section Five-Year Summary ----------------------------------------------------------------------------- 27 Financial Review --------------------------------------------------------------------------------
Clarion Co., Ltd. and Subsidiaries. Thousands of $0 1,421 46, (193) (2,060) 1,369 (2,848) 7, (426) (2,199) ,164
 (2,060) 1,369 (2,848) 7, (426) (2,199) ,164") Annual Report Clarion Co., Ltd. and Subsidiaries Clarion Co., Ltd. and Subsidiaries Statements of Cash Flows Notes to the Financial Statements Year ended Year ended Cash flows from operating activities:
Annual Report Clarion Co., Ltd. and Subsidiaries Clarion Co., Ltd. and Subsidiaries Statements of Cash Flows Notes to the Financial Statements Year ended Year ended Cash flows from operating activities:
Consolidated Financial Statements Meisei Industrial Co., Ltd. and Consolidated Subsidiaries
 Consolidated Financial Statements Meisei Industrial Co., Ltd. and Consolidated Subsidiaries Year ended March 31, with Independent Auditor s Report Meisei Industrial Co., Ltd. and Consolidated Subsidiaries
Notes to Consolidated Financial Statements
 Kobe Steel, Ltd. and Consolidated Subsidiaries Notes to Consolidated Financial Statements Years ended March 31, 2002 and 2001 1. Basis of Presenting Consolidated Financial Statements Kobe Steel, Ltd. (the
New Japan Radio Co., Ltd. and Consolidated Subsidiaries
 New Japan Radio Co., Ltd. and Consolidated Subsidiaries Consolidated Financial Statements for the Years Ended March 31, 2011 and 2010, and Independent Auditors' Report INDEPENDENT AUDITORS' REPORT To the
THE KINKI SHARYO CO., LTD. AND CONSOLIDATED SUBSIDIARIES CONSOLIDATED FINANCIAL STATEMENTS AND INDEPENDENT AUDITOR'S REPORT
 THE KINKI SHARYO CO., LTD. AND CONSOLIDATED SUBSIDIARIES CONSOLIDATED FINANCIAL STATEMENTS AND INDEPENDENT AUDITOR'S REPORT Years ended March 31, 2018 and 2017 ASSETS THE KINKI SHARYO CO., LTD. AND CONSOLIDATED
Financial Section Consolidated Balance Sheets
 Financial Section Consolidated Balance Sheets For more details about the financial information contained in this annual report, please refer to the financial information that has been made public on the
Consolidated Financial Statements Toho Zinc Co., Ltd. and Consolidated Subsidiaries
 Consolidated Financial Statements Toho Zinc Co., Ltd. and Consolidated Subsidiaries For the year ended March 31, 2018 with Independent Auditor s Report Toho Zinc Co., Ltd. and Consolidated Subsidiaries
CONSOLIDATED BALANCE SHEET
 MODEC, INC. and Subsidiaries CONSOLIDATED BALANCE SHEET June 30, 2004 A S S E T S Japanese yen U.S. dollars CURRENT ASSETS: Cash and time deposits 9,699,780 $ 89,457 Accounts receivable trade 16,590,764
Consolidated Financial Statements for the year ended March 31, SWCC Showa Holdings Co., Ltd. and Consolidated Subsidiaries
 Consolidated Financial Statements for the year ended March 31, 2013 SWCC Showa Holdings Co., Ltd. and Consolidated Subsidiaries CONSOLIDATED BALANCE SHEET SWCC SHOWA HOLDINGS CO., LTD. and Consolidated
1. Basis of Presenting Financial Statements (d) Allowance for Doubtful Accounts (e) Inventories (f) Property, Plant and Equipment
 Allowance for Doubtful Accounts (e) Inventories (f) Property, Plant and Equipment") NOTES TO THE CONSOLIDATED FINANCIAL STATEMENTS Konica Minolta Holdings, Inc. and Consolidated Subsidiaries For the fiscal years ended March 31, 2006 and 2005 1. Basis of Presenting Financial Statements
NOTES TO THE CONSOLIDATED FINANCIAL STATEMENTS Konica Minolta Holdings, Inc. and Consolidated Subsidiaries For the fiscal years ended March 31, 2006 and 2005 1. Basis of Presenting Financial Statements
Consolidated Financial Statements for the year ended March 31, SWCC Showa Holdings Co., Ltd. and Consolidated Subsidiaries
 Consolidated Financial Statements for the year ended March 31, 2017 SWCC Showa Holdings Co., Ltd. and Consolidated Subsidiaries CONSOLIDATED BALANCE SHEET SWCC SHOWA HOLDINGS CO., LTD. and Consolidated
NEW JAPAN RADIO CO., LTD. For the fiscal year 2009, ended March 31, 2010
 NEW JAPAN RADIO CO., LTD. Annual Report 2010 For the fiscal year 2009, ended March 31, 2010 Management s Discussion and Analysis [Overview of Performance] During the current consolidated fiscal year, we
EIZO NANAO CORPORATION
 EIZO NANAO CORPORATION Financial Highlights Eizo Nanao Corporation and Subsidiaries 2009 2010 2011 2011 Years ended March 31: Net sales 74,522 77,525 65,204 $ 785,590 Operating income 4,302 9,026 5,150
1. Basis of Presenting Financial Statements. 2. Summary of Significant Accounting Policies
 Notes to Consolidated Financial Statements Konica Minolta Holdings, Inc. and Consolidated Subsidiaries For the fiscal years ended March 31, 2004 and 2003 KONICA MINOLTA HOLDINGS, INC. 2004 1. Basis of
Consolidated Balance Sheet
 Consolidated Balance Sheet AUTOBACS SEVEN Co., Ltd. and its March 31, 2017 ASSETS CURRENT ASSETS: (Note 1) Cash and cash equivalents (Note 17) 31,389 36,579 $280,259 Time deposits with an original maturity