Attachment 1 to IOL-Enbridge 131(a)
|
|
|
- Bridget Powers
- 5 years ago
- Views:
Transcription
1 Attachment 1 to IOL-Enbridge 131(a)
 owns and operates the Canadian portion of the world s longest liquid petroleum pipeline.")
2 Rating Report November 27, 2009 Previous Report: November 28, 2008 Analysts Michael R. Rao, CFA Esther M. Mui, MBA, CMA The Company Enbridge Pipelines Inc. (EPI) owns and operates the Canadian portion of the world s longest liquid petroleum pipeline. The Enbridge System consists of a segment that transports crude oil from central Alberta to the Manitoba- U.S. border, where it connects with the U.S. Lakehead Pipe Line System (Lakehead System), in which the Company has a minority interest, and from Montréal to the Ontario- U.S. border. The Lakehead System reconnects with the Enbridge System at the Ontario-U.S. border. Enbridge Inc. s effective ownership interest in Lakehead System is 27.0%. EPI is an indirectly wholly owned subsidiary of Enbridge Inc. Commercial Paper Limit $300 million Recent Actions November 23, 2009 Confirmed all ratings and changed trend on long-term debt to Stable from Negative. November 6, 2009 New Issue Enbridge Pipelines Inc. Rating Debt Rating Rating Action Trend Commercial Paper R-1 (low) Confirmed Stable Medium-Term Notes & Unsecured Debentures A (high) Trend Change Stable Rating Update DBRS has confirmed the Commercial Paper rating of Enbridge Pipelines Inc. (EPI or the Company) at R-1 (low) with a Stable trend. Concurrently, DBRS has confirmed the Company s Medium-Term Notes & Unsecured Debentures at A (high) with the trend changed to Stable from Negative. The confirmation reflects continued progress on EPI s large multi-year capex program, diminished risks with respect to potential cost overruns and funding requirements and its low-risk business profile due to the strong regulatory environment and long-term contractual arrangements. The trend change reflects DBRS s belief that EPI has passed the point of maximum risk with respect to deterioration of its credit metrics as a result of its multi-year capex program, and is on track to substantially improve its key credit metrics from current levels during In addition, DBRS expects the Company to further improve its key credit metrics in 2011 and maintain these levels going forward in order to remain at the current long-term debt rating. (Continued on page 2.) Rating Considerations Strengths (1) Low-cost crude oil pipeline from western Canada to U.S. Midwest (PADD II) (2) Growing Western Canada Sedimentary Basin (WCSB) shipments to PADD II (Chicago) (3) Expansion projects enhance future earnings (4) Incentive regulation provides stability and earnings upside Financial Information Attachment 1 to IOL-Enbridge 131(a) Challenges (1) Expansions pressuring credit profile (2) High financing requirements (3) Competitive pressures from other pipelines (4) Incentive tolling settlement extension to be negotiated Consolidated (audited) Mainline (unaudited) Enbridge Pipelines Inc. 9 mos. ended Sept mos. ended For years ended December 31 For years ended December 31 (CAD millions where applicable) Sept. 30, Net income (before extras.) Cash flow (before extras.) Return on common equity (1) 12.9% 12.4% 13.5% 11.3% 12.6% 12.9% 15.0% 17.9% 17.7% Total debt in capital structure 65.5% 61.8% 65.5% 62.8% 56.1% 53.3% 55.6% 52.4% 54.2% Adj. total debt in capital structure (2) 59.9% 57.5% 59.9% 56.4% n/a n/a n/a n/a n/a Cash flow/total debt 9.0% 9.6% 8.7% 7.8% 12.9% 15.8% 16.1% 25.3% 26.6% Adj. cash flow/total debt (2) 11.1% 11.5% 10.8% 10.2% n/a n/a n/a n/a n/a (Cash flow divs.)/net capex EBIT interest coverage (times) Adj. EBIT interest coverage (times) (2) n/a n/a n/a n/a n/a EBITDA interest coverage (times) Mainline shipments (thousands of b/d) 2,101 2,002 2,030 2,005 2,013 2,030 2,005 2,013 (1) DBRS-adjusted for dividends paid to parent. (2) Consolidated ratios include inter-company debt, exclude Southern Lights project debt. n/a = not applicable. 1 Corporates: Energy
3 Attachment 1 to IOL-Enbridge 131(a) Enbridge Pipelines Inc. November 27, 2009 Rating Update (Continued from page 1.) While EPI s credit ratios are being pressured as a result of the Company s large capex program (expected to approximate $1.7 billion in 2009 to 2010, including $0.6 billion remaining to be spent on Alberta Clipper Canada as at September 30, 2009), DBRS believes that EPI is on track to substantially restore its key Mainline credit metrics during the second half of 2010 (H2 2010) (including its cash flow-to-debt ratio to the low-20% range and EBIT interest coverage ratio to the mid-three times range compared with the 10% to 15% range and the low-to-mid-three times range expected in 2009). Placement of large capacity expansion projects into service, including the Line 4 Extension on April 1, 2009, and the Canadian portion of the Alberta Clipper Pipeline project (Alberta Clipper Canada) in mid-2010, provide earnings and cash flow to restore the Company s credit metrics. Note that DBRS s analysis of EPI is focused on the Mainline financial statements, which exclude inter-company transactions and investments from the consolidated financial statements. The Mainline operations support all of EPI s direct external debt. The Company s exposure to rising funding requirements as a result of a large capex portfolio and potential cost overruns is significantly diminished relative to one year ago. While the Company s project economics are largely protected from cost overruns, EPI is exposed to the potential requirement to raise additional funding should cost overruns occur. DBRS notes that the Company has not announced any cost overruns with respect to its major projects over the past two years. Capex is expected to total approximately $1.6 billion in 2009, primarily for construction on the Line 4 Extension (placed in service on April 1, 2009) and Alberta Clipper Canada (expected to be in service in mid-2010) and for maintenance capital. The resulting cash flow deficits will be financed with a combination of external debt and equity. EPI has maintained adequate liquidity, with approximately $675 million available under unused credit facilities on a direct basis at September 30, On November 6, 2009, EPI issued $500 million of medium-term notes, the proceeds of which were used to reduce short-term debt, thereby improving its liquidity position and debt maturity profile. The Company s maturities (including $250 million in Q4 2012) are manageable. DBRS believes that recent improvements in capital markets conditions should allow the Company to continue to raise debt at economical interest rates. From a business risk perspective, EPI benefits from strong demand for western Canada sedimentary basin (WCSB) crude oil in the U.S. Midwest (PADD II), supported by increasing crude oil production, rising pipeline throughput and the cost-of-service tolling methodology. Each of these factors contributes to earnings and cash flow stability. Further, EPI and Enbridge Inc. are exploring additional projects (e.g., Woodland and Fort Hills currently on hold) to further increase access to U.S. markets for WCSB crude oil beyond The recently completed Line 4 Extension as well as the Alberta Clipper Canada project will be regulated under long-term cost-of-service tolling methodologies, protecting EPI against volume risk, most capital cost overruns, property taxes and power costs. The Company s Incentive Tolling Settlement (ITS), which applies to the older system, (see the Regulation section of this report), has reduced regulatory uncertainty and protects EPI from volume risk. DBRS notes that expiry of the ITS in December 2009 exposes the Company to potential risks with respect to the final negotiated terms of the ITS expansion. Approval of unfavourable terms could have a potentially negative impact on the Company s credit metrics, although, based on previously negotiated settlements, DBRS does not expect this to be a material issue. 2 Corporates: Energy
4 Attachment 1 to IOL-Enbridge 131(a) Enbridge Pipelines Inc. November 27, 2009 Rating Considerations Details Strengths (1) EPI owns and operates the Canadian portion of the largest low-cost crude oil pipeline from the WCSB to major Canadian and PADD II markets. Given favourable market conditions, PADD II is likely to remain the preferred market (generating the highest netbacks) for WCSB producers versus PADD IV (U.S. Rocky Mountains) or PADD V (U.S. Pacific Northwest). (2) Long-term supply/demand trends favour the growing importance of WCSB crude oil shipments into PADD II, resulting in significant pipeline expansion opportunities and ensuring a long life of supply for the pipeline. Crude oil production is declining in PADD II, although most supply needs are met through imports, while regional demand is increasing. PADD II is the largest North American processor of WCSB heavy crude oil and has been converting its refining capacity from light to heavy crude oil. WCSB crude oil is increasingly required in order to meet PADD II refinery demand. (3) Placement of large capacity expansion projects, including the Line 4 Extension on April 1, 2009 and Alberta Clipper Canada in mid-2010, provide earnings growth potential over the near- to medium-term. EPI and Enbridge Inc. are exploring additional projects (e.g., Fort Hills and Woodland) to further increase access to U.S. markets for WCSB crude oil beyond (4) The Company s Incentive Tolling Settlement (ITS), which applies to the older system (see the Regulation section of this report), has reduced regulatory uncertainty and protects EPI from volume risk. The ITS also provides the Company with the opportunity to enhance earnings by permitting it to retain at least half of any cost savings generated above specified cost targets, as well as benefiting from exceeding baseline performance on batch quality, delivery predictability and capacity reliability metrics. Challenges (1) EPI s credit ratios are being pressured as a result of the Company s large capex program (expected to be approximately $1.7 billion in 2009 to 2010, including $0.6 billion remaining to be spent on Alberta Clipper Canada as at September 30, 2009). The vast majority of the remaining amount is expected to be spent in Q through mid This is expected to have a negative impact on credit metrics during the construction period to mid-2010 as the projects will only begin generating earnings and cash flow upon being placed in service on April 1, 2009 (the Line 4 Extension) and mid-2010 (Alberta Clipper Canada). DBRS believes that EPI is on track to substantially restore its key Mainline credit metrics during H (including its cash flow-to-debt ratio to the low 20% range and EBIT interest coverage ratio to the mid-three times range compared with the 10% to 15% range and the low-to-mid-three times range expected in 2009). (2) While the Company s project economics are largely protected from cost overruns, EPI is exposed to the requirement to raise additional funding should cost overruns occur. DBRS notes that the Company has not announced any cost overruns with respect to its major projects over the past two years. Capex is expected to total approximately $1.6 billion in 2009, primarily for construction on the Line 4 Extension (placed in service on April 1, 2009) and Alberta Clipper Canada (expected to be in service in mid-2010) and for maintenance capital. The resulting cash flow deficits will be financed with a combination of external debt and equity. EPI has maintained adequate liquidity, with approximately $675 million available under unused credit facilities on a direct basis at September 30, The Company s maturities (including $250 million in Q4 2012) are manageable. While significant new issuance is expected in 2010, the Company s ability to issue debt at favourable rates was demonstrated by its $500 million of MTN issuance on November 6, 2009, which improved its liquidity position. DBRS believes that recent improvements in capital markets conditions should allow the Company to continue to raise debt at economical interest rates. (3) The Enbridge/Lakehead System is subject to competitive pressures from other pipelines originating in the WCSB and from alternative supply pipelines into areas served by the Enbridge/Lakehead System. Key competitors include the following: (a) Express Pipeline (Express) owns and operates a 280,000 b/d capacity pipeline from the WCSB to PADD IV. Express is connected to the 150,000 b/d capacity Platte Pipeline (Platte), serving the Patoka and Wood River market in PADD II in Illinois, south of Chicago. While 3 Corporates: Energy
5 Attachment 1 to IOL-Enbridge 131(a) Enbridge Pipelines Inc. November 27, 2009 representing competition, Express and Platte have much lower throughput capacity compared with the markets served by Enbridge/Lakehead System. (b) TransCanada PipeLines Limited s (TCPL) Keystone Pipeline (Base Keystone) and Keystone Gulf Coast Expansion Project (Keystone XL), will have design capacity of 1.1 million b/d when completed and will extend from Hardisty to U.S. Midwest markets at Wood River and Patoka and to Cushing, Oklahoma (Phase 1). Base Keystone start-up is expected in early 2010, with an initial nominal capacity of 435,000 b/d, and will be expanded to 590,000 b/d in late Phase 2, or Keystone XL, will further extend to the U.S. Gulf Coast for start-up in While Keystone represents competition to the future expansion plans of Enbridge and EEP, their current expansion projects (Southern Access and Alberta Clipper) are very competitive given their long-term contracts, cost-of-service and rolledin tolling methodology. (c) Kinder Morgan Canada Inc. owns Trans Mountain Pipeline, a liquids pipeline from Edmonton to Canada s west coast, serving refineries in Vancouver and Washington state. Its current capacity is 300,000 b/d. While representing competition, Trans Mountain Pipeline has much lower throughput capacity compared with the markets served by Enbridge/Lakehead System. (4) Expiry of the ITS in December 2009 exposes the Company to potential risks with respect to the final negotiated terms of the ITS expansion. Approval of unfavourable terms could have a potentially negative impact on the Company s credit metrics, although, based on previously negotiated settlements, DBRS does not expect this to be a material issue. Adjustments from Consolidated to Mainline Financial Statements EPI is both a holding company and an operating company, consisting of the following: Operations of the Canadian oil pipeline system (Edmonton to the Manitoba-U.S border), including Line 9 (Montréal to the Ontario-U.S. border), referred to as the Enbridge System, or Mainline. Investments in various entities and advances to (and from) various related parties, as noted below. DBRS s analysis of EPI is focused on Mainline financial statements, which exclude intercompany transactions and investments from the consolidated financial statements. Mainline operations support all of EPI s direct external debt. The consolidated financial statements were adjusted to remove the following items in order to derive the Mainline financial statements as of December 31, 2008: A $1,160 million investment in preferred shares of Enbridge Energy Distribution Inc. (EEDI), direct owner of Enbridge Gas Distribution Inc. (see separate DBRS report). $1,263 million in loans to affiliated companies. Indirect ownership of a $2,014 million investment (including $573 million minority interest), representing a 27% ownership interest in publicly-traded EEP (see separate DBRS report published November 24, 2008). Indirect ownership of a 78% interest in Frontier Pipeline System. Indirect ownership of Spearhead Pipeline. Indirect ownership of a 65% interest in Olympic Pipeline. Indirect ownership of the Southern Lights Pipeline project. $2,594 million in loans from affiliated companies. Total dividends and interest income from affiliates exceeds total interest expense paid to affiliates. See the Consolidated Financial Profile section of this report for additional details. 4 Corporates: Energy
6 Attachment 1 to IOL-Enbridge 131(a) Enbridge Pipelines Inc. November 27, 2009 Earnings and Outlook Enbridge Pipelines Inc. - Mainline Components of Net Income: For the year ended December 31 (CAD millions) 2008 (%) (%) Regulated earnings base n/a n/a n/a n/a n/a % Cost sharing with shippers/power guarantee n/a n/a n/a n/a n/a % Subtotal - ITS core system earnings (1) 41.6% % Non-routine adjustments 4.5% % Terrace 41.0% % AEDC (excluding Line 9 and Terrace) 7.4% % Line 9 0.5% % Line 8 OPTS 0.1% % Southern Access 3.9% % Non-regulated expenses and other 1.0% (4.9) -3.0% Net income - Mainline 100.0% % Net income (excluding Terrace) Mainline shipments (thousands of b/d) 2,030 2,005 2,013 1,872 2,001 1,864 Net income - consolidated Net income: Mainline/consolidated 59.6% 62.2% 67.3% 69.9% 72.3% 72.6% (1) ITS core system earnings includes cost performance earnings, performance metrics earnings, the impact of mainline integrity and the power guarantee. AEDC = allowance for equity funds used during construction. n/a = not applicable. Mainline net income rose by $9.0 million (up 4.4%) in 2008 compared with 2007 due to increased tolls from a higher rate base as a result of Southern Access Mainline Expansion entering service on March 31, 2008, and increased recognition of allowance for equity funds used during construction (AEDC) while the project was under construction. Net income rose $56.6 million (up 39%) to $203.6 million in 9M 2009 (not shown in the above table). Approximately $39.2 million of the increase was due to increased recognition of AEDC on Alberta Clipper Canada and Line 4 until they were placed in service in April Earnings also benefitted from increased tolls resulting from the higher rate base due to Line 4, partly offset by higher operating and leak remediation costs. Outlook Net income is expected to rise significantly in 2009 and 2010 following completion of the $0.3 billion Line 4 Extension on April 1, 2009 and the $2.4 billion Alberta Clipper Canada in mid-2010 (see the Major Growth Projects section of this report for further details). Ongoing operational earnings, expected on a full-year basis in 2011, are expected to be significantly higher than in Mainline has a large capex program of approximately $1.7 billion over the 2009 to 2010 period. Of this amount, approximately $0.6 billion remains to be spent on Alberta Clipper Canada as at September 30, The vast majority of the remaining amount is expected to be spent in Q through mid-2010, with reported earnings in those periods supported by the capitalization of interest expense and recognition of AEDC, although not adding to cash flow until placed in service. 5 Corporates: Energy
7 Attachment 1 to IOL-Enbridge 131(a) Enbridge Pipelines Inc. November 27, 2009 Financial Profile - Mainline Enbridge Pipelines Inc. Mainline For years ended December 31st (CAD millions) (unaudited) Net income before extraordinary items Depreciation and amortization Other (including AEDC) (17.8) (0.1) (18.2) Operating Cash Flow Capital expenditures (1,313.0) (306.8) (99.6) (67.6) (56.3) (83.0) (182.9) Working capital changes (274.7) 22.6 (25.1) 81.6 Free cash flow before common dividends (896.5) (66.5) Dividends paid to parent (211.5) (200.0) (275.4) (50.0) (235.3) (152.9) (80.1) Gross Free Cash Flow (1,108.0) (179.7) (116.5) Other investing activities 0.0 (2.9) 11.6 (13.4) (10.4) Net Free Cash Flow (1,108.0) (182.6) (129.9) (3.7) Increase (dec.) in net external debt (104.6) (78.6) Increase (dec.) in affiliate debt financing (250.0) Increase (dec.) in common shares Funding Sources 1, (126.3) (4.6) (29.6) Total debt and equivalents 1, , , , , , ,131.3 Total equity and equivalents 1, , , Total debt and equivalents/capital 55.6% 52.4% 54.2% 55.0% 55.2% 53.5% 53.7% Cash flow/total debt and eq. 16.1% 25.3% 26.6% 21.7% 24.3% 23.5% 18.7% EBIT interest coverage (times) Summary EPI targets Mainline s overall capital structure at 55% debt/45% equity. Capex during 2008 exceeded $1.3 billion, based on construction on the Canadian portions of Southern Access and Alberta Clipper and of Line 4 Extension and on maintenance capex. The total debt-to-capital ratio of 55.6% at year-end 2008 was slightly above the 55% target after the Company received a net $417 million equity injection from Enbridge Inc. Despite a significant decline, EPI s cash flow-to-debt and interest coverage ratios remained strong in 2008 relative to its peers, mainly due to good ongoing profitability under the 2005 ITS. Outlook Mainline has a large capex program of approximately $1.7 billion over the 2009 to 2010 period. Of this amount, approximately $0.6 billion remained to be spent on Alberta Clipper Canada as at September 30, The vast majority of the remaining amount is expected to be spent in Q through mid Capex is expected to total approximately $1.6 billion in 2009, primarily for construction on the Line 4 Extension (placed in service on April 1, 2009) and Alberta Clipper Canada (expected to be in service in mid- 2010) and for maintenance capital. This is expected to have a negative impact on credit metrics during the construction period to mid-2010 as the projects will only begin generating earnings and cash flow upon being placed into service. The resulting cash flow deficits will be financed with a combination of external debt and equity. DBRS believes that EPI is on track to substantially restore its key Mainline credit metrics in H (including cash flow-to-debt ratio to the low 20% range and EBIT interest coverage ratio to the mid-three times range compared with the 10% to 15% range and low-to-mid-three times range expected in 2009). DBRS notes that the Company has not announced any cost overruns with respect to its major projects over the past two years. 6 Corporates: Energy
8 Attachment 1 to IOL-Enbridge 131(a) Enbridge Pipelines Inc. November 27, 2009 Consolidated Financial Profile As explained in the Adjustments from Consolidated to Mainline Financial Statements section, EPI is both a holding company and an operating company, consisting of (1) operations of the Canadian oil pipeline system (i.e., the Enbridge System, or Mainline) and (2) investments in several entities and advances to (and from) various related parties. On a consolidated basis (excluding Southern Lights non-recourse financing), EPI s September 30, 2009, credit ratios were weaker than in previous periods, which was as expected given the large growth capex program noted throughout this report. The adjusted consolidated debt-to-capital ratio rose to 60% at September 30, 2009, up from 56% at year-end 2008, as a result of higher inter-company and external debt. However, the majority of this debt was in the form of subordinated intercompany loans. The adjusted consolidated cash flow-to-debt ratio declined to 11.1% for the nine months ending September 30, 2009 (9M 2009) compared with 11.5% in 9M 2008, largely due to higher external and intercompany debt. Similarly, the adjusted consolidated EBIT interest coverage ratio fell to 2.3 times in 9M 2009 from 2.7 times in 9M 2008 due to lower operating income and higher interest expense. Intercompany loans, partly driven by income tax considerations, tend to depress consolidated credit ratios relative to Mainline s credit ratios. All of EPI s direct external debt is supported by the Mainline operations. The tables on the next page exclude the Southern Lights non-recourse debt held at a subsidiary of EPI. The external debt shown under Other Investments in the tables is mainly subsidiary debt in EECI, which is non-recourse to EPI. The tables show how investments (other than Mainline) are financed, given that Mainline is reasonably capitalized near 55% debt and 45% equity. During 2008 and 2009, in order to maintain the Mainline debt-tocapital ratio near the current level of 55%, EPI received significant equity injections from Enbridge Inc. The debt-to-capital ratio of Other Investments increased to 57% at year-end 2008 from 53% at year-end 2006, largely reflecting the increase in intercompany loans. Other Investments, where the majority of EPI s consolidated equity base is allocated, includes the investments and intercompany advances and receivables noted in the Adjustments from Consolidated to Mainline Financial Statements section of this report. 7 Corporates: Energy
9 Attachment 1 to IOL-Enbridge 131(a) Enbridge Pipelines Inc. November 27, 2009 Enbridge Pipelines Inc. Capital Structure at December 31, 2008 (CAD millions) (A) (B) (C) (A) = (B) + (C) Consolidated Consolidated Mainline Other Investments Sept. 30, 2009 Dec. 31, 2008 Dec. 31, 2008 Dec. 31, 2008 Short-term debt 0.0 0% 0.0 0% % (125.7) -3% Long-term debt 1, % 1, % 1, % % External Debt 1, % 1, % 1, % (35.7) -1% Inter-company debt 3, % 2, % % 2, % Total Debt 5, % 4, % 1, % 2, % Common Equity 3, % 3, % 1, % 1, % Adj. total capital 8, % 7, % 3, % 4, % Adj. total debt/capital (DBRS-adjusted) 59.9% 56.4% 55.6% Adj. cash flow/total debt & equivalents 11.1% 10.2% 16.1% Adj. EBIT interest coverage ratio (times) Note: All amounts and ratios exclude Southern Lights non-recourse debt but include inter-company subordinated debt. Enbridge Pipelines Inc. Capital Structure at December 31, 2007 (CAD millions) (A) (B) (C) (A) = (B) + (C) Consolidated Consolidated Mainline Other Investments Sept. 30, 2008 Dec. 31, 2007 Dec. 31, 2007 Dec. 31, 2007 Short-term debt % 0.0 0% % (140.4) -4% Long-term debt % 1, % 1, % % External Debt 1, % 1, % 1, % % Inter-company debt 2, % 1, % % 1, % Total Debt 3, % 3, % 1, % 2, % Common Equity 2, % 2, % 1, % 1, % Adj. total capital 6, % 6, % 2, % 3, % Adj. total debt/capital (DBRS-adjusted) 57.5% 56.1% 52.4% Adj. cash flow/total debt & equivalents 11.5% 12.9% 25.3% Adj. EBIT interest coverage ratio (times) Enbridge Pipelines Inc. Capital Structure at December 31, 2006 (CAD millions) (A) (B) (C) (A) = (B) + (C) Consolidated Mainline Other Investments Dec. 31, 2006 Dec. 31, 2006 Dec. 31, 2006 Short-term debt % % 0.0 0% Long-term debt 1, % 1, % % External Debt 1, % 1, % % Inter-company debt 1, % 5.8 0% 1, % Total Debt 2, % 1, % 1, % Common Equity 2, % % 1, % Adj. total capital 4, % 2, % 2, % Adj. total debt/capital (DBRS-adjusted) 53.3% 54.2% Adj. cash flow/total debt & equivalents 15.8% 26.6% Adj. EBIT interest coverage ratio (times) Bank Lines EPI has a $300 million commercial paper program that is fully backstopped by a $300 million 364-day revolving committed credit facility. The facility, which is extendible with approval of the lenders, comes up for renewal in February 2010 and has an available term-out option to May The Company also has a $1.0 billion three-year revolving credit facility, maturing in January 2011, which is available to fund construction of its organic growth projects. EPI has maintained adequate liquidity, with $675 million of availability under its $1.3 billion of direct credit facilities as at September 30, 2009, subsequently increased with the $500 million of medium-term notes issuance on November 6, Corporates: Energy
10 Attachment 1 to IOL-Enbridge 131(a) Enbridge Pipelines Inc. November 27, 2009 Debt Maturities ($ millions) (As at September 30, 2009) Direct external long-term debt (1) % of long-term debt 7.5% 19% 23% 7.5% 15% 3% 25% (1) Excludes amounts due under the Company s CP program and credit facilities. Excludes recent $500 million debt issues noted below. Debt maturities are well spread out. EPI s senior debt cannot exceed 75% of total capital and the sum of its senior and subordinated debt cannot exceed 85% of its total capital under the credit facility covenants (31.8% and 65.5%, respectively, at September 30, 2009). On November 6, 2009, EPI issued $300 million of 4.49% medium-term notes maturing November 12, 2019 and $200 million of 5.35% medium-term notes maturing November 10, Net proceeds from the issue were used for general corporate purposes, which included repayment of outstanding indebtedness, financing capital expenditures, investments and working capital requirements of EPI. Regulation Mainline is regulated by the National Energy Board (NEB). Effective January 1, 1995, Enbridge negotiated an Incentive Tolling System (ITS) with the Canadian Association of Petroleum Producers (CAPP), replacing the previous cost-of-service tolling methodology. In June 2005, Enbridge negotiated an extension of the ITS (the 2005 ITS) to cover the period, with a modest amount of re-basing. The 2005 ITS applies to the older portion of Mainline, which accounted for $88 million (42%) of Mainline s 2008 earnings. The ITS has reduced regulatory uncertainty and protects EPI from volume risk. The ITS also provides the Company with the opportunity to enhance earnings by permitting it to retain at least half of any cost savings generated above specified cost targets, as well as benefiting by exceeding baseline performance on batch quality, delivery predictability and capacity reliability metrics. Under the 2005 ITS, the ability to achieve earnings above the NEB s 2009 multi-pipeline rate of return of 8.54% (8.75% in 2008) is based on the Company s ability to achieve cost savings and improve operating efficiency measured by a variety of new metrics. Key features of the 2005 ITS include the following: Mainline continues to be protected from volume risk as the earnings impact of volume variances below specific capacity thresholds is reimbursed by shippers. Growth in WCSB oil sands and heavy oil production should ensure that volume variances are not an issue. Tolls are determined based on a starting point revenue requirement, adjusted for 50% of the change in the Gross Domestic Product Implicit Price Index. This resulted in a $57.9 million earnings base. All cost savings (excluding power and pipeline integrity costs) are shared equally by EPI and the shippers. An annual $18.2 million pipeline integrity allowance is provided to EPI, which assumed full responsibility for pipeline integrity maintenance. Cost increases due to non-routine factors (e.g., changes in environmental regulations and new services requested by shippers) are recoverable in Mainline tolls. Batch quality and delivery predictability metrics provide EPI with a bonus/penalty structure at +/-$20 million (after tax) in Capacity reliability metrics also provide EPI with a bonus/penalty structure. The maximum penalty is capped at $10 million per year and the maximum benefit is capped at $12 million per year. Enbridge achieved total metric bonuses of approximately $15 million in 2008 compared with $11 million in 2007 and $10 million in Enbridge/Lakehead s Tariff Agreement (the Agreement) with shippers with respect to recent and ongoing pipeline expansions also provides downside protection and incentives: 9 Corporates: Energy
11 Attachment 1 to IOL-Enbridge 131(a) Enbridge Pipelines Inc. November 27, 2009 (1) With respect to the System Expansion Program (SEP) II expansion (which added 100,000 b/d to capacity in 1998), the Agreement provides for the following terms until 2013: A cost-of-service tariff structure. An allowed ROE based on throughput levels. A guaranteed minimum ROE of 7.5% if utilization is 50% or less. NEB multi-pipeline ROE plus 3%, with 100% capacity utilization, subject to a capped ROE of 15%. During 2008, Enbridge and EEP earned an ROE of 11.71% ( %; %) on SEP II. (2) With respect to the Terrace capacity expansions (Phase I added 170,000 b/d in January 1999; Phase II added 40,000 b/d to Enbridge System capacity in early 2002; and Phase III added 140,000 b/d in mid-2003), the Agreement provides for a fixed toll surcharge of $0.05 per barrel to move light crude oil from Edmonton to Chicago. The amount allocated to EEP is currently US$0.007 per barrel. Effective April 1, 2010, the surcharge rises to US$0.013 per barrel through 2013, the term of the Agreement. In addition, an adjustment is made to the Terrace surcharge based on the annual actual average pumping exiting Clearbrook, Minnesota. (3) With respect to Southern Access and the Line 4 Extension, tolls were increased to reflect the fact that these projects were placed into service on April 1, The average toll for crude oil movements from the Canadian border to Chicago increased by US$0.15 to US$1.41 per barrel effective April 1, 2009, and to US$1.46 effective July 1, While a substantial increase, the toll remains very competitive and very low (about 2%) relative to the current West Texas Intermediate (WTI) price of crude oil. Major Growth Projects EPI and Enbridge Inc. are exploring additional projects (e.g., Fort Hills and Woodland) to further increase access to U.S. markets for WCSB crude oil beyond Following are the major pipeline projects with EPI s participation: (1) Southern Access Mainline Expansion (placed in-service on April 1, 2009) Undertaken by EPI in Canada and EEP in the United States, the Southern Access Mainline Expansion is expected to add 400,000 b/d of incremental heavy crude oil capacity from Hardisty to Flanagan, Illinois. In combination with the Alberta Clipper Project (see below), the 42-inch diameter pipeline allows capacity to be tripled by adding pump stations for minimal additional cost, bringing the total incremental capacity potential to 1.2 million b/d over current capacity. Components of the Southern Access Mainline Expansion are as follows: (a) In Canada, the Enbridge System (between Hardisty and the Canada-U.S. border) was expanded, with the project placed into service on April 1, 2008, for a total cost of $0.2 billion. (b) In the United States, the Lakehead System (between the Canada-U.S. border and Flanagan, including the reversal of capacity from Flanagan to Chicago) was expanded in two phases, for a total cost of US$2.1 billion. The first phase was placed into service on April 1, 2008, adding 190,000 b/d of incremental capacity. The second phase was placed into service on April 1, 2009, adding 210,000 b/d of incremental capacity. Under the rate-setting methodology (see below), 88% of the capital cost (approximately US$1.85 billion) was added to the rate base, with the remaining 12% (approximately US$0.25 billion) on EEP s account due to its decision to install larger-than-required pipe in anticipation of future expansion opportunities. The U.S. Federal Energy Regulatory Commission (FERC) approved the 30-year cost-of-service tolling agreement, protecting EEP against volume risk, capital cost overruns, property taxes and power costs. The agreement results in a 9% real ROE, with an annual inflation adjustment added to the rate base and collected over time and allowing for collection of FERC s income tax allowance. The U.S. tolling principles include a 45% debt/55% equity capital structure (55% debt/45% equity in Canada). 10 Corporates: Energy
12 Attachment 1 to IOL-Enbridge 131(a) Enbridge Pipelines Inc. November 27, 2009 (2) Line 4 Extension Project (placed in-service on April 1, 2009) Undertaken by EPI in Canada, the Line 4 Extension de-bottlenecking project involved construction of an 880,000 b/d intra-alberta crude oil pipeline between Edmonton and Hardisty, for a total cost of $0.3 billion. The project was placed into service on April 1, The tolling principles are similar to those of the Canadian portion of the Alberta Clipper Project, which are described below. (3) Alberta Clipper Project (completion expected in mid-2010) Undertaken by EPI in Canada and EEP in the United States, Alberta Clipper entails construction of a new 36- inch diameter pipeline on an existing right of way to add 450,000 b/d of heavy crude oil capacity from Hardisty to Superior, Wisconsin (where it connects with Southern Access). The 36-inch diameter pipeline allows capacity to be increased by adding pump stations for minimal additional cost, bringing the total incremental capacity potential to 800,000 b/d over current capacity, with corresponding expansion of Southern Access. Components of the Alberta Clipper Project are as follows: (a) In Canada, EPI continues pipeline construction (between Hardisty and the Canada-U.S. border), which has an estimated cost of $2.4 billion (including AEDC; $1.8 billion spent through September 30, 2009). (b) In the United States, EEP began construction in August 2009 on the new pipeline (between the Canada- U.S. border and Superior), which has an estimated cost of US$1.2 billion (US$0.5 billion spent through September 30, 2009). Enbridge Inc. has committed to fund two-thirds of Alberta Clipper U.S. with the balance to be funded by EEP. Under the rate-setting methodology (see below), Enbridge Inc. and EEP share in the risk of capital cost overruns by having a portion included in the rate base. U.S. tolling principles are similar to the agreed Canadian tolling principles (i.e., a renewable 15-year cost-ofservice tolling agreement protecting Enbridge and EEP against volume risk, sharing of capital cost overrun risk, indexed cost recovery and a floating ROE equal to the NEB s multi-pipeline rate plus 2.25%). The U.S. tolling principles will include a 45% debt/55% equity capital structure (55% debt/45% equity in Canada). 11 Corporates: Energy
13 Attachment 1 to IOL-Enbridge 131(a) Enbridge Pipelines Inc. November 27, 2009 Enbridge Pipelines Inc. (Mainline) Balance Sheet (CAD millions) Dec. 31 Dec. 31 Dec. 31 Dec. 31 Dec. 31 Dec. 31 Assets Liabilities and Equity Cash and equivalents Short-term debt Accounts receivable & other A/P and accrued liab Current Assets Loan from Affiliate Net fixed assets 3, , ,954.5 Current Liabilities Deferred charges & other Long-term debt 1, , ,024.4 Loan from Affiliate Total 3, , ,179.7 Common equity 1, , Total 3, , ,179.6 Balance Sheet and For the year ended December 31 Liquidity Ratios Current ratio Total debt in capital structure 55.6% 52.4% 54.2% 55.0% 55.2% 53.5% 53.7% Net debt in capital structure 55.6% 52.4% 54.2% 54.8% 55.2% 53.4% 53.7% Common equity in capital structure 44.4% 47.6% 45.8% 45.0% 44.8% 46.5% 46.3% Cash flow/total debt (1) 16.1% 25.3% 26.6% 21.7% 24.3% 23.5% 18.7% (Cash flow-divs.)/net capex (1) Common dividend payout (before extras.) 100.0% 98.8% 136.1% 29.4% 137.2% 94.4% 64.8% Accum. dep'n/gross fixed assets 34.4% 44.8% 45.8% 43.9% 42.0% 40.0% 39.0% Coverage Ratios (2) EBIT interest coverage (times) EBITDA interest coverage (times) Fixed-charges coverage (times) Profitability Ratios Operating margin 43.4% 48.7% 49.5% 47.3% 48.9% 48.7% 43.3% Profit margin (before extras.) 27.6% 26.6% 26.9% 25.1% 25.3% 26.0% 21.5% Return on common equity (3) 15.0% 17.9% 17.7% 16.9% 16.0% 15.3% 12.5% Return on capital (3) 8.8% 10.7% 10.5% 9.9% 10.0% 9.7% 8.0% Income Statement Mainline Revenues Operating, maintenance and other (323.6) (288.4) (277.8) (251.1) (241.4) (219.7) (221.3) EBITDA Depreciation and amortization (110.0) (101.7) (102.0) (105.7) (104.2) (99.9) (105.5) Operating income Interest expense, net (70.9) (67.4) (68.9) (74.3) (76.7) (78.6) (79.3) Other income (expense), net Net income before taxes Income taxes (68.6) (103.7) (102.8) (77.7) (84.6) (66.9) (53.8) Net income (before extras.) Cash flow Capital expenditures (1,313.0) (306.8) (99.6) (67.6) (56.3) (83.0) (182.9) Working capital changes (274.7) 22.6 (25.1) 81.6 Free cash flow before dividends to parent (896.5) (66.5) Dividends paid to parent (211.5) (200.0) (275.4) (50.0) (235.3) (152.9) (80.1) Gross free cash flow (1,108.0) (179.7) (116.5) Other investing activities 0.0 (2.9) 11.6 (13.4) (10.4) Net free cash flow (1,108.0) (182.6) (129.9) (3.7) Operating Statistics Mainline shipments (thousands of b/d) 2,030 2,005 2,013 1,872 2,001 1,864 1,786 Barrel miles (billions) (1) Capital expenditures excluding acquisitions and capitalized interest. (2) Excludes AEDC, capitalized interest, debt amortizations and equity earnings. (3) DBRS-adjusted for dividends paid to parent. 12 Corporates: Energy
14 Attachment 1 to IOL-Enbridge 131(a) Enbridge Pipelines Inc. November 27, 2009 Enbridge Pipelines Inc. (Consolidated*) Balance Sheet (CAD millions) Sept. 30 Dec. 31 Dec. 31 Sept. 30 Dec. 31 Dec. 31 Assets: Liabilities & Equity: Cash and equivalents Short-term debt Accounts receivable & other A/P and accrued liab Loans to affiliates Loans from affiliates 1, Current Assets ,196.2 L.t.d. due in one year Inv. in pref. shares of affiliate , ,110.0 Current Liabilities 2, , Long term investments 1, , Long-term debt 1, , ,535.1 Net fixed assets 7, , ,308.3 L.t.d. - Southern Lights 1, , Loans to affiliated companies Loans from affiliates 1, , ,298.5 Goodwill Deferred credits Deferred charges & other Minority interest (EEQ) Total 11, , ,022.6 Common equity 3, , ,656.3 Total 11, , ,022.6 Balance Sheet & 9 mos. ended Sept mos. ended For the year ended December 31 Liquidity Ratios (1) Sept. 30, Current ratio External debt in capital structure 19.0% 17.0% 19.0% 19.8% 25.4% 26.3% 27.0% 29.8% Total debt in capital structure 65.5% 61.8% 65.5% 62.8% 56.1% 53.3% 52.3% 55.4% Net debt in capital structure 65.2% 61.8% 65.2% 62.7% 55.5% 52.6% 52.1% 55.3% Common equity in capital structure 34.5% 38.2% 34.5% 37.2% 43.9% 46.7% 47.7% 44.6% Adj. total debt in capital structure (5) 59.9% 57.5% 59.9% 56.4% n/a n/a n/a n/a Cash flow/total debt 9.0% 9.6% 8.7% 7.8% 12.9% 15.8% 16.0% 14.0% Adj. cash flow/total debt (5) 11.1% 11.5% 10.8% 10.2% n/a n/a n/a n/a (Cash flow-divs.)/net capex (2) Common dividend payout 52.6% 58.0% 52.5% 56.4% 61.5% 99.8% 102.9% 65.6% Accum. dep'n/gross fixed assets n.a. n.a. n.a. 24.0% 34.3% 39.3% 41.3% 40.9% Loans to/investments in affiliates 1, , , , , , , ,874.0 Loans from/invest. by affiliates 3, , , , , , , ,071.8 Net loans to/inv. in affiliates (1,299.5) (180.4) (1,299.5) (220.9) Coverage Ratios (3) EBIT interest coverage (times) EBITDA interest coverage (times) Fixed-charges coverage (times) Adj. EBIT interest coverage (times) (5) n/a n/a n/a n/a Profitability Ratios Operating margin 36.9% 40.2% 38.5% 41.0% 45.8% 46.8% 45.2% 44.3% Profit margin (before extras.) 46.4% 40.9% 44.2% 40.0% 37.1% 35.3% 35.0% 34.1% Return on common equity (4) 12.9% 12.4% 13.5% 11.3% 12.6% 12.9% 11.6% 12.5% Return on capital (4) 6.3% 6.8% 6.8% 6.2% 7.9% 8.3% 7.7% 8.3% Selected Data ($ millions) Revenues Operating income Net income (before extras.) Reported earnings (after pfd. share divs.) Cash flow Capital expenditures (1,698.1) (1,236.2) (2,834.8) (2,372.9) (867.6) (318.4) (195.7) (66.8) Additions to equity investments (24.1) (543.6) (719.2) (505.7) (228.6) (5.9) (277.7) Working capital changes 79.7 (47.4) (62.7) (46.6) Free cash flow before dividends to parent (1,020.5) (985.9) (2,656.2) (2,621.6) (901.6) (102.0) 99.0 (66.3) Dividends paid to parent (180.0) (150.0) (230.0) (200.0) (200.0) (300.0) (250.5) (155.7) Gross free cash flow (1,200.5) (1,135.9) (2,886.2) (2,821.6) (1,101.6) (402.0) (151.5) (222.0) Other investing activities (92.6) (1.4) (73.0) Net free cash flow (1,104.2) (1,077.8) (2,727.3) (2,700.9) (1,068.4) (494.6) (152.9) (295.0) Operating Statistics Mainline shipments (thousands of b/d) 2,101 2,002 2,030 2,005 2,013 1,872 2,001 Barrel miles (billions) Pipeline (km) 7,920 7,920 7,920 7,920 7,920 7,920 7,920 Capacity (thousands of b/d) 2,140 2,140 2,140 2,140 2,140 2,140 2,140 Load factor 98% 94% 95% 94% 94% 87% 94% (1) DBRS allocates debt and equity equivalents to preferreds and minority interest. (2) Capital expenditures excluding acquisitions and capitalized interest. (3) Excludes AEDC, capitalized interest, debt amortizations and equity earnings. (4) DBRS-adjusted for dividends paid to parent. (5) Consolidated ratios include inter-company debt, exclude Southern Lights project debt. n/a = not applicable. n.a. = not available. 13 Corporates: Energy
15 Attachment 1 to IOL-Enbridge 131(a) Enbridge Pipelines Inc. November 27, 2009 Rating Debt Rating Rating Action Trend Commercial Paper R-1 (low) Confirmed Stable Medium-Term Notes & Unsecured Debentures A (high) Trend Change Stable Rating History Current Commercial Paper R-1 (low) R-1 (low) R-1 (low) R-1 (low) R-1 (low) R-1 (low) MTNs & Unsecured Debt A (high) A (high) A (high) A (high) A (high) A (high) Related Research Enbridge Inc. Rating Report, November 27, Enbridge Gas Distribution Rating Report, August 25, Enbridge Energy Partners, L.P. Rating Report, November 24, Note: All figures are in Canadian dollars unless otherwise noted. Copyright 2009, DBRS Limited and DBRS, Inc. (collectively, DBRS). All rights reserved. The information upon which DBRS ratings and reports are based is obtained by DBRS from sources believed by DBRS to be accurate and reliable. DBRS does not perform any audit and does not independently verify the accuracy of the information provided to it. DBRS ratings, reports and any other information provided by DBRS are provided as is and without representation or warranty of any kind. DBRS hereby disclaims any representation or warranty, express or implied, as to the accuracy, timeliness, completeness, merchantability, fitness for any particular purpose or non-infringement of any of such information. In no event shall DBRS or its directors, officers, employees, independent contractors, agents and representatives (collectively, DBRS Representatives) be liable (1) for any inaccuracy, delay, loss of data, interruption in service, error or omission or for any damages resulting therefrom, or (2) for any direct, indirect, incidental, special, compensatory or consequential damages arising from any use of ratings and rating reports or arising from any error (negligent or otherwise) or other circumstance or contingency within or outside the control of DBRS or any DBRS Representative, in connection with or related to obtaining, collecting, compiling, analyzing, interpreting, communicating, publishing or delivering any such information. Ratings and other opinions issued by DBRS are, and must be construed solely as, statements of opinion and not statements of fact as to credit worthiness or recommendations to purchase, sell or hold any securities. A report providing a DBRS rating is neither a prospectus nor a substitute for the information assembled, verified and presented to investors by the issuer and its agents in connection with the sale of the securities. DBRS receives compensation for its rating activities from issuers, insurers, guarantors and/or underwriters of debt securities for assigning ratings and from subscribers to its website. DBRS is not responsible for the content or operation of third party websites accessed through hypertext or other computer links and DBRS shall have no liability to any person or entity for the use of such third party websites. This publication may not be reproduced, retransmitted or distributed in any form without the prior written consent of DBRS. ALL DBRS RATINGS ARE SUBJECT TO DISCLAIMERS AND CERTAIN LIMITATIONS. PLEASE READ THESE DISCLAIMERS AND LIMITATIONS AT ADDITIONAL INFORMATION REGARDING DBRS RATINGS, INCLUDING DEFINITIONS, POLICIES AND METHODOLOGIES, ARE AVAILABLE ON 14 Corporates: Energy
16 Attachment 2 to IOL-Enbridge 131(a)
 transport crude oil from Hardisty, Alberta, to Wood River,")
17 Rating Report October 16, 2009 Previous Report: September 16, 2008 Analysts Michael R. Rao, CFA Esther M. Mui, MBA, CMA The Company Express Pipeline Limited Partnership, Express Pipeline LLC and Platte Pipe Line Company (collectively, Express System) transport crude oil from Hardisty, Alberta, to Wood River, Illinois. Express System is owned one-third each by (1) Kinder Morgan Energy Partners, L.P.; (2) Borealis Infrastructure Management Inc. (acting on behalf of the Ontario Municipal Employees Retirement System); and (3) Ontario Teachers Pension Plan. Guarantor Platte Pipe Line Company Recent Actions September 16, 2008 Confirmed Express Pipeline Limited Partnership & Express Pipeline LLC Rating Debt Rating Rating Action Trend Senior Secured Notes due 2013 A (low) Confirmed Stable Senior Secured Notes due 2020 A (low) Confirmed Stable Subordinated Secured Notes due 2019 BBB (low) Confirmed Stable Rating Rationale DBRS has confirmed the ratings of A (low) and BBB (low), with Stable trends, on the Senior Secured Notes (Senior Debt) and Subordinated Secured Notes (Subordinated Debt; collectively, the Notes) issued jointly and severally by Express Pipeline Limited Partnership & Express Pipeline LLC (collectively, Express) and guaranteed by Platte Pipe Line Company (Platte). All of the ratings are supported by the combined strength of Express and Platte (collectively, Express System) through the latter s guarantee of the former s obligations. Consequently, Express System forms the basis of the financial analysis in this report. The confirmations reflect DBRS s view that Express s business and financial risk profile will remain stable over the medium term, supported by firm long-term contracts currently covering 82.5% of throughput capacity (remaining at that level until March 2012, with nearly 90% of commitments from investment-grade shippers) and long-term supply/demand trends supporting the importance of Western Canada Sedimentary Basin (WCSB) crude oil shipments to the U.S. Rocky Mountains (PADD IV) and Midwest (PADD II) regions. The subordinated debt is rated three notches lower than the senior debt for the following reasons: (1) the much weaker overall debt service coverage ratio (DSCR) (1.8 times) compared with the senior debt DSCR (3.6 times) for the 12 months ended June 30, 2009, due to the significant level of senior debt that ranks in priority to subordinated debt ($151.3 million and $194.9 million, respectively, at June 30, 2009), and (2) failure to pay interest or principal on the subordinated debt will not result in an Event of Default under the Trust Indenture as long as any senior debt is outstanding. (Continued on page 2.) Rating Considerations Strengths (1) Firm long-term shipping contracts into PADD IV (2) Long-term factors support shipments to U.S. markets (3) Platte is the only oil pipeline from PADD IV to PADD II (4) Good financial results since April 2005 expansion Financial Information Attachment 2 to IOL-Enbridge 131(a) Challenges (1) Growing competition for oil from other pipeline systems (2) Major contracts expire in March 2012 / Refinancing risk in January 2020 (3) Throughput risk on Platte currently and on Express in the future (4) Cash flow distribution could pressure balance sheet leverage in event of growth capex Express Pipeline System 6 mos. ended June mos. ended For the year ended December 31 (USD millions where applicable) June 30, Net income (loss) (before extras.) Cash flow (before extras.) Return on equity (before extras.) 12.4% 14.6% 12.5% 13.6% 9.8% 12.6% 5.8% Total debt in capital structure 58.0% 59.9% 58.0% 58.9% 60.7% 60.5% 62.4% Cash flow/total debt 19.1% 17.5% 19.1% 18.3% 15.4% 16.3% 10.5% Debt service coverage ratio (times) EBIT interest coverage (times) EBITDA interest coverage (times) Senior EBITDA interest coverage (times) Senior debt service coverage ratio (times) Express volumes (thousands of b/d) Corporates: Pipelines
18 Attachment 2 to IOL-Enbridge 131(a) Express Pipeline Limited Partnership & Express Pipeline LLC October 16, 2009 Rating Rationale (Continued from page 1.) The Senior Secured Notes due 2020 have a bullet maturity and therefore creditors do not benefit from principal amortization over time, as was the case with the original debt issues. DBRS assigned the same rating to the non-amortizing issue as assigned to the Senior Secured Notes due 2013 based on (1) identical security, (2) declining total debt outstanding as the initial Notes fully amortize over time and (3) the April 2005 expansion resulted in Express System becoming a more competitive entity than previously. 2 Corporates: Pipelines Expansion of throughput capacity on Express to 280,000 barrels per day (b/d) from 172,000 b/d, completed during April 2005, has had the following effects on Express System: (1) The expansion enhanced the economic fundamentals and competitive position of Express. DBRS believes that Express will remain the major crude oil pipeline from the WCSB to PADD IV, providing needed crude oil supply to refineries in that region. The combined toll for shipping light crude oil on the full Express System to Wood River is $1.77 for committed shippers and $3.81 for uncommitted shippers. This compares very well with the tolls of competing pipelines, including Enbridge Pipelines Inc. s Mainline/Lakehead System and TransCanada PipeLines Limited s (TCPL) Keystone Pipeline, which is expected to commence commercial operations in Q (2) Over the past several years, Express System s financial profile has remained consistent with the ratings, as its relatively high balance sheet leverage (debt-to-capital ratio of 58% at June 30, 2009) has been offset by strong profitability and coverage ratios. DSCR has exceeded 1.6 times on a quarterly basis since Q (1.8 times in the first half of 2009) compared with 1.6 times in Similarly, cash flow-to-total debt has increased to 19% for the 12 months ending June 30, 2009, up from 16% in 2006 and 11% in (3) Shipper commitments on Express cover 82.5% of current capacity (remaining at that level until March 2012), up from 67% of initial capacity prior to the April 2005 expansion. While Platte continues to rely on uncommitted volumes for throughput and revenue, relatively strong throughput on Express over the past few years has had a positive impact on Platte volumes. (4) Full servicing of all of the Notes requires either re-contracting of expiring capacity (shipping contract commitments equivalent to 40% of current capacity expire in March 2012) or a higher proportion of uncommitted volumes in future years. In addition, the last shipper contract expires in September 2015, more than four years before the last debt issue matures in January Consequently, Express System faces refinancing risk on the non-amortizing Senior Secured Notes due 2020, whereas the other debt obligations are fully amortizing. DBRS estimates that, even in the unlikely event that the Express contracts are not renewed and volumes drop to 50% of capacity (compared with 73% in the first half of 2009), Express System would still be able to meet its debt service obligations through 2020, given the much lower debt levels in future years. Therefore, DBRS expects these issues to be manageable due to the strong competitive positions of Express and Platte, as well as the long-term demand for crude oil in their markets. Rating Considerations Details Strengths (1) Express is supported by long-term firm contracts currently covering 82.5% of throughput capacity and remaining at that level until March 2012, with nearly 90% of commitments from investment-grade shippers. These contracts (which do not apply to Platte) require shippers to pay for contracted capacity at agreed tariffs whether or not the capacity is used, providing a stable base of revenues. DBRS estimates that, even in the unlikely event that the Express contracts are not renewed and volumes drop to 50% of capacity (compared with 73% in the first half of 2009), Express System would still be able to meet its debt service obligations through 2020, given the much lower debt levels in future years. (2) Long-term supply/demand trends support the importance of WCSB crude oil shipments into PADD IV and PADD II, ensuring a long life of supply for Express and Platte, respectively. Express System maintains a favourable competitive position relative to other pipelines that ship crude from western Canada into PADD IV and PADD II.
19 Attachment 2 to IOL-Enbridge 131(a) Express Pipeline Limited Partnership & Express Pipeline LLC October 16, 2009 (a) WCSB crude oil production is expected to grow over the medium to long term, driven by large oil sands projects and expansions. Increases in conventional heavy oil and bitumen are expected to more than offset declines in light crude oil production. (b) PADD IV continues to be the destination for about 60% of Express volumes. Although a relatively small market, PADD IV receipts of WCSB crude oil are expected to remain relatively flat over the medium term. According to a June 2009 study by the Canadian Association of Petroleum Producers (CAPP), PADD IV s WCSB crude oil receipts for 2008 were 255,000 b/d (Express shipped 196,100 b/d) and are forecast to stay near this level through (c) Express System will also likely benefit from increased processing of WCSB crude oil in PADD II (via Platte), which is expected to grow by 75% to 2.0 million b/d in 2015, according to the CAPP study. (3) Platte is the only crude oil pipeline connecting PADD IV to PADD II, the destination for much of the WCSB heavy crude oil shipments. Once crude oil reaches Casper, Wyoming, on Express (or regional production is transported to Platte), shippers can use Platte to ship crude oil within PADD IV or into PADD II (the Wood River, Illinois, area). The Express System toll into PADD II destinations is competitive with those of alternative pipelines (see Challenges below). (4) Over the past several years, Express System s financial profile has remained consistent with the ratings, as its relatively high balance sheet leverage has been offset by strong profitability and coverage ratios. DSCR has exceeded 1.6 times on a quarterly basis since Q (1.8 times in the first half of 2009) compared with 1.6 times in Similarly, cash flow-to-total debt has increased to 19% for the 12 months ending June 30, 2009, up from 16% in 2006 and 11% in Challenges (1) While Express is the largest and most competitive pipeline shipping to PADD IV, accounting for most of the crude oil imports into that region, Express System faces competition in PADD II from Enbridge Pipelines Inc. s Mainline/Lakehead System (the Enbridge/Lakehead System), the low-cost crude oil pipeline from the WCSB to major Canadian and U.S. Midwest markets. (a) In 2008, Enbridge Pipelines Inc. s mainline volumes (2.0 million b/d) were equivalent to approximately 84% of total WCSB crude oil production, providing 75% of Canadian export capacity. (b) The Enbridge/Lakehead System consistently provides the most economic route for WCSB producers shipping crude oil to PADD II/Chicago. However, Express System is shipping significant volumes of WCSB heavy crude oil to PADD II and has competitive tolls to Wood River, especially for committed volumes. Further competitive pressures will likely come from Enbridge/Lakehead System extensions into markets served by Express System, including the following: (i) In March 2006, reversal of Spearhead Pipeline (owned by Enbridge Inc.) was completed, providing 125,000 b/d of capacity from Chicago to Cushing, Oklahoma, with volumes originating from Lakehead System. In March 2009, further capacity expansion to 190,000 b/d was completed. (ii) In March 2009, construction was completed on the Southern Access Mainline Expansion Program, adding 400,000 b/d of heavy crude oil pipeline capacity from Hardisty, Alberta, to Flanagan, Illinois. The 42-inch diameter pipeline allows capacity to be tripled by adding pump stations at minimal additional cost, bringing the total incremental capacity potential to 1.2 million b/d over current capacity. (c) TCPL s Keystone Pipeline, which is expected to commence commercial operations in Q1 2010, would initially transport 435,000 b/d of crude oil from Hardisty to Patoka, Illinois, and Wood River. Keystone is expected to subsequently be expanded to 590,000 b/d and extend its reach to Cushing for service in late Approximately 90% of the capacity of this phase of Keystone has been secured by long-term contracts. DBRS expects Express System to maintain a competitive advantage into PADD IV over the long term and to remain competitive in PADD II over the medium term. The toll to ship light crude oil on Enbridge from Hardisty to Flanagan (near Chicago) is about $2.40 per barrel. The comparable toll on Express-Platte to Wood River is $3.81 for uncommitted shippers (subject to changing supply/demand conditions) compared to $1.77 for committed shippers. 3 Corporates: Pipelines
20 Attachment 2 to IOL-Enbridge 131(a) Express Pipeline Limited Partnership & Express Pipeline LLC October 16, 2009 (2) Shipper contracts totalling 111,900 b/d (40% of current capacity) on Express will expire in March Express s tariffs will have to remain competitive with alternative pipeline routes in order to ensure its volumes remain high enough to maintain an adequate rate of return. The importance of Express in providing a link between the western Canada crude oil market and customers in PADD IV mitigates some of the throughput risk that will occur as shipper contracts expire. In addition, domestic production and continued reserve replacement within PADD IV could partly mitigate import demand. Finally, the last Express shipper contract expires in September 2015, more than four years before the last debt issue matures in January Consequently, Express System faces refinancing risk on the non-amortizing Senior Secured Notes due 2020, whereas the other debt obligations are fully amortizing. DBRS estimates that, even in the unlikely event that the Express contracts are not renewed and volumes drop to 50% of capacity (compared with 73% in the first half of 2009), Express System would still be able to meet its debt service obligations through 2020 given the much lower debt levels in future years. Therefore, DBRS expects these issues to be manageable due to the strong competitive positions of Express and Platte, as well as to the long-term demand for crude oil in their markets. (3) Platte has no long-term ship-or-pay contracts and is therefore exposed to throughput risk. Platte s volumes are supported by refinery demand in Wood River. For Express, throughput risk is currently 49,100 b/d (17.5% of capacity). (4) Distribution of substantially all cash flow to its partners restricts equity base growth over time, requiring Express to raise external financing to fund growth opportunities. To the extent that debt financing is used, this would place pressure on its balance sheet, although there are currently no expansion plans in place. Earnings and Outlook 4 Corporates: Pipelines Express Pipeline System 6 mos. ended June mos. ended For the year ended December 31 Income Statement (USD millions) June 30, Revenues Electricity expense (21.6) (21.2) (42.1) (41.7) (39.8) (39.2) (30.1) Property taxes (6.2) (5.9) (12.0) (11.6) (11.0) (10.6) (9.4) Operations & maintenance (21.0) (23.9) (46.4) (49.4) (49.2) (41.4) (37.5) EBITDA Depreciation and amortization (15.3) (15.3) (30.6) (30.6) (30.5) (29.9) (27.9) Other income (expense) (0.2) 1.0 (0.4) Earnings Before Interest and Taxes Interest expense, net (12.3) (13.2) (25.1) (26.0) (27.6) (29.1) (26.1) Net income before taxes Income taxes (2.3) 0.8 (4.2) (1.1) (3.4) (3.5) 0.4 Net Income Before Extras Extraordinary items Net income, as reported Return on equity (before extras.) 12.4% 14.6% 12.5% 13.6% 9.8% 12.6% 5.8% Express volumes (thousands of b/d) Maximum capacity (thousands of b/d) (1) Pipeline capacity factor 73.4% 73.7% 69.9% 70.1% 76.2% 81.0% 84.2% Contracted pipeline capacity (b/d) Express volumes/contracted capacity 89.0% 84.9% 82.7% 80.8% 92.0% 96.4% 105.6% (1) Maximum pipeline capacity rose from 172,000 b/d to 280,000 b/d during April Summary Net income (before extraordinary items) fell by 15% to $15.5 million for the first half of 2009 (H1 2009), compared with $18.2 million for H1 2008, mainly due to lower transportation revenues and higher non-cash future income taxes partially offset by lower operating and maintenance expenses. Tolls on committed volumes on Express can rise by a maximum of 2% per year under the transportation service agreements (TSAs). Tolls on uncommitted volumes are subject to shipper complaints. Express System is fully exposed to changes in operating expenses. Outlook Earnings and profitability are likely to remain relatively stable over the medium term. Committed capacity on Express Pipeline declined slightly to 230,900 b/d (82.5%) following the expiry of a one-year contract at year-
21 Attachment 2 to IOL-Enbridge 131(a) Express Pipeline Limited Partnership & Express Pipeline LLC October 16, 2009 end 2008, resulting in a marginal reduction in committed revenues going forward. Express has 49,100 b/d of uncommitted capacity on which to earn higher uncommitted tariffs. Tolls are almost always higher for uncommitted volumes (compared with committed volumes) but can be volatile. Over the long term, Express should benefit from long-term supply/demand factors in its markets. DBRS believes the operating and financial performance of Express will allow the pipeline to meet its debt amortization obligations without the need for further expansion. Financial Profile 5 Corporates: Pipelines Express Pipeline System 6 mos. ended June mos. ended For the year ended December 31 (USD millions) June 30, Net income before extras Depreciation and amortization Other 2.3 (0.8) (0.4) Cash flow before extras Capital expenditures (1) (3.3) (2.4) (7.5) (6.6) (4.6) (8.7) (55.1) Working capital changes (0.2) (0.3) (3.3) (13.3) Free cash flow before dividends (23.6) Distributions paid to owners (2) (18.6) (22.0) (30.6) (34.0) (25.3) (30.2) (17.3) Gross Free Cash Flow (40.9) Divestitures Other assets Net Free Cash Flow (35.5) Inc. (dec.) in total debt (12.6) (12.9) (25.5) (25.8) (24.0) (19.5) 92.0 Inc. (dec.) in common equity (2) (7.1) (7.1) (38.3) 0.0 (86.8) Dec. (inc.) in cash balances (1.8) (3.7) (3.9) (5.8) 10.8 (11.3) 30.3 Funding Sources (14.4) (16.6) (36.6) (38.7) (51.5) (30.8) 35.5 Total debt/capital 58.0% 59.9% 58.0% 58.9% 60.7% 60.5% 62.4% Cash flow/total debt 19.1% 17.5% 19.1% 18.3% 15.4% 16.3% 10.5% EBIT interest coverage EBITDA interest coverage Debt service coverage ratio Senior EBITDA interest coverage Senior debt service coverage ratio (1) Includes the $100 million expansion completed during April (2) Distributions paid in excess of net income before extras are treated as a return of equity capital to the owners. Summary Over the past several years, Express System s financial profile has remained consistent with the ratings, as its relatively high balance sheet leverage has been offset by strong profitability and coverage ratios. Maintenance capex remains low, resulting in significant free cash flow that is used to pay dividends to the partners and to meet debt amortization requirements. Outlook Until March 2012, the current balance sheet leverage is supported by substantial shipper commitments and strong coverage ratios. Full servicing of all of the Notes requires either re-contracting of expiring capacity (shipping contract commitments equivalent to 40% of current capacity expire in March 2012) or a higher proportion of uncommitted volumes in future years. In addition, the last shipper contract expires in September 2015, more than four years before the last debt issue matures in January Consequently, Express System faces refinancing risk on the non-amortizing Senior Secured Notes due 2020, whereas the other debt obligations are fully amortizing. DBRS estimates that, even in the unlikely event that the Express contracts are not renewed and volumes drop to 50% of capacity (compared with 73% in the first half of 2009), Express System would still be able to meet its debt service obligations through 2020, given the much lower debt levels in future years. Therefore, DBRS expects these issues to be manageable due to the strong competitive positions of Express and Platte, as well as the long-term demand for crude oil in their markets.
22 Attachment 2 to IOL-Enbridge 131(a) Express Pipeline Limited Partnership & Express Pipeline LLC October 16, 2009 Debt Maturities (At December 31, 2008) (USD millions) % of long-term debt 7.5% 8.6% 8.6% 7.8% 67.5% Outstanding Debt 6.47% Senior Secured Notes due 2013 Issuers Express Pipeline Limited Partnership and Express Pipeline Partnership (now Express Pipeline LLC) Guarantor Platte Pipe Line Company Scheduled Maturity December 31, 2011 (9.0 years original weighted average life) Rated Final Maturity December 31, 2013 Amortization Semi-annual payments of varying amounts commencing June 30, 1998 (full amortization) Current Principal $41.3 million at June 30, 2009 (original principal was $150 million at February 6, 1998) 6.09% Senior Secured Notes due 2020 Issuers Express Pipeline Limited Partnership and Express Pipeline LLC Guarantor Platte Pipe Line Company Final Maturity January 15, 2020 Amortization Semi-annual interest payments (no amortization) Current Principal $110 million at June 30, 2009 (issued June 16, 2005) 7.39% Subordinated Secured Notes due 2019 Issuers Express Pipeline Limited Partnership and Express Pipeline Partnership (now Express Pipeline LLC) Guarantor Platte Pipe Line Company Scheduled Maturity December 31, 2017 (14.5 years original weighted average life) Rated Final Maturity December 31, 2019 Amortization Semi-annual payments of varying amounts commencing June 30, 1998 (full amortization) Current Principal $194.9 million at June 30, 2009 (original principal was $250 million at February 6, 1998) Subordination As long as any Senior Notes are outstanding, failure to pay interest or principal on the Subordinated Notes will not result in a Default or Event of Default under the Trust Indenture Scheduled Amortization was based on the base case projected operating results prior to completion of Express construction. Failure to amortize the Notes in accordance with this schedule would not constitute a Default or Event of Default but would result in late-payment premiums. This amortization schedule has been met by Express System. The Rated Amortization schedule is the minimum amount of principal that must be amortized in order to avoid an Event of Default, except that as long as any Senior Notes are outstanding, failure to pay interest or principal on the Subordinated Notes in accordance with the Rated Amortization schedule will not result in a Default or Event of Default. 6 Corporates: Pipelines
23 Attachment 2 to IOL-Enbridge 131(a) Express Pipeline Limited Partnership & Express Pipeline LLC October 16, 2009 Corporate Structure Simplified Corporate Structure - Express Pipeline System Owners (1) Kinder Morgan Energy Partners, L.P. Borealis Infrastructure Mgmt. Inc. Ontario Teachers' Pension Plan Express Holdings (Canada) Limited Partnership Express Holdings (USA) Inc. Express Pipeline Express Pipeline LLC Platte Pipe Line Limited Partnership (Express U.S.) (2) Company (Platte) (2) (Express Canada) (2) Notes: (1) Each owner has an effective 1/3 ownership interest in each of the entities. Intermediate entities have been omitted from the chart. (2) The outstanding debt (listed below) was issued jointly and severally by Express Canada and Express U.S. and guaranteed by Platte (Express Pipeline System). (a) Senior Secured Notes due 2013; (b) Subordinated Secured Notes due 2019; and (c) Senior Secured Notes due Under a Restricted Payments Test, Express System can pay dividends to its owners if its debt service coverage ratio exceeds 1.30 times for each of the four preceding quarters (1.81 times for the 12 months ending June 30, 2009) and it retains sufficient cash to meet the next scheduled principal and interest payment under the original Notes ($23.5 million at December 31, 2009). Regular dividends have been paid since Q In October 2004, Senior Secured Guaranteed Exchangeable Notes due 2020 were issued by Express Holdings (Canada) Limited Partnership and Express Holdings (USA) Inc. and guaranteed by Express and Platte in order to fund expansion construction and allow dividends to flow to the owners during the expansion construction period (to April 2005). In June 2005, the Senior Secured Guaranteed Exchangeable Notes due 2020 were refinanced with Senior Secured Notes due 2020 (issued by Express and guaranteed by Platte) when the Restricted Payments Test could be met (shortly after the new shipping commitments came into force). Business Profile and Regulation Express System consists of Express and Platte, which together transport crude oil from Hardisty to Wood River. Express Pipeline System supplies refineries in the U.S. Rocky Mountains (PADD IV) and U.S. Midwest (PADD II) with crude oil and consists of the following: (1) Express Express is a 783-mile (1,260-kilometre) pipeline from Hardisty to Casper, connecting to Platte. Express supplies refineries in PADD IV with crude oil. Express operates in a batch mode, permitting shipment of different types of crude oil along the pipeline. PADD IV is the destination for approximately 60% of Express volumes. 7 Corporates: Pipelines
24 Attachment 2 to IOL-Enbridge 131(a) Express Pipeline Limited Partnership & Express Pipeline LLC October 16, 2009 Express commenced operations in April 1997 with throughput capacity of 172,000 b/d. This capacity was expanded to 280,000 b/d in April 2005 through the addition of nine new pump stations and 600,000 barrels of combined new tankage facilities. The expansion ($100 million investment) added 108,000 b/d (63%) to capacity. New shipper commitments totalling 118,900 b/d through 2014 and 2015 were received, raising committed volumes to 230,900 b/d (82.5% of expanded capacity), its current level. The volume weighted average remaining contract term is 4.2 years (as of June 30, 2009). Nearly 90% of commitments are from investment-grade shippers (similar to original TSAs). Current Capacity Commitments Express Years Remaining on Contracts Weighted Avg. Remaining Term Original Expiry Committed % of Expanded Committed Term Date Volumes (b/d) Capacity** Volumes (%) 15 years March , % % years* March , % % years* March , % % years* Sept , % % , % 100.0% * From April ** Based on expanded capacity of 280,000 b/d. Regulation Express The National Energy Board regulates the Canadian portion of Express, with uncommitted rates subject to shipper complaints. Federal Energy Regulatory Commission (FERC) regulates the U.S. portion of Express, using the Producer Price Index for Finished Goods (PPIFG) to set the rate ceiling for uncommitted shipments. Regulation is not on a cost-of-service basis. Therefore, Express is fully exposed to operating cost increases. Under a force majeure situation, Express is at risk (i.e., TSAs do not require payment if the pipeline is not operational). Tariffs on committed volumes can rise by a maximum of 2% per year under the TSAs. Tariffs on uncommitted volumes are almost always higher than for committed volumes according to the TSAs. Therefore, Express benefits from a revenue standpoint if the former volumes replace the latter when demand is high. (2) Platte Platte Pipeline, built in 1952, is a 936-mile (1,506-kilometre) pipeline from Casper (connecting with Express) to refineries and connecting pipelines in the Wood River area. Platte is the only crude oil pipeline connecting PADD IV to PADD II, with average capacity of 150,000 b/d. FERC regulates Platte using PPIFG to set a rate ceiling. Regulation is not on a cost-of-service basis. Platte is fully exposed to operating cost increases. Unlike Express, Platte is completely reliant on uncommitted volumes. PADD II is the destination for approximately 40% of Express volumes from the WCSB, receiving much of its heavy oil shipments. Once crude oil reaches Casper on Express, shippers can use Platte to ship crude oil within PADD IV or into PADD II (the Wood River area terminus). Platte s volumes are supported by refinery demand in Wood River. 8 Corporates: Pipelines
25 Attachment 2 to IOL-Enbridge 131(a) Express Pipeline Limited Partnership & Express Pipeline LLC October 16, 2009 Express Pipeline System* Balance Sheet (USD millions) June 30 Dec. 31 Dec. 31 June 30 Dec. 31 Dec. 31 Assets Liabilities & Equity Cash & equivalents A/P & accrued liab Accounts receivable Due to related parties Prepayments & other L.t.d. due in one year Current Assets Current Liabilities Net fixed assets Senior long-term debt Deferred charges Subord. long-term debt Goodwill, net Future income taxes Total Assets Common equity Total Liabilities & Equity Balance Sheet & 6 mos. ended June mos. ended For the year ended December 31 Liquidity Ratios June 30, Current ratio Total debt in capital structure 58.0% 59.9% 58.0% 58.9% 60.7% 60.5% 62.4% Net debt in capital structure 54.5% 57.0% 54.5% 55.7% 58.2% 57.4% 60.3% Cash flow/total debt 19.1% 17.5% 19.1% 18.3% 15.4% 16.3% 10.5% (Cash flow - divs.)/net capex (1) Distributions paid/net income (2) 120.1% 121.1% 97.7% 100.0% 100.0% 91.4% 100.0% Accum. depreciation/gross fixed assets 33.8% 30.7% 33.8% 32.2% 29.1% 26.0% 22.9% Coverage Ratios (3) EBIT interest coverage (times) EBITDA interest coverage (times) Fixed-charges coverage (times) Debt service coverage ratio (times) Senior Debt Coverage Ratios (3) Senior EBITDA interest coverage (times) Senior debt service coverage ratio (times) Profitability Ratios Operating margin 33.2% 32.1% 32.9% 32.3% 30.3% 35.0% 30.1% Profit margin (before extras.) 16.4% 19.0% 16.3% 17.5% 13.8% 18.0% 11.8% Return on equity (before extras.) 12.4% 14.6% 12.5% 13.6% 9.8% 12.6% 5.8% Return on capital (before extras.) 7.8% 8.6% 7.9% 8.1% 6.5% 7.5% 5.0% Selected Data (USD millions) Revenues Operating income Net income (loss) (before extras.) (4) Cash flow (bef. working capital changes) Capital expenditures (1) (3.3) (2.4) (7.5) (6.6) (4.6) (8.7) (55.1) Working capital changes (0.2) (0.3) (3.3) (13.3) Free cash flow before dividends (23.6) Distributions paid to owners (2) (18.6) (22.0) (30.6) (34.0) (25.3) (30.2) (17.3) Gross free cash flow (40.9) Operating Statistics Express Pipeline (km) 1,263 1,263 1,263 1,263 1,263 1,263 1,263 Platte Pipeline (km) 1,496 1,496 1,496 1,496 1,496 1,496 1,496 Express average shipments (b/d) 205, , , , , , ,064 Maximum pipeline capacity (b/d) (5) 280, , , , , , ,000 Pipeline capacity factor 73.4% 73.7% 69.9% 70.1% 76.2% 81.0% 84.2% * The Express Pipeline System financial statements, which are a combination of the financial statements of Express Canada, Express U.S. and Platte, form the basis of the financial analysis in this report due to the joint nature of the debt obligations as a result of the guarantee of Platte. (1) Capital expenditures exclude acquisitions and capitalized interest, if any. (2) Distributions paid in excess of net income before extras are treated as a return of equity capital to the owners. (3) Before non-cash financial charges (capitalized interest/afudc). (4) Express System entities are not subject to income tax. However, one of the three partners is a corporation that is subject to income tax. (5) Maximum pipeline capacity rose from 172,000 b/d to 280,000 b/d during April Corporates: Pipelines
26 Attachment 2 to IOL-Enbridge 131(a) Express Pipeline Limited Partnership & Express Pipeline LLC October 16, 2009 Ratings Debt Rating Rating Action Trend Senior Secured Notes due 2013 A (low) Confirmed Stable Senior Secured Notes due 2020 A (low) Confirmed Stable Subordinated Secured Notes due 2019 BBB (low) Confirmed Stable Rating History Current Senior Secured Notes due 2013 A (low) A (low) A (low) A (low) A (low) A (low) Senior Secured Notes due 2020 A (low) A (low) A (low) A (low) A (low) NR Subordinated Secured Notes due 2019 BBB (low) BBB (low) BBB (low) BBB (low) BBB (low) BBB (low) Note: All figures are in U.S. dollars unless otherwise noted. Copyright 2009, DBRS Limited and DBRS, Inc. (collectively, DBRS). All rights reserved. The information upon which DBRS ratings and reports are based is obtained by DBRS from sources believed by DBRS to be accurate and reliable. DBRS does not perform any audit and does not independently verify the accuracy of the information provided to it. DBRS ratings, reports and any other information provided by DBRS are provided as is and without representation or warranty of any kind. DBRS hereby disclaims any representation or warranty, express or implied, as to the accuracy, timeliness, completeness, merchantability, fitness for any particular purpose or non-infringement of any of such information. In no event shall DBRS or its directors, officers, employees, independent contractors, agents and representatives (collectively, DBRS Representatives) be liable (1) for any inaccuracy, delay, loss of data, interruption in service, error or omission or for any damages resulting therefrom, or (2) for any direct, indirect, incidental, special, compensatory or consequential damages arising from any use of ratings and rating reports or arising from any error (negligent or otherwise) or other circumstance or contingency within or outside the control of DBRS or any DBRS Representative, in connection with or related to obtaining, collecting, compiling, analyzing, interpreting, communicating, publishing or delivering any such information. Ratings and other opinions issued by DBRS are, and must be construed solely as, statements of opinion and not statements of fact as to credit worthiness or recommendations to purchase, sell or hold any securities. A report providing a DBRS rating is neither a prospectus nor a substitute for the information assembled, verified and presented to investors by the issuer and its agents in connection with the sale of the securities. DBRS receives compensation for its rating activities from issuers, insurers, guarantors and/or underwriters of debt securities for assigning ratings and from subscribers to its website. DBRS is not responsible for the content or operation of third party websites accessed through hypertext or other computer links and DBRS shall have no liability to any person or entity for the use of such third party websites. This publication may not be reproduced, retransmitted or distributed in any form without the prior written consent of DBRS. 10 Corporates: Pipelines
27 Attachment 3 to IOL-Enbridge 131(a)

28 Rating Report April 28, 2009 Previous Report: April 24, 2008 Analysts Michael R. Rao,CFA Esther M. Mui, MBA, CMA Brian Ko The Company Trans-Northern Pipelines Inc. (the Company) owns and operates a refined products distribution pipeline extending over 800 kilometres through southern Ontario and Québec from Nanticoke, Ontario, to Montréal. The Company is owned equally by Petro- Canada, Shell Canada Limited and Imperial Oil Limited and serves markets primarily in Toronto, Ottawa and Montréal. Capacity varies from 10, 000 cubic metres per day (m 3 /d), or 62,900 barrels per day (b/d), to 21,000 m 3 /d (132,090 b/d) in different sections of the pipeline system. Recent Actions April 24, 2008 Confirmed Trans-Northern Pipelines Inc. Rating Debt Rating Rating Action Trend Senior Unsecured Notes A (low) Confirmed Stable Rating Rationale DBRS has confirmed the rating on the Senior Unsecured Notes (the Notes) issued by Trans-Northern Pipelines Inc. (TNPI or the Company) at A (low) with a Stable Trend. The confirmation reflects the following factors: (1) The primary term of long-term ship-or-pay contracts covering approximately 50% of TNPI s capacity (40% with its one-third owner Petro-Canada (rated A (low) Under Review - Developing by DBRS) and 10% with Ultramar Limited (Ultramar), not rated by DBRS), provides sufficient revenue to meet required principal ($10.5 million annually) and interest payments for the $135 million of Notes issued as a private placement in December 2005, with the $40.5 million (30%) balance due in March DBRS expects that this amount will be refinanced, remaining a component of TNPI s regulated capital structure at that time. The debt amortization is expected to restore TNPI s debt-to-capital ratio to the 45% to 50% range that was in place until 2003 compared with the relatively high level of 68% at December 31, TNPI obtained a temporary waiver of its capital structure requirements by its regulator, the National Energy Board (NEB), in order to complete its major capacity expansion and line reversal project. In addition, DBRS expects that in the event that the proposed merger between Petro-Canada and Suncor Energy Inc. (Suncor) is completed (see DBRS press release dated March 23, 2009), then Suncor (rated A (low) Under Review - Developing by DBRS) would assume Petro-Canada s obligations under the latter s long-term ship-or-pay contract with TNPI. (Continued on page 2.) Rating Considerations Strengths (1) Long-term firm ship-or-pay contracts support servicing of the Notes (2) Most economic toll for transporting refined products within southern Ontario and Québec (3) Strong owner-shippers can provide support to TNPI, if needed (4) Resilient refined products market in southern Ontario Financial Information Attachment 3 to IOL-Enbridge 131(a) Challenges (1) High, although declining, balance sheet leverage over the next few years (2) Reduced shipper commitments and modest refinancing risk in 2015 (3) Competition from alternative fuels and other refineries could reduce TNPI volumes (4) Potential negative impact of changes in environmental legislation For the year ended December 31 (CAD thousands where applicable) 2008* Net income (before extras.) 9,665 14,591 10,301 10,291 5,006 4,054 5,106 Cash flow from operations 17,532 19,825 18,771 19,006 11,004 7,589 7,890 Return on equity before extras. 17.8% 30.4% 24.9% 28.4% 15.0% 12.7% 17.8% Total debt in capital structure 67.9% 71.2% 76.1% 79.1% 80.3% 45.9% 44.6% Cash flow/total debt 14.7% 15.4% 13.5% 12.9% 8.0% 27.1% 31.6% (Cash flow - divs.)/net capex EBIT interest coverage (times) Debt service coverage ratio (times) Average daily throughput (m3/day) 35,025 34,699 33,745 34,296 33,375 31,233 29,216 * Results for the year ending December 31, 2008 are unaudited. 1 Corporates: Pipelines
29 Attachment 3 to IOL-Enbridge 131(a) Trans-Northern Pipelines Inc. April 28, 2009 Rating Rationale (Continued from page 1.) (2) TNPI offers the most economic tolls and reliable shipment option for the Montréal to Toronto, Ottawa and southern Ontario refined products markets, supporting stability of earnings and cash flow. This position is supported by long-term contracts covering approximately 50% of TNPI s capacity (see above), with the balance mostly dedicated to un-contracted service for its two other one-third owners, Imperial Oil Limited (Imperial, rated AA (high) by DBRS) and Shell Canada Limited (Shell Canada, not rated by DBRS). Suncor also ships modest un-contracted volumes from its Sarnia refinery on TNPI. DBRS does not expect that completion of the proposed merger of Suncor and Petro-Canada would adversely impact operations of the existing ownership structure. Major decisions at TNPI require two-thirds of the owners approvals. (3) The expansion and reversal project supports Petro-Canada s servicing of its primary markets in southern Ontario through its Montréal refinery, following the 2005 closure of its Oakville, Ontario, refinery. The expansion and reversal project has also expanded Ultramar s coverage of the Toronto market, following the reversal of a previously underutilized section of the pipeline. (4) Potential competition from alternative fuels and other refineries could have an impact on the shippers, affecting TNPI s throughput. In addition, consolidation of inland refineries in favour of coastal refineries could have a negative impact on refined product supplies in Ontario. However, incremental supply is provided by Québec-based refineries and supplemented by European imports. European refineries produce excess gasoline in order to meet strong diesel fuel demand in domestic markets. Much of the excess gasoline supply is imported into Canada through the port of Montréal. The owner-shipper relationship at TNPI should mitigate supply constraints. (5) Despite lower economic activity in the past year, resilient refined products demand in southern Ontario is supported by sufficient supplies despite the production lost as a result of the 2005 closing of Petro-Canada s Oakville refinery. Incremental supplies are available from Québec-based refineries, including that of Ultramar, supplemented by imports from Europe. DBRS estimates that capacity utilization on the various pipeline segments has been in the 75% to 80% range since the completion of the expansion and reversal project in March DBRS expects the Company to maintain stable earnings and cash flow going forward due to completion of the expansion and reversal project. Improvement in credit metrics will occur gradually as the project debt amortizes over time. With regards to liquidity, TNPI has a $25 million revolving credit facility expiring in July There is modest risk in renegotiating the terms of the revolver. However, DBRS expects the facility to be extended. Approximately $16 million was drawn as of December 31, Rating Considerations Details Strengths (1) Approximately 50% of TNPI s revenues are covered by long-term contracts with Petro-Canada (40%), a one-third owner, and Ultramar (10%), with most of the remainder supported by un-contracted shipments by its other two one-third owners, Imperial and Shell Canada, resulting in a strong investment-grade shipping group. NEB-regulated common carrier liquids pipelines such as TNPI typically do not offer long-term firm or reserved service, instead allocating service on a monthly basis. In certain circumstances, the NEB approves long-term ship-or-pay contracts such as those noted above in order to support major expansions, such as the Company s expansion and reversal project. TNPI s regulated toll structure is designed to allow for recovery of operating costs, supporting stability of earnings and cash flow. If transportation revenue in one year exceeds or falls short of TNPI s revenue requirement for that year, the variance is applied to the following year s revenue requirement. Given the Company s low maintenance capex needs, cash flow from the longterm contracts should allow for repayment of 70% of the Notes by their maturity in March This would restore TNPI s capital structure to the 45% to 50% total debt-to-capital range required by the NEB. DBRS expects that the $40.5 million Notes balance due in March 2015 will be refinanced, becoming a component of TNPI s regulated capital structure at that time. 2 Corporates: Pipelines
30 Attachment 3 to IOL-Enbridge 131(a) Trans-Northern Pipelines Inc. April 28, 2009 (2) The Company provides a reliable and cost-efficient means to ship large volumes of refined products to major markets in southern Ontario compared to alternative modes of transportation such as marine, rail and trucking. The primary shipments originate from: (a) Petro-Canada and Shell Canada refineries in Montréal to Toronto and Ottawa; (b) Imperial, Shell Canada and Sunoco (owned by Suncor) refineries in Sarnia, Ontario, to Toronto; (c) Ultramar s trans-shipment from its refinery near Québec City to Montréal en route to Toronto; and (d) the Imperial refinery in Nanticoke, Ontario. (3) TNPI has strong sponsorship given that its three owners are major Canadian integrated oil and gas companies and are also major shippers on the pipeline, accounting for approximately 90% of revenues. These sponsors depend on TNPI to get their products to the important southern Ontario refined products market and can provide support to TNPI, if required. DBRS does not expect that completion of the proposed merger of Suncor and Petro-Canada would adversely impact operations of the existing ownership structure. Major decisions at TNPI require two-thirds of the owners approvals. (4) Despite lower economic activity in the past year, resilient refined products demand in southern Ontario (as evidenced by TNPI s relatively stable volumes) is supported by sufficient supplies despite the production lost as a result of the 2005 closing of Petro-Canada s Oakville refinery. Incremental supplies are available from Québec-based refineries, including that of Ultramar, supplemented by imports from Europe (see the Rating Rationale section above). Challenges (1) TNPI s relatively high balance sheet leverage (68% at year-end 2008) currently constrains financial flexibility. However, scheduled debt amortization is expected to restore TNPI s total debt-to-capital ratio to the 45% to 50% range required by the NEB by DBRS expects the Company s debt-to-capital ratio to decline steadily to 60% at year-end 2010 and 50% at year-end (2) Substantially lower contract commitments for the second ten-year term of the facility support agreements (FSAs) reduce the contractual earnings base beginning in (The Notes mature in March 2015.) Petro- Canada s commitments decrease from 7,280 m 3 /d (45,791 b/d) to 1,590 m 3 /d (10,001 b/d). Similarly, Ultramar s priority access for 1,820 m 3 /d (11,448 b/d) decreases to 400 m 3 /d (2,516 b/d) in the second term. Unless major shifts occur in the nature of the Ontario refined products market by 2015, which DBRS does not expect, these shippers will likely continue to use TNPI s pipeline on an un-contracted basis. DBRS estimates that capacity utilization on the various pipeline segments has been in the 75% to 80% range since completion of the expansion and reversal project. Further, DBRS expects that the $40.5 million Notes balance due in March 2015 will be refinanced, remaining a component of TNPI s regulated capital structure at that time. (3) Potential competition from alternative fuels and other refineries could reduce TNPI s throughput, affecting earnings and cash flow from non-contracted volumes. Ethanol and ethanol blended gasoline cannot be shipped together with other refined products via pipeline as ethanol absorbs moisture and small impurities that may reside in pipelines. Gasoline that is produced for ethanol blending is moved in pipelines with the addition of the ethanol taking place at distribution terminals prior to shipments by truck from terminals to retail outlets. Alternative transportation modes for refined products such as rail, truck and marine, while available, are much more costly than pipelines. Marine transportation is further constrained by winter conditions. The potential construction of a competitive pipeline cannot be ruled out, although DBRS believes that the inherent environmental constraints and substantial right-of-way issues would present major barriers to any new projects and therefore considers the potential for this scenario to occur to be very low. (4) Changes in environmental legislation requiring substantial reductions in greenhouse gas (GHG) emissions, and reduced benzene and sulphur content in refined products could potentially reduce the amount of gasoline consumed in TNPI s service area, resulting in lower throughput volumes for TNPI. Details of the implementation of a federal GHG emissions-reduction program have not been finalized. While initially resulting in lower earnings and cash flow for TNPI, the revenue variance would be applied to the following year s revenue requirement, thereby ensuring stability of earnings and cash flow. Long-term economic growth in the province would likely offset the impact of these factors on refined products demand. 3 Corporates: Pipelines
31 Attachment 3 to IOL-Enbridge 131(a) Trans-Northern Pipelines Inc. April 28, 2009 Regulation and FSAs Regulation TNPI is regulated by the NEB under the incentive-tolling methodology agreed to by all shippers in The shippers share 50% of earnings over an income threshold level. The toll permits the pass-through of costs associated with significant industry requests, including the expansion and reversal project completed in March Recovery of operating and maintenance expenses is ensured. Under the incentive-tolling agreement, the shippers are allowed to share in net income above a specified threshold level. Income taxes are accounted for using the liability method. NEB-regulated common carrier liquids pipelines such as TNPI typically do not offer long-term firm or reserved service, instead allocating service on a monthly basis. In certain circumstances, including the Company s expansion and reversal project, the NEB approves long-term ship-or-pay contracts in order to support major expansions. As part of the NEB s approval of the expansion and reversal project, TNPI was provided with a temporary waiver of its obligation to maintain its debt-to-capital ratio in the 45% to 50% range. This allowed TNPI to reach a maximum 80% total debt-to-capital ratio following completion of the expansion and reversal project, declining to 50% by the end of the ten-year primary term (in 2015) under the 20-year FSAs with the two shippers (50% total debt-to-capital was maintained before the expansion and reversal project). TNPI s allowed return on equity (ROE) is based on the annual NEB-approved multi-pipeline ROE plus 0.25% (8.96% in 2008; 8.82% in 2009). In March 2009, the NEB released its decision on the 2007 and 2008 cost of capital application (the Decision) submitted by Trans Québec & Maritimes Pipeline Inc. (TQM). In the Decision, the NEB deviated from its previous methodology by setting a 6.4% after-tax weighted-average cost of capital (ATWACC) return (with no explicit deemed capital structure) for each of 2007 and While the Decision does not directly affect TNPI, the Company was one of the recipients of a letter from the NEB requesting comment on whether it should review the 1994 multi-pipeline cost of capital decision. At the date of this report, the Company had not made any decisions with respect to its response to the NEB request. FSAs In order to support permanent financing of the expansion and reversal project, Petro-Canada and Ultramar entered into FSAs covering approximately 50% of TNPI s capacity in order to obtain priority access to pipeline capacity from Montréal to Oakville. Approximately 50% of TNPI s revenues are covered by the FSAs, sufficient to cover repayment of 70% of the $135 million of Notes issued as a private placement in December DBRS expects that the $40.5 million Notes balance due in March 2015 will be refinanced, remaining a component of TNPI s regulated capital structure at that time. Petro-Canada s FSA allows early termination only in the secondary term after 365 days of non-usage of the pipeline system. The FSAs cover two consecutive ten-year terms on a ship-or-pay basis, which commenced on March 2, DBRS expects that in the event that the proposed merger between Petro-Canada and Suncor is completed, then Suncor would assume Petro-Canada s obligations under the latter s long-term shipor-pay contract with TNPI. The following table provides details of the priority access provided to Petro- Canada and Ultramar: Priority access: Primary Term Secondary Term Design Capacity m3/d b/d (m3/d) (b/d) (m3/d) (b/d) Montréal to Farran's Point 21, ,090 Petro-Canada 7,280 45,791 1,590 10,001 Farran's Point to Belleville 11,500 72,335 Ultramar 1,820 11, ,516 Belleville to Toronto/Oakville 10,000 62,900 9,100 57,239 1,990 12,517 Nanticoke to Toronto 16, ,043 % Total capacity 50% (approx.) 4 Corporates: Pipelines
32 Attachment 3 to IOL-Enbridge 131(a) Trans-Northern Pipelines Inc. April 28, 2009 Earnings and Outlook Income Statement For the year ended December 31 (CAD thousands where applicable) 2008* Transportation revenues 58,890 61,749 60,424 57,145 33,206 30,875 29,609 Cash operating expenses (31,964) (30,335) (32,014) (29,733) (20,323) (20,399) (18,112) Depreciation & amortization (6,864) (6,800) (6,731) (6,533) (3,807) (3,385) (3,208) Allow. for funds used during construct , Other income (expense), net Earnings before interest and taxes 20,211 24,710 22,574 21,012 10,298 7,519 8,409 Interest expense (5,728) (6,351) (6,717) (5,056) (2,220) (1,175) (912) Net income before taxes 14,484 18,360 15,856 15,956 8,078 6,344 7,497 Income taxes (4,818) (3,769) (5,556) (5,665) (3,072) (2,290) (2,391) Net Income Before Extras. 9,665 14,591 10,301 10,291 5,006 4,054 5,106 Extraordinary items Net income, as reported 9,665 14,591 10,333 10,291 5,006 4,054 5,194 Average daily throughput (m3/day) 35,025 34,699 33,745 34,296 33,375 31,233 29,216 * Results for the year ending December 31, 2008 are unaudited. Summary Net income (before extraordinary items) has been relatively stable in recent years, after doubling in 2005 as a result of completion of the expansion and reversal project in March of that year. Results in 2007 reflected unusually strong activity, with 2008 results reflecting a return to more normal earnings. In the event that transportation revenue in one year exceeds or falls short of TNPI s revenue requirement for that year, the variance is applied to the following year s revenue requirement, thereby enhancing stability of earnings. Outlook Net income is expected to decline modestly in 2009, partly due to the revenue requirement mechanism as well as a modestly lower allowed ROE (see Regulation and FSAs). Despite an expected drop in transported volumes, operating costs would likely decrease as well, as TNPI would utilize less power to run its pipeline, thereby reducing the negative effect on net income. 5 Corporates: Pipelines
33 Attachment 3 to IOL-Enbridge 131(a) Trans-Northern Pipelines Inc. April 28, 2009 Financial Profile For the year ended December 31 (CAD thousands where applicable) 2008* Net income before extras. 9,665 14,591 10,301 10,291 5,006 4,054 5,106 Depreciation and amortization 6,864 6,800 6,731 6,533 3,807 3,385 3,208 Future income taxes and other 1,002 (1,566) 1,740 2,181 2, (424) Cash Flow from Operations 17,532 19,825 18,771 19,006 11,004 7,589 7,890 Capital expenditures (3,297) (3,607) (5,191) (14,670) (123,822) (7,706) (8,965) Working capital changes (937) (7,718) 6,882 (757) 1,054 Free Cash Flow before dividends 14,628 16,947 12,643 (3,382) (105,936) (875) (22) Distributions to partners (5,253) (6,304) (5,253) (5,253) (4,202) (2,101) (3,152) Gross Free Cash Flow 9,375 10,643 7,390 (8,635) (110,138) (2,976) (3,173) Proceeds on sale of fixed assets Net Free Cash Flow 9,375 10,643 7,440 (8,635) (110,138) (2,976) (3,038) Inc. (dec.) in net debt (9,375) (10,643) (7,440) 8, ,138 2,976 3,038 Inc. (dec.) in equity Funding sources (9,375) (10,643) (7,440) 8, ,138 2,976 3,038 Total debt 119, , , , ,000 28,000 25,000 Total debt in capital structure 67.9% 71.2% 76.1% 79.1% 80.3% 45.9% 44.6% Cash flow/total debt 14.7% 15.4% 13.5% 12.9% 8.0% 27.1% 31.6% EBITDA interest coverage (times) EBIT interest coverage (times) Debt service coverage ratio (times) * Results for the year ending December 31, 2008 are unaudited. Summary Total debt-to-capital and cash flow-to-total debt ratios have improved since year-end 2004 due mainly to the amortization of debt ($10.5 million principal payment per year). Interest and debt service coverage ratios in 2006 reflected the full-year impact of the debt financing in late TNPI s interest and debt service coverage ratios remained relatively strong in 2007 and 2008, as expected, as cash flow was used to meet the $10.5 million per year Notes amortization and distributions to the partners. Results in 2007 reflected unusually strong activity, with 2008 results reflected a return to more normal cash flow. TNPI s defined benefit plan had a deficiency at year-end 2008 due to investment losses on the portfolio. Outlook Cash flow is expected to decline modestly in 2009, given the factors described in the Earnings and Outlook section above. DBRS does not expect any major capital projects in Scheduled debt amortization is expected to restore TNPI s total debt-to-capital ratio to the 45% to 50% range required by the regulator by year-end 2012 compared with 68% at year-end The ratio is expected to decline steadily to 60% at year-end 2010 and 50% at year-end The cash flow-to-total debt ratio is expected to steadily improve from 15% in 2008 to the 25% to 30% range in Corporates: Pipelines
34 Attachment 3 to IOL-Enbridge 131(a) Trans-Northern Pipelines Inc. April 28, 2009 Bank Lines, Liquidity, and Long-Term Debt Maturities TNPI has a $25 million revolving credit facility used for the issuance of bankers acceptances. The revolver is available for short-term debt requirements (e.g., to finance working capital, payment of principal and interest on the Notes, dividend payments and operating needs) and matures in July The Company is in the process of renegotiating the terms of the revolver. Approximately $16 million was drawn as of year-end Long-Term Debt Maturities As of December 31, and beyond Long-term debt $26.5 (1) $10.5 $10.5 $10.5 $10.5 $51.0 % of Total 22.2% 8.8% 8.8% 8.8% 8.8% 42.7% (1) Includes $16 million drawn under revolving credit facility. DBRS believes maturities are well spread out and should be manageable given the Company s stable business model. In December 2005, the Company issued $135 million of 4.742% Notes due in March The proceeds were used to repay amounts under an existing credit facility that had been used to finance construction of the expansion and reversal project. Term/Amortization: Amortization of principal of $5.25 million paid semi-annually with a $40.5 million balloon payment due at maturity. Remaining balance at December 31, 2008, was $103.5 million. Major Covenants: Maximum total debt-to-capital of 80% until September 30, 2010, 75% until September 30, 2013, and 60% thereafter. Additional terms include a limitation on subsidiary indebtedness, negative pledges, events of default and cross-defaults. Description of Operations TNPI s Expansion and Reversal Project 7 Corporates: Pipelines The project included expansion of the pipeline capacity between Montréal and Farran s Point, near Ingleside, Ontario (from 10,500 m 3 /d to 21,000 m 3 /d; 66,045 b/d to 132,090 b/d) and Farran s Point to Belleville, adding 1,500 m 3 /d to 11,500 m 3 /d (72,340 b/d). The project also involved a reversal of the pipeline flow between Farran s Point and Toronto to an east-west direction, plus construction and upgrade of certain pump stations and the construction of four storage tanks at Farran s Point. Project costs totalled $140 million and were fully financed by a bank bridge facility, which was subsequently refinanced by the debt issue in December 2005.
35 Attachment 3 to IOL-Enbridge 131(a) Trans-Northern Pipelines Inc. April 28, 2009 Eastern Canadian Refining Market Overview Canadian refineries are located to serve regional markets. Refineries in western Canada process domestic crude oil, while those in Québec and Atlantic Canada use offshore crude oil. Ontario refineries have generally been upgraded to meet regulatory requirements. These refineries use both domestic and imported crude oil, primarily processing light sweet and light sour crude oils, but also some heavy crude oils. The Ontario and Québec refined product markets are fairly self-sufficient, with most of the gasoline sold in these markets being produced by local refineries. Approximately 85% of Ontario s refined products demand is supplied by four refineries in southern Ontario via three product pipelines: TNPI, Sarnia Products Pipe Line and Sun-Canadian Pipe Line Company Limited. Of these three pipelines, only TNPI can ship products from Montréal to Toronto, Belleville, Kingston, Maitland and Ottawa in Ontario. The other two pipelines operate between Sarnia and Toronto. Ultramar has developed unit-train capability to move refined products from its Québec City refinery to eastern Ontario. Québec refined products demand is supplied by two refineries in Montréal, owned by Shell Canada and Petro-Canada, and by Ultramar s refinery near Québec City. Products destined for Ontario are shipped on low-cost TNPI or via alternative modes of transportation such as rail, truck and marine, all three of which are more expensive than TNPI. Canadian wholesale gasoline prices generally follow New York spot market prices as there are no import duties or trade restrictions on U.S. petroleum products. Outlook Changes in environmental legislation requiring substantial reductions in greenhouse gas (GHG) emissions, and reduced benzene and sulphur content in refined products could potentially reduce the amount of gasoline consumed in TNPI s service area, resulting in lower throughput volumes for TNPI. Details of the implementation of a federal GHG emissions-reduction program have not been finalized. These developments could have an impact on Ontario gasoline demand, much of which is based on discretionary driving activity. Any decline in demand would have a significant impact on Ontario and Québec refineries, which are configured to produce gasoline as their largest product. However, DBRS expects that the impact of potential legislation would be to dampen, not eliminate, refined products sales growth. Ontario refineries are expected to operate at lower utilization rates in the near term, mainly due to lower economic activity over the past year, with a direct negative impact on ground transportation (gasoline and diesel), as well as airlines (jet fuel). However, although volumes may decrease, operating costs would likely decrease as well, as TNPI would utilize less power to run its pipeline. European refineries are expected to continue to produce a surplus of gasoline over the medium term as their automobiles are more reliant on diesel engines, encouraged by historically higher gasoline prices and lower taxes on diesel fuel in Europe. The surplus gasoline can be exported to the Québec market, supplementing supply to southern Ontario through TNPI. DBRS believes that TNPI is well positioned to meet the supply requirements of the refined products market in southern Ontario. Longer term, DBRS believes that the development of the oil sands in Alberta may result in increased supply to southern Ontario. 8 Corporates: Pipelines
36 Attachment 3 to IOL-Enbridge 131(a) Trans-Northern Pipelines Inc. April 28, 2009 Refinery Capacity in Ontario and Quebec Refining Capacity DBRS Rating Refining Capacity Volume Owners (barrels per day) (%) Imperial Oil Limited AA (high) 233, % Shell Canada Limited Not Rated 202, % Petro-Canada A (low), URD 130, % Sub-total - Owners 565, % Third Party Suncor Energy Inc. A (low), URD 70, % Ultramar Ltd. Not Rated 215, % Sub-total - Third Party 285, % Total 850, % Sub-total - Ontario 375, % Sub-total - Quebec 475, % URD = Under Review Developing Supply of refined products for shipment on TNPI should be sufficient based on refining capacity in Ontario and Québec (approximately 850,000 b/d compared with throughput of approximately 210,000 b/d on TNPI). TNPI s three owners account for approximately two-thirds of the refining capacity in these provinces. This measure would rise to approximately three-quarters in the event that the merger of Petro-Canada and Suncor is completed. Following substantial capital investments, these refineries have the capability to process low-sulphur gasoline and, with the exception of Shell Canada s Sarnia refinery, ultra-low-sulphur diesel. However, Shell Canada has a 20-year contract with Suncor Energy Products Inc. to process ultra-low-sulphur diesel in a hydrotreater at its refinery. 9 Corporates: Pipelines
37 Attachment 3 to IOL-Enbridge 131(a) Trans-Northern Pipelines Inc. April 28, 2009 Trans-Northern Pipelines Inc. Balance Sheet (CAD thousands where applicable) Dec. 31, Dec. 31, Dec. 31, Dec. 31, Dec. 31, Dec. 31, Assets 2008* Liabilities & Equity 2008* Cash & equivalents Short-term debt Accounts receivable 5,979 6,676 6,458 A/P & accrued liab. 6,576 6,870 6,137 Materials and supplies 1,619 1,561 1,524 L.t.d. due in one yr. 10,500 10,500 10,500 Other current assets 1,136 1,183 1,434 Current Liabilities 17,076 17,370 16,637 Current Assets 9,150 9,962 9,815 Other long-term liab. 18,102 16,743 17,699 Net fixed assets 188, , ,959 Long-term debt 109, , ,000 Accrued benefit asset 3,413 3,056 2,446 Partners' equity 56,584 52,171 43,884 Total Assets 200, , ,221 Total Liabilities & Eq. 200, , ,221 Balance Sheet & For the year ended December 31 Liquidity Ratios 2008* Current ratio Net debt in capital structure 67.8% 71.1% 76.0% 79.1% 80.3% 45.7% 44.4% Total debt in capital structure 67.9% 71.2% 76.1% 79.1% 80.3% 45.9% 44.6% Adjusted total debt to capital (1) 68.9% 72.1% 76.8% 79.7% 80.8% 49.6% 48.5% Partners' equity in capital structure 32.1% 28.8% 23.9% 20.9% 19.7% 54.1% 55.4% Deemed partners' equity 55% 55% 55% 55% 55% 55% 55% Cash flow/total debt 14.7% 15.4% 13.5% 12.9% 8.0% 27.1% 31.6% Cash flow/net capital expenditures (Cash flow - divs.)/net capex Dividends/net income (before extras.) 54.3% 43.2% 51.0% 51.0% 84.0% 51.8% 61.7% Accum. depreciation/gross fixed assets 30.0% 28.2% 26.8% 24.9% 24.0% 47.3% 47.6% Coverage Ratios (2) EBIT interest coverage (times) EBITDA interest coverage (times) Fixed-charges coverage (times) Debt service coverage ratio (times) Profitability Ratios Operating margin 34.1% 39.9% 35.9% 36.5% 27.3% 23.0% 28.0% Profit margin 16.4% 23.6% 17.0% 18.0% 15.1% 13.1% 17.2% Return on partners' equity (bef. extras.) 17.8% 30.4% 24.9% 28.4% 15.0% 12.7% 17.8% Allowed ROE 8.96% 8.71% 9.13% 9.71% 9.81% 10.04% 9.78% Return on capital 7.5% 10.3% 7.9% 7.6% 5.5% 8.2% 10.8% Selected Data (Cdn$, thousands) Transportation revenue 58,890 61,749 60,424 57,145 33,206 30,875 29,609 Operating income 20,062 24,614 21,679 20,879 9,075 7,091 8,289 Net income before extras. 9,665 14,591 10,301 10,291 5,006 4,054 5,106 Reported earnings 9,665 14,591 10,333 10,291 5,006 4,054 5,194 Cash flow from operations 17,532 19,825 18,771 19,006 11,004 7,589 7,890 Capital expenditures (3,297) (3,607) (5,191) (14,670) (123,822) (7,706) (8,965) Working capital changes (937) (7,718) 6,882 (757) 1,054 Free cash flow before dividends 14,628 16,947 12,643 (3,382) (105,936) (875) (22) Distributions to partners (5,253) (6,304) (5,253) (5,253) (4,202) (2,101) (3,152) Gross free cash flow 9,375 10,643 7,390 (8,635) (110,138) (2,976) (3,173) * Results for the year ending December 31, 2008 are unaudited. (1) Includes operating leases. (2) Excludes AFUDC and capitalized interest. n.a. = not applicable. 10 Corporates: Pipelines
38 Attachment 3 to IOL-Enbridge 131(a) Trans-Northern Pipelines Inc. April 28, 2009 Rating Debt Rating Rating Action Trend Senior Unsecured Notes A (low) Confirmed Stable Rating History Current Senior Unsecured Notes A (low) A (low) A (low) A (low) A (low) Related Research DBRS Confirms Imperial Oil at AA (high) and R-1 (middle), April 8, DBRS Places Petro-Canada s R-1 (low) and A (low) Ratings Under Review with Developing Implications, March 23, Note: All figures are in Canadian dollars unless otherwise noted. Copyright 2009, DBRS Limited and DBRS, Inc. (collectively, DBRS). All rights reserved. The information upon which DBRS ratings and reports are based is obtained by DBRS from sources believed by DBRS to be accurate and reliable. DBRS does not perform any audit and does not independently verify the accuracy of the information provided to it. DBRS ratings, reports and any other information provided by DBRS are provided as is and without warranty of any kind. DBRS hereby disclaims any representation or warranty, express or implied, as to the accuracy, timeliness, completeness, merchantability, fitness for any particular purpose or non-infringement of any of such information. In no event shall DBRS or its directors, officers, employees, independent contractors, agents and representatives (collectively, DBRS Representatives) be liable (1) for any inaccuracy, delay, interruption in service, error or omission or for any resulting damages or (2) for any direct, indirect, incidental, special, compensatory or consequential damages with respect to any error (negligent or otherwise) or other circumstance or contingency within or outside the control of DBRS or any DBRS Representatives in connection with or related to obtaining, collecting, compiling, analyzing, interpreting, communicating, publishing or delivering any information. Ratings and other opinions issued by DBRS are, and must be construed solely as, statements of opinion and not statements of fact as to credit worthiness or recommendations to purchase, sell or hold any securities. DBRS receives compensation, ranging from US$1,000 to US$750,000 (or the applicable currency equivalent) from issuers, insurers, guarantors and/or underwriters of debt securities for assigning ratings. This publication may not be reproduced, retransmitted or distributed in any form without the prior written consent of DBRS. 11 Corporates: Pipelines
39 Attachment 4 to IOL-Enbridge 131(a)

40 Attachment 4 to IOL-Enbridge 131(a)


41 Attachment 4 to IOL-Enbridge 131(a)

42 Attachment 4 to IOL-Enbridge 131(a)

43 Attachment 4 to IOL-Enbridge 131(a)


44 Attachment 4 to IOL-Enbridge 131(a)


45 Attachment 4 to IOL-Enbridge 131(a)


46 Attachment 4 to IOL-Enbridge 131(a)


47 Attachment 4 to IOL-Enbridge 131(a)
48 Attachment 5 to IOL-Enbridge 131(a)

49 Attachment 5 to IOL-Enbridge 131(a)


50 Attachment 5 to IOL-Enbridge 131(a)

51 Attachment 5 to IOL-Enbridge 131(a)


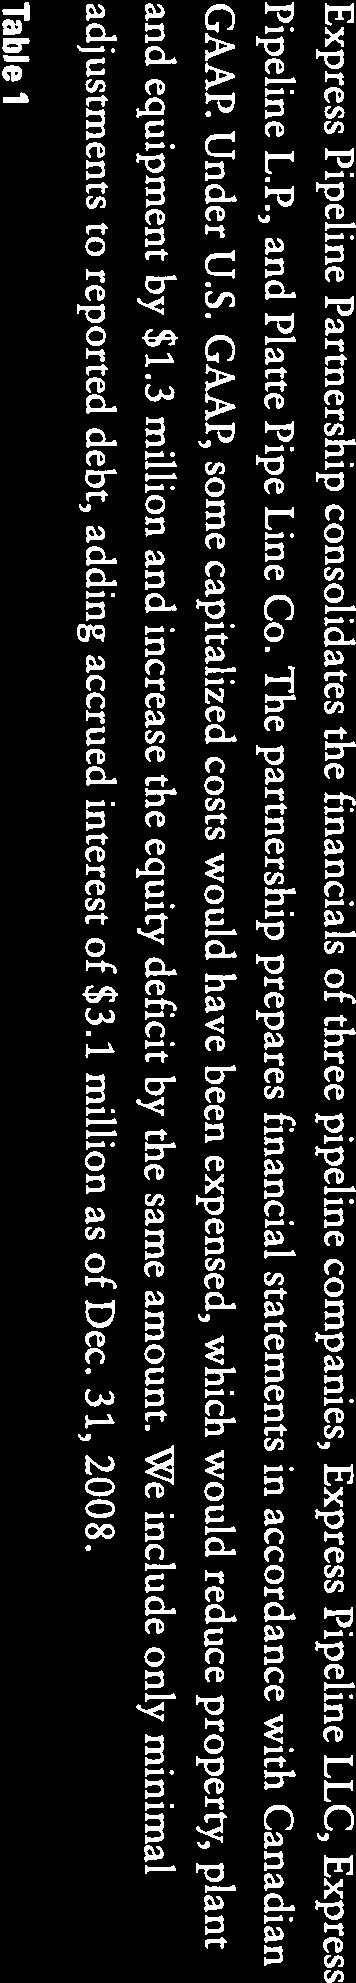
52 Attachment 5 to IOL-Enbridge 131(a)

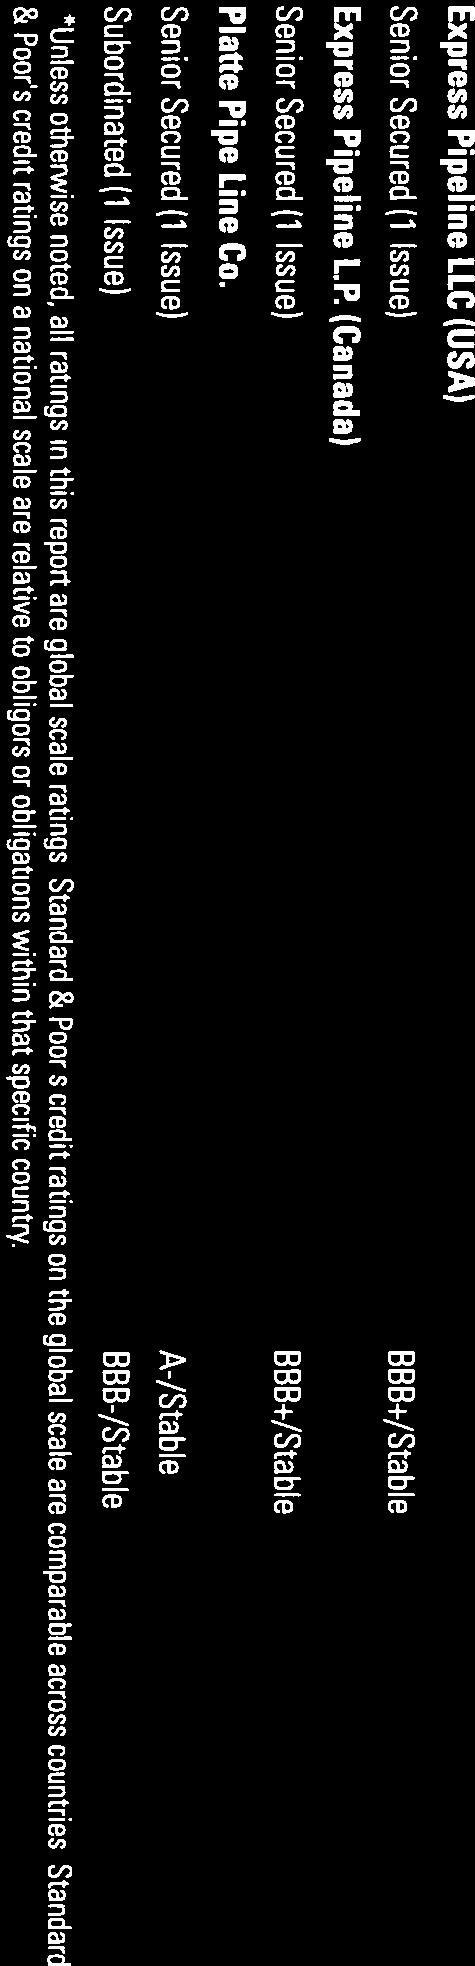
53 Attachment 5 to IOL-Enbridge 131(a)

54 Attachment 5 to IOL-Enbridge 131(a)
55 Attachment 1 to IOL-Enbridge 131(b)


56 Attachment 1 to IOL-Enbridge 131(b)


57 Attachment 1 to IOL-Enbridge 131(b)

58 Attachment 1 to IOL-Enbridge 131(b)


59 Attachment 1 to IOL-Enbridge 131(b)


60 Attachment 1 to IOL-Enbridge 131(b)

61 Attachment 1 to IOL-Enbridge 131(b)
Global Credit Research Credit Opinion 8 JUL Credit Opinion: Enbridge Inc. Enbridge Inc. Calgary, Alberta, Canada. Ratings
 Global Credit Research Credit Opinion 8 JUL 2008 Credit Opinion: Calgary, Alberta, Canada Ratings Category Moody's Rating Outlook Stable Issuer Rating Baa1 Senior Unsecured Baa1 Subordinate Shelf (P)Baa2
Toronto Hydro Corporation
 Rating Report Previous Report: October 8, 2008 Analysts Robert Filippazzo +1 416 597 7340 rfilippazzo@dbrs.com Michael Caranci +1 416 597 7304 mcaranci@dbrs.com The Company Toronto Hydro is a holding company
Ram Vadali, CFA, CPA
 Filed: 2018-04-05, EB-2017-0306/EB-2017-0307, Exhibit JT1.12, Attachment 1, Page 1 of 10 Rating Report Union Gas Limited Ratings Ram Vadali, CFA, CPA +1 416 597 7526 rvadali@dbrs.com Ravikanth Rai, CFA,
Electricity Distributors Finance Corporation
 Rating Report Previous Report: March 18, 2011 Analysts Eric Eng, MBA +1 416 597 7578 eeng@dbrs.com James Jung, FRM, CMA, CFA +1 416 597 7577 jjung@dbrs.com William Vaz-Jones +1 416 597 7314 wjones@dbrs.com
Liquids Pipeline Expansion Projects Presentation May 17, EEP Slides posted at
 Liquids Pipeline Expansion Projects Presentation May 17, 2012 EEP Slides posted at www.enbridgepartners.com/q Legal Notice This presentation includes certain forward looking information ( FLI ) to provide
Supplementary Financial Information Package
 Supplementary Financial Information Package 2012-2014 (unaudited) This Supplementary Financial Information Package should be read in conjunction with the management s discussion and analysis, consolidated
Low Risk, Sustainable Growth
 Low Risk, Sustainable Growth 7 th Annual Wachovia Pipeline and MLP Symposium December 2008 #1 Legal Notice Certain information during this presentation will constitute forward-looking statements. These
Gaz Métro Limited Partnership
 Gaz Métro Limited Partnership Rating History Stability Rating Summary Legend Stability Rating Update DBRS has confirmed the stability rating of Gaz Métro Limited Partnership (GMLP or the Partnership) at
The Shape I m In - Western Canadian Crude Price Collapse
 A RBN Energy Drill Down Report Copyright 2018 RBN Energy The Shape I m In - Western Canadian Crude Price Collapse Rising Production, Pipeline Takeaway Constraints and Huge WCS Price Discounts Western Canadian
Enbridge Energy Partners, L.P. Capital Link Master Limited Partnership Investing Forum Mark A. Maki, President, Enbridge Energy Partners, L.P.
 Enbridge Energy Partners, L.P. Capital Link Master Limited Partnership Investing Forum Mark A. Maki, President, Enbridge Energy Partners, L.P. March 5, 2015 enbridgepartners.com Legal Notice This presentation
KINDER MORGAN CANADA LIMITED ANNOUNCES 2018 FINANCIAL EXPECTATIONS Trans Mountain Expansion Project Pursuing a Primarily Permitting Spend Strategy
 \ KINDER MORGAN CANADA LIMITED ANNOUNCES 2018 FINANCIAL EXPECTATIONS Trans Mountain Expansion Project Pursuing a Primarily Permitting Spend Strategy CALGARY, ALBERTA, Dec. 4, 2017 - Kinder Morgan Canada
Liquids Pipelines. Excellent Foundation for Continued Growth. ~25% of all crude oil produced in N. America. ~2/3 rds of Canadian crude exports
 Liquids Pipelines Guy Jarvis President & EVP, Liquids Pipelines Excellent Foundation for Continued Growth Transports ~2/3 rds of Canadian crude exports Transports ~25% of all crude oil produced in N. America
Concentra Financial Services Association
 Rating Report Previous Report: May 26, 2014 Analysts Robert Long, CFA +1 416 597 7536 rlong@dbrs.com John van Boxmeer, CFA +1 416 597 7388 jvanboxmeer@dbrs.com The Company Concentra is Canada s only cooperative
NATIONAL ENERGY BOARD HEARING ORDER OH TRANSCANADA KEYSTONE PIPELINE GP LTD. ( KEYSTONE ) KEYSTONE XL PIPELINE APPLICATION
 KEYSTONE XL PIPELINE APPLICATION") File OF-Fac-Oil-T-00-0 0 NATIONAL ENERGY BOARD HEARING ORDER TRANSCANADA KEYSTONE PIPELINE GP LTD. ( KEYSTONE ) KEYSTONE XL PIPELINE APPLICATION WRITTEN EVIDENCE OF ENBRIDGE PIPELINES INC. ( ENBRIDGE )
File OF-Fac-Oil-T-00-0 0 NATIONAL ENERGY BOARD HEARING ORDER TRANSCANADA KEYSTONE PIPELINE GP LTD. ( KEYSTONE ) KEYSTONE XL PIPELINE APPLICATION WRITTEN EVIDENCE OF ENBRIDGE PIPELINES INC. ( ENBRIDGE )
Crude Oil Forecast, Markets and Pipeline Expansions June 2007
 REPORT Crude Oil Forecast, Markets and Pipeline Expansions June 2007 Background The Canadian Association of Petroleum Producers (CAPP) represents 150 producer member companies that explore for, develop
Enbridge Energy Partners, L.P. MLPA Investor Conference June 1-3, 2016
 Enbridge Energy Partners, L.P. MLPA Investor Conference June 1-3, 2016 Legal Notice This presentation includes forward-looking statements and projections, which are statements that do not relate strictly
Action Notes. Enbridge Inc. (ENB-T, ENB-N) C$ Impact Neutral.
 C$ Impact Neutral.") 1 of 6 Pipelines, Power & Utilities Recommendation: Risk: 12-Month Target Price: HOLD Unchanged LOW C$39.00 Unchanged 12-Month Total Return: 8.3% Market Data (C$) Current Price $37.15 52-Wk Range $31.75-$41.48
1 of 6 Pipelines, Power & Utilities Recommendation: Risk: 12-Month Target Price: HOLD Unchanged LOW C$39.00 Unchanged 12-Month Total Return: 8.3% Market Data (C$) Current Price $37.15 52-Wk Range $31.75-$41.48
Inter Pipeline Fund Announces Very Strong First Quarter 2010 Results. Attractive payout ratio before sustaining capital* of 67%
 News Release Inter Pipeline Fund Announces Very Strong First Quarter 2010 Results CALGARY, ALBERTA, MAY 6, 2010: Inter Pipeline Fund ( Inter Pipeline ) (TSX: IPL.UN) announced today its financial and operating
Enbridge Income Fund Holdings Inc. reports strong third quarter financial results; Declares Monthly Dividend and Amendments to DRIP
 NEWS RELEASE Enbridge Income Fund Holdings Inc. reports strong third quarter financial results; Declares Monthly Dividend and Amendments to DRIP HIGHLIGHTS (all financial figures are unaudited and in Canadian
Second Quarter 2018: Supplemental Package
 Second Quarter 2018: Supplemental Package (unaudited) LEGAL NOTICE This Supplemental Package has been prepared and is presented solely for the purpose of providing readers with certain financial information
Enbridge Income Fund Holdings Inc.
 Enbridge Income Fund Holdings Inc. Annual General Meeting of Shareholders May 11, 2017 Perry Schuldhaus President Forward Looking Statements This presentation includes certain forward looking statements
Fourth Quarter 2017: Supplemental Package
 Fourth Quarter : Supplemental Package (unaudited) respective entities Fourth Quarter news release and on their respective websites. LEGAL NOTICE This Supplemental Package has been prepared and is presented
ENBRIDGE INCOME PARTNERS LP MANAGEMENT S DISCUSSION AND ANALYSIS
 ENBRIDGE INCOME PARTNERS LP MANAGEMENT S DISCUSSION AND ANALYSIS 2018 GLOSSARY Adjusted EBITDA ASU Canadian L3R Program DCF EBITDA ECT EEP EIPLP Enbridge ENF EPI FERC Fund Units IDR IJT MD&A MNPUC the
Third Quarter 2017: Supplemental Package
 Third Quarter 2017: Supplemental Package (unaudited) LEGAL NOTICE This Supplemental Package has been prepared and is presented solely for the purpose of providing readers with certain financial information
Second Quarter 2017: Supplemental Package
 Second Quarter : Supplemental Package (unaudited) LEGAL NOTICE This Supplemental Package has been prepared and is presented solely for the purpose of providing readers with certain financial information
Fourth Quarter 2016: Supplemental Package
 Fourth Quarter 2016: Supplemental Package (unaudited) LEGAL NOTICE This Supplemental Package has been prepared and is presented solely for the purpose of providing readers with certain financial information
ENBRIDGE ENERGY PARTNERS LP
 ENBRIDGE ENERGY PARTNERS LP FORM 10-Q (Quarterly Report) Filed 05/01/15 for the Period Ending 03/31/15 Address 1100 LOUISIANA ST SUITE 3300 HOUSTON, TX 77002-5217 Telephone 713-821-2000 CIK 0000880285
Robert Streda
 Rating Report Daimler AG Ratings Robert Streda +1 416 597 7397 rstreda@dbrs.com Cathy Cheng +1 416 597 7538 ccheng@dbrs.com Kam Hon +1 416 597 7543 khon@dbrs.com Debt Rating Rating Action Trend Daimler
KINDER MORGAN CANADA LIMITED ANNOUNCES SECOND QUARTER RESULTS AND DECLARES PARTIAL-PERIOD DIVIDEND OF $ PER RESTRICTED VOTING SHARE
 \ KINDER MORGAN CANADA LIMITED ANNOUNCES SECOND QUARTER RESULTS AND DECLARES PARTIAL-PERIOD DIVIDEND OF $0.0571 PER RESTRICTED VOTING SHARE Continued Progress on Trans Mountain Expansion Project CALGARY,
ENBRIDGE INCOME FUND MANAGEMENT S DISCUSSION AND ANALYSIS
 ENBRIDGE INCOME FUND MANAGEMENT S DISCUSSION AND ANALYSIS September 30, 2013 MANAGEMENT S DISCUSSION & ANALYSIS FOR THE THREE AND NINE MONTHS ENDED SEPTEMBER 30, 2013 This Management s Discussion and Analysis
IPL Energy Inc. annual report Brought to you by Global Reports
 IPL Energy Inc. annual report 1996 corporate Profile IPL Energy Inc. Pipeline Canada Interprovincial Pipe Line Inc. Interprovincial Pipeline (NW) Ltd. Producers Pipeline Inc. United States Lakehead Pipeline
2006 Annual Review. Enbridge Energy Management, L.L.C. Enbridge Energy Partners, L.P Annual Report
 Enbridge Energy Partners 2006 Annual Report 2006 Annual Review Enbridge Energy Partners, L.P. Enbridge Energy Management, L.L.C. Adjusted Earnings * Annual Distributions 2.83 3.60 3.70 3.70 3.70 3.70 1.76
Holly Energy Partners, L.P. Reports Second Quarter Results
 Holly Energy Partners, L.P. Reports Second Quarter Results August 1, 2018 DALLAS--(BUSINESS WIRE)--Aug. 1, 2018-- Holly Energy Partners, L.P. ( HEP or the Partnership ) (NYSE:HEP) today reported financial
NEB No. 435 FERC No Cancels NEB No. 424 Cancels FERC No ENBRIDGE PIPELINES INC. ENBRIDGE ENERGY, LIMITED PARTNERSHIP
 Cancels NEB No. 424 Cancels FERC No. 1.10.0 ENBRIDGE PIPELINES INC. IN CONNECTION WITH ENBRIDGE ENERGY, LIMITED PARTNERSHIP INTERNATIONAL JOINT RATE TARIFF APPLYING ON CRUDE PETROLEUM, FROM POINTS IN THE
INFRASTRUCTURE 8 LOGISTICS 10 WHOLESALE 10
 Contents BUSINESS OVERVIEW 2 SELECTED FINANCIAL INFORMATION 2 2018 REVIEW 3 PROJECT DEVELOPMENTS, ACQUISITIONS AND MARKET OUTLOOK 5 RESULTS OF CONTINUING OPERATIONS 7 INFRASTRUCTURE 8 LOGISTICS 10 WHOLESALE
KINDER MORGAN CANADA LIMITED DECLARES DIVIDENDS AND ANNOUNCES RESULTS FOR THIRD QUARTER OF 2017
 \ KINDER MORGAN CANADA LIMITED DECLARES DIVIDENDS AND ANNOUNCES RESULTS FOR THIRD QUARTER OF 2017 Limited Construction Activity Begins on Trans Mountain Expansion Project CALGARY, ALBERTA, October 18,
Energy Business Unit & Marketing. March 31, 2015 Ray Reipas, Senior Vice President, Energy
 March 31, 2015 Ray Reipas, Senior Vice President, Energy Forward Looking Information Both these slides and the accompanying oral presentation contain certain forward-looking statements within the meaning
Holly Energy Partners, L.P. Reports First Quarter Results
 May 3, 2016 Holly Energy Partners, L.P. Reports First Quarter Results DALLAS--(BUSINESS WIRE)-- Holly Energy Partners, L.P. ("HEP" or the "Partnership") (NYSE:HEP) today reported financial results for
The Alliance System. Alliance Pipeline Limited Partnership Management s Discussion and Analysis For the year ended December 31, 2016
 Management s Discussion and Analysis The Alliance System The Alliance System (System) consists of a 3,849 kilometre (km) (2,392 mile) integrated Canadian and U.S. natural gas transmission pipeline, delivering
ENBRIDGE INC. MANAGEMENT S DISCUSSION AND ANALYSIS
 ENBRIDGE INC. MANAGEMENT S DISCUSSION AND ANALYSIS December 31, 2017 MANAGEMENT'S DISCUSSION AND ANALYSIS OF FINANCIAL CONDITIONS AND RESULTS OF OPERATIONS INTRODUCTION The following discussion and analysis
Market Access for Land Locked North American Crude Oil
 Market Access for Land Locked North American Crude Oil TD London Energy Conference January 14, 2013 J. Richard Bird Executive Vice President, Chief Financial Officer & Corporate Development Legal Notice
NEB No. 441 FERC No Cancels NEB No. 436 Cancels FERC No ENBRIDGE PIPELINES INC. ENBRIDGE ENERGY, LIMITED PARTNERSHIP
 Cancels NEB No. 436 Cancels FERC No. 45.15.1 ENBRIDGE PIPELINES INC. IN CONNECTION WITH ENBRIDGE ENERGY, LIMITED PARTNERSHIP INTERNATIONAL JOINT RATE TARIFF APPLYING ON CRUDE PETROLEUM, CONDENSATES AND
Providing Market Access for Discounted Canadian and Bakken Crude Oil
 Providing Market Access for Discounted Canadian and Bakken Crude Oil RBC Capital Markets Crude and Refined Investor Day Toronto April 4, 2013 Vern Yu Senior Vice President, Business & Market Development
UBS MLP One-on-One Conference. January 2014
 UBS MLP One-on-One Conference January 2014 Forward-looking Information Certain matters contained in this presentation include "forward-looking statements" within the meaning of Section 27A of the Securities
Inter Pipeline Fund Announces Strong Third Quarter 2010 Results
 News Release Inter Pipeline Fund Announces Strong Third Quarter 2010 Results CALGARY, ALBERTA, NOVEMBER 4, 2010: Inter Pipeline Fund ( Inter Pipeline ) (TSX: IPL.UN) announced today its financial and operating
GRANT MARTIN. Forum. Impact of the Economic Downturn on the Development of the Canadian Oil Sands
 Forum Impact of the Economic Downturn on the Development of the Canadian Oil Sands GRANT MARTIN Director Supply Chain Management Commercial Support TransCanada TransCanada Keystone Pipeline Canadian Market
Investor Presentation. Third Quarter 2015
 Investor Presentation Third Quarter 2015 Forward-looking Information Certain matters contained in this presentation include "forward-looking statements" within the meaning of Section 27A of the Securities
NEB No. 423 FERC No Cancels NEB No. 414 Cancels FERC No ENBRIDGE PIPELINES INC. ENBRIDGE ENERGY, LIMITED PARTNERSHIP
 Cancels NEB No. 414 Cancels FERC No. 45.13.0 ENBRIDGE PIPELINES INC. IN CONNECTION WITH ENBRIDGE ENERGY, LIMITED PARTNERSHIP INTERNATIONAL JOINT RATE TARIFF APPLYING ON CRUDE PETROLEUM, CONDENSATES AND
Kinder Morgan Canada
 *Information contained in this presentation is dated as of 3/24/2011. For current project scope and information on the Trans Mountain Pipeline expansion project, please see www.transmountain.com Kinder
Enbridge reports second quarter adjusted earnings of $328 million or $0.40 per common share
 NEWS RELEASE Enbridge reports second quarter adjusted earnings of $328 million or $0.40 per common share HIGHLIGHTS (all financial figures are unaudited and in Canadian dollars unless otherwise noted)
Historical price multiple calculations use FYE prices. Source: Reuters; Company reports; Scotia Capital estimates.
 1 Enbridge Inc. Sam Kanes, CA, CFA - 416-863-7798 sam_kanes@scotiacapital.com (ENB-T C$37.09) (ENB-N US$35.17) Ben Isaacson, MBA, CFA - 416-863-7846 ben_isaacson@scotiacapital.com Rating: 1-Sector Outperform
Financial Institutions DBRS: Basel IV - Significant but Manageable Impact for Resilient Dutch Banks
 Financial Institutions DBRS: Basel IV - Significant but Manageable Impact for Resilient Dutch Banks Solid domestic economic growth supported FY2017 performance. Strong capital position and profitability
Crude Oil. Forecast, Markets & Pipelines. June Crude Oil Forecast, Markets & Pipelines 1
 Crude Oil Forecast, Markets & Pipelines June 2010 Crude Oil Forecast, Markets & Pipelines 1 Disclaimer: This publication was prepared by the Canadian Association of Petroleum Producers (CAPP). While it
Gaz Métro inc. Société en commandite Gaz Métro. Gaz Métro Limited Partnership 12 mos ended For the year ended September 30
 Société en commandite Gaz Métro Rating Report Report Date: Cause September tarifaire 19, 2007 2009, R-3662-2008 Gaz Métro inc. RATING Debt Rated Rating Action Rating Trend Commercial Paper Confirmed R-1
Presentation to the Crude Oil Quality Group. Norm Rinne Director, Business Development
 Presentation to the Crude Oil Quality Group Norm Rinne Director, Business Development November 9, 2006 Kinder Morgan Assets 2 2 Pacific Trans Mountain Northern TransColorado CALNEV 2 Pacific 3 Corridor
INVESTOR PRESENTATION MAY 2018
 INVESTOR PRESENTATION MAY 2018 Safe Harbor Disclosure Statement Statements made during the course of this presentation that are not historical facts are forward-looking statements within the meaning of
Quarterly Report to Shareholders
 TRANSCANADA PIPELINES LIMITED FIRST QUARTER 2011 Quarterly Report to Shareholders Management's Discussion and Analysis Management's Discussion and Analysis (MD&A) dated April 28, 2011 should be read in
Tar Sands US Infrastructure Development
 Plains Justice Environmental Justice for the Great Plains Tar Sands US Infrastructure Development Paul Blackburn, J.D. Staff Attorney, Plains Justice 100 First Street Southwest Cedar Rapids, IA 52404 Tel.
Inter Pipeline Fund Announces Very Strong Second Quarter 2010 Results
 News Release Inter Pipeline Fund Announces Very Strong Second Quarter 2010 Results CALGARY, ALBERTA, AUGUST 5, 2010: Inter Pipeline Fund ( Inter Pipeline ) (TSX: IPL.UN) announced today its financial and
BUSINESS UNIT HEADER IMAGE GOES HERE
 BUSINESS UNIT HEADER IMAGE GOES HERE 2014 Fourth Quarter Financial & Strategic Update Al Monaco President & CEO John Whelen Executive Vice President & CFO Guy Jarvis President Liquids Pipelines Legal Notice
Third QUARTER 2018 For the three and nine months ended September 30, 2018
 Third QUARTER For the three and nine months ended September 30, This Management s Discussion and Analysis (MD&A) for ENTREC Corporation ( ENTREC, the Company, we, us or our ) was prepared as of November
ENBRIDGE INC. ANNUAL INFORMATION FORM FOR THE YEAR ENDED DECEMBER 31, 2016
 ENBRIDGE INC. ANNUAL INFORMATION FORM FOR THE YEAR ENDED DECEMBER 31, 2016 February 17, 2017 Enbridge Inc. 2016 Annual Information Form TABLE OF CONTENTS DOCUMENTS INCORPORATED BY REFERENCE As of the date
UBS MLP One-on-One Conference
 UBS MLP One-on-One Conference January 12-13 Park City, UT Forward-looking Information Certain matters contained in this presentation include "forward-looking statements" within the meaning of Section 27A
Market Access - The Strategic Imperative Continues
 Market Access - The Strategic Imperative Continues Al Monaco, President & CEO TD Securities - Calgary Energy Conference July 9, 2014 Agenda 1. The global energy context 2. North American crude oil fundamentals
Expanding Market Access for Alberta s Oil Resources
 Expanding Market Access for Alberta s Oil Resources Presentation for the Crude Markets & Rail Take Away Summit Richard Masson, CEO Alberta Petroleum Marketing Commission (APMC) Agenda Alberta s Challenge
April 29, Filed Electronically Original via Mail
 Suite 1500, Bow Valley Square 4 250-6 th Ave SW Calgary, Alberta T2P 3H7 Declan Russell Manager, Regulatory Affairs April 29, 2016 Filed Electronically Original via Mail Ms. Sheri Young Secretary of the
Quarterly Report to Shareholders
 TRANSCANADA PIPELINES LIMITED THIRD QUARTER 2012 Quarterly Report to Shareholders Management's Discussion and Analysis This Management's Discussion and Analysis (MD&A) dated October 29, 2012 should be
Morgan Stanley Midstream MLP and Diversified Natural Gas Corporate Access Event. March 2014
 Morgan Stanley Midstream MLP and Diversified Natural Gas Corporate Access Event March 2014 Forward-looking Information Certain matters contained in this presentation include "forward-looking statements"
Third Quarter Financial statements and management's discussion and analysis of financial condition and operating results
 Third Quarter 2016 Financial statements and management's discussion and analysis of financial condition and operating results For the nine months ended September 30, 2016 Consolidated statement of income
Enbridge Announces 33% Dividend Increase, Financial Restructuring Plans, Revised Payout Policy and 2015 Adjusted Earnings Guidance
 NEWS RELEASE Enbridge Announces 33% Dividend Increase, Financial Restructuring Plans, Revised Payout Policy and 2015 Adjusted Earnings Guidance 33% dividend increase, payable March 1, 2015 Plans to transfer
Rocky Mountain Power Exhibit RMP (BNW-7) Docket No Witness: Bruce N. Williams BEFORE THE PUBLIC SERVICE COMMISSION OF THE STATE OF UTAH
 Docket No Witness: Bruce N. Williams BEFORE THE PUBLIC SERVICE COMMISSION OF THE STATE OF UTAH") Exhibit RMP (BNW-7) BEFORE THE PUBLIC SERVICE COMMISSION OF THE STATE OF UTAH ROCKY MOUNTAIN POWER Exhibit Accompanying Direct Testimony of Bruce N. Williams May 8, 2013 Moody s Investors Service January
Exhibit RMP (BNW-7) BEFORE THE PUBLIC SERVICE COMMISSION OF THE STATE OF UTAH ROCKY MOUNTAIN POWER Exhibit Accompanying Direct Testimony of Bruce N. Williams May 8, 2013 Moody s Investors Service January
INVESTOR PRESENTATION JANUARY 2018
 INVESTOR PRESENTATION JANUARY 2018 Safe Harbor Disclosure Statement Statements made during the course of this presentation that are not historical facts are forward-looking statements within the meaning
141 FERC 61,056 UNITED STATES OF AMERICA FEDERAL ENERGY REGULATORY COMMISSION
 141 FERC 61,056 UNITED STATES OF AMERICA FEDERAL ENERGY REGULATORY COMMISSION Before Commissioners: Jon Wellinghoff, Chairman; Philip D. Moeller, John R. Norris, Cheryl A. LaFleur, and Tony T. Clark. Kinder
COQG and CCQTA Joint Industry Meetings. Canada s Crude Oil Outlook
 COQG and CCQTA Joint Industry Meetings Canada s Crude Oil Outlook June 24-25, 2008 Calgary, Alberta Barry Lynch Manager, Oil Markets & Pipelines Canadian Association of Petroleum Producers 140 producer
Investor Presentation: May 2016
 Investor Presentation: May 2016 Safe Harbor Disclosure Statement Statements made during the course of this presentation that are not historical facts are forward looking statements within the meaning of
Enbridge Inc. First Quarter Interim Report to Shareholders For the three months ended March 31, 2015
 Enbridge Inc. First Quarter Interim Report to Shareholders For the three months ended March 31, 2015 NEWS RELEASE Enbridge reports first quarter adjusted earnings of $468 million or $0.56 per common share
Re-evaluating the Need for the Trans Mountain Expansion Project: the Impacts of Weaker Oil Markets and Keystone XL
 Re-evaluating the Need for the Trans Mountain Expansion Project: the Impacts of Weaker Oil Markets and Keystone XL Dr. Thomas Gunton Director of the Resource and Environmental Planning Program School of
June. Crude Oil Forecast, Markets & Pipelines
 June Crude Oil 2011 Forecast, Markets & Pipelines Crude Oil Forecast, Markets & Pipelines 1 Disclaimer: This publication was prepared by the Canadian Association of Petroleum Producers (CAPP). While it
Enbridge Income Fund Holdings Inc.
 Enbridge Income Fund Holdings Inc. Second Quarter Interim Report to Shareholders For the six months ended June 30, 2017 HIGHLIGHTS (all financial figures are unaudited and in Canadian dollars unless otherwise
Perspectives on North American Pipeline Infrastructure Opportunities
 Perspectives on North American Pipeline Infrastructure Opportunities IPLOCA September 2009 Don Wishart, EVP Operations & Major Projects TransCanada Corporation Forward-Looking Information This presentation
Pembina Pipeline Income Fund
 2 0 0 7 I N T E R I M R E P O R T 1 PEMBINA DELIVERS RECORD FIRST QUARTER RESULTS The Fund distributed $0.33 per Trust Unit during the first quarter of 2007 for total cash distributions of $42.1 million.
FORM 10-Q. Magellan Midstream Partners, L.P. (Exact name of registrant as specified in its charter)
") UNITED STATES SECURITIES AND EXCHANGE COMMISSION Washington, D.C. 20549 FORM 10-Q X QUARTERLY REPORT PURSUANT TO SECTION 13 OR 15(d) OF THE SECURITIES EXCHANGE ACT OF 1934 For the quarterly period ended
UNITED STATES SECURITIES AND EXCHANGE COMMISSION Washington, D.C. 20549 FORM 10-Q X QUARTERLY REPORT PURSUANT TO SECTION 13 OR 15(d) OF THE SECURITIES EXCHANGE ACT OF 1934 For the quarterly period ended
ENBRIDGE INCOME FUND MANAGEMENT S DISCUSSION AND ANALYSIS
 ENBRIDGE INCOME FUND MANAGEMENT S DISCUSSION AND ANALYSIS June 30, 2018 GLOSSARY Adjusted EBITDA DCF EBITDA ECT EEP EIPLP Enbridge ENF FERC Fund Units IJT MD&A MTN the Fund the Fund Group the Manager or
BRIK Infrastructure and Bitumen Supply Availability
 Government of Alberta BRIK Infrastructure and Bitumen Supply Availability Submitted to Industry: November 2009 Oil Sands Operations, Department of Energy 11/9/2009 Executive Summary Based on bitumen production
Spectra Energy Partners: Moving Ahead, Building Value
 FIRST QUARTER 2013 EARNINGS REVIEW Spectra Energy Partners: Moving Ahead, Building Value May 3, 2013 Safe Harbor Statement Some of the statements in this document concerning future company performance
NEWS RELEASE. Enbridge Reports 2014 Results. HIGHLIGHTS (all financial figures are unaudited and in Canadian dollars unless otherwise noted)
") NEWS RELEASE Enbridge Reports 2014 Results HIGHLIGHTS (all financial figures are unaudited and in Canadian dollars unless otherwise noted) Fourth quarter earnings were $88 million; earnings for the full
NEWS RELEASE Enbridge Reports 2014 Results HIGHLIGHTS (all financial figures are unaudited and in Canadian dollars unless otherwise noted) Fourth quarter earnings were $88 million; earnings for the full
Transformation through Distinctive Performance Simmons Energy Conference. February 27, 2014
 Transformation through Distinctive Performance Simmons Energy Conference February 27, 2014 Forward Looking Statements This Presentation includes forward looking statements within the meaning of the Private
Casper Terminal Acquisition
 Casper Terminal Acquisition October 2015 Cautionary Statements This presentation may contain forward-looking statements within the meaning of U.S. federal securities laws, including statements related
Muskoka, District Municipality of Bracebridge, Ontario, Canada
 DECEMBER 15, 2011 CREDIT ANALYSIS Bracebridge, Ontario, Canada Table of Contents: RATINGS 1 SUMMARY RATING RATIONALE 1 RATING OUTLOOK 1 WHAT COULD CHANGE THE RATING - UP 1 WHAT COULD CHANGE THE RATING
Third Quarter. INTERIM REPORT TO SHAREHOLDERS For the nine months ended SEPTEMBER 30, 2013
 Third Quarter INTERIM REPORT TO SHAREHOLDERS For the nine months ended SEPTEMBER 30, 2013 HIGHLIGHTS (all financial figures are unaudited and in Canadian dollars) Third quarter earnings were $421 million
Pricing of Canadian Oil Sands Blends
 Pricing of Canadian Oil Sands Blends Presented to: Edmonton CFA Society Investing In Alberta s Oil Sands Conference Edmonton, Alberta June 8, 2006 Steve Fekete Senior Principal Calgary, Alberta 403-266-7086
INVESTOR PRESENTATION DECEMBER 2018
 INVESTOR PRESENTATION DECEMBER 2018 Safe Harbor Disclosure Statement Statements made during the course of this presentation that are not historical facts are forward-looking statements within the meaning
Global Credit Research New Issue 15 MAY New Issue: Chelan County Public Util. Dist 1, WA
 Global Credit Research New Issue 15 MAY 2009 New Issue: Chelan County Public Util. Dist 1, WA MOODY'S ASSIGNS TO CHELAN COUNTY PUBLIC UTILITY DISTRICT'S DEBT ISSUANCES; OUTLOOK HAS BEEN CHANGED TO NEGATIVE
City of Windsor 'AA' Ratings Affirmed On Low Debt Burden And Exceptional Liquidity; Outlook Stable
 Research Update: City of Windsor 'AA' Ratings Affirmed On Low Debt Burden And Exceptional Liquidity; Primary Credit Analyst: Dina Shillis, CFA, Toronto (416) 507-3214; dina.shillis@spglobal.com Secondary
Negative Price Differential Pressure on the Williston Basin Crude Oil Market: Contributing Factors and Potential Solutions
 Negative Price Differential Pressure on the Williston Basin Crude Oil Market: Contributing Factors and Potential Solutions Prepared by ALL Consulting, Tulsa, Oklahoma Prepared for the benefit of: Domestic
Financial Statements. For the three months ended March 31, 2018
 Financial Statements For the three months ended March 31, Statements of Financial Position (unaudited) (Thousands of Canadian dollars) Note March 31, Dec. 31, ASSETS Current assets Cash and cash equivalents
INFRASTRUCTURE 8 LOGISTICS 9 WHOLESALE 11
 Contents BUSINESS OVERVIEW 2 SELECTED FINANCIAL INFORMATION 2 Q1 2018 REVIEW 3 PROJECT DEVELOPMENTS AND MARKET OUTLOOK 4 RESULTS OF CONTINUING OPERATIONS 7 INFRASTRUCTURE 8 LOGISTICS 9 WHOLESALE 11 EXPENSES
LIQUOR STORES INCOME FUND
 LIQUOR STORES INCOME FUND MANAGEMENT S DISCUSSION AND ANALYSIS OF FINANCIAL CONDITION AND RESULTS OF OPERATIONS For the three and six months ended June 30, 2005 As of August 11, 2005 MANAGEMENT S DISCUSSION
Enbridge Inc. Third Quarter Interim Report to Shareholders For the nine months ended September 30, 2016
 Enbridge Inc. Third Quarter Interim Report to Shareholders For the nine months ended September 30, 2016 Q3 HIGHLIGHTS (all financial figures are unaudited and in Canadian dollars unless otherwise noted)
ENBRIDGE PIPELINES INC.
 Replaces NEB No. 413 ENBRIDGE PIPELINES INC. LLS APPLYING ON CRUDE PETROLEUM, NATURAL GAS LIQUIDS AND REFINED PETROLEUM PRODUCTS From POINTS IN THE PROVINCES OF ALBERTA, SASKATCHEWAN, MANIBA, ONTARIO AND