OPERATIONS AND FINANCIAL REVIEW
|
|
|
- Arron Bridges
- 5 years ago
- Views:
Transcription
1 MEWAH INTERNATIONAL INC. ANNUAL REPORT OPERATIONS AND FY 2013 FY 2014 FY 2015 INCOME STATEMENT Revenue 3,194 3,439 2,675 Operating margin Profit after tax Earnings per share (US cents per share) BALANCE SHEET Fixed investments Working capital Total investments Equity Gross debt Cash Net debt (Gross debt less Cash) Total capital Gross debt to equity Net debt to equity Net asset value per share (US cents per share) In US$ million, unless stated otherwise FY 2013 FY 2014 FY 2015 SEGMENTAL PERFORMANCE Sales volume (MT'000) Bulk 2,707 2,852 2,872 Consumer Pack 1,026 1,164 1,011 Total 3,733 4,016 3,883 Operating margin (US$'million) Bulk Consumer Pack Total Operating margin per MT (US$) Bulk Consumer Pack Total

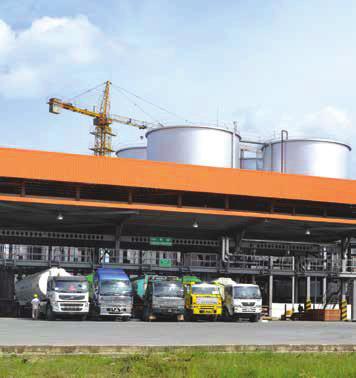
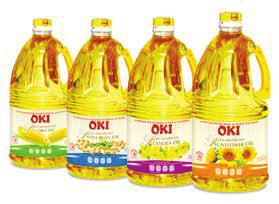
2 ADDING VALUE 14 FORGING AHEAD OPERATIONS AND PALM OIL INDUSTRY IN 2015 Crude Palm oil ( CPO ) prices remained range-bound between 2,100 and 2,300 ringgit for most of the year, though they breached the level of 2,100 ringgit for a short duration to touch a low of 1,850 ringgit. However volatile and weakening ringgit during the year resulted in high volatility in CPO prices in dollar terms resulting in pricing dropping 34% by end of August before closing the year 21% lower. Low energy prices making production of bio-diesel commercially unviable, falling soybean oil prices, global economic slowdown and financial uncertainties during the second half of the year put pressure on demand side for palm oil and the inventory buildups reached record highs in Malaysia and Indonesia. Prices received some support towards the end of the year as concerns on supply side started cropping up. Due to El-Nino in 2015, production is expected to shrink in Under widespread global slowdown and financial difficulties, Group remained selective in trade participations. It particularly witnesses weakened demand from middle-east amid high geopolitical risks, particularly for its bulk division. However, Group s competitive position in the Industry helped with participation in large part of the value chain including packing, branding and distribution of consumer pack products though it long-established customer network helped the Group to sustain its sales volumes at resilient margins. GROUP S SALES VOLUME The Group recorded sales volume of 3,883,000 MT compared to historical high of 4,015,700 MT last year. Sales volume for 2015 was 3.3% lower than volume achieved last year mainly due to weaker destination demand towards the end of the year. Bulk CPO prices (ringgit and US$) CPO Prices - US$ /1/2015 1, , ,400 1/2/2015 1/3/2015 1/4/2015 1/5/2015 1/6/2015 1/7/2015 1/8/2015 1/9/2015 CPO Prices (Ringgit) CPO Prices (US$) 1/10/2015 1/11/2015 1/12/2015 2,400 2,200 2,000 segment registered volume growth of 0.7% and contributed 74.0% of total volume. Consumer Pack segment slipped 13.1% and contributed 26.0% of total volume. Our palm-based oils and fats business registered sales volume of 3.7 million MT and was significantly higher than the production from our recently increased installed capacity of 3.5 million MT. CPO Prices - Ringgit Sales volume (MT 000) Consumer Pack Bulk 72.5% 27.5% 71.0% 29.0% 74.0% 26.0% 2, ,026 2,8522 1,164 2,8722 1,011 FY2013 FY2014 FY2015


3 MEWAH INTERNATIONAL INC. ANNUAL REPORT GEOGRAPHICAL SPREAD 13% Europe 5% Pacific Oceania 53% Malaysia/ Singapore Total Sales 47% Others 25% Middle East 25% Africa 21% Rest of Asia 11% America 4% Pacific Oceania 71% Malaysia/ Singapore Bulk Sales 29% Others 37% Middle East 38% Rest of Asia 14% America 7% Europe 11% Malaysia/ Singapore Consumer Pack Sales 89% Others 44% Africa 17% Middle East 17% Europe 8% Rest of Asia 6% Pacific Oceania 8% America WELL DIVERSIFIED SALES REVENUE The Group reported sales revenue of US$2,675 million in 2015, 22.2% lower than last year mainly due lower average selling prices. Bulk segment registered revenue drop of 20.1% and contributed 70.1% of total revenue. Consumer Pack segment recorded revenue drop of 26.7% and contributing 29.9% of total revenue. We strive to diversify our sales revenue across the globe and our efforts continued in Based on billing address of the customers, 47% of total sales were made as destination sales, selling the products to customers in countries other than Malaysia and Singapore. Destination sales remained diversified with Middle East, Africa, Rest of Asia and rest of world contributing 25%, 25%, 21% and 29% of total destination sales respectively. Destination sales to America and Europe contributed 24% of sales compared to 15% last year. Destination sales for both Bulk and Consumer Pack segments remained strong. 29% of Bulk segment sales were made to destination markets with Middle East, Rest of Asia and rest of world contributing 38%, 38% and 24% respectively. 89% of Consumer Pack segment sales were made to destination markets with Africa, Middle East, Europe, Asia and rest of world contributing 43%, 17%, 17%, 8% and 15% respectively. FY 2014 FY 2015 Malaysia/Singapore 52% 53% Destination 48% 47% Total 100% 100% Africa 29% 25% Middle East 31% 25% Rest of Asia 21% 21% America 8% 11% Europe 7% 13% Pacific Oceania 4% 5%

4 ADDING VALUE 16 FORGING AHEAD OPERATIONS AND OPERATING MARGINS The Group measures and tracks the performance in terms of Operating Margin per MT sales volume and resultant total operating margin. OM is calculated by adjusting the depreciation in cost of sales, selling and distribution expenses and foreign exchange differences in other gains or losses to gross profit. Over the period of last five decades, we have developed a proven integrated business model of participating in the midstream and downstream parts of the value chain in the attractive palm oil industry, built inherent operational flexibility, developed sound risk management practices, and established our own brands and global distribution capabilities that have helped us to deliver robust operating margins during normal industry conditions and resilient margins during tough economic cycles. Amid tough operating conditions for the industry, our operating margin remained resilient at US$24.3 per MT, compared to US$23.6 achieved last year. Industry conditions, particularly for the refiners, remained challenging resulting in Bulk segment margin decreasing to US$13.0 per MT compared to US$14.6 achieved last year. Despite lower margins achieved for Bulk segment, our Group s integrated business model with participation in large part of the value chain and ability to sell in global markets under its own brands through well established distribution networks helped to maintain healthy margins for the Consumer Pack business. Consumer Pack segment margins improved to US$56.4 per MT compared to US$45.6 last year. Addition of rice and dairy products, duly supported by our recent investment in dairy manufacturing facilities, has improved our competitive position in the consumer products business. Bulk and Consumer Pack segments contributed 39.5% and 60.5% of total operating margin respectively. Total FY 2014 FY 2015 Change % Sales volume (MT'000) 4, , % OM per MT (US$) % Operating margin (US$mil) % Bulk FY 2014 FY 2015 Change % Sales volume (MT'000) 2, , % OM per MT (US$) % Operating margin (US$mil) % Consumer Pack FY 2014 FY 2015 Change % Sales volume (MT'000) 1, , % OM per MT (US$) % Operating margin (US$mil) %


5 MEWAH INTERNATIONAL INC. ANNUAL REPORT STRONG BALANCE SHEET We manage our capital structure very actively by maintaining prudent debt to equity ratio and maintaining healthy combination of equity, long-term debt and short-term debt to fund long-term investment and working capital. As at 31 Dec 2015, we maintained prudent debt to equity ratio of 0.76 or net debt to equity ratio of Current low net debt to equity ratio, well below our target limit of 1.5 leaves enough scope for us to raise additional debt to support our growth plans. Debt to equity and net debt to equity FY FY Due to nature of our investments, we target to keep net debt to equity ratio of less than 1.0 for long term investments and less than 2.0 for working capital. As at 31 Dec 2015, long-term investments of US$331.1 million were funded by equity and long-term debt of 84.7% and 15.3% respectively giving net debt to equity ratio of Working capital of US$476.6 million were funded by equity and current net-debt of 42.8% and 57.2% respectively giving net debt to equity ratio of FY2015 Debt to equity 0.67 Net debt to equity 0.76 We maintain adequate working capital credit lines to support our business. Our current working capital lines utilisation was 45.4% of total credit lines available. Balance sheet (US$ mil) Though we have efficient, large scale, integrated production facilities and strong distribution network, we had a cycle time of 68 days in 2015 due to the Group carried higher inventories. 59.0% Working capital % Current net debt 42.8% Equity 41.0% Long-term investments % Non-current debt 84.7% Equity Investment Capital


6 FORGING AHEAD
TABLE OF CONTENTS. Part I Information Required for Quarterly (Q1, Q2 & Q3), Half-Year and Full Year Announcements. 1(a)(i) Income statement 1
, Half-Year and Full Year Announcements. 1(a)(i) Income statement 1") TABLE OF CONTENTS Item No. Description Part I Information Required for Quarterly (Q1, Q2 & Q3), Half-Year and Full Year Announcements Page No. 1(a)(i) Income statement 1 1(a)(ii) Statement of comprehensive
TABLE OF CONTENTS Item No. Description Part I Information Required for Quarterly (Q1, Q2 & Q3), Half-Year and Full Year Announcements Page No. 1(a)(i) Income statement 1 1(a)(ii) Statement of comprehensive
WILMAR INTERNATIONAL LIMITED 4Q2016 Results Briefing. Feb 20, 2017
 WILMAR INTERNATIONAL LIMITED 4Q2016 Results Briefing Feb 20, 2017 IMPORTANT NOTICE Information in this presentation may contain projections and forward looking statements that reflect the Company s current
In US$ million 4Q2017 4Q2016 Change FY2017 FY2016 Change. Revenue 11, , % 43, , %
 NEWS RELEASE WILMAR REPORTS NET EARNINGS OF US$428 MILLION FOR 4Q2017 AND US$1.22 BILLION FOR FY2017 - Strong performance in Oilseeds & Grains - FY2017 EBITDA up 15% to US$2.58 billion - Total dividend
WILMAR INTERNATIONAL LIMITED 1Q2016 Results Highlights. May 10, 2016
 WILMAR INTERNATIONAL LIMITED 1Q2016 Results Highlights May 10, 2016 IMPORTANT NOTICE Information in this presentation may contain projections and forward looking statements that reflect the Company s current
Company Presentation 2Q and 1H 2012 Results. 15 Aug 2012
 Company Presentation 2Q and 1H 2012 Results 15 Aug 2012 Presentation Outline 1 Plantation Highlights 2 Financial Highlights 3 Strategies and Expansion 4 Appendix 1 1 Section 1 Plantation Highlights g 2
Company Presentation 3Q and 9M 2012 Results. 31 Oct 2012
 Company Presentation 3Q and 9M 2012 Results 31 Oct 2012 Presentation Outline 1 Plantation Highlights 2 Financial Highlights 3 Strategies and Expansion 4 Appendix 1 1 Section 1 Plantation Highlights g 2
WILMAR INTERNATIONAL LIMITED 2Q2016 Results Briefing. August 11, 2016
 WILMAR INTERNATIONAL LIMITED 2Q2016 Results Briefing August 11, 2016 IMPORTANT NOTICE Information in this presentation may contain projections and forward looking statements that reflect the Company s
Company Presentation 1Q 2012 Results. 30 April 2012
 Company Presentation 1Q 2012 Results 30 April 2012 Presentation Outline 1 Plantation Highlights 2 Financial Highlights 3 Strategies and Expansion 4 Appendix 1 1 Section 1 Plantation Highlights g 2 Planted
WILMAR INTERNATIONAL LIMITED ANNUAL GENERAL MEETING. 28 April 2016
 WILMAR INTERNATIONAL LIMITED ANNUAL GENERAL MEETING 28 April 2016 IMPORTANT NOTICE Information in this presentation may contain projections and forward looking statements that reflect the Company s current
Company Presentation 1Q 2013 Results 29 April Company Presentation 4Q and FY 2012 Results. 27 Feb 2013
 Company Presentation 1Q 2013 Results 29 April 2013 Company Presentation 4Q and FY 2012 Results 27 Feb 2013 Presentation Outline 1 Plantation Highlights 2 Financial Highlights Click to edit Master title
Creating Synergy Delivering Value. Mewah International Inc. Annual Report 2016
 Creating Synergy Delivering Value Mewah International Inc. Annual Report 2016 Mewah International Inc. We are a global agri-business focused on edible oils and fats with refineries and processing facilities
INTEGRATED AGRIBUSINESS WITH LEADING BRANDS. Company Presentation Q109 Results. 29 April 2009
 INTEGRATED AGRIBUSINESS WITH LEADING BRANDS Company Presentation Q109 Results 29 April 2009 DISCLAIMER This presentation was prepared solely and exclusively for the parties presently being invited for
4 th Quarter 2015 Financial Results
 4 th Quarter 2015 Financial Results 23 rd February 2016 Disclaimer The presentation is prepared by Super Group Ltd ( Super or the Group ) and is solely for the purpose of corporate communication and general
Powering Ahead with Singapore Petroleum. Global economic slowdown severely weakened demand for oil and refined products.
 Powering Ahead with Singapore Petroleum January 2009 2H08 Overview Macro-economic factors Global economic slowdown severely weakened demand for oil and refined products. Oil prices fell by more than US$100
DISCLAIMER. Indofood Agri Resources Ltd.
 INTEGRATED AGRIBUSINESS WITH LEADING BRANDS Company Presentation Q3 2009 & YTD Sept 2009 Results 11 November 2009 DISCLAIMER This presentation was prepared solely and exclusively for the parties presently
Company Presentation 1Q 2014 Results. 30 April 2014
 Company Presentation 1Q 2014 Results 30 April 2014 Presentation Outline 1 Business Overview 2 Plantation Highlights 3 Financial Highlights 4 Strategies and Expansion 2 Section 1 Business Overview 3 Integrated
MEGACHEM DELIVERS RECORD PERFORMANCE IN FY2011 AND REWARDS SHAREHOLDERS WITH ATTRACTIVE DIVIDEND YIELD
 MEGACHEM LIMITED RESULTS NEWS RELEASE MEGACHEM DELIVERS RECORD PERFORMANCE IN FY2011 AND REWARDS SHAREHOLDERS WITH ATTRACTIVE DIVIDEND YIELD - Record sales with growth of 12.5% to S$106.9 million o Surpasses
Global Palm posts EBITDA of Rp79.6 billion in FY2012
 Press Release Global Palm posts EBITDA of Rp79.6 billion in FY2012 Lower CPO prices in 2012 resulted in a net loss of Rp117 billion from changes in the fair value of biological assets Believes that the
Company Presentation 2Q 2016 Results. 12 Aug 2016
 Company Presentation 2Q 2016 Results 12 Aug 2016 Presentation Outline 1 Plantation Highlights 2 Financial Highlights 3 Strategies and Expansion 4 Appendix 2 Plantation Highlights 3 Planted Area In Ha 30
No Boundaries Only Possibilities
 No Boundaries Only Possibilities 1 MegaChem Limited Results Presentation Half Year Ended 30 June 2010 2 Industry Overview Value and Profitability Industry Positioning Specialty Chemicals Commodity Chemicals
Financial Results (unaudited)
") 4 th Quarter and Full Year 2011 Financial Results (unaudited) 24 February 2012 1 1 Important note on forward looking statements The presentation herein may contain forward looking statements by the management
4 th Quarter and Full Year 2011 Financial Results (unaudited) 24 February 2012 1 1 Important note on forward looking statements The presentation herein may contain forward looking statements by the management
Monthly Market Review Macroeconomy Equity Fixed Income
 Macroeconomic Review THE U.S. HAS STARTED THE BIGGEST TRADE WAR IN HISTORY. On July 6, 2018, U.S. President Donald Trump's administration began imposing a US$ 34 billion tariff on goods imported from China,
The descriptions below further elaborate the segment-wise performance for the period under review.
 Carson Cumberbatch PLC Condensed Interim Financial Statements For the Nine months ended 31st December 2017 Carson Cumberbatch PLC For the Nine months ended 31st December 2017 1 Carson Cumberbatch PLC
Financial Highlights. Operational a Highlights
 INTEGRATED AGRIBUSINESS WITH LEADING BRANDS Company Presentation 3Q10 and 9M10 Results 29 October 2010 Results Summary 3Q10 and 9M10 2,600 2,400 2,200 2,000 1,800 1,600 1,400 1,200 1,000 800 750 700 650
Company Presentation 3Q and 9M 2016 Results. 28 Oct 2016
 Company Presentation 3Q and 9M 2016 Results 28 Oct 2016 Presentation Outline 1 Plantation Highlights 2 Financial Highlights 3 Strategies and Expansion 4 Appendix 2 Plantation Highlights 3 Planted Area
UNAUDITED FINANCIAL STATEMENTS FOR THE FULL YEAR 31 DECEMBER 2017
 UNAUDITED FINANCIAL STATEMENTS FOR THE FULL YEAR 31 DECEMBER 2017 1(a)(i) A comprehensive income statement (for the group) together with a comparative statement for the corresponding period of the immediately
WILMAR INTERNATIONAL LIMITED 1Q2017 Results Highlights. May 11, 2017
 WILMAR INTERNATIONAL LIMITED 1Q2017 Results Highlights May 11, 2017 IMPORTANT NOTICE Information in this presentation may contain projections and forward looking statements that reflect the Company s current
STRATEGIC PROGRESS LEADS TO RECORD RESULTS FOR OLAM IN FY2011
 NEWS RELEASE Olam International Limited 9 Temasek Boulevard #11-02 Suntec Tower Two Singapore 038989 telephone 65 63394100 facsimile 65 63399755 Website www.olamonline.com Regn no. 199504676-H STRATEGIC
UNAUDITED FINANCIAL STATEMENTS FOR THE FIRST QUARTER ENDED 31 MARCH 2010
 UNAUDITED FINANCIAL STATEMENTS FOR THE FIRST QUARTER ENDED 31 MARCH 2010 1(a)(i) A comprehensive income statement (for the group) together with a comparative statement for the corresponding period of the
UOB Group Reports First Half 2017 Earnings at S$1.7 billion
 UOB Group Reports First Half 2017 Earnings at S$1.7 billion Sound operating performance, supported by healthy balance sheet Singapore, 28 July 2017 UOB Group ( Group ) reported net earnings of S$1.65 billion
Financing the Commodity Sector
 Financing the Commodity Sector ARA 2012 - AFRICAN REFINERS ASSOCIATION March 2012 Matthieu LACAZE Deputy Global Head of E&C Finance A New Paradigm: a growing sector which must explore new fuelling sources
(Registration no C) (Registration no C)
 (Registration no C)") 3 rd Quarter & 9-Month 2012 Financial Results (unaudited) 8 November 2012 1 1 Important note on forward-looking statements The presentation herein may contain forward looking statements by the management
3 rd Quarter & 9-Month 2012 Financial Results (unaudited) 8 November 2012 1 1 Important note on forward-looking statements The presentation herein may contain forward looking statements by the management
Report Summary. Prices are likely to hold above MYR 2550 and trade on mixed note ahead of turning higher in the coming sessions
 Daily BMD CPO Price Outlook and Strategy Decision enabling market analysis & price outlook For Dec 31, 2013 Report Summary BMD CPO Mar 14 Futures Fundamental Summary MYR 2631( 1) on Dec 30, 2013 Price
Interim Results 2019 March 2019
 Interim Results 2019 March 2019 Disclaimer This presentation may contain forward-looking statements and projections. There can be no certainty of outcome in relation to the matters to which the forward-looking
UNAUDITED FINANCIAL STATEMENTS FOR THE FULL YEAR ENDED 31 DECEMBER 2007
 UNAUDITED FINANCIAL STATEMENTS FOR THE FULL YEAR ENDED 31 DECEMBER 2007 1(a)(i). An income statement (for the group) together with a comparative statement for the corresponding period of the immediately
MEGACHEM ACHIEVED RECORD SALES OF S$108.7 MILLION FOR FY2013
 MEGACHEM ACHIEVED RECORD SALES OF S$108.7 MILLION FOR FY2013 - Sales increased by 2.3% to S$108.7 million driven mainly by growth in revenues from America and ASEAN market segments. - Recorded net profit
Introduction to MALAYSIA
 Introduction to MALAYSIA Malaysia is an upper-middle income, highly open economy with a record of strong economic performance and poverty reduction since independence from Great Britain in 1957. Malaysia
Company Presentation 3Q 2017 Results. 27 Oct 2017
 Company Presentation 3Q 2017 Results 27 Oct 2017 Presentation Outline 1 2 Plantation Highlights Financial Highlights 3 4 Strategies and Expansion Appendix Plantation Highlights Planted Area In Ha 31 Dec
UNAUDITED FINANCIAL STATEMENTS FOR THE FIRST QUARTER ENDED 31 MARCH 2008
 UNAUDITED FINANCIAL STATEMENTS FOR THE FIRST QUARTER ENDED 31 MARCH 2008 1(a)(i). An income statement (for the group) together with a comparative statement for the corresponding period of the immediately
Unaudited First Quarter Financial Statement and Dividend Announcement for the period ended 31 March 2016
 Corporation Limited (Company Registration No. 198401088W) Unaudited First Quarter Financial Statement and Dividend Announcement for the period ended 31 March 2016 PART I - INFORMATION REQUIRED FOR ANNOUNCEMENTS
HALF YEAR REPORT August 2017
 21 August 2017 CONTENTS UIE in brief 3 Key Figures Business Performance 4 UIE s Strategic Investments 5 6-20 DIRECTORS REPORT Financial Review - Business Reporting 6-9 UP 10-13 MSAB 14-16 Risk Factors
First Resources Limited Full Year and Fourth Quarter 2017 Results Presentation 26 February 2018
 First Resources Limited Full Year and Fourth Quarter 2017 Results Presentation 26 February 2018 Delivering Growth and Returns Table of Contents Executive Summary 3 Financial Performance 5 Operational Performance
Phillips Carbon Black Limited
 Phillips Carbon Black Limited We Touch Lives Every Moment Investor Presentation February- 218 1 Part of a Dynamic Conglomerate. Carbon Black Industry Global Overview What is Carbon Black? Global CB demand
CSP Program March Indofood Agri Resources Ltd
 CSP Program March 2014 Indofood Agri Resources Ltd Disclaimer Please note that the information is provided for you by way of information only. All the information, report and analysis were and should be
CEFC INTERNATIONAL LIMITED (SGX: Y35) CORPORATE PRESENTATION. October 2015
 CORPORATE PRESENTATION. October 2015") 1 CEFC INTERNATIONAL LIMITED (SGX: Y35) CORPORATE PRESENTATION October 2015 1 Disclaimer 2 The presentation is prepared by CEFC International (the Company ) and is intended solely for your personal reference
1 CEFC INTERNATIONAL LIMITED (SGX: Y35) CORPORATE PRESENTATION October 2015 1 Disclaimer 2 The presentation is prepared by CEFC International (the Company ) and is intended solely for your personal reference
Company Presentation 2Q 2017 Results. 28 July 2017
 Company Presentation 2Q 2017 Results 28 July 2017 Presentation Outline 1 2 Plantation Highlights Financial Highlights 3 4 Strategies and Expansion Appendix Plantation Highlights Planted Area In Ha 30 Jun
41 st ANNUAL GENERAL MEETING Presentation to Shareholders. 20 May 2015
 41 st ANNUAL GENERAL MEETING Presentation to Shareholders 20 May 2015 1 TH Plantations Berhad Today Revenue RM488.92m PATAMI RM48.32m Profit Before Tax RM58.21m Market Cap RM1.50b 106,309 Ha of land bank
Q3 17 Results November 2017
 Q3 17 Results November 2017 Key highlights Q3 17 Sales volumes: 5.8 million m 3 Gross profit: US$ 406 million EBITDA: US$ 180 million Operating cash flow: US$ 249 million Investment in infrastructure:
Market volatility to continue
 How much more? Renewed speculation that financial institutions may report increased US subprime-related losses has sent equity markets tumbling. How much more bad news can investors expect going forward?
HY17 RESULTS PRESENTATION
 1 HY17 RESULTS PRESENTATION TABLE OF CONTENTS About Cartrack 3 Business trends 4 Strategy overview 6 Segmental performance 13 Financial review 19 Outlook 28 Annexures 32 ABOUT CARTRACK A leading global
Global Economics & Market Volatility - Impact on Commodities. Nagaraj Meda MD, TransGraph Consulting
 Global Economics & Market Volatility - Impact on Commodities Nagaraj Meda MD, TransGraph Consulting Global economy summary Euro strength emanated from accelerated growth momentum and strong current account
Enhancement of Mutual Fund Category Classification Standards
 Enhancement of Mutual Fund Category Classification Standards Morningstar (China) Research Center April 2016 1 In March 2004, Morningstar introduced the category classification methodology for Chinese mutual
UOB Group Reports Nine Months 2018 Earnings Up 22% to S$3.09 Billion
 UOB Group Reports Nine Months 2018 Earnings Up 22% to S$3.09 Billion Resilient earnings supported by strong balance sheet Singapore, 26 October 2018 UOB Group ( Group ) achieved record net earnings of
Strong FFB production weighed down by FX losses from the strengthening of the USD
 For Immediate Release Strong FFB production weighed down by FX losses from the strengthening of the USD Singapore, 13 August 2018 Kencana Agri Limited ( Kencana or the Group ), today announced its financial
SAN MIGUEL BREWERY INC. A subsidiary of San Miguel Corporation
 SAN MIGUEL BREWERY INC. A subsidiary of San Miguel Corporation March 17, 2016 PHILIPPINE DEALING & EXCHANGE CORP. 37/F, Tower I, The Enterprise Center 6766 Ayala Ave., cor. Paseo de Roxas Makati City Attention:
UNAUDITED FINANCIAL STATEMENTS FOR THE SECOND QUARTER ENDED 30 JUNE 2018
 UNAUDITED FINANCIAL STATEMENTS FOR THE SECOND QUARTER ENDED 30 JUNE 2018 1(a)(i) A comprehensive income statement (for the group) together with a comparative statement for the corresponding period of the
FIRSTHALF2018 RESULTSPRESENTATION
 FIRSTHALF2018 RESULTSPRESENTATION July 26 th 2018 Juan Lladó CEO 1 DISCLAIMER This document has been prepared by Técnicas Reunidas S.A. (the Company) solely for use at presentations held in connection
Condensed Consolidated Statements of Profit or Loss and Other Comprehensive Income For the quarter ended 31 October 2015
 No. 66-78, Pusat Suria Permata, Jalan Upper Lanang, C.D.T. No. 123, 96000 Sibu Sarawak, Malaysia E-Mail : info@suburtiasa.com.my Condensed Consolidated Statements of Profit or Loss and Other Comprehensive
Q1 Consolidated. April 24, Q1 consolidated Revenue April 24, 2014.
 Q1 Consolidated Revenue April 24, 2014 Q1 2014 revenue by region (in millions) Q1 2013 Q1 2014 Reported Like-for-like France 126 129 + 2.5 % + 2.5 % Other Western Europe 161 183 + 13.7 % + 13.4 % North
Market Access. M&A Securities. Results Review (1Q15) TSH Resources Berhad HOLD (TP: RM2.38) A Tough Quarter - More Room to Grow.
 TSH Resources Berhad HOLD (TP: RM2.38) A Tough Quarter - More Room to Grow.") M&A Securities Results Review (1Q15) PP14767/09/2012(030761) TSH Resources Berhad Thursday, May 21, 2015 HOLD (TP: RM2.38) A Tough Quarter - More Room to Grow Results Review Actual vs. expectations. TSH
M&A Securities Results Review (1Q15) PP14767/09/2012(030761) TSH Resources Berhad Thursday, May 21, 2015 HOLD (TP: RM2.38) A Tough Quarter - More Room to Grow Results Review Actual vs. expectations. TSH
Puma Energy : Fourth quarter & full year 2018 results Thursday 28 th March Puma Energy
 Puma Energy : Fourth quarter & full year 2018 results Thursday 28 th March 2019 Puma Energy The opportunity for Puma Energy Unique footprint, great people & strong business fundamentals in high potential
KENCANA AGRI LIMITED (Registration Number: E)
") UNAUDITED FINANCIAL STATEMENT ANNOUNCEMENT FOR THE FINANCIAL YEAR ENDED 30 JUNE 2011 1 (a) (i) Income statement (for the Group) together with a comparative statement for the corresponding period of the
UNAUDITED FINANCIAL STATEMENT ANNOUNCEMENT FOR THE FINANCIAL YEAR ENDED 30 JUNE 2011 1 (a) (i) Income statement (for the Group) together with a comparative statement for the corresponding period of the
FELDA GLOBAL VENTURES HOLDINGS BERHAD
 FELDA GLOBAL VENTURES HOLDINGS BERHAD Financial Results Briefing 2 nd Quarter for the Financial Period Ended 30 June 2017 Presented by: Officer In-Charge Interim Chief Financial Officer 30/08/2017 DISCLAIMER
Company Presentation 1Q 2018 Results. 30 April 2018
 Company Presentation 1Q 2018 Results 30 April 2018 Click Presentation to edit Master Outline title style 1 2 Plantation Highlights Financial Highlights 3 4 Strategies and Expansion Appendix 2 Click to
First quarter demonstrated solid progress toward full year target
 FOR IMMEDIATE RELEASE Tokyo, May 2, 2016 JT s Consolidated Financial Results for FY2016 First Quarter First quarter demonstrated solid progress toward full year target Results for FY2016 First Quarter
Financial Results for FY2018
 IR Financial Results for (Fiscal Year Ended March 31, 2018) April 26, 2018 Hino Motors, Ltd. 1. Sales Turnover IR 2/16 Global Unit Sales (Retail Sales) IR 3/16 Global unit sales achieved a record high,
Financial Results for Third Quarter of FY2017
 IR Financial Results for Third Quarter of FY2017 (From April 1, 2016 to December 31, 2016) January 31, 2017 Hino Motors, Ltd. In 1991, Hino released a large-sized route bus mounted with HIMR*, a dieselelectricity
9M2016 Results Announcement
 9M2016 Results Announcement October 27, 2016 Sembcorp Industries 2016 9M2016 Performance Round-up Turnover at S$5.9 billion, down 18% Profit from Operations at S$617.1 million, down 25% Net Profit at S$247.4
UNAUDITED FINANCIAL STATEMENTS FOR THE FULL YEAR ENDED 31 DECEMBER 2008
 UNAUDITED FINANCIAL STATEMENTS FOR THE FULL YEAR ENDED 31 DECEMBER 2008 1(a)(i) An income statement (for the group) together with a comparative statement for the corresponding period of the immediately
ASCOTT REIT S FY 2011 TOTAL UNITHOLDERS DISTRIBUTION 67% HIGHER THAN LAST YEAR Distribution per unit (DPU) is 13% higher than last year and 10%
 is 13% higher than last year and 10%") ASCOTT REIT S FY 2011 TOTAL UNITHOLDERS DISTRIBUTION 67% HIGHER THAN LAST YEAR Distribution per unit (DPU) is 13% higher than last year and 10% 1 higher than forecast Accretive contribution from 28 properties
ASCOTT REIT S FY 2011 TOTAL UNITHOLDERS DISTRIBUTION 67% HIGHER THAN LAST YEAR Distribution per unit (DPU) is 13% higher than last year and 10% 1 higher than forecast Accretive contribution from 28 properties
First Quarter Report 2017
 First Quarter Report 2017 UNITED PLANTATIONS BERHAD (Company no. 240-A) Jendarata Estate 36009 Teluk Intan Darul Ridzuan Malaysia Condensed Consolidated Statement Of Comprehensive Income for the Three
Bumitama Agri Ltd. First Quarter 2017 Presentation. Excellence Through Discipline. 15 May 2017
 First Quarter 2017 Presentation 15 May 2017 Disclaimer This presentation should be read in conjunction with the unaudited financial statements of (the Company ) for the financial quarter ended 31 March
Supporting Material for First Quarter Results April 2010
 1 Supporting Material for First Quarter Results April Notes This document contains forward-looking statements concerning the results of operations and businesses of Showa Shell Sekiyu K.K.. Forward-looking
Third Quarter of the Fiscal Year Ending December 31, 2016 Unicharm Presentation Materials for Investor Meeting
 Third Quarter of the Fiscal Year Ending December 31, 2016 Unicharm Presentation Materials for Investor Meeting November 4, 2016 Takahisa Takahara President and CEO Unicharm Corporation Projections stated
First Quarter Results (3-month results ended June 30, 2013)
") Fiscal Year 213 (ending March 31, 214) First Quarter Results (3-month results ended June 3, 213) Brother Industries, Ltd. August 6, 213 Information on this report, other than historical facts, refers to
Fiscal Year 213 (ending March 31, 214) First Quarter Results (3-month results ended June 3, 213) Brother Industries, Ltd. August 6, 213 Information on this report, other than historical facts, refers to
MEGACHEM LIMITED. Un-audited Financial Statements and Dividend Announcement
 MEGACHEM LIMITED Un-audited Financial Statements and Dividend Announcement For The Financial Year Ended TABLE OF CONTENTS INCOME STATEMENT 3 BALANCE SHEETS 5 CASH FLOW STATEMENT 7 STATEMENTS OF CHANGES
PSSA Group. Palm Product Supplier
 PSSA Group Palm Product Supplier CONTENTS 1.0 INTRODUCTION 2.0 COMPANY INFORMATION 3.0 KEY PERSONS 4.0 ORGANISATION CHART 5.0 SAFETY & ENVIRONMENT COMMITMENT 6.0 COMMUNITY DEVELOPMENT 7.0 SPECIFICATION
Sime Darby Plantation Sdn Bhd
 CREDIT OPINION Sime Darby Plantation Sdn Bhd New Issuer Report New Issue Summary Rating Rationale Sime Darby Plantation Sdn Bhd s (SDP) 1 issuer rating reflects its position as an integrated palm oil producer,
FOR IMMEDIATE RELEASE 27 November IHH Healthcare Reports RM82.1 million Net Profit for Q3 2017
 IHH Healthcare Reports RM82.1 million Net Profit for Q3 2017 Q3 2017 revenue grew 15% to RM2.8 billion on sustained organic growth from existing operations and solid contribution from new hospitals Solid
Trend Micro FY Q / Annual Results. Mahendra Negi, CFO, Representative director February 4, 2003
 Trend Micro FY2002. 4Q / Annual Results Mahendra Negi, CFO, Representative director February 4, 2003 1 Forward Looking Statements Certain statements that we make in this presentation are forward-looking
SWIBER ACHIEVES RECORD-HIGH REVENUE AND NET PROFIT SINCE LISTING
 FOR IMMEDIATE RELEASE Contact Information: Citigate Dewe Rogerson, i.mage Pte Ltd Dolores Phua / Pearl Lam 97508237 / 9781-3518 SWIBER ACHIEVES RECORD-HIGH REVENUE AND NET PROFIT SINCE LISTING - Net profit
PETRONAS Group Financial Results Announcement
 PETRONAS Group Financial Results Announcement Q2 2016 2016 PETROLIAM NASIONAL BERHAD (PETRONAS) All rights reserved. No part of this document may be reproduced, stored in a retrieval system or transmitted
News & Development Rising Channel Bollinger Band Overall, we maintain our bullish view in MCX Crude Oil for the next one month.
 13 th April 2018 News & Development MCX Crude Oil prices has witnessed a spike in the last couple of days and closed at Rs.4362/bbl by 12 th April. Geopolitical tensions prevailing across the globe led
(Registration no C) (Registration no C) Financial Results. (unaudited) 11 November 2009
 (Registration no C) Financial Results. (unaudited) 11 November 2009") 3 rd Quarter and 9-Month 9 2009 Financial Results (unaudited) 11 November 2009 1 Important note on forward looking statements The presentation herein may contain forward looking statements by the management
3 rd Quarter and 9-Month 9 2009 Financial Results (unaudited) 11 November 2009 1 Important note on forward looking statements The presentation herein may contain forward looking statements by the management
(Registration no C) (Registration no C) Financial Results
 (Registration no C) Financial Results") 3 rd Quarter & 9-Month 2011 Financial Results (unaudited) 10 November 2011 1 1 Important note on forward looking statements The presentation herein may contain forward looking statements by the management
3 rd Quarter & 9-Month 2011 Financial Results (unaudited) 10 November 2011 1 1 Important note on forward looking statements The presentation herein may contain forward looking statements by the management
Report Summary. Easing stock pressure amidst anticipated drop in production
 Daily BMD CPO Market Analysis and Price Outlook Decision enabling market analysis & price outlook For Nov 01, 2013 Report Summary BMD CPO Jan 14 Futures Fundamental Summary Technical Summary Price outlook
BUKIT DARAH PLC Condensed InterIm FInanCIal statements For the nine months ended 31st december 2015
 BUKIT DARAH PLC Condensed Interim Financial Statements For the Nine Months ended 31st December 2015 1 Group Review For the Nine Months Ended 31st December 2015 Company Driven by lower Dividend Receipts
WILMAR INTERNATIONAL LIMITED ANNUAL GENERAL MEETING. 25 April 2018
 WILMAR INTERNATIONAL LIMITED ANNUAL GENERAL MEETING 25 April 2018 IMPORTANT NOTICE Information in this presentation may contain projections and forward looking statements that reflect the Company s current
SBF ASEAN OUTLOOK SURVEY
 SBF ASEAN OUTLOOK SURVEY 2018 2017 Commissioned by: SUMMARY REPORT Index Pages Foreword SBF ASEAN Outlook Survey 2017/2018 Companies Expect Positive ASEAN Business Outlook Driven By High Growth Potential
Standard Chartered first half profit up 9% to US$3.95bn
 Standard Chartered first half profit up 9% to US$3.95bn Strong momentum combined with diversity of performance provides real resilience Highlights: Group income climbs 9%, with growth across our markets.
2Q 2018 RESULT PRESENTATION
 2Q 2018 RESULT PRESENTATION 15 August 2018 www.mermaid-group.com Disclaimer: The information contained in this document is intended only for use during the presentation and should not be disseminated or
Economic Outlook and Risks in the APEC Region
 2018/FMM/002 Agenda Item: 1.1 Economic Outlook and Risks in the APEC Region Purpose: Information Submitted by: ADB 25th Finance Ministers Meeting Port Moresby, Papua New Guinea 17 October 2018 Economic
Breakdown of Unitholdings of PGF as at 31 January 2018
 Fund Information Fund Name Public Growth Fund () Fund Category Equity Fund Investment Objective To achieve long-term capital appreciation with income considered incidental. Fund Performance Benchmark The
HALCYON AGRI CORPORATION LIMITED (Company Registration No.: D)
") HALCYON AGRI CORPORATION LIMITED (Company Registration No.: 200504595D) Full Year Financial Statement and Dividend Announcement For the Financial Year Ended 31 December 2012 Halcyon Agri Corporation Limited
HALCYON AGRI CORPORATION LIMITED (Company Registration No.: 200504595D) Full Year Financial Statement and Dividend Announcement For the Financial Year Ended 31 December 2012 Halcyon Agri Corporation Limited
Tata Steel Ltd. - FPO Note
 Tata Steel Ltd. - FPO Note Issue Details Particulars Issue Date January 19, 2011 January 21, 2011 Issue Size Rs.33.8-34.7bn Price Band Rs. 594-610 FV Fresh Issue Rs.10 57 mn equity shares QIB 49% Non Institutional/HNIs
Bumitama Agri Ltd. Fourth Quarter & Full Year 2017 Presentation. Excellence Through Discipline. 27 February 2018
 Fourth Quarter & Full Year 2017 Presentation 27 February 2018 Disclaimer This presentation should be read in conjunction with the unaudited financial statements of (the Company ) for the financial quarter
Half Year Results August 2014 Presented by Chairman Roger Lockwood Chief Executive Peter France Finance Director Jonathan Davis
 Half Year Results 2014 5 August 2014 Presented by Chairman Roger Lockwood Chief Executive Peter France Finance Director Jonathan Davis Half Year Results 2014 5 August 2014 Presented by Chairman Roger Lockwood
4Q 2016 Earnings Release
 SK innovation 4Q 2016 Earnings Release 2017. 2. 3 Disclaimer This presentation contains forward-looking statements with respect to financial conditions, results of operations and business of SK Innovation,
KENCANA AGRI LIMITED (Incorporated in the Republic of Singapore) Company Registration Number: E
 Company Registration Number: E") KENCANA AGRI LIMITED (Incorporated in the Republic of Singapore) Company Registration Number: 200717793E INVESTMENT BY WILMAR INTERNATIONAL LIMITED (THROUGH ITS WHOLLY-OWNED SUBSIDIARY, NEWBLOOM PTE LTD)
KENCANA AGRI LIMITED (Incorporated in the Republic of Singapore) Company Registration Number: 200717793E INVESTMENT BY WILMAR INTERNATIONAL LIMITED (THROUGH ITS WHOLLY-OWNED SUBSIDIARY, NEWBLOOM PTE LTD)
Hedging Palm Oil in Bursa Malaysia Derivatives
 Hedging Palm Oil in Bursa Malaysia Derivatives Jeffrey Tan General Manager, Product & Market Development Bursa Malaysia Derivatives Berhad 2 nd Palm Oil Internet-based Seminar 7-13 February 2011 1 Concept