Uponor roadshow presentation H1/2018
|
|
|
- Ilene Gardner
- 5 years ago
- Views:
Transcription


1 Uponor roadshow presentation H1/2018 Jyri Luomakoski, President and CEO Maija Strandberg, CFO


2 Uponor celebrates its centenary in 2018 SHK Essen Germany Aquatherm Moscow, Russia Nordbygg Stockholm, Sweden 100-year anniversary celebration: Bucharest, Romania 100-year anniversary celebration: Budapest, Hungary Annual General Meeting 2018 Helsinki, Finland 2
3 Uponor at a glance Leading international provider of plastic based piping systems for buildings and infrastructure We provide safe drinking water delivery systems, energy-efficient radiant heating and cooling and reliable infrastructure solutions Uponor is listed on Nasdaq Helsinki since As of January 2018, the company is listed in the Large Cap category. Infrastructure solutions 27% 24% Indoor climate solutions 49% Plumbing solutions FACTS & FIGURES billion euro Net sales 2017 countries with Uponor operations 15 production sites worldwide 4,000 worldwide staff 3


4 Uponor globally 15 production sites Countries with Countries where Uponor Countries where Uponor Uponor operations operates through partners sells through export 4

5 Our solutions enrich people s way of life Our vision Throughout the world, our solutions enrich people s way of life Our mission Partnering with professionals to create better plumbing, indoor climate and infrastructure solutions Our people We will build an exciting environment for growth and achievement both for the company and our employees 5


6 Shared values guide our operations With 4,000 committed employees in 30 countries, Uponor is at your service all over the world. OUR VALUES CONNECT BUILD INSPIRE 6


7 Throughout the world, our solutions enrich people s way of life MLC riser system for a cruise ship, cutting installation time to a bare minimum: Carnival Cruises PE pressure pipes and prefabricated fittings for the Copenhagen metro: Copenhagen, Denmark Radiant heating & cooling, snowmelt and plumbing: football team Vikings headquarters and practice facility, Minnesota, USA Uponor heating & cooling solutions - winner of Diamond & Gold awards from German Sustainable Building Council (DGNB): 50Hertz headquarters, Berlin, Germany Radiant cooling solution to create the most advanced learning environment: New campus for the International School of Kuala Lumpur (ISKL), Kuala Lumpur Reducing energy consumption with Uponor TABS shortlisted for a prestigious H&V News award: Dudley College, UK First villa project in China - radiant heating & cooling to save energy and ensure high comfort: Changjia Villa, Kunshan, China Weholite stormwater tank to attenuate runoffs at the new Children's Hospital: Helsinki, Finland 7


")
8 Our business groups Plumbing solutions 49% ( * Indoor climate solutions 24% ( * Infrastructure solutions 27% ( * *) share of Group net sales 8


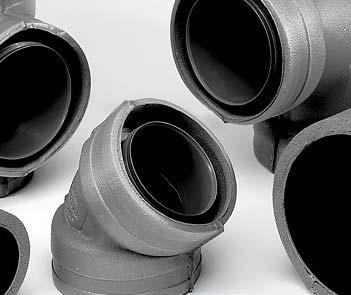
9 Uponor s plumbing offering For efficient and hygienic drinking water delivery Flexible pipe systems Multilayer pipe systems Risers Press fittings Prefabricated units Quick & Easy fittings Tools Intelligent water and hygiene 9


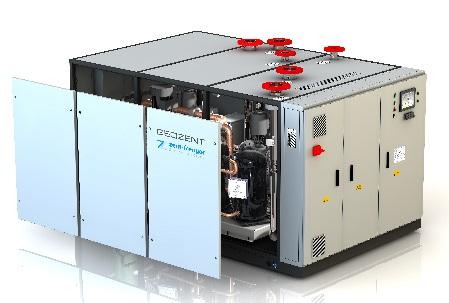
10 Uponor s indoor climate offering The basis for a comfortable and energy-efficient ambiance Radiant heating and cooling Thermally active slabs Ceiling cooling Geothermal energy stations Manifold stations Controls Local heat distribution Ventilation 10


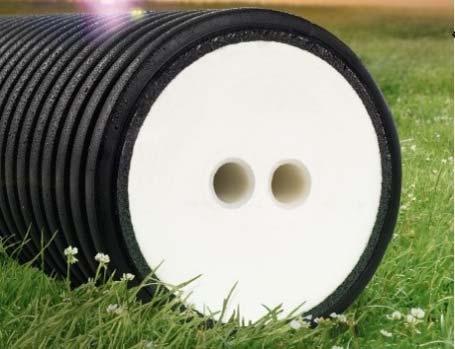
11 Uponor s infrastructure offering Transporting water, air, electricity, telecommunications and data Standard Solutions 360 Project Services Weholite Technology Licensing 11


12 Investment in R&D and technology After 2016, another year of historically high R&D expenditure, with a total expenditure at 23.2 million or 2.0% of net sales Key projects steered by Group Technology function, established in 2016 Investment in digitalisation and hygienic initiatives continued Phyn Plus New smart water offering, Phyn Plus UWater online monitoring maturing into market entry through Uponor Infra Hygienic fresh water stations Prefabricated offering development Uponor Smatrix Style 12
13 Phyn Plus smart water assistant with nationwide installer network being built up in North America Introduced in the U.S. market in January 2018 at leading trade shows Won a number of Smart Home awards Commercial sales started in Q2/2018 European introduction planned for ISH 2019 Authorised network of installers, the Uponor Pro Squad In February 2018, Uponor invested an additional USD10 million to boost Phyn expansion, bringing total investment to USD25 million, or 50% 13

14 The Uponor online water quality monitoring The Uponor online water quality monitoring technology was acquired in Dec 2015 The innovative online technology will make the potable water distribution safer Uponor currently pioneering in infrastructure applications for potable water networks The flexible technology can be applied to industry, residential and public premises, such as hospitals, nursing homes and hotels 14
15 Uponor s sustainability statement Uponor is committed to addressing the key issues of our time through innovations that help reduce environmental impact. Through partnerships, we strive to provide leadership in sustainable solutions for the mutual well-being of both people and the planet, while ensuring the long-term viability of our operations. Our sustainability pillars Strongly integrating sustainability into our corporate mindset Driving down our environmental impact Enriching life through our innovative solutions Engaging external stakeholders in our sustainability journey 15
 Renewed sustainability section in the Annual report 2017 following the EU guidelines on non-financial reporting Uponor has been reporting")
16 Uponor s non-financial performance Overall sustainability performance supported by operational streamlining, including production concentration to fewer sites Exceeded our goal of reducing GHG emissions by 20% per net sales by 2020 (from the 2015 levels) Renewed sustainability section in the Annual report 2017 following the EU guidelines on non-financial reporting Uponor has been reporting through CDP Climate change survey since

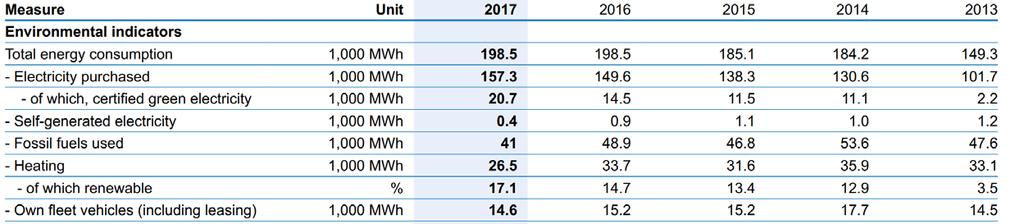
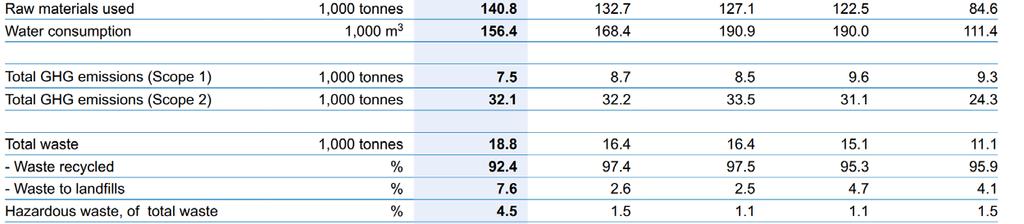
17 Development of environmental indicators 17
18 Major shareholders 30 June 2018 Oras Invest Ltd 22.6% Varma Mutual Pension Insurance Company 5.3% Nordea Nordic Small Cap Fund 3.8% Ilmarinen Mutual Pension Insurance Company 2.5% 34,8% Mandatum Life Insurance Company Ltd 1.4% The Local Government Pensions Institution 1.3% Nordea Pro Finland Fund 0.9% SEB Gyllenberg Finlandia Fund 0.9% Nominee registerations 26.5% Others 35.8% Currently valid foreign notifications 20 March 2017: the holdings of Franklin Resources, Inc., went down to below 5.0% 26,5% 22,6% 5,3% 3,8% 2,5% 1,4% 1,3% 0,9% 0,9% 19,459 shareholders at the end of June 2018 Foreign shareholding at 26.5%, vs 26.4% at the end of December
19 Shareholder value development % % % % M *1998*1999*2000*2001*2002*2003* % -30% -60% *FAS Market Cap 31 Dec Dividends Total Shareholder Return (rhs) 19
20 Long-term financial targets Since 12 February 2013 Organic net sales growth to exceed annual GDP growth* by 3 ppts EBIT margin to exceed 10% ROI to exceed 20% Gearing to stay within 30 to 70 as an annual average of the quarters Dividend pay-out to be at least 50% of annual earnings (considering the gearing target) Achievement in % (target 5.4%*) 8.2% (comparable EBIT 8.3%) 16.3% % * GDP growth based on a weighted average growth in the top 10 countries 20
21 Share price development Uponor, OMX Helsinki CAP PI rebased
22 Half year result briefing 1-6/2018 Jyri Luomakoski President and CEO, Uponor Corporation Maija Strandberg CFO, Uponor Corporation
23 Q2/2018: Growth was driven by Uponor Infra s strong performance April - June, M 4-6/ / 2018 Change Net sales % Operating profit % Comparable operating profit % Net sales Net sales of Building Solutions Europe grew moderately in most of the European markets Net sales of Building Solutions North America grew although the biggest customers had already been building up their stocks in Q1 Uponor Infra s net sales grew, particularly in North America, Sweden and Poland Operating profit Building Solutions Europe s profitability was impacted by higher raw material prices and promotional activities Operating profit of Building Solutions North America declined due to rising raw material costs and freight rates as well as start-up costs from the Hutchinson manufacturing facility Improvements in both North America and Europe increased Uponor Infra s operating profit 23

24 Development by segment: Building Solutions Europe Market environment remains positive Bottle necks in planning and installation capacity Temporary production challenges in prefabricated production in Germany impacted on net sales Modernisation of fitting production line in Hassfurt finalised, enabling more efficient production process 24

25 Development by segment: Building Solutions North America Despite increasing competition, the business environment has stayed healthy Succesful start-up of new Hutchinson manufacturing facility ahead of schedule Start-up costs burdened profitability Sales of Phyn Plus smart water monitoring and shut-off device began 25

26 Development by segment: Uponor Infra Market demand has been strong in North America, Sweden and Poland Benefits from the transformation programme are clearly visible in Europe Growth in the share of higher margin products in the sales mix 26


27 Financial statements Maija Strandberg CFO, Uponor Corporation 1 6 /
28 January June 2018: Key figures Uponor Group Change Y/Y 2017 Net sales M % 1,170.4 Operating profit M % 95.9 Comparable operating profit M % 97.2 Comparable operating profit margin % 6.8% 7.5% 0.7% pts 8.3% Earnings per share (diluted) % 0.83 Return on equity (p.a.) % 13.6% 15.4% +1.8% pts 19.4% Return on investment (p.a.) % 13.6% 13.5% -0.1% pts 16.3% Net interest bearing liabilities M % Gearing % 67.6% 64.2% -3.4% pts 43.5% Net working capital of net sales (p.a.) % 13.5% 14.0% +0.5% pts 10.4% Number of employees, end of period FTE 4,077 4, % 4,075 28
29 April June 2018: Income statement Uponor Group, M Change Y/Y Net sales % Cost of goods sold % Gross profit % Gross profit margin (%) 31.9% 33.0% +1.1% pts Other operating income % Expenses % Operating profit % Operating profit margin (%) 7.4% 8.6% +1.2% pts Financial expenses, net % Share of result in associated companies % Profit before taxes % Profit for the period % EBITDA % Net sales Negative translation impact from USD, CAD and SEK vs last year. In constant currency terms, net sales growth was 9.6% Comparable gross profit came to (99.2) million, with the comparable gross profit margin improving slightly to 33.0% (32.1%). Comparable operating profit came to 28.0 (23.8) million, a change of 17.9% 29
30 January June 2018: Income statement Uponor Group, M Change Y/Y 2017 Net sales % 1,170.4 Cost of goods sold % Gross profit % Gross profit margin (%) 33.1% 33.3% +0.2% pts 34.5% Other operating income % 3.1 Expenses % Operating profit % 95.9 Operating profit margin (%) 6.5% 7.5% +0.9% pts 5.5% Financial expenses, net % 5.4 Share of result in associated companies % -2.3 Profit before taxes % 88.2 Net sales grew 9.4% in constant currency terms A negative currency impact of 25.4 million mainly driven by the USD, CAD and SEK Comparable gross profit margin stayed on par 33.3% (33.3%) yearon-year. Comparable operating profit came to 45.0 (38.8) million, a change of 16.0% Profit for the period % 65.4 EBITDA %


31 January June 2018: Net sales & operating profit by segment Currency: M Net sales Operating profit Building Solutions - Europe Building Solutions - North America Uponor Infra 0 Building Solutions - Europe Building Solutions - North America Uponor Infra Building Solutions Europe s net sales grew in most of the European markets but the increasing raw material prices and promotional activities had an impact on operating profit Building Solutions North America s net sales grew but the rising level of freight rates as well as the start-up costs of the new manufacturing facility in Hutchinson reduced operating profit. On the positive side, the start-up of Hutchinson in the second quarter was successful and ahead of schedule Uponor Infra benefited from strong sales in both North America and Europe. Also growing the share of higher margin products in the sales mix improved the comparable operating profit 31
32 January June 2018 Net sales development by key markets M Net sales growth driven by USA, Sweden, Net Canada sales growth and Poland driven by USA, Sweden, Canada and Poland USA Germany Finland Sweden Canada Denmark Netherlands Spain Norway Poland Others Jan-Jun 2016 Jan-Jun 2017 Jan-Jun 2018 Growth % in EUR 8.8% -0.7% -1.7% 7.8% 3.6% -3.6% 3.1% 4.3% 7.8% 83.2% 2.6% % in Curr. 20.1% 14.9% 10.3% -3.4% 12.3% 82.9% 32
33 January June 2018: Balance sheet Uponor Group, M 30 Jun 30 Jun Change 31 Dec Y/Y 2017 Property, plant and equipment Intangible assets Securities and long-term investments Inventories Cash and cash equivalents Other current and non-current assets Assets total Total equity Non-current interest-bearing liabilities Provisions Non-interest-bearing liabilities Current interest-bearing liabilities Shareholders' equity and liabilities total Investments were mainly related to capacity expansion and efficiency improvement Uponor invested a further USD 10 million ( 8.1million) in Phyn in February 2018, bringing total to USD 25 million Repayment of 80 million bond in June was mostly covered by issuing commercial papers of 70 million 35.8 million in dividends was declared - Two instalments: 1 st part was paid in March, 2 nd scheduled for September Gearing at 64.2% (67.6%), four-quarter rolling gearing at 55.6% (61.9%) 33
34 January June 2018: Cash flow Uponor Group, M Change Y/Y 2017 Net cash from operations Change in NWC Net payment of income tax and interest Cash flow from operations Cash flow from investments Cash flow before financing Dividends paid Other financing Cash flow from financing Gross investments came to 24.9 (19.3) million Cash flow from business operations came to million, due to an increase in net working capital Cash flow from financing includes the first dividend instalment of a total of 35.8 million Conversion differences Change in cash and cash equivalents


35 Outlook for the future Jyri Luomakoski President and CEO, Uponor Corporation 35
36 Leading indicators: Still solid, but moderating from recent highs Indicator YTD % Change Rolling 12-month % Change Data through USA Housing starts +20% 1) N/A May 2018 Germany Housing permits 0% -4% April 2018 Finland Housing permits -7% +8% April 2018 Sweden Housing starts -14% 0 March 2018 Canada Housing starts 0% 1) N/A May 2018 Denmark Construction index -7% N/A April 2018 Netherlands Housing permits +10% +9% April 2018 Spain Housing permits +23% +39% April 2018 Norway Housing starts -18% -14% May 2018 Poland Housing completions +10% +10% February ) Seasonally adjusted, annualised rate vs. same month in previous year Source: National Statistics Offices Trend since Q1 update 36
37 Residential building permits remain strong in Europe, but may have plateaued Residential permits for January to March 2018 increased from the same period in 2017, but have retreated from the 10-year high seen in December European building permits index (Euro Area 19, seasonally adjusted) Developments in the more volatile nonresidential segment have been mixed, but permit activity seems to be trending upward overall Jan-08 Jul-08 Jan-09 Jul-09 Jan-10 Jul-10 Jan-11 Jul-11 Jan-12 Jul-12 Jan-13 Jul-13 Jan-14 Jul-14 Jan-15 Jul-15 Jan-16 Jul-16 Jan-17 Jul-17 Jan-18 Source: Eurostat (Base year = 2015) Residential Non-residential 37
38 Builder confidence in Europe has improved overall 20 EU construction confidence index 25 Change in construction confidence index (Q avg. vs Q avg.) Jan-09 Jul-09 Jan-10 Jul-10 Jan-11 Jul-11 Jan-12 Jul-12 Jan-13 Jul-13 Jan-14 Jul-14 Jan-15 Jul-15 Jan-16 Jul-16 Jan-17 Jul-17 Jan Source: Eurostat 38
39 USA strong economic growth continues Private consumption and, especially, business investments appear to be gaining strength from recent tax cuts, contributing to strong economic growth Within the construction industry: Construction spending through May rose in nearly every residential and non-residential segment annualised housing starts (in 000 s) Housing Market Index (HMI) and housing starts HMI Builder confidence remains high, but has fallen slightly in part because of increasing input prices 0 Single-family starts (lhs) Multi-family Starts (lhs) 0 Housing Market Index (rhs) Source: US Census, NAHB/Wells Fargo 39
40 Germany construction confidence remains at high level Private consumption continues to drive growth in the economy. However, some signs of weakness are present in the business sector, with investor confidence at a 5-year low and factory orders falling Within the construction industry: Construction confidence remains at alltime highs Although permit levels have fallen, the skilled labour shortage means a significant backlog still exists Permits (rolling 12-month total) German housing permits and builder confidence Jan-09 Aug-09 Mar-10 Oct-10 May-11 Dec-11 Jul-12 Feb-13 Sep-13 Apr-14 Nov-14 Jun-15 Jan-16 Aug-16 Mar-17 Oct-17 May Construction confidence indicator Rolling 12-month permit total (lhs) Construction confidence (rhs) Source: Destatis and Eurostat 40


41 Management agenda for H2/2018 Selling price management in all segments to reflect the impacts of rising raw material costs and freight rates Driving our digital agenda forward, including promotion of Phyn in North America and preparation of its European launch While the BLD E transformation programme was carried out in line with the plans, further review of the operational footprint still needs to be done Secure that the good start of operations in Hutchinson continues 41
42 Guidance 2018: revised on 5 September 2018 No signs of construction markets getting weaker in Europe or North America. Going forward, one should take a note that the comparison period in the third quarter 2017 was exceptionally strong after the recovery from the temporary production issue in Building Solutions North America in April 2017 The Group's capital expenditure, excluding any investment in shares, will remain at roughly the same level as in 2017, mainly driven by the capacity expansion programme in North America Assuming that economic development in Uponor's key geographies continues undisturbed, Uponor s full-year guidance for 2018 is: Excluding the impact of currencies, Uponor expects its organic net sales to grow from 2017 and comparable operating profit to remain at the same level as in

43 Why invest in Uponor The company: An industry innovator building on a century of tradition Established brand with a proven historic growth, organically and through acquisitions Stable business with a track record of profitable performance, even during downturns An up-to-date production network from the production technology perspective, as well as regional spread Committed long-term key ownership with a clear understanding of the industry s dynamics The business: Solutions for safe drinking water delivery, energyefficient heating and cooling and reliable infrastructure A leading international supplier of plastic plumbing and hydronic radiant heating systems and a strong position in civil engineering pipe systems in northern Europe A proven track record of superior quality supported by product, system and value chain innovation that meets customer expectations Total offering committed to: Comfort, Health, Efficiency, Sustainability and Safety Read more at: 43


44 New & improved version of Uponor s IR app available! Watch our webcasts Watch our quarterly release webcasts live or recorded via the app Create a watchlist Monitor our stock performance against other listed companies globally Share content with your network Share content with your connections via social media channels or through Be the first to know Turn on the push notifications to stay posted on our current news and events Download now!

45 Uponor IR site: investors.uponor.com Uponor s IR app: Follow us
Uponor roadshow presentation Q3/2018. Jyri Luomakoski, President and CEO Maija Strandberg, CFO
 Uponor roadshow presentation Q3/2018 Jyri Luomakoski, President and CEO Maija Strandberg, CFO Uponor celebrates its centenary in 2018 SHK Essen Germany Aquatherm Moscow, Russia Nordbygg Stockholm, Sweden
Uponor roadshow presentation January March Jyri Luomakoski, President and CEO Maija Strandberg, CFO
 Uponor roadshow presentation January March 2018 Jyri Luomakoski, President and CEO Maija Strandberg, CFO Uponor celebrates its centenary in 2018 SHK Essen Germany Aquatherm Moscow, Russia Nordbygg Stockholm,
Uponor roadshow presentation January December Jyri Luomakoski, President and CEO Maija Strandberg, CFO
 Uponor roadshow presentation January December 2017 Jyri Luomakoski, President and CEO Maija Strandberg, CFO Uponor at a glance Leading international provider of plastic based piping systems for buildings
Financial results briefing 1-12/2017. Jyri Luomakoski President and CEO, Uponor Corporation Maija Strandberg CFO, Uponor Corporation
 Financial results briefing 1-12/2017 Jyri Luomakoski President and CEO, Uponor Corporation Maija Strandberg CFO, Uponor Corporation Q4/2017: Building and construction markets were lively in North America,
Uponor roadshow presentation FY 2018
 Uponor roadshow presentation FY 2018 Jyri Luomakoski, President and CEO Uponor at a glance Uponor is a leading international provider of plastic based piping systems for buildings and infrastructure. We
Enriching people s way of life Roadshow presentation Q Jyri Luomakoski, President & CEO Maija Strandberg, CFO May 2017
 Enriching people s way of life Roadshow presentation Q1 2017 Jyri Luomakoski, President & CEO Maija Strandberg, CFO May 2017 Why invest in Uponor The company: An industry innovator building on a century
Enriching people s way of life Roadshow presentation Jyri Luomakoski, President and CEO Riitta Palomäki, CFO May 2016
 Enriching people s way of life Roadshow presentation Jyri Luomakoski, President and CEO Riitta Palomäki, CFO May 2016 Uponor at a glance Uponor is a leading international provider of plastic based piping
Enriching people s way of life. Roadshow presentation January September 2017 Jyri Luomakoski, President & CEO Maija Strandberg, CFO October 2017
 Enriching people s way of life January September 2017 Jyri Luomakoski, President & CEO Maija Strandberg, CFO Why invest in Uponor The company: An industry innovator building on a century of tradition Established
Interim results briefing. Jyri Luomakoski President and CEO Riitta Palomäki CFO 1 9 / 2016
 Interim results briefing Jyri Luomakoski President and CEO Riitta Palomäki CFO 1 9 / 2016 Q3/2016: Performance in Europe improved, supply issues impacted North American business July - September, M Net
Interim results briefing Jyri Luomakoski President and CEO Riitta Palomäki CFO 1 3 / 2016
 Interim results briefing Jyri Luomakoski President and CEO Riitta Palomäki CFO 1 3 / 2016 Q1/2016: Steady progress in Europe, strong growth in North America January - March, M Net sales Healthy U.S. market
Financial results briefing Q3/2015
 Financial results briefing Q3/2015 Jyri Luomakoski President and CEO Uponor Corporation Uponor, Inc. factory, Apple Valley, Minnesota, USA Q3/2015 market overview Nordics Construction activity in Sweden
Performance in January-June August 2010
 Performance in January-June 2010 12 August 2010 Jyri Luomakoski President and CEO Uponor Corporation Summary of Q2/2010 Financial turmoil after Q1 rocked the stabilising development in the market-place
Financial results briefing Q3/2012
 Financial results briefing Q3/2012 Jyri Luomakoski President and CEO Uponor Corporation NCC Uponor s new head office, which will be taken into use 1 Jan 2013, will showcase sustainable and innovative Uponor
Half year financial report
 Half year financial report January June 2018 25 July 2018 HALF YEAR FINANCIAL REPORT JANUARY JUNE 2018 Growth of net sales and operating profit was driven by strong performance by Uponor Infra Net sales
Interim report. January September 2018
 Interim report January September 2018 24 October 2018 INTERIM REPORT JANUARY SEPTEMBER 2018 Net sales and comparable operating profit fell behind from exceptionally strong comparison period Net sales in
Results briefing Helsinki 26 October 2007
 Results briefing Helsinki 26 October 2007 Jan Lång President and CEO Declining market trends in Q3 Q3 showed a rapid drop in residential housing solutions demand Infrastructure solutions demand on satisfactory/good
Strategic update. Jyri Luomakoski President and CEO, Uponor Corporation 11 December 2013
 Strategic update Jyri Luomakoski President and CEO, Uponor Corporation 11 December 2013 Presentation outline Markets Strategy Long-term financial targets In summary Appendices 2 Markets Building and construction
INTERIM REPORT 2010 Performance in January-March April Jyri Luomakoski President and CEO Uponor Corporation
 INTERIM REPORT 2010 Performance in January-March 2010 28 April 2010 Jyri Luomakoski President and CEO Uponor Corporation Summary of Q1/2010 What looked like an emerging recovery of building markets was
Interim Jan-March 2007 results briefing Helsinki 26 April Jan Lång President and CEO
 Interim Jan-March 2007 results briefing Helsinki 26 April 2007 Jan Lång President and CEO Q1/2007: Positive market environment in Europe, decline in U.S. continues Lively demand for Uponor solutions Strong
Annual results briefing 2003
 Annual results briefing 2003 Helsinki, 3 Feb. 2004 Market and business review Financial statement 2003 Update on the restructuring programme New organisation at 1 March 2004 Outlook Jan Lång, CEO Jyri
Uponor Corporation Stock exchange release 3 Aug :00 JANUARY-JUNE 2006: UPONOR REPORTS CONTINUED STRONG DEVELOPMENT
 Uponor Corporation Stock exchange release 3 Aug. 11:00 JANUARY-JUNE : UPONOR REPORTS CONTINUED STRONG DEVELOPMENT - Net sales and results remained strong in the second quarter - Net sales (January-June)
Interim Jan June/ 2005 results briefing
 Interim Jan June/ 2005 results briefing Helsinki, 4 August 2005 Market and business review Financial results Outlook Jan Lång, President and CEO Jyri Luomakoski, CFO and Deputy CEO Jan Lång Questions Interim
WAVIN GROUP REPORTS STRONG INCREASE IN REVENUE AND OPERATING RESULTS IN FIRST HALF YEAR 2007
 WAVIN GROUP REPORTS STRONG INCREASE IN REVENUE AND OPERATING RESULTS IN FIRST HALF YEAR 2007 Zwolle, 6 September 2007 Wavin N.V., leading supplier of plastic pipe systems and solutions in Europe, today
Interim report January March 2018
 Interim report January March 2018 3 May 2018 INTERIM REPORT JANUARY MARCH 2018 Strong net sales of North American businesses drive performance improvement in the first quarter Strong growth in net sales
ENIRO Q3 REPORT Johan Lindgren, CEO Mattias Lundqvist, CFO Cecilia Lannebo, Head of IR
 ENIRO Q3 REPORT 2012-10-25 Johan Lindgren, CEO Mattias Lundqvist, CFO Cecilia Lannebo, Head of IR CEO INTRODUCTION & SUMMARY A digital media company with 74 percent of revenues being digital the transformation
Clas Ohlson: Year-end report 1 May April 2013
 Clas Ohlson: Year-end report 1 May 2012 30 April 2013 Fourth quarter * Sales totalled SEK 1,274 M (1,272). In local currencies, growth was 3%. * Operating loss of SEK 19 M reported (profit: 10). * Loss
FULL YEAR REPORT, 2017 TELEPHONE/AUDIO CONFERENCE 8 FEBRUARY 2018, AT CET TOMMY ANDERSSON, PRESIDENT AND CEO HELENA WENNERSTRÖM, EVP AND CFO
 TELEPHONE/AUDIO CONFERENCE 8 FEBRUARY 2018, AT 15.30 CET TOMMY ANDERSSON, PRESIDENT AND CEO HELENA WENNERSTRÖM, EVP AND CFO DIRECT LINK AUDIOCAST: HTTPS://TV.STREAMFABRIKEN.COM/BULTEN Q4 2017 TELECONFERENCE:
PROPERTY EU EUROPEAN LOGISTICS INVESTMENT BRIEFING
 PROPERTY EU EUROPEAN LOGISTICS INVESTMENT BRIEFING RICHARD HOLBERTON, SENIOR DIRECTOR, EMEA RESEARCH, CBRE FEBRUARY 19 TH 2015 AGENDA Economy Market Activity Forecasts Issues ECONOMY 2014 Some Alarms and
Lindab Group presentation Q3 2010
 lindab group presentation Lindab Group presentation Q3 2010 David Brodetsky, CEO Nils-Johan Andersson, CFO Agenda Highlights Group Business Areas Strategy Trends and outlook Q & A 2 Lindab Group Highlights
RESULT JANUARY-JUNE 2006, August 8th. Mr. Kim Gran, President and CEO
 RESULT JANUARY-JUNE 2006, August 8th Mr. Kim Gran, President and CEO 1 CONTENTS Result H1 2006 Page Key figures 3 Operating profit per quarter 4 Market situation 5 Nokian Tyres H1 2006 6 Net sales by product
Eurozone Economic Watch. February 2018
 Eurozone Economic Watch February 2018 Eurozone: Strong growth continues in 1Q18, but confidence seems to peak GDP growth moderated slightly in, but there was an upward revision to previous quarters. Available
SIX MONTHS REPORT, JAN JUN 2018
 SIX MONTHS REPORT, JAN JUN 2018 TELEPHONE/AUDIO CONFERENCE 11 JULY 2018, AT 11.00 CET TOMMY ANDERSSON, PRESIDENT AND CEO HELENA WENNERSTRÖM, EVP AND CFO DIRECT LINK AUDIOCAST: HTTPS://TV.STREAMFABRIKEN.COM/BULTEN
Communication on the future of the CAP
 Communication on the future of the CAP The CAP towards 2020: meeting the food, natural resources and territorial challenges of the future Tassos Haniotis, Director Agricultural Policy Analysis and Perspectives
Huhtamaki roadshow presentation. Investor Relations Q1 2009
 Huhtamaki roadshow presentation Investor Relations 2009 Huhtamaki in brief A leading manufacturer of consumer and specialty packaging with head office in Espoo, Finland Net sales EUR 2.3 billion in 65
Eurozone Economic Watch. March 2018
 Eurozone Economic Watch March 20 Eurozone Economic Watch March 20 Eurozone: The moderation of confidence continues We expect GDP growth to remain steady early this year supported mostly by strong global
Update on current strategy
 Update on current strategy Jan Lång President and CEO The strategic actions launched in 2003 have mostly been completed Growth Brand Operational excellence Build on current platforms Grow essentially organically
Interim Report January September 2013
 Interim Report January September 2013 Juhani Pitkäkoski President and CEO November 1, 2013 Contents Financial development Development by business Financial position Market outlook and guidance July September
ENIRO Q1 REPORT Johan Lindgren, CEO Mattias Lundqvist, CFO Cecilia Lannebo, Head of IR
 ENIRO Q1 REPORT 2012-04-25 Johan Lindgren, CEO Mattias Lundqvist, CFO Cecilia Lannebo, Head of IR FINANCIAL HIGHLIGHTS, Q1 2012 Revenues SEK 959 M (966), a decline of 0,7% (-24). Organically revenues declined
Important dates in Uponor Investor Relations
 Annual report 2016 Important dates in 2017 Annual General Meeting Uponor Corporation s Annual General Meeting will be held on Monday, 20 March 2017 at 15.00 EET at the Helsinki Exhibition and Convention
H & M HENNES & MAURITZ AB NINE-MONTH REPORT
 NINE-MONTH REPORT 2010 H & M HENNES & MAURITZ AB NINE-MONTH REPORT 1 December 2009 31 August 2010 NINE MONTHS The H&M Group s sales excluding VAT during the first nine months of the financial year amounted
Banking in a tough environment
 Banking in a tough environment Carnegie Nordic Large Cap Seminar Stockholm Tonny Thierry Andersen CFO & Member of the Executive Board March 3, 2009 The real economy is now severely affected Index Industrial
The real change in private inventories added 0.15 percentage points to the second quarter GDP growth, after subtracting 0.65% in the first quarter.
 QIRGRETA Monthly Macroeconomic Commentary United States The U.S. economy rebounded in the second quarter of 2007, growing at an annual rate of 3.4% Q/Q (+1.8% Y/Y), according to the GDP advance estimates
Makes it easier to be professional
 Makes it easier to be professional Handelsbanken Nordic Mid/small Cap Seminar June 8, 2017 President and CEO Johan Nilsson 2 2 Introduction One-Stop-Shop multi channel offering for professionals Branches
Financial Statements Release January December 2018
 Financial Statements Release January December 2018 Disclaimer In this presentation, all forward-looking statements in relation to the company or its business are based on the management judgment, and macroeconomic
HUHTAMÄKI OYJ INTERIM REPORT. January 1 March 31, 2012
 HUHTAMÄKI OYJ INTERIM REPORT January 1 March 31, 2012 Huhtamäki Oyj, Interim Report January 1 March 31, 2012 Good start to the year Net sales growth in all segments Improved profitability Strong performance
lindab we simplify construction Lindab Group Q Fredrik von Oelreich Acting President and CEO Kristian Ackeby CFO
 lindab we simplify construction Lindab Group Q1 2018 Fredrik von Oelreich Acting President and CEO Kristian Ackeby CFO Agenda Summary and overview Financials Highlights Outlook Summary and Q&A Summary
Huhtamaki roadshow presentation. Investor Relations Copenhagen Jan 8, 2010
 Huhtamaki roadshow presentation Investor Relations Copenhagen Jan 8, 2010 Huhtamaki in brief A leading manufacturer of consumer and specialty packaging with head office in Espoo, Finland Net sales EUR
Lindab Group presentation Q2 2010
 lindab group presentation Lindab Group presentation Q2 2010 David Brodetsky, CEO Nils-Johan Andersson, CFO Agenda Highlights Group Business Areas Strategy Trends and outlook Q & A 2 Lindab Group Highlights
FINANCIAL STATEMENTS 1 Jan-31 Dec 2016 Uponor Corporation
 FINANCIAL STATEMENTS 1 Jan-31 Dec 2016 Uponor Corporation CONTENTS Review by the Board of Directors 3 Group key figures 14 Share-specific key figures 15 Definitions of key ratios 16 Consolidated statement
Func Food Group Financial Release / Q2 2017
 Func Food Group Financial Release / Q2 2017 Func Food Group Financial Release / Q2 2017 Func Food Group / Q2 2017 3 FUNC FOOD GROUP IN BRIEF Func Food Group ( FFG ) is a Nordic wellness company, which
Interim report 1 May January 2014
 Interim report 1 May 2013 31 January 2014 Third quarter 2013/14 Sales increased by 3 % to 2,238 MSEK (2,169). In local currencies, the increase was 7 % Operating profit increased by 34 % to 330 MSEK (247)
Tieto Q4/2012. Kimmo Alkio President and CEO Lasse Heinonen CFO Pellervo Hämäläinen VP, Communications & IR. 6 February 2013
 Tieto Q4/2012 Kimmo Alkio President and CEO Lasse Heinonen CFO Pellervo Hämäläinen VP, Communications & IR 2013 Tieto Corporation 6 February 2013 1 Q4 2012 in brief Strong improvement in underlying profitability
Interim report Q3, July September 2017 Stockholm, 25 October 2017
 Interim report Q3, July September Stockholm, 25 October As of the second quarter of, Cloetta Italia S.r.l. is accounted for as discontinued operation. The comparative figures in the consolidated profit
March 2005 Euro-zone external trade surplus 4.2 bn euro 6.5 bn euro deficit for EU25
 STAT/05/67 24 May 2005 March 2005 Euro-zone external trade surplus 4.2 6.5 deficit for EU25 The first estimate for euro-zone 1 trade with the rest of the world in March 2005 was a 4.2 billion euro surplus,
U.S. Steel Market Outlook. Amy Ebben ArcelorMittal USA November 30, 2018
 U.S. Steel Market Outlook Amy Ebben ArcelorMittal USA November 30, 2018 Agenda ArcelorMittal introduction U.S. steel industry performance and trade Global steel industry Review of steel markets 1 About
Financial Results 2018 Johan Torgeby, President & CEO. Telephone conference 30 January 2019
 Financial Results 2018 Johan Torgeby, President & CEO Telephone conference 30 January 2019 jan-17 apr-17 jul-17 okt-17 jan-18 apr-18 jul-18 okt-18 jan-17 apr-17 jul-17 okt-17 jan-18 apr-18 jul-18 okt-18
Annual Accounts February 1, 2007 Juha Rantanen, CEO.
 Annual Accounts 2006 February 1, 2007 Juha Rantanen, CEO www.outokumpu.com Highlights in 2006 Market development Improvement actions update and strategic direction Annual Accounts 2006 Outlook 2 February
Interim Report for Duni AB (publ) 1 January 30 June 2009
 1 January 30 June 2009") Interim Report for Duni AB (publ) 1 January 30 2009 (compared with the same period of the previous year) 29 July 2009 Strong cash flow and stable profitability 1 January 30 2009 Net sales increased by
Interim Report for Duni AB (publ) 1 January 30 2009 (compared with the same period of the previous year) 29 July 2009 Strong cash flow and stable profitability 1 January 30 2009 Net sales increased by
HeidelbergCement Half Year Results 28 July 2015 Dr. Bernd Scheifele, CEO and Dr. Lorenz Näger, CFO
 HeidelbergCement 2015 Half Year Results 28 July 2015 Dr. Bernd Scheifele, CEO and Dr. Lorenz Näger, CFO Slide 1-2015 Half Year Results - 28 July 2015 Disclaimer Unless otherwise indicated, the financial
Eurozone Economic Watch. May 2018
 Eurozone Economic Watch May 2018 BBVA Research - Eurozone Economic Watch / 2 Eurozone: more moderate growth with higher uncertainty The eurozone GDP growth slowed in more than expected. Beyond temporary
Looking back on a good year
 Looking back on a good year Profit at USD 111.2 million, up by USD 44.7 million, or 67% EBITDA in 2015 at USD 219.0 million, as compared to USD 154.3 million in 2014 Operating revenue increased by 2% between
BE Group Year-end report 2006
 BE Group Year-end report 2006 Håkan Jeppsson, CEO Torbjörn Clementz, CFO BE Group in Brief A leading supplier independent steel service company. Broad range of steel, stainless steel and aluminium products.
Quarterly Report 01/2018
 Q1 Quarterly Report 01/2018 CENTROTEC The European Energy-Saving Company Highlights > International expansion continues; stable development in German heating market > Group revenue up 1.5% on prior-year
HUGO BOSS First Nine Months Results 2011
 HUGO BOSS First Nine Months Results 2011 Mark Langer (CFO) November 2, 2011 Conference Call, First Nine Months Results 2011 HUGO BOSS November 2, 2011 2 / 30 AGENDA OPERATIONAL HIGHLIGHTS FIRST NINE MONTHS
H & M HENNES & MAURITZ AB NINE-MONTH REPORT
 H & M HENNES & MAURITZ AB NINE-MONTH REPORT 1 December 2012 31 August 2013 NINE-MONTHS The H&M Group s sales including VAT increased in local currencies by 8 percent in the first nine months of the financial
Swedbank year-end results 2018
 Swedbank year-end results 218 Birgitte Bonnesen (CEO), Anders Karlsson (CFO), Helo Meigas (CRO) Strong financial result in 218 delivered on strategic priorities SELECTED 218 DELIVERIES Continued digitisation
First estimate for 2011 Euro area external trade deficit 7.7 bn euro bn euro deficit for EU27
 27/2012-15 February 2012 First estimate for 2011 Euro area external trade deficit 7.7 152.8 deficit for EU27 The first estimate for the euro area 1 (EA17) trade in goods balance with the rest of the world
EUROZONE ECONOMIC WATCH JANUARY 2017
 EUROZONE ECONOMIC WATCH JANUARY 2017 Key messages: some changes for the better Improving confidence in across the board shows the resilience of the eurozone to the various potentially disturbing political
SEE macroeconomic outlook Recovery gains traction, fiscal discipline improving. Alen Kovac, Chief Economist EBC May 2016 Ljubljana
 SEE macroeconomic outlook Recovery gains traction, fiscal discipline improving Alen Kovac, Chief Economist EBC May 216 Ljubljana Real economy highlights Recent GDP track record reveals more favorable footprint
Cembrit Group Q Unaudited interim report
 Cembrit Group Q4 2017 Unaudited interim report 2017 main events COMMENTARY Strong demand across both markets and product categories resulted in revenue growth of 7.9% YoY 2017 EBITDA showed solid underlying
August 2005 Euro-zone external trade deficit 2.6 bn euro 14.2 bn euro deficit for EU25
 STAT/05/132 20 October 2005 August 2005 Euro-zone external trade deficit 2.6 14.2 deficit for EU25 The first estimate for euro-zone 1 trade with the rest of the world in August 2005 was a 2.6 billion euro
Revenue and earnings growth continued JANUARY-SEPTEMBER 2018
 JARI ROSENDAL, PRESIDENT AND CEO PETRI CASTRÉN, CFO OCTOBER 24, 2018 Revenue and earnings growth continued JANUARY-SEPTEMBER 2018 Key financial highlights Q3 2018 Organic growth +9% Growth continued driven
The real change in private inventories added 0.22 percentage points to the second quarter GDP growth, after subtracting 0.65% in the first quarter.
 QIRGRETA Monthly Macroeconomic Commentary United States The U.S. economy bounced back in the second quarter of 2007, growing at the fastest pace in more than a year. According the final estimates released
JANUARY-MARCH Interim Report High order intake and increased sales, plus clear earnings improvement
 ON RSTP FRNT USB PWR CON X1 X5 X9 X2 X3 24-11 V DC X4 X8 1BASE-T X6 X1 X7 X11 X12 M12 Torque.6±,1 Nm /,45±,1 lbft Interim Report 1 218 Video recording DC OPR ERR X1 X2 Signal DC OPR ERR X1 X2 Cloud solution
Continued favourable organic growth
 Continued favourable organic growth (Figures in brackets refer to the corresponding period in 2006.) Sales for kitchen company Nobia rose by 6 per cent during the third quarter to SEK 3,861 million (3,631).
Mobile Bank. Countries. Year-on-year profit growth. Frankfurt Prime Standard
 2 Consumer loans Business loans Mobile Bank years of profitable growth Active & former customers Countries Q1 2018 revenue Year-on-year revenue growth Year-on-year profit growth Founded Helsinki 2005 EU
Altia Financial Statements Release
 Altia Financial Statements Release 1 January 31 December 2016 Renewed Altia further improved its profitability Altia s profitability continued to improve in 2016 in spite of net sales being lower than
Interim Report January September 2018
 Interim Report January September 2018 Ari Lehtoranta, President and CEO Martti Ala-Härkönen, CFO 25 October 2018 Contents Group development Q3/2018 Cash flow and financing Market outlook Update on the
VINX 30 Index. More information about the Index can be found at
 VINX 30 Index The VINX 30 Index is the leading share index of the Nordic Exchanges and the Oslo exchange. The index consists of the 30 largest and most actively traded shares listed on NASDAQ OMX Nordic
interim report January 1 March 31, 2011
 Q1 interim report January 1 March 31, 2011 Helsinki, May 5, 2011 Strong first-quarter performance: net sales and operating profit up First quarter 2011 in brief: - Net sales increased 11% to EUR 189.3
Interim Report January March 2017
 First Quarter - 2017 Interim Report January March 2017 Order intake was MSEK 1,314.0 (1,142.0), which is an overall growth of.1% adjusted to 4.7% for acquisitions of MSEK 118.0. The overall year to date
First Quarter Report 2011
 Copenhagen, Helsinki, Oslo, Stockholm, 28 April 2011 First Quarter Report 2011 Solid quarter CEO Christian Clausen s comment to the report: I am proud to present another strong quarter. Our relationship
Financial statement for fourth quarter and the full year 2004
 Financial statement for fourth quarter and the full year 24 THE LINDAB GROUP OPERATING PROFIT INCREASED FROM SEK 35 MILLION TO SEK 374 MILLION CASH FLOW AMOUNTED TO SEK 269 MILLION ORGANIC GROWTH AT 7.4
On track! Results for Q1 Q3 2017
 On track! Results for Q1 Q3 2017 Technology-based financial services Investment highlights in Q1 Q3 2017 and forecast for 2017 Key figures for Q1 Q3 2017 (yoy) Revenue: 143.7 million (+27%) EBIT: 18.6
First half sales growth and positive market conditions give confidence for an upgraded outlook for the year
 First half year report of 2017 for ROCKWOOL International A/S Release no. 8 2017 to Nasdaq Copenhagen First half sales growth and positive market conditions give confidence for an upgraded outlook for
Interim report Q1/2014. Sakari Tamminen, President & CEO Rautaruukki Corporation 24 April 2014
 Interim report Q1/214 Sakari Tamminen, President & CEO Rautaruukki Corporation 24 April 214 Agenda Q1 in brief, key figures Financial performance Business area performance Near-term outlook and guidance
Zenith Monthly Economic Report October 2011
 Zenith Monthly Economic Report October 211 ECONOMIC STATISTICS SUMMARY Cash Rate Inflation Rate (%) Unemployment Rate (%) GDP Annual Growth (%) Country Latest Last Change Latest Change Latest Change Past
HUHTAMÄKI OYJ INTERIM REPORT. January 1 March 31, 2013
 HUHTAMÄKI OYJ INTERIM REPORT January 1 March 31, 2013 Huhtamäki Oyj, Interim Report January 1 March 31, 2013 Net sales and EBIT increased Net sales growth of 4% led by the foodservice acquisition in Asia
Orders received increased to EUR 3.1 billion and Comparable EBITA to EUR 196 million in 2016
 Orders received increased to EUR 3.1 billion and Comparable EBITA to EUR 196 million in 216 Financial Statements Review 216 February 8, 217 Pasi Laine, President and CEO Kari Saarinen, CFO Agenda Financial
SA Food Inflation Why all the fuss?
 SA Food Inflation Why all the fuss? Gina Schoeman Lead SA Economist February/March 211 The Food Map SA CPI Global EM SA CPI Food The Food Story SA SA Retail SA Manu SA Agri 2 Global food inflation Global
Valmet focus on profitability improvement
 Valmet focus on profitability improvement SEB Nordic Seminar 2015, Copenhagen Pasi Laine, President and CEO Agenda Valmet Roadshow 1 2 3 4 Valmet overview Financial targets Q3/2014 in brief Conclusions
A good start to the year
 1 A good start to the year 28 April 2011 No. 17/11 Sales totaled SEK 8,699 M (8,345), representing an increase of 4%, made up of 6% organic growth, 7% acquired growth and exchange-rate effects of 9%. Strong
January 2005 Euro-zone external trade deficit 2.2 bn euro 14.0 bn euro deficit for EU25
 42/2005-23 March 2005 January 2005 Euro-zone external trade deficit 2.2 14.0 deficit for EU25 The first estimate for euro-zone 1 trade with the rest of the world in January 2005 was a 2.2 billion euro
Positive trend in earnings and strong cash flow
 Positive trend in earnings and strong cash flow Presentation of the Q3/2017 result Martin Lindqvist, President & CEO Håkan Folin, CFO October 25, 2017 Agenda Q3/2017 and performance by division Financials
1 INTERIM REPORT JANUAR Y JUNE 20 18
 1 INTERIM REPORT JANUAR Y JUNE 20 18 TRADEDOUBLER INTERIM REPORT JANUARY JUNE 2 INTERIM REPORT JANUAR Y JUNE 20 18 Table of contents Table of contents... 2 CEO Matthias Stadelmeyer s comments... 5 Tradedoubler
Eurozone Economic Watch. July 2018
 Eurozone Economic Watch July 2018 Eurozone: A shift to more moderate growth with increased downward risks BBVA Research - Eurozone Economic Watch July 2018 / 2 Hard data improved in May but failed to recover
Q2 Presentation August 23 rd 2018
 Q2 Presentation August 23 rd 2018 PRESENTERS Michael Holmberg CEO Andreas Kovacs CFO 2 3 RAKETECH S MISSION To guide and inspire people to informed decisions. RAKETECH S VISION To always be the first choice
CONSTI GROUP PLC INTERIM REPORT 1 JANUARY 30 SEPTEMBER 2018
 CONSTI GROUP PLC INTERIM REPORT 1 JANUARY 30 SEPTEMBER 2018 CEO Esa Korkeela CFO Joni Sorsanen Contents Highlights and Group performance Cash flow and financial position Market outlook, guidance and summary
H & M HENNES & MAURITZ AB THREE-MONTH REPORT
 THREE-MONTH REPORT 2010 H & M HENNES & MAURITZ AB THREE-MONTH REPORT 1 December 2009 28 February 2010 THE FIRST QUARTER The H&M Group s sales excluding VAT amounted to SEK 24,846 m (23,299), an increase
Ramirent a progressive rental solutions group
 Ramirent a progressive rental solutions group SEB Enskilda Nordic Seminar, 9 January 2013, Copenhagen Magnus Rosén, President and CEO, Ramirent Plc Helsinki centre, Finland 1 Contents Company in brief