WORKING PAPER MASSACHUSETTS
|
|
|
- Evan Mills
- 5 years ago
- Views:
Transcription


1


2

3


4


5 tnst. AUG J-'BRARIE-S WORKING PAPER ALFRED P. SLOAN SCHOOL OF MANAGEMENT THE MAEKET MODEL APPLIED TO EUROPEAN COMMON STOCKS: SOME EMPIRICAL RESULTS Gerald A. Pogue and Bruno H. Solnik 6tvai MWM ^^^ ^^'^"''^ '~'^^^' ^\v^»< Revised May MASSACHUSETTS INSTITUTE OF TECHNOLOGY 50 MEMORIAL DRIVE CAMBRIDGE, MASSACHUSETTS i


6


7 THE MARKET MODEL APPLIED TO EUROPEAN COMMON STOCKS: SOME EMPIRICAL RESULTS Gerald A. Pogue and Bruno H. Solnik Giy»j^ MWM ^:Je -S^^'"^ Hf^^' -^\v^\< Revised May Not for Quotation Comments Invited
8 no. 45'7-73 RECEIVED MAY M. 1. T. LIBRARIES

![2 There is a lack of corresponding studies for non-american securities, due primarily to the absence of generally available machine readable data bases (see however [13] and [16]).](/docs-images/89/99840531/images/9-2.jpg "The purpose of this paper is to present the results of some initial tests of the market m.odel for a broad cross-section of the European common stocks.")
9 THE MARKET MODEL APPLIED TO EUROPEAN COMMON STOCKS: SOME EMPIRICAL RESULTS Gerald A. Pogue and Bruno H. Solnik I. Introduction The stock price literature abounds with applications of the Markowitz [1 - ] Sharpe [15] market model to American stock price data. 2 There is a lack of corresponding studies for non-american securities, due primarily to the absence of generally available machine readable data bases (see however [13] and [16]). The purpose of this paper is to present the results of some initial tests of the market m.odel for a broad cross-section of the European common stocks. Our data base consists of daily price and divi- 3 dend data for 228 stocks from seven European countries. In addition, for comparison purposes we have included a sample of 65 American securities. Assuming the market model to be the stochastic process generating security returns, regression analysis was used to estimate the model's parameters for various return measurement intervals and test periods. The analysis focuses on the measures of systematic risk (beta), proportion of varia- 2 tion explained by market movements (R ), excess return (alpha) and the statistical significance of the excess return measures (T-alpha). The estimated parameters were tested for robustness to changes in measurement interval and stability over time. Finally, the results were examined for their implications for relative efficiency of the various markets studied. The paper is organized as follows: part II presents a brief review of the market model, part III describes the data base, part IV the methodology, part V the empirical results and part VI the implications for market efficiency. 071S204
10
 jt J J >lt jt' where a. and 6.")

11 - 2 - II. The Market Model The model is based on the hypothesis that the risk premium on security j during interval t, (R. ), is a linear function of the market risk premium, (R ). The risk premiums are formed by subtracting the riskless rate from the respective security and market returns. The relationship is given by R_ = a R,^ +e.^, (1) jt J J >lt jt' where a. and 6. are parameters and e. is the non-market related component 2 3 Jt of security risk premium. The e variables are usually assumed to have the following properties: zero expected values; uncorrelated with the market ^ fi 7 9 return; palrwise and serially uncorrelated; finite variance, O.. Using these assumptions, the beta parameter is given by Cov(R R ) The usual interpretation of 3. is as a measure of the systematic risk of security j relative to that of the market index; that is, the numerator of the right hand side of equation 2 represents the systematic or non-diversifiable security risk, the denominator the systematic risk of the market index. To gain insight into the nature of the a. parameter, we rely on the equilibrium predictions of the Sharpe [14] - Lintner [9] Capital Asset Pricing Model (CAPM). The CAPM relates the expected security risk premiums to their systematic risk coefficients, 3.. That is.
12


13 - 3 - E(R^^) = B. E(l^^) (3) wh ere E(R. ) and E(S,^ ) are the expected security and market risk premiums. Comparing equations (1) and (3), a. is seen to be a measure of the return on security j in excess of that predicted by the CAPM. Under CAPM assumptions the expected value of a. is equal to zero. Thus, realized values, while not necessarily zero should tend to be small and serially uncorrelated through time. III. The Data Base The data base consists of daily prices and dividend data for 228 common stocks of seven European countries. The time period covered is from March 1966 to April In addition, a sample of 65 American stocks was used for comparison purposes. The American data covered the same period and was taken from the Standard and Poor's I.S.L. tape of New York Exchange securities. The distribution of the sample by country is shown in table 1. Within each European country, the companies in our sample tend to be the largest in terms of market value of shares outstanding. The 30 Italian stocks, for example, comprise about three-fourths of the market value of all listed Italian shares. For the United Kingdom, France and Germany, the number is not as high but still in excess of 50 percent in each case. Fifty of the 65 American stocks were randomly selected from the population of all NYSE stocks in existence as of March The remainder of the sample was composed of 15 corporations among those with the largest total equity market value listed on the NYSE. Security risk premiums were computed on a daily, weekly, bi-weekly and monthly basis, as follows:
14
 The stock price and dividend data were corrected for all capital adjustments (splits, rights, etc.")

15 - 4 - P + d - P, where R = the risk premium during interval t R = risk free rate during interval t P = the stock price at the end of period t P = the stock price at the end of the previous period d = dividends paid during the interval (assuming payments on ex-dividend dates) The stock price and dividend data were corrected for all capital adjustments (splits, rights, etc.)- This feature can be very important since firms pay out most of their earnings this way in some countries. Dividend data were not readily available for two of the countries, the Netherlands, and Switzerland; thus risk premiums are measured in these cases by proportionate change in stock price. For each country, the risk premiums on a market index were computed on a comparable basis. For the six countries (including the USA) for which stock dividend data were available, the risk premiums on the index include dividends. For the reamining two where security dividend data was not available, dividends were not included in the index. The names of the market indexes used are given in Exhibit 1. It was not practical to attempt to collect short-term rates for each return interval for each country. As an approximation we used the same shortterm rate for each return interval (adjusted to duration of interval). It is not felt that this approximation will introduce any significant distortions in the results. For all of the European countries, with the exception of
16


17 - 5 - the United Kingdom, we used the short-term prime bank rate. The names of the risk-free rates used are given in Exhibit 1. IV. Methodological Issues The purpose of our empirical tests is to measure the relative magnitude and stability of various market model parameters during the five years covered by our data base. A principal question involves the choice of an interval for measurement of security and market returns. Since daily data is available, it would perhaps seem logical to use daily returns, as opposed to, say, weekly or monthly values. However, this question is complicated by difficulties resulting from measurement errors and adjustment lags in the rates of return. We will briefly discuss each of these issues in turn, (i) Estimator Efficiency As shown in Appendix A, any grouping of the daily data into longer intervals will result in an increase in the standard errors associated with the estimated market model parameters. Thus, if no other considerations were present, the daily returns would provide the most efficient estimates of the coefficients, (ii) Measurement Errors Errors in reporting security prices will produce noise in the security return measures. This will result in a higher variance of the residual term in equation (1) than when correct returns are available. The effect 2 will be a reduction in the R between the security and market returns. However, there will be no expected attenuation in the estimated beta coefficient as long as the measurement errors and not correlated with the market returns
18
 0) B H > o o cn en >-4 e yi 3 cn CO 0) >-l")
 C r in o o CM I > u 4-) c o u 0) u c CO )-i x)")
19 cu 4-1 (1) CO CO CO w CO c CO tn o 4.1 o c C CO X) 0) B H > o o cn en >-4 e yi 3 cn CO 0) >-l B u cn -H pa 4-1 o C/2 CO O CO 0) M ^3 (U M CO H cn o o O CO CD 4) C r in o o CM I > u 4-) c o u 0) u c CO )-i x) t-l 4-1 CO -H 4-1 M C 3
20


21 (a plausible assumption) Other than simple reporting errors or lags, a common source of error results from the rounding of prices to fractional values (e.g. quarters). Th:Ls small source of error can be important for short return intervals. It should also he recognized that the European Markets do not have the same information gathering and dissemination facilities as the major United States markets. Thus, short term price changes are much more likely to be in error than their American counterparts. The effect of measurement errors will diminish as the length of the return interval increases. Thus, measurement errors alone would suggest the use of an interval of maximum length, J (iii) Adjustment Lags Adjustment lags result from the failure of stock prices to fully adjust to market changes during the trading day. Instead the adjustment may be spread over two or more days. This can be caused either by the lack of trading in the stock, or failure to comprehend market conditions when delays in index reporting exist. The result is that the price will "catch up" for previous market activity during later days. This phenomenon would imply a distributed lag model for explaining security returns; for example, \ = ^ ^ ^^It -^ ^A,t-1 " ^2^1, t-2 + ^t (5) where R^,R,^^... are the market returns on the current and previous days When daily returns are used to estimate the market model parameters
22


23 - 8 - (equation 1) the price lag effect will result in a reduction of the percentage of security return variation explained by the market and the estimated beta g will be a downward biased estimate of the true beta, p. This problem would also tend to disappear as the measurement interval increased. The adjustment lags will be more important in the European markets, where trading volume is typically much lower than for U.S. stocks, and where reliable market information is more difficult to obtain. An additional problem results from errors in the market index itself. In a number of European markets the market index is not computed on daily closing prices, but on prices at some convenient time during the day. The result is that the stock returns might well lead rather than lag the index. This would imply that we should add a term 3_iR,i to equation (5) 2 to reflect this effect. Any index lag would also result in a lower R and attenuation of 3 as in the stock price lag case. The importance of this effect will diminish as the interval is increased. In summary, the above discussion indicates that optimal Interval length for measuring returns is by no means obvious. Consequently, we have presented summary results in part V for each of four intervals; daily, weekly, bi-weekly and monthly. The results for the different intervals are compared in part VI for their market efficiency implications. * * * A second major emphasis of the paper is to examine the stability of model parameters over time. This was accomplished by subdividing the five years and measuring model parameters for each sub-period. The first period extends from March 1966 to November 1968, the second from December 1968 to
24


25 - 9 - April To test for stability of the parameters, parameter estimates for the second period were regressed on values for the first period. The regression equation is given by: where p^. and p are the subperiod parameter estimates for security j, Y and Yi ^^e regression coefficients and M the number of securities. The parameters chosen for testing were alpha, the t statistic for alpha, beta and the coefficient of determination. Beta was chosen since it represents the systematic risk. Alpha and t-alpha were chosen to examine the 2 predictability and significance of the excess returns earned and R measures the percentage of security variation explained by market movements. Using cross-sectional correlation coefficients to measure parameter stability is complicated by measurement errors; the estimates p^. and p. are not the true parameter values, p and p«., but are only estimated values. As shown in appendix B, these errors will cause the estimated cross-section correlation coefficient p and regression coefficient Y-i to be attenuated. The degree to which the estimates p and f^ understate the true values p and Y-i depends on the size of the measure error variation relative to the dispersion of the true parameters P^ and P_. This attenuation bias must be kept in mind when evaluating the empirical results in part V. For example, it would not be unexpected to find higher cross-sectional correlations for parameters based on daily returns since their measurement errors (as given by the standard errors of the estimates) would be the smallest.
26


27 V. Empirical Results The empirical results are summarized in tables 1 through 6. In some cases parameter estimates are given for each of the four measurement intervals; however, for brevity, when all observation frequencies lead to similar conclusions, only the bi-weekly results are given. The robustness tests, which examine the sensitivity of parameter estimates to changes in the return measurement interval, are based on the total five-year period; the stability tests are based on the two 2 1/2 year subperiods. A. Robustness of Market Model Parameters Table 1 gives the average security return and standard deviation for each country sample. Corresponding data are given for the market indexes Q used. The security averages are unweighted, and thus can differ substantially from those of the market weighted indexes. The average returns vary from percent for the U.S. to percent per two-week period for Germany. It is interesting to note that the U.S. stocks had the highest average standard deviations. However, this may reflect the broader composition of the U.S. sample rather than inter-market differences. 2 Table 2 presents average estimated beta, t-beta and R for each country sample. The results are presented for each of the four observation frequencies. The most striking observation is the extent to which the average parameter values depend on return interval. The estimated betas are lowest for daily returns, highest for monthly returns. As discussed in part IV, this effect most likely results from lags in the adjustment of stock prices to changes in market levels. As such, the effect would be expected to diminish for longer return intervals.
28


29 In an efficient market, where such lags were absent, the expected value of beta should be invariant to the return measurement interval. Thus, differences in average betas between daily and monthly returns can be used to measure the relative importance of adjustment lags in the various markets. The slower the price adjustment speed, the greater the range between beta values based on daily and monthly returns. The following gives the ratios of average betas based on these return intervals. Exhibit 2 Effect of Lags in Stock Price Adjustment Country
30


31 The average t values are typically reduced by half between daily and monthly observations. 2 Finally, the average R figures show the percentage of variation in stock, returns explained by market movements in the various countries. The numbers display the same general pattern as the beta estimates, rising from a low for daily to a high for monthly return observations. However, as shown 2 below the spreads between daily and monthly R are larger than for beta. Exhibit 3 Effect of Lags and Measurement Errors 2 R monthly y = ^ z^ Country R daily United States
32


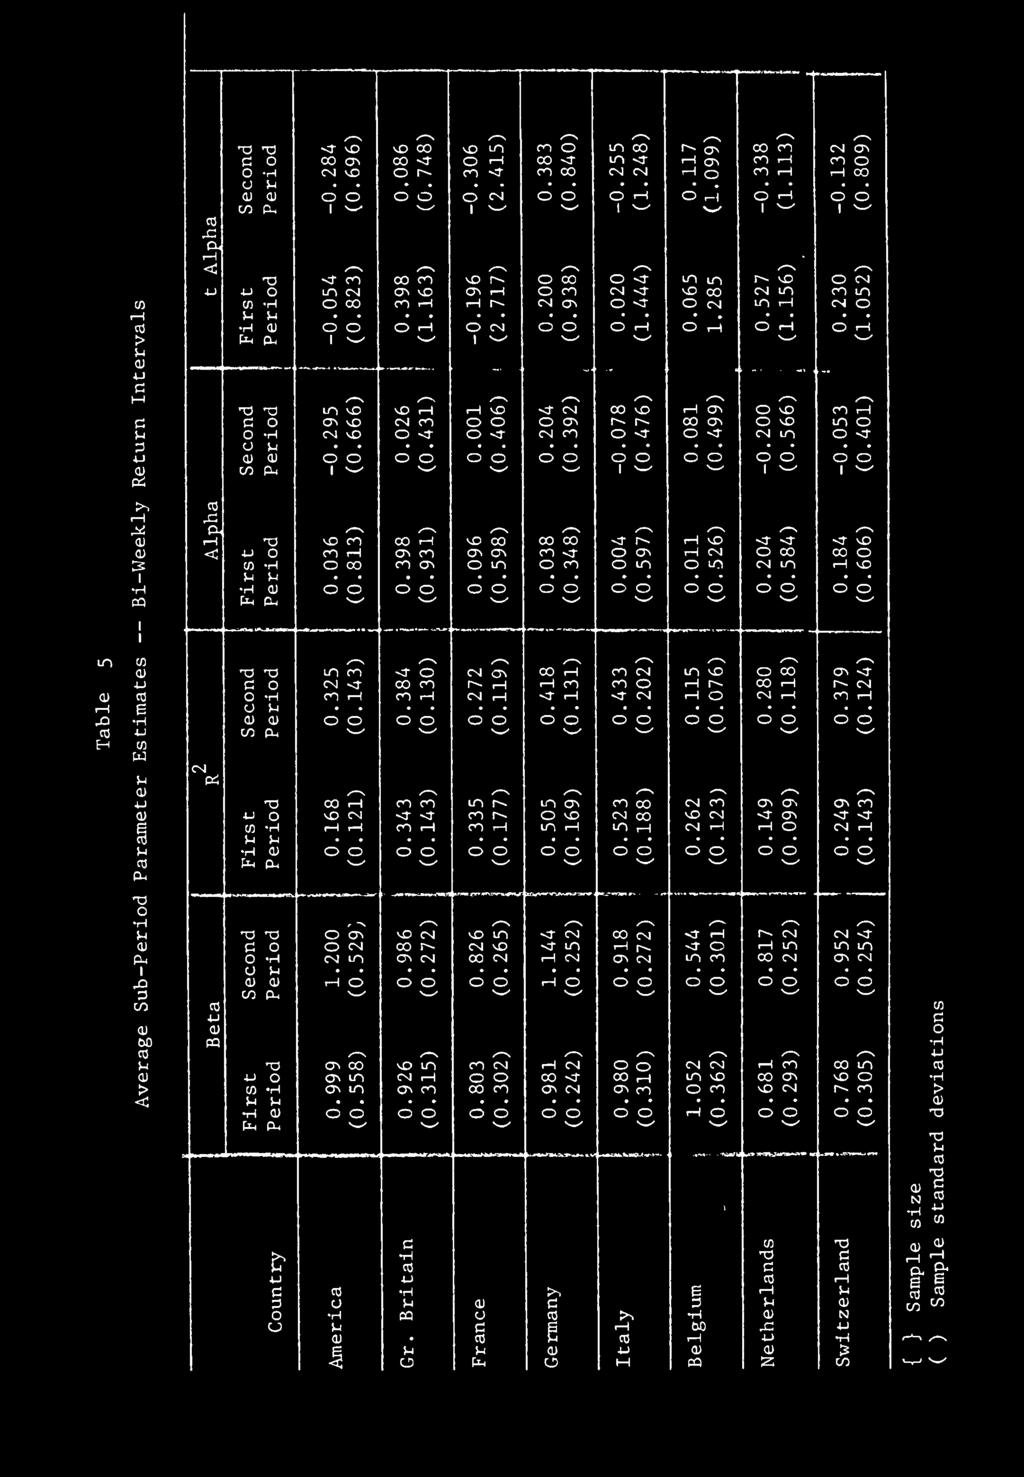
33 The average R for the Small Three (Belgium, the Netherlands and Switzerland), while typically smaller for daily returns, have values similar to the other European countries for monthly returns. Table 3 presents data on the bi-weekly excess returns achieved in each country; that is average alpha values. Under the CAPM assumptions, the expected average alpha value is zero for each market. The table shows the mean alphas and t-alphas for each country. The t statistics to a first approximation allow us to identify significant individual alpha values. The table gives the frequency distribution for t for each country. The range of t values is larger for all but one of the European countries than for the U.S. For the U.S., 6.1 percent of the t values exceed 1.5 in absolute value; for Europe the percentage are typically higher, ranging from a low of 5.9 (Switzerland) to a high of 46.6 percent (Italy). 2 To summarize, the estimated beta and R parameters are sensitive to the return interval used. The effect on beta is smallest in the 2 U.S; the effect on R is similar in the U.S. and the four larger European countries, and larger in the smaller three. B. Parameter Stability In this section we will focus on cross-sectional analysis of market model parameters estimated in two sub-periods March 1966 to November 1968 and December 1968 to March Our purpose is to compare parameter stability across the eight markets, and thus gain insight into the degree of predictability of key parameters. The cross-sectional regressions were run for parameters obtained for each of the four return intervals. Table 4 presents average bi-weekly rates of return for each subperiod. The data illustrate the low degree of intermarket correlation re-
34

 and declined for four. Similarly, the alpha and t alpha statistics do not appear to change in any systematic way.")

35 ported by several previous authors. Additionally, for each country the subperiod returns show little correlation as well, while average standard deviations are much more predictable. Table 5 presents average subperiod parameter estimates for beta, 2 R, a and t. The statistics are based on bi-weekly data. The beta results a show that for seven of the eight countries the average value was larger in 2 the second period. The R results do not present such a consistent pattern. 2 The average R increased for four countries (including the U.S.) and declined for four. Similarly, the alpha and t alpha statistics do not appear to change in any systematic way. The sample standard deviations associated with the averages in the table show the range of estimates differs considerably among markets. Table 6 presents the results of interperiod cross-sectional regressions. The coefficient of cross-sectional determination measures the magnitude of parameter correlation (i.e. the portion of variation in P. explained by P,.). The significance of the relationship is indicated by the t statistic associated with the "slope" parameter (t ^). The regression results are presented for all four sets of subperiod parameters. Cross-sectional comparisons are complicated by two factors, differing sample sizes and dispersion of sub-period parameters. For example, the subperiod German betas are relatively tightly grouped, and thus (as predicted in part IV) the inter-period correlations will be more sensitive to parameter measurement error. 2 The intra-country results for standard deviation, beta and R show
36


37 a consistent pattern for most countries; correlation decreases as the return observation frequency decreases. Daily estimates have the highest degree of predictability, but as discussed above the estimates are biased. As predicted the correlations are most quickly attenuated as the return interval increases for those countries with low parameter dispersions. In the case 2 of Germany, for example, the cross sectional R for beta decreases from for daily observations to 0.00 for bi-weekly intervals. When inter-country comparisons are made, the three parameters are seen to be more stable in several of the European countries (e.g. Great Gritain, France, Italy) than in the U.S. market. This result is most evident for daily observations, less so for monthly data. The results for the small Three show a lower correlation of daily parameters than the Big Five; however, the results are not significantly different for monthly sub-parameters. 2 Interestingly, the cross-sectional correlation of B and R actually increase with interval size for one of the smaller countries (The Netherlands) 13 As for the alpha excess return measures, little evidence for their predictability can be found. Exceptions perhaps are Great Britain and Italy. For Great Britain the correlation between sub-period alpha values is significant at the five percent level for all intervals. For Italy the relationship between the subperiod t values is significant at the five percent level VI. Implications for Market Efficiency Our final task is to review our results for their implications regarding relative market efficiency. While our tests are not extensive enough to permit definitive conclusions, they permit a number of interesting observations.
38


39 The first evidence comes from the sensitivity of the average beta values to the length of the return interval. In an efficient market, beta would not be sensitive to the interval size. This, however, was not the case. As reported in part V, average monthly betas exceeded average daily betas in all eight countries, the ratios ranging from 1.08 for the U.S. to 3.20 for Belgium. Thus, price adjustment lags appear least significant in the U.S. market. On the whole, the four major European countries had lower ratios than the three smaller countries, indicating a somewhat shorter adjustment period for the larger markets. The next issue involves the extent to which measures of total and systematic risk are predictable. If securities are to be properly priced, investors must be able to predict their future riskiness. Our subperiod correlation analysis sheds some light on this question. Both standard deviations and beta values were found to be as predictable in the European markets as in the U.S. Under the CAPM assumptions applied to each market, the average alpha values for each country should average to zero and be uncorrelated across time. The results in table 6 support this hypothesis in most of the countries, with the possible exception of Great Britain where there is some evidence of significant inter-period correlation. Similarly, the t statistics for alpha should be uncorrelated between subperiods. This hypothesis is again generally true, with the exception of Great Britain and Italy. In these countries it would have been possible to earn subperiod returns relative to the CAPM standard by selection stocks with significant first period t- alpha values.
40


41 The distribution of t statistics show the European sample to have a larger proportions of outlier values. This result is particularly striking for Italy where nearly 1/2 the t values exceeded 1.5 in absolute value. However, given our lack of knowledge concerning the degree of statistical dependence between intra country t values, it is difficult to draw very strong conclusions from these results. On the whole our evidence does not show substantial differences between the U.S. and four major European markets. Some cases can be made for the three smaller markets being less efficient. Our conclusions regarding efficiency must be viewed as tentative in nature. We have dealt with only a five-year period, using pre-selected security samples. More definitive conclusions must await more extensive and statistically powerful tests.
42
 within y y Tt MTt Tt interval T (t=1,..., H).")
 can be restated for the N day returns R_ T a + 3Rj^^ + e^ t=1,..., H (A 2) wh ere R^, R^^^ and e^ are averages of R^^, R^^^ and G^^ (t=l,..., N) respec- * n* tively.")
43 . Appendix A: Effect of Grouping Procedure on Estimator Efficiency Consider the loss of efficiency associated with grouping k daily returns into H N-day intervals (k = NH) The market model for the k daily returns is given by where R. R, and are the return on day t (t=l,. J ^ >.., N) within y y Tt MTt Tt interval T (t=1,..., H). Now group the security and market returns into the N day values by averaging the N daily returns in each of the H intervals. Equation (A 1) can be restated for the N day returns R_ T a + 3Rj^^ + e^ t=1,..., H (A 2) wh ere R^, R^^^ and e^ are averages of R^^, R^^^ and G^^ (t=l,..., N) respec- * n* tively. Let a and B be the regression estimates based on daily returns /\ /\ and a, B the estimates based on N day return. If the least squared assumptions hold for equation (A 1), they also hold for equation (A 2). Thus a* and B* are unbiased estimators, as are a and B. The variances of a and 14 a are given by Var(e ) Var(a*) = -.^ ^ _ Z Z (R - R )^ T=l t=l ^^ ^ (A 3) Var(a) = 1 (A 4) - 2 Z (R - R ) T=l ^ ^
44
 Var(a) - '-^ \" - 2 N. Z (R - R ) T=l (A 5) Comparison of the two variance is equivalent to comparison of denominators.")
 is always greater than that of Var(a). 2 ^ 2 The ratio of Z Z (R^ - R ) to N Z (R.^ - R ) is a measure of the loss of T t T precision resulting from the grouping.")
45 2 Appendix A. wh ere R is the average of the H R^ values (note that R is also equal to the average of the K R returns). The variance of e is equal to the variance of e divided by^ N. Therefore, Tt Var(e ) Var(a) - '-^ " - 2 N. Z (R - R ) T=l (A 5) Comparison of the two variance is equivalent to comparison of denominators. Expanding the denominator of Var(a ), H N _ _ I Z(R -R)=ZZ(R -R+R-R) ^ Tt T'^ Tt T T T T=l t=l T t = Z S (R ^ - R )^ + N Z (R - R )^ (A 6) Tt T T T T t T Thus, the denominator of Var(a ) is always greater than that of Var(a). 2 ^ 2 The ratio of Z Z (R^ - R ) to N Z (R.^ - R ) is a measure of the loss of T t T precision resulting from the grouping. The results apply equally to the * ^ variances of 3 and 6.
46
 Tlie measurement errors u. and v. are assumed to be distributed independently from each other and from the true parameter values.")
 (designated p ) will approach a limiting value, given by Plim P», = ( a cr I (B 2) 2 2 where p is the true correlation coefficient, a and o are the variance of u V 12 2 2 u and V, and a and a")
47 Appendix B. Attenuation of Cross-Sectional Correlation Coefficients Assume the M estimated parameter values P,. and P.. are related to the true values P,. and P. as follows Ij 2j P^. = P^. + u. j=l..... M?,. - P^. + V. (B 1) Tlie measurement errors u. and v. are assumed to be distributed independently from each other and from the true parameter values. The measured correlation coefficient between P.. and P.. (i=l, 15..., M) (designated p ) will approach a limiting value, given by Plim P», = ( a cr I (B 2) 2 2 where p is the true correlation coefficient, a and o are the variance of u V u and V, and a and a are the cross-sectional variances of P^ and P, " ^ Thus, p is not an unbiased estimate of p, but will understate the true correlation between the parameters by an amount depending on the size of the measurement error variation relative to the dispersion of the true parameters. Similarly, the estimated regression coefficient y^ In equation (6) will be downward biased. The estimated values of Yt will tend to a limit which is less than the true value. The limit is given by plim (Yj^) = i (B 4) a a Pi
48

49 Appendix B.2 Thus, if the variance of the error term for P is 10 percent of the variance of the true values (as estimated by a ), then least squares would 1 underestimate Y-, by about 10 percent, even for very large sample sizes.
50


51 FOOTNOTES 1. Respectively, Associate Professor of Finance, Sloan School of Management, M.I.T. and Assistant Professor of Finance, Graduate School of Business, Stanford University. 2. See, for example, Blume [1,2], Cohen and Pogue [3], Fama [4], King [7]. 3. We wish to express our appreciation to the Research Department of Eurofinance, Paris, for providing the data on which the study is based. 4. The parameter values a. and B. do not have time subscripts since they are assumed to remain stationary through time. Of course, one of our main concerns in this paper is to test the validity of this assumption. 5. This assumption can only be precisely true in the limit as the proportion of security j in the market portfolio approaches zero. 6. This assumption rules out industry effects. However, these effects (see King [7]) typically account for only about ten percent of variation in security returns, so that to a first approximation they can be be ignored. This assumption has no effect on the estimation of the a. and 3. parameters, but makes cross-sectional comparisons more difficult. 7. This assumption presupposes the existence of variances for the e variables. The work of Mandelbrot [11] and Fama [4] suggests, however, that time series values of e. ^ conform more closely to a non-normal stable paretian distribution for which the variance does not exist than to the usually assumed normal distirubtion. Nonetheless, in this paper we will make the more common assumption of the existence of these statistics since Fama [5] has shown that insights into the effects of diversification
52


53 Footnotes 2 on dispersion of returns that are derived from the mean-standard deviation model remain valid when the model is generalized to include the entire stable family. 8. The market returns shown in the table are averages, computed in the same way as the stock return averages. The figures equal the calendar returns only for those countries for which the all-stock return series were complete over the March 1966-March 1971 period. This includes the U.S. and the major European countries. For countries where some of the series began after March 1966, the market return reflects the average market return faced by the sample of stocks; that is - _ 1 \ M.^, ^j J=l "" - where M = number stocks in sample R^. = average market return during period of complete data for ^ stock j. 9. The measurement error tends to be submerged with longer return intervals. For example, using monthly returns, only two of the approximately 22 daily returns in the monthly figure would be affected by measurement error. For daily observations, on the other hand, both the beginning and ending prices of the interval would be subject to error. 10. A previous study by King [7] examined the relationship between market and security returns for NYSE stocks. Sixty-three common stocks were analyzed, with returns computed on a monthly basis from June to December The average R value decreased monitorically, from for the period to for the interval. More recently Blume [1] replicated these tests using a larger sample of stocks and found results consistent with those of King. The mean proportion of return variation explained by the market was for the period
54
 ^ pi Yi = P ^^ ' where / is given in table 6,0 and a in table 5.")
![Therefore, pi p2 ^0 = ^2 - ^1^1 where the average subperiod estimates, (P and P«)» are given in table 5. 12. The stability of common stock beta parameters has been studied by Blume [1] and Levy [8].](/docs-images/89/99840531/images/55-2.jpg "Using monthly returns and seven year estimation periods, Blume found an average product moment correlation between 2 stock betas of 0.618 (R = 0.37).")
55 Footnotes For reasons of brevity we have not presented the details of the cross-sectional regression results. However, for bi-weekly intervals the estimated y^ and y coefficients can be computed by combining results from tables 5 and 6. ^ 2 (P) ^ pi Yi = P ^^ ' where / is given in table 6,0 and a in table 5. Therefore, pi p2 ^0 = ^2 - ^1^1 where the average subperiod estimates, (P and P«)» are given in table The stability of common stock beta parameters has been studied by Blume [1] and Levy [8]. Using monthly returns and seven year estimation periods, Blume found an average product moment correlation between 2 stock betas of (R = 0.37). More recently Robert Levy replicated these tests using weekly returns and various short estimation periods (e.g. 26, 52 weeks). For the period from 1962 through 1970 the average 2 correlation between annual beta values was (R = 0.25). 13. An additional factor which complicates comparisons between U.S. and European results is the potential lack of compatibility between data samples. The U.S. sample, due to its random content, is more representative of the complete cross-section of NYSE stocks. The European samples were pre-selected, and mainly represent the major stocks in their respective markets. Further, the U.S. daily price tapes used for the study may well have a higher error rate than the carefully screemed European data file. la. See Malinvaud [10], pp
56
57 Footnotes the plim(p ) expression is derived in an analogous manner to that for plim(y ) See equation BA and footnote 16, 16. See Johnston [6], equation (9-43), page 282.
58


59
60
 <u c u p u")
 4J 01")
 o H")
61 t^ (0 > u c s i) u3 CO n) <u c u p u (fl 3 O H Vj 03 > 1-1 O H U 0) 4J 01 e to M tfl B to w TD O H >-i 0) o H (U to > <:

62


 00 n) U > 1 CO x: <-\ I 4J <")
63 I I I I I I J in O in 0^ e^ Al A tfl > u Qi C C M 3 4J (U PS A! (U 0) & I rh CQ o in C.-I lo o o o o I o in rh O O Csl O U-i n) in o i 00 in CN,-1 -a c I V o PL4 o H 0) 00 n) U > 1 CO x: <-\ I 4J < tfl x; 1^ 00 ro O O 1-1 in o o
64


65
66


67 > u 0) c c u 3 Pi 3 PQ u-1
68


69
70


 0) PQ C o H 4-1 to")
71 0) r-l u 0) 4-) a u C 0) «}^3 4-1 Pi CO 3 O H 1-1 CO > o c + 1 ).H CL rh + o O Q- CO 0) c o cd S CO w cd Ph 3 D' w c o H CO Cd a u oc a a o H )-l <U Pj X> 3 c/l C 0) 0) PQ C o H 4-1 to r-l o u
72


73 REFERENCES Blume, M., "On the Assessment of Risk," Journal of Finance, March 1971, pp , "Portfolio Theory: A Step Toward Its Practical Application," Journal of Business, April 1970, pp , Cohen, K., and G. Pogue, "An Empirical Evaluation of Alternative Portfolio-Selection Models," Journal of Business, April 1967, pp Fama, E., "The Behavior of Stock Market Prices," Journal of Business, January 1965, pp , "Risk Return and Equilibrium," Journal of Political Economy, January-February 1971, pp Johnston, J., Econometric Methods, Second Edition, McGraw-Hill, New York, 1972^ King, B. F., "Market and Industry Factors in Stock Price Behavior," Journal of Business, January 1966, pp Levy, R. A., "Stationarity of Beta Coefficients," Financial Analysts Journal, November-December 1971, pp Lintner, "Security Prices, Risk and Maximal Gains from Diversification," Journal of Finance, December 1965, pp Malinvaud, E., Statistical Methods of Econometrics, Second edition North-Holland Publishers, Mandelbrot, B., "The Variation of Certain Speculative Prices," Journal of Business, October 1963, pp Markowitz, H., Portfolio Selection, Efficient Diversification of Investments, Wiley, New York, 1959 Modigliani, F., G. A. Pogue, M. Scholes and B. Solnik, "Efficiency of European Capital Markets and a Comparison with the American Market," Presented at First World Congress on the Stock Exchange, Milan, Italy, March Published in Conference Proceedings. Sharpe, W. F., "A Simplified Model for Portfolio Analysis," Management Science, January 1962, pp
74
![References 2 [15] Sharpe, W. F.](/docs-images/89/99840531/images/75-0.jpg ", \"Capital Asset Prices: A Theory of Market Equilibrium under Conditions of")
![Risk," Journal of Finance, September 196A, pp. 425-442. [16] Solnik, B. H.](/docs-images/89/99840531/images/75-1.jpg ", \"European Capital Markets: Towards a Theory of an International Capital")
75 References 2 [15] Sharpe, W. F., "Capital Asset Prices: A Theory of Market Equilibrium under Conditions of Risk," Journal of Finance, September 196A, pp [16] Solnik, B. H., "European Capital Markets: Towards a Theory of an International Capital Market," unpublished Ph.D. Thesis, M.I.T. June 1972.

76 JAN <L?* 7!+b \ uio^

77 ^


78


79


80 . K..or-^A #

81


82 Date Due -'9-'fo Mfly 1 S EASEMENT f99t OCT FEB 2 6 Z002 Lib-26-67


83 3 TDflD MIT LIBRARIES D3 7Tt. MT4 (ysd-n z MIT LIBRARIES 3 TDfiD D 3 7' SID t* ^51'^ 5- Win LIBRARIES JWPL, 3 TDflD DD3 fl57 4T7» I L =' J MH LIBRARIES 3 TDflD DD3 fle7 513 GT7'73 MIT LiBRAfllES 3 TDflD DD3 7Tb 551 ; cst-'i MIT LiBRAfilES ^H-l3 3 TDfiD D Mini D3 7=i 5Efl T-J5 143 w no Kolb, David Al/On management and the I B37252 D»BKS QQQ27754 ts'l ii!iiiiiiiliiiiiiiiiiiimiiiiiii 3 TDflD DOQ?M? b72


84
The intervalling effect bias in beta: A note
 Published in : Journal of banking and finance99, vol. 6, iss., pp. 6-73 Status : Postprint Author s version The intervalling effect bias in beta: A note Corhay Albert University of Liège, Belgium and University
Comparison of OLS and LAD regression techniques for estimating beta
 Comparison of OLS and LAD regression techniques for estimating beta 26 June 2013 Contents 1. Preparation of this report... 1 2. Executive summary... 2 3. Issue and evaluation approach... 4 4. Data... 6
RISK AMD THE RATE OF RETUR1^I ON FINANCIAL ASSETS: SOME OLD VJINE IN NEW BOTTLES. Robert A. Haugen and A. James lleins*
 JOURNAL OF FINANCIAL AND QUANTITATIVE ANALYSIS DECEMBER 1975 RISK AMD THE RATE OF RETUR1^I ON FINANCIAL ASSETS: SOME OLD VJINE IN NEW BOTTLES Robert A. Haugen and A. James lleins* Strides have been made
Accounting Beta: Which Measure Is the Best? Findings from Italian Market
 European Journal of Economics, Finance and Administrative Sciences ISSN 1450-2275 Issue 96 December, 2017 FRDN Incorporated http://www.europeanjournalofeconomicsfinanceandadministrativesciences.com Accounting
UNIVERSITY OF. ILLINOIS LIBRARY At UrbanA-champaign BOOKSTACKS
 UNIVERSITY OF ILLINOIS LIBRARY At UrbanA-champaign BOOKSTACKS Digitized by the Internet Archive in 2011 with funding from University of Illinois Urbana-Champaign http://www.archive.org/details/littlebitofevide1151scot
Tamir Agmon and Donald Lessard
 INTERNATIONAL DIVERSIFICATION AND THE MULTINAT'I ONAL CORPORATION: AN INVESTIGATION OF PRICE BEHAVIOR OF THE SHARES OF U.S. BASED MULTINATIONAL CORPORATIONS ON THE N.Y. S.E. Tamir Agmon and Donald Lessard
Assessing the reliability of regression-based estimates of risk
 Assessing the reliability of regression-based estimates of risk 17 June 2013 Stephen Gray and Jason Hall, SFG Consulting Contents 1. PREPARATION OF THIS REPORT... 1 2. EXECUTIVE SUMMARY... 2 3. INTRODUCTION...
Estimating Betas in Thinner Markets: The Case of the Athens Stock Exchange
 Estimating Betas in Thinner Markets: The Case of the Athens Stock Exchange Thanasis Lampousis Department of Financial Management and Banking University of Piraeus, Greece E-mail: thanosbush@gmail.com Abstract
OPTIMAL RISKY PORTFOLIOS- ASSET ALLOCATIONS. BKM Ch 7
 OPTIMAL RISKY PORTFOLIOS- ASSET ALLOCATIONS BKM Ch 7 ASSET ALLOCATION Idea from bank account to diversified portfolio Discussion principles are the same for any number of stocks A. bonds and stocks B.
The mathematical model of portfolio optimal size (Tehran exchange market)
") WALIA journal 3(S2): 58-62, 205 Available online at www.waliaj.com ISSN 026-386 205 WALIA The mathematical model of portfolio optimal size (Tehran exchange market) Farhad Savabi * Assistant Professor of
WALIA journal 3(S2): 58-62, 205 Available online at www.waliaj.com ISSN 026-386 205 WALIA The mathematical model of portfolio optimal size (Tehran exchange market) Farhad Savabi * Assistant Professor of
Return dynamics of index-linked bond portfolios
 Return dynamics of index-linked bond portfolios Matti Koivu Teemu Pennanen June 19, 2013 Abstract Bond returns are known to exhibit mean reversion, autocorrelation and other dynamic properties that differentiate
Sensex Realized Volatility Index (REALVOL)
") Sensex Realized Volatility Index (REALVOL) Introduction Volatility modelling has traditionally relied on complex econometric procedures in order to accommodate the inherent latent character of volatility.
Sensex Realized Volatility Index (REALVOL) Introduction Volatility modelling has traditionally relied on complex econometric procedures in order to accommodate the inherent latent character of volatility.
Note on Cost of Capital
 DUKE UNIVERSITY, FUQUA SCHOOL OF BUSINESS ACCOUNTG 512F: FUNDAMENTALS OF FINANCIAL ANALYSIS Note on Cost of Capital For the course, you should concentrate on the CAPM and the weighted average cost of capital.
Debt/Equity Ratio and Asset Pricing Analysis
 Utah State University DigitalCommons@USU All Graduate Plan B and other Reports Graduate Studies Summer 8-1-2017 Debt/Equity Ratio and Asset Pricing Analysis Nicholas Lyle Follow this and additional works
CAPITAL ASSET PRICING WITH PRICE LEVEL CHANGES. Robert L. Hagerman and E, Han Kim*
 JOURNAL OF FINANCIAL AND QUANTITATIVE ANALYSIS September 1976 CAPITAL ASSET PRICING WITH PRICE LEVEL CHANGES Robert L. Hagerman and E, Han Kim* I. Introduction Economists anti men of affairs have been
ECON FINANCIAL ECONOMICS
 ECON 337901 FINANCIAL ECONOMICS Peter Ireland Boston College Fall 2017 These lecture notes by Peter Ireland are licensed under a Creative Commons Attribution-NonCommerical-ShareAlike 4.0 International
ECON FINANCIAL ECONOMICS
 ECON 337901 FINANCIAL ECONOMICS Peter Ireland Boston College Spring 2018 These lecture notes by Peter Ireland are licensed under a Creative Commons Attribution-NonCommerical-ShareAlike 4.0 International
The Fixed Income Valuation Course. Sanjay K. Nawalkha Gloria M. Soto Natalia A. Beliaeva
 Interest Rate Risk Modeling The Fixed Income Valuation Course Sanjay K. Nawalkha Gloria M. Soto Natalia A. Beliaeva Interest t Rate Risk Modeling : The Fixed Income Valuation Course. Sanjay K. Nawalkha,
Returns to E/P Strategies, Higgledy-Piggledy Growth, Analysts Forecast Errors, and Omitted Risk Factors
 Returns to E/P Strategies, Higgledy-Piggledy Growth, Analysts Forecast Errors, and Omitted Risk Factors The E/P effect remains an enigma. Russell J. Fuller, Lex C. Huberts, and Michael J. Levinson (Reprinted
European Equity Markets and EMU: Are the differences between countries slowly disappearing? K. Geert Rouwenhorst
 European Equity Markets and EMU: Are the differences between countries slowly disappearing? K. Geert Rouwenhorst Yale School of Management Box 208200 New Haven CT 14620-8200 First Draft, October 1998 This
An analysis of the relative performance of Japanese and foreign money management
 An analysis of the relative performance of Japanese and foreign money management Stephen J. Brown, NYU Stern School of Business William N. Goetzmann, Yale School of Management Takato Hiraki, International
Risk and Return and Portfolio Theory
 Risk and Return and Portfolio Theory Intro: Last week we learned how to calculate cash flows, now we want to learn how to discount these cash flows. This will take the next several weeks. We know discount
Seasonal Analysis of Abnormal Returns after Quarterly Earnings Announcements
 Seasonal Analysis of Abnormal Returns after Quarterly Earnings Announcements Dr. Iqbal Associate Professor and Dean, College of Business Administration The Kingdom University P.O. Box 40434, Manama, Bahrain
FE670 Algorithmic Trading Strategies. Stevens Institute of Technology
 FE670 Algorithmic Trading Strategies Lecture 4. Cross-Sectional Models and Trading Strategies Steve Yang Stevens Institute of Technology 09/26/2013 Outline 1 Cross-Sectional Methods for Evaluation of Factor
DO SHARE PRICES FOLLOW A RANDOM WALK?
 DO SHARE PRICES FOLLOW A RANDOM WALK? MICHAEL SHERLOCK Senior Sophister Ever since it was proposed in the early 1960s, the Efficient Market Hypothesis has come to occupy a sacred position within the belief
The Case for TD Low Volatility Equities
 The Case for TD Low Volatility Equities By: Jean Masson, Ph.D., Managing Director April 05 Most investors like generating returns but dislike taking risks, which leads to a natural assumption that competition
Applied Macro Finance
 Master in Money and Finance Goethe University Frankfurt Week 2: Factor models and the cross-section of stock returns Fall 2012/2013 Please note the disclaimer on the last page Announcements Next week (30
The Capital Asset Pricing Model in the 21st Century. Analytical, Empirical, and Behavioral Perspectives
 The Capital Asset Pricing Model in the 21st Century Analytical, Empirical, and Behavioral Perspectives HAIM LEVY Hebrew University, Jerusalem CAMBRIDGE UNIVERSITY PRESS Contents Preface page xi 1 Introduction
Cross Sections of Expected Return and Book to Market Ratio: An Empirical Study on Colombo Stock Market
 Cross Sections of Expected Return and Book to Market Ratio: An Empirical Study on Colombo Stock Market Mohamed I.M.R., Sulima L.M., and Muhideen B.N. Sri Lanka Institute of Advanced Technological Education
The Vasicek adjustment to beta estimates in the Capital Asset Pricing Model
 The Vasicek adjustment to beta estimates in the Capital Asset Pricing Model 17 June 2013 Contents 1. Preparation of this report... 1 2. Executive summary... 2 3. Issue and evaluation approach... 4 3.1.
STX FACULTY WORKING! PAPER NO An Error-Learning Model of Treasury Bill Future* and Implications for the Expectation Hypothesis. nun.
 330 3385 1020 COPY 2 STX FACULTY WORKING! PAPER NO. 1020 An Error-Learning Model of Treasury Bill Future* and Implications for the Expectation Hypothesis nun PiS fit &* 01*" srissf College of Commerce
Global Dividend-Paying Stocks: A Recent History
 RESEARCH Global Dividend-Paying Stocks: A Recent History March 2013 Stanley Black RESEARCH Senior Associate Stan earned his PhD in economics with concentrations in finance and international economics from
Earnings as an Explanatory Variable for Returns: A Note
 University of Wollongong Research Online Faculty of Business - Accounting & Finance Working Papers Faculty of Business 1992 Earnings as an Explanatory Variable for Returns: A Note A. Frino University of
Fama-French in China: Size and Value Factors in Chinese Stock Returns
 Fama-French in China: Size and Value Factors in Chinese Stock Returns November 26, 2016 Abstract We investigate the size and value factors in the cross-section of returns for the Chinese stock market.
BOOK TO MARKET RATIO AND EXPECTED STOCK RETURN: AN EMPIRICAL STUDY ON THE COLOMBO STOCK MARKET
 BOOK TO MARKET RATIO AND EXPECTED STOCK RETURN: AN EMPIRICAL STUDY ON THE COLOMBO STOCK MARKET Mohamed Ismail Mohamed Riyath Sri Lanka Institute of Advanced Technological Education (SLIATE), Sammanthurai,
UNIVERSITY Of ILLINOIS LIBRARY AT URBANA-CHAMPA1GN STACKS
 UNIVERSITY Of ILLINOIS LIBRARY AT URBANA-CHAMPA1GN STACKS Digitized by the Internet Archive in University of Illinois 2011 with funding from Urbana-Champaign http://www.archive.org/details/analysisofnonsym436kimm
An Examination of the Predictive Abilities of Economic Derivative Markets. Jennifer McCabe
 An Examination of the Predictive Abilities of Economic Derivative Markets Jennifer McCabe The Leonard N. Stern School of Business Glucksman Institute for Research in Securities Markets Faculty Advisor:
Testing Capital Asset Pricing Model on KSE Stocks Salman Ahmed Shaikh
 Abstract Capital Asset Pricing Model (CAPM) is one of the first asset pricing models to be applied in security valuation. It has had its share of criticism, both empirical and theoretical; however, with
High Frequency Autocorrelation in the Returns of the SPY and the QQQ. Scott Davis* January 21, Abstract
 High Frequency Autocorrelation in the Returns of the SPY and the QQQ Scott Davis* January 21, 2004 Abstract In this paper I test the random walk hypothesis for high frequency stock market returns of two
Real Estate Ownership by Non-Real Estate Firms: The Impact on Firm Returns
 Real Estate Ownership by Non-Real Estate Firms: The Impact on Firm Returns Yongheng Deng and Joseph Gyourko 1 Zell/Lurie Real Estate Center at Wharton University of Pennsylvania Prepared for the Corporate
Elisabetta Basilico and Tommi Johnsen. Disentangling the Accruals Mispricing in Europe: Is It an Industry Effect? Working Paper n.
 Elisabetta Basilico and Tommi Johnsen Disentangling the Accruals Mispricing in Europe: Is It an Industry Effect? Working Paper n. 5/2014 April 2014 ISSN: 2239-2734 This Working Paper is published under
A Comparative Study of Various Forecasting Techniques in Predicting. BSE S&P Sensex
 NavaJyoti, International Journal of Multi-Disciplinary Research Volume 1, Issue 1, August 2016 A Comparative Study of Various Forecasting Techniques in Predicting BSE S&P Sensex Dr. Jahnavi M 1 Assistant
CHAPTER III RISK MANAGEMENT
 CHAPTER III RISK MANAGEMENT Concept of Risk Risk is the quantified amount which arises due to the likelihood of the occurrence of a future outcome which one does not expect to happen. If one is participating
International Portfolio Investments
 International Portfolio Investments Chapter Objectives: Chapter Eleven 11 INTERNATIONAL FINANCIAL MANAGEMENT 1. Why investors diversify their portfolios internationally. 2. How much investors can gain
Boston Library Consortium IVIember Libraries
 Digitized by the Internet Archive in 2011 with funding from Boston Library Consortium IVIember Libraries http://www.archive.org/details/speculativedynam00cutl2 working paper department of economics SPECULATIVE
Estimating the Current Value of Time-Varying Beta
 Estimating the Current Value of Time-Varying Beta Joseph Cheng Ithaca College Elia Kacapyr Ithaca College This paper proposes a special type of discounted least squares technique and applies it to the
Final Exam Suggested Solutions
 University of Washington Fall 003 Department of Economics Eric Zivot Economics 483 Final Exam Suggested Solutions This is a closed book and closed note exam. However, you are allowed one page of handwritten
V Time Varying Covariance and Correlation. Covariances and Correlations
 V Time Varying Covariance and Correlation DEFINITION OF CORRELATIONS ARE THEY TIME VARYING? WHY DO WE NEED THEM? ONE FACTOR ARCH MODEL DYNAMIC CONDITIONAL CORRELATIONS ASSET ALLOCATION THE VALUE OF CORRELATION
CHAPTER 8: INDEX MODELS
 Chapter 8 - Index odels CHATER 8: INDEX ODELS ROBLE SETS 1. The advantage of the index model, compared to the arkowitz procedure, is the vastly reduced number of estimates required. In addition, the large
Focusing on hedge fund volatility
 FOR INSTITUTIONAL/WHOLESALE/PROFESSIONAL CLIENTS AND QUALIFIED INVESTORS ONLY NOT FOR RETAIL USE OR DISTRIBUTION Focusing on hedge fund volatility Keeping alpha with the beta November 2016 IN BRIEF Our
Risk and Return. Nicole Höhling, Introduction. Definitions. Types of risk and beta
 Risk and Return Nicole Höhling, 2009-09-07 Introduction Every decision regarding investments is based on the relationship between risk and return. Generally the return on an investment should be as high
The Effect of Kurtosis on the Cross-Section of Stock Returns
 Utah State University DigitalCommons@USU All Graduate Plan B and other Reports Graduate Studies 5-2012 The Effect of Kurtosis on the Cross-Section of Stock Returns Abdullah Al Masud Utah State University
Investment Performance of Common Stock in Relation to their Price-Earnings Ratios: BASU 1977 Extended Analysis
 Utah State University DigitalCommons@USU All Graduate Plan B and other Reports Graduate Studies 5-2015 Investment Performance of Common Stock in Relation to their Price-Earnings Ratios: BASU 1977 Extended
Estimating Betas in Thinner Markets: The Case of the Athens Stock Exchange
 International Research Journal of Finance and Economics ISSN 1450-2887 Issue 13 (2008) EuroJournals Publishing, Inc. 2008 http://www.eurojournals.com/finance.htm Estimating Betas in Thinner Markets: The
University of California Berkeley
 University of California Berkeley A Comment on The Cross-Section of Volatility and Expected Returns : The Statistical Significance of FVIX is Driven by a Single Outlier Robert M. Anderson Stephen W. Bianchi
UNIVERSITY OF. tioo^a
 UNIVERSITY OF tioo^a 1 Digitized by the Internet Archive in 011 with funding from University of Illinois Urbana-Champaign http://www.archive.org/details/randomcoefficien651leec Faculty Working Papers
WORKING PAPER MASSACHUSETTS
 BASEMENT HD28.M414 no. Ibll- Dewey ALFRED P. WORKING PAPER SLOAN SCHOOL OF MANAGEMENT Corporate Investments In Common Stock by Wayne H. Mikkelson University of Oregon Richard S. Ruback Massachusetts
An Analysis of Theories on Stock Returns
 An Analysis of Theories on Stock Returns Ahmet Sekreter 1 1 Faculty of Administrative Sciences and Economics, Ishik University, Erbil, Iraq Correspondence: Ahmet Sekreter, Ishik University, Erbil, Iraq.
Common Macro Factors and Their Effects on U.S Stock Returns
 2011 Common Macro Factors and Their Effects on U.S Stock Returns IBRAHIM CAN HALLAC 6/22/2011 Title: Common Macro Factors and Their Effects on U.S Stock Returns Name : Ibrahim Can Hallac ANR: 374842 Date
Module 6 Portfolio risk and return
 Module 6 Portfolio risk and return Prepared by Pamela Peterson Drake, Ph.D., CFA 1. Overview Security analysts and portfolio managers are concerned about an investment s return, its risk, and whether it
The Equity Premium. Eugene F. Fama and Kenneth R. French * Abstract
 First draft: March 2000 This draft: July 2000 Not for quotation Comments solicited The Equity Premium Eugene F. Fama and Kenneth R. French * Abstract We compare estimates of the equity premium for 1872-1999
Derivation of zero-beta CAPM: Efficient portfolios
 Derivation of zero-beta CAPM: Efficient portfolios AssumptionsasCAPM,exceptR f does not exist. Argument which leads to Capital Market Line is invalid. (No straight line through R f, tilted up as far as
On the economic significance of stock return predictability: Evidence from macroeconomic state variables
 On the economic significance of stock return predictability: Evidence from macroeconomic state variables Huacheng Zhang * University of Arizona This draft: 8/31/2012 First draft: 2/28/2012 Abstract We
Estimating Beta. The standard procedure for estimating betas is to regress stock returns (R j ) against market returns (R m ): R j = a + b R m
 against market returns (R m ): R j = a + b R m") Estimating Beta 122 The standard procedure for estimating betas is to regress stock returns (R j ) against market returns (R m ): R j = a + b R m where a is the intercept and b is the slope of the regression.
Estimating Beta 122 The standard procedure for estimating betas is to regress stock returns (R j ) against market returns (R m ): R j = a + b R m where a is the intercept and b is the slope of the regression.
INVESTMENTS Lecture 2: Measuring Performance
 Philip H. Dybvig Washington University in Saint Louis portfolio returns unitization INVESTMENTS Lecture 2: Measuring Performance statistical measures of performance the use of benchmark portfolios Copyright
Further Test on Stock Liquidity Risk With a Relative Measure
 International Journal of Education and Research Vol. 1 No. 3 March 2013 Further Test on Stock Liquidity Risk With a Relative Measure David Oima* David Sande** Benjamin Ombok*** Abstract Negative relationship
A Portfolio s Risk - Return Analysis
 A Portfolio s Risk - Return Analysis 1 Table of Contents I. INTRODUCTION... 4 II. BENCHMARK STATISTICS... 5 Capture Indicators... 5 Up Capture Indicator... 5 Down Capture Indicator... 5 Up Number ratio...
Journal Of Financial And Strategic Decisions Volume 7 Number 1 Spring 1994 INSTITUTIONAL INVESTMENT ACROSS MARKET ANOMALIES. Thomas M.
 Journal Of Financial And Strategic Decisions Volume 7 Number 1 Spring 1994 INSTITUTIONAL INVESTMENT ACROSS MARKET ANOMALIES Thomas M. Krueger * Abstract If a small firm effect exists, one would expect
Exploiting Factor Autocorrelation to Improve Risk Adjusted Returns
 Exploiting Factor Autocorrelation to Improve Risk Adjusted Returns Kevin Oversby 22 February 2014 ABSTRACT The Fama-French three factor model is ubiquitous in modern finance. Returns are modeled as a linear
The Systematic Risk and Leverage Effect in the Corporate Sector of Pakistan
 The Pakistan Development Review 39 : 4 Part II (Winter 2000) pp. 951 962 The Systematic Risk and Leverage Effect in the Corporate Sector of Pakistan MOHAMMED NISHAT 1. INTRODUCTION Poor corporate financing
Covariance Matrix Estimation using an Errors-in-Variables Factor Model with Applications to Portfolio Selection and a Deregulated Electricity Market
 Covariance Matrix Estimation using an Errors-in-Variables Factor Model with Applications to Portfolio Selection and a Deregulated Electricity Market Warren R. Scott, Warren B. Powell Sherrerd Hall, Charlton
Measuring the Systematic Risk of Stocks Using the Capital Asset Pricing Model
 Journal of Investment and Management 2017; 6(1): 13-21 http://www.sciencepublishinggroup.com/j/jim doi: 10.11648/j.jim.20170601.13 ISSN: 2328-7713 (Print); ISSN: 2328-7721 (Online) Measuring the Systematic
ANALYSIS ON RISK RETURN TRADE OFF OF EQUITY BASED MUTUAL FUNDS
 ANALYSIS ON RISK RETURN TRADE OFF OF EQUITY BASED MUTUAL FUNDS GULLAMPUDI LAXMI PRAVALLIKA, MBA Student SURABHI LAKSHMI, Assistant Profesor Dr. T. SRINIVASA RAO, Professor & HOD DEPARTMENT OF MBA INSTITUTE
APPLICATION OF CAPITAL ASSET PRICING MODEL BASED ON THE SECURITY MARKET LINE
 APPLICATION OF CAPITAL ASSET PRICING MODEL BASED ON THE SECURITY MARKET LINE Dr. Ritika Sinha ABSTRACT The CAPM is a model for pricing an individual security (asset) or a portfolio. For individual security
Copyright 2009 Pearson Education Canada
 Operating Cash Flows: Sales $682,500 $771,750 $868,219 $972,405 $957,211 less expenses $477,750 $540,225 $607,753 $680,684 $670,048 Difference $204,750 $231,525 $260,466 $291,722 $287,163 After-tax (1
Expected Return Methodologies in Morningstar Direct Asset Allocation
 Expected Return Methodologies in Morningstar Direct Asset Allocation I. Introduction to expected return II. The short version III. Detailed methodologies 1. Building Blocks methodology i. Methodology ii.
Estimating term structure of interest rates: neural network vs one factor parametric models
 Estimating term structure of interest rates: neural network vs one factor parametric models F. Abid & M. B. Salah Faculty of Economics and Busines, Sfax, Tunisia Abstract The aim of this paper is twofold;
Using Pitman Closeness to Compare Stock Return Models
 International Journal of Business and Social Science Vol. 5, No. 9(1); August 2014 Using Pitman Closeness to Compare Stock Return s Victoria Javine Department of Economics, Finance, & Legal Studies University
A Systems Approach to Modelling the EMS Exchange Rate Mechanism*
 The Economic and Social Review, Vol. 20, No. 2, January 1989, pp. 111-120 A Systems Approach to Modelling the EMS Exchange Rate Mechanism* RONALD BEWLEY University of Sydney and University of New South
Monthly Holdings Data and the Selection of Superior Mutual Funds + Edwin J. Elton* Martin J. Gruber*
 Monthly Holdings Data and the Selection of Superior Mutual Funds + Edwin J. Elton* (eelton@stern.nyu.edu) Martin J. Gruber* (mgruber@stern.nyu.edu) Christopher R. Blake** (cblake@fordham.edu) July 2, 2007
ASYMMETRIC RESPONSES OF CAPM - BETA TO THE BULL AND BEAR MARKETS ON THE BUCHAREST STOCK EXCHANGE
 Annals of the University of Petroşani, Economics, 9(4), 2009, 257-262 257 ASYMMETRIC RESPONSES OF CAPM - BETA TO THE BULL AND BEAR MARKETS ON THE BUCHAREST STOCK EXCHANGE RĂZVAN ŞTEFĂNESCU, COSTEL NISTOR,
Risk changes around convertible debt offerings
 Journal of Corporate Finance 8 (2002) 67 80 www.elsevier.com/locate/econbase Risk changes around convertible debt offerings Craig M. Lewis a, *, Richard J. Rogalski b, James K. Seward c a Owen Graduate
Your use of the JSTOR archive indicates your acceptance of the Terms & Conditions of Use, available at
 American Economic Association A Reexamination of Exchange-Rate Exposure Author(s): Kathryn M. E. Dominguez and Linda L. Tesar Source: The American Economic Review, Vol. 91, No. 2, Papers and Proceedings
Decimalization and Illiquidity Premiums: An Extended Analysis
 Utah State University DigitalCommons@USU All Graduate Plan B and other Reports Graduate Studies 5-2015 Decimalization and Illiquidity Premiums: An Extended Analysis Seth E. Williams Utah State University
2. Regulatory principles to assess the most appropriate WACC methodology
 BACKGROUND DOCUMENT DESCRIBING THE COMMISSION SERVICES WORKING ASSUMPTIONS FOR THE DETERMINATION OF THE WEIGHTED AVERAGE COST OF CAPITAL (WACC) IN REGULATORY PROCEEDINGS IN THE ELECTRONIC COMMUNICATIONS
Portfolio Risk Management and Linear Factor Models
 Chapter 9 Portfolio Risk Management and Linear Factor Models 9.1 Portfolio Risk Measures There are many quantities introduced over the years to measure the level of risk that a portfolio carries, and each
CHAPTER 8: INDEX MODELS
 CHTER 8: INDEX ODELS CHTER 8: INDEX ODELS ROBLE SETS 1. The advantage of the index model, compared to the arkoitz procedure, is the vastly reduced number of estimates required. In addition, the large number
Procedia - Social and Behavioral Sciences 109 ( 2014 ) Yigit Bora Senyigit *, Yusuf Ag
 Yigit Bora Senyigit *, Yusuf Ag") Available online at www.sciencedirect.com ScienceDirect Procedia - Social and Behavioral Sciences 109 ( 2014 ) 327 332 2 nd World Conference on Business, Economics and Management WCBEM 2013 Explaining
Available online at www.sciencedirect.com ScienceDirect Procedia - Social and Behavioral Sciences 109 ( 2014 ) 327 332 2 nd World Conference on Business, Economics and Management WCBEM 2013 Explaining
in-depth Invesco Actively Managed Low Volatility Strategies The Case for
 Invesco in-depth The Case for Actively Managed Low Volatility Strategies We believe that active LVPs offer the best opportunity to achieve a higher risk-adjusted return over the long term. Donna C. Wilson
The Conditional Relationship between Risk and Return: Evidence from an Emerging Market
 Pak. j. eng. technol. sci. Volume 4, No 1, 2014, 13-27 ISSN: 2222-9930 print ISSN: 2224-2333 online The Conditional Relationship between Risk and Return: Evidence from an Emerging Market Sara Azher* Received
Lecture 3: Factor models in modern portfolio choice
 Lecture 3: Factor models in modern portfolio choice Prof. Massimo Guidolin Portfolio Management Spring 2016 Overview The inputs of portfolio problems Using the single index model Multi-index models Portfolio
A Simplified Approach to the Conditional Estimation of Value at Risk (VAR)
") A Simplified Approach to the Conditional Estimation of Value at Risk (VAR) by Giovanni Barone-Adesi(*) Faculty of Business University of Alberta and Center for Mathematical Trading and Finance, City University
A Simplified Approach to the Conditional Estimation of Value at Risk (VAR) by Giovanni Barone-Adesi(*) Faculty of Business University of Alberta and Center for Mathematical Trading and Finance, City University
Cost of Capital (represents risk)
") Cost of Capital (represents risk) Cost of Equity Capital - From the shareholders perspective, the expected return is the cost of equity capital E(R i ) is the return needed to make the investment = the
Cost of Capital (represents risk) Cost of Equity Capital - From the shareholders perspective, the expected return is the cost of equity capital E(R i ) is the return needed to make the investment = the
Financial Mathematics III Theory summary
 Financial Mathematics III Theory summary Table of Contents Lecture 1... 7 1. State the objective of modern portfolio theory... 7 2. Define the return of an asset... 7 3. How is expected return defined?...
The Fallacy of Large Numbers
 The Fallacy of Large umbers Philip H. Dybvig Washington University in Saint Louis First Draft: March 0, 2003 This Draft: ovember 6, 2003 ABSTRACT Traditional mean-variance calculations tell us that the
THE JANUARY EFFECT RESULTS IN THE ATHENS STOCK EXCHANGE (ASE) John Mylonakis 1
 John Mylonakis 1") THE JANUARY EFFECT RESULTS IN THE ATHENS STOCK EXCHANGE (ASE) John Mylonakis 1 Email: imylonakis@vodafone.net.gr Dikaos Tserkezos 2 Email: dtsek@aias.gr University of Crete, Department of Economics Sciences,
THE JANUARY EFFECT RESULTS IN THE ATHENS STOCK EXCHANGE (ASE) John Mylonakis 1 Email: imylonakis@vodafone.net.gr Dikaos Tserkezos 2 Email: dtsek@aias.gr University of Crete, Department of Economics Sciences,
Active portfolios: diversification across trading strategies
 Computational Finance and its Applications III 119 Active portfolios: diversification across trading strategies C. Murray Goldman Sachs and Co., New York, USA Abstract Several characteristics of a firm
The Fallacy of Large Numbers and A Defense of Diversified Active Managers
 The Fallacy of Large umbers and A Defense of Diversified Active Managers Philip H. Dybvig Washington University in Saint Louis First Draft: March 0, 2003 This Draft: March 27, 2003 ABSTRACT Traditional
The Fixed Income Valuation Course. Sanjay K. Nawalkha Gloria M. Soto Natalia A. Beliaeva
 Interest Rate Risk Modeling The Fixed Income Valuation Course Sanjay K. Nawalkha Gloria M. Soto Natalia A. Beliaeva Interest t Rate Risk Modeling : The Fixed Income Valuation Course. Sanjay K. Nawalkha,
A Comparative Study on Markowitz Mean-Variance Model and Sharpe s Single Index Model in the Context of Portfolio Investment
 A Comparative Study on Markowitz Mean-Variance Model and Sharpe s Single Index Model in the Context of Portfolio Investment Josmy Varghese 1 and Anoop Joseph Department of Commerce, Pavanatma College,