Welcomes. Analyst Friends for the Presentation on
|
|
|
- Rodger Kennedy
- 5 years ago
- Views:
Transcription

1 Welcomes Analyst Friends for the Presentation on


2 2 To be a Bank of choice of every Indian & A Preferred banking partner Globally To achieve consistent growth in Business. To Endeavour for inclusive development. Ensure service excellence through effective harnessing of human capital & Technology.
3 I N D E X 3 The Bank has announced the financial results for the quarter and year ended March 31, 2013 in accordance with the RBI / SEBI guidelines. The Salient features of the financial results of the Bank are presented herein Sl No Details Slide No 1 Key Business Parameters 4 2 Equity Holding 5 3 Branch Network Net Profit Geographical Distribution of Business 11 6 Major Business Parameters Credit Portfolio Credit-Deposit Ratio 27 9 Restructured Advances NPA & Recovery Investment Portfolio Earnings & Profitability Performance Indicators & Key Ratios Net Interest Income Income & Expenditure Provisions Capital Adequacy & Networth Achievements & New Initiatives Awards & Recognition Road Map Ahead 73-76
4 Key Business Parameters : FY Net Profit ` 2004 crore (` 1313 crore) Total Income ` 18,295 crore (` crore) Gross NPA Level reduced from ` 3183 crore to ` 2,979 crore Gross NPA Ratio Net NPA Level reduced from `1185 crore to ` 1,125 crore Net NPA Ratio % % % 1.99 % (2.53%) % 0.76 % (0.96%) Global Deposits ` crore (` crore) Global Advances ` crore (` crore) Global Business ` crore (` crore) CASA Deposits ` crore (` crore) Earning per share Provision Coverage Ratio % % % % % (22.89%) % (80.06%) Figures in brackets as at Mar 2012

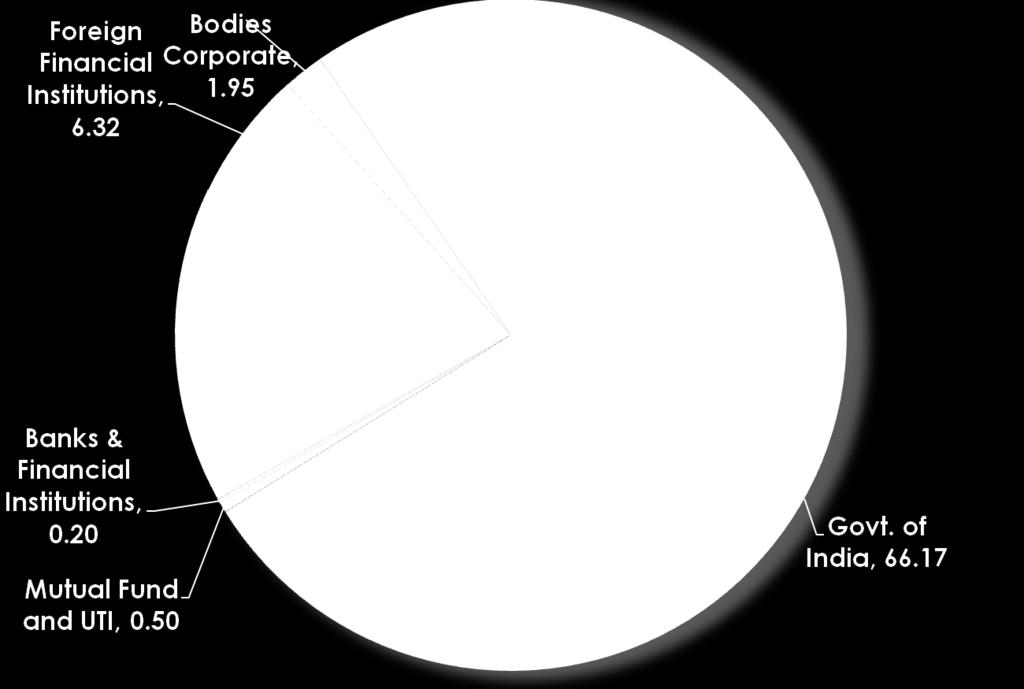
5 Equity Holdings 5

 2934 ATMs 1306")


6 Branch Network 6 As at Branches (Incl London) 2934 ATMs 1306 Satellite Offices 74 Ultra Small Branches 936 Extension Counters 12 Total Delivery Outlets 5262 Bank has opened 215 branches during the year taking the total Network to 2934 branches. Many of them were in hitherto unbanked areas across the country. Bank has entered in to 35 more districts by opening branches. 629 Urban March Metro 903 Rural 788 S-Urban
 4 Chattisgarh 12 Delhi 138 Goa 24 Gujarat 78 Haryana 113 Himachal Pradesh 10 Jammu and Kashmir 3 Jharkhand 24 Karnataka 678 Kerala 192 Lakshadweep 9 Madhya Pradesh 69 Maharashtra 187 Meghalaya 5")
7 State / Union Territory Andaman & Nicobar(U.T.) 10 Andhra Pradesh 425 Arunachal Pradesh 1 Assam 19 Bihar 45 Chandigarh(U.T) 4 Chattisgarh 12 Delhi 138 Goa 24 Gujarat 78 Haryana 113 Himachal Pradesh 10 Jammu and Kashmir 3 Jharkhand 24 Karnataka 678 Kerala 192 Lakshadweep 9 Madhya Pradesh 69 Maharashtra 187 Meghalaya 5 Mizoram 1 Nagaland 1 Orissa 70 Puducherry(U T) 4 Punjab 36 Rajasthan 60 Sikkim 1 Tamilnadu 205 Tripura 3 Uttar Pradesh 387 Uttarakhand 25 West Bengal 94 Total (Excluding USB) 2933 Total = London Br = 2934 Geographical Distribution of Branch Network Lakshadweep Andaman & Nicobar 10 Bank has Branches in all the States and Union Territories except in Manipur (State) and in Dadra & Nagar Haveli (UTs)

8 Specialised Branches/ Offices 8 Specialized Branches Overseas/International Business Branches 3 Capital Market Service Branch 1 Industrial Finance Branches 2 Corporate Finance Branches 3 Large Corporate Branches 2 Asset Recovery Management Branches 12 Housing Finance Branches 5 Government Transactions Branch 1 Service Branches 23 SME Branches 60 Mid Corporate Branches 69 Satellite Offices 74 Ultra Small branches 936 Business Process Management Centre (Back Office) 1 Extension Encounters 12 Specialized Offices Central Processing Centres 19 Foreign Exchange Business Dealing/Processing Centres 9 Electronic Payment and Settlement Office 1 Central Pension Processing Cell 1 Lead District Offices 27 Total 1261
9 9 Net Profit (Quarterly) Sep Dec Mar Mar Jun Q4-o-Q4 Growth : 92%

10 Net Profit March 13 ` 2004 crore March 12 ` 1313 crore March 11 ` 1048 crore March 10 ` 813 crore y-o-y Growth : 53% 10
11 Geographical Distribution of Domestic Business 11 Geographical Region States No of Brs. Deposits Advances Business CD Ratio Central Region Eastern Region Chhattisgarh, Madhya Pradesh, Uttarakhand & Uttar Pradesh Andaman & Nicobar Islands, Bihar, Jharkhand, Orissa & West Bengal North Eastern Region Northern Region Southern Region Arunachal Pradesh, Assam, Meghalaya, Mizoram, Nagaland, Sikkim & Tripura Chandigarh (UT), Delhi, Haryana, Himachal Pradesh, Jammu & Kashmir, Punjab & Rajasthan Andhra Pradesh, Karnataka, Kerala, Lakshadweep, Pondicherry (UT) & Tamil Nadu Western Region Goa, Gujarat & Maharashtra Total (Before netting PWO & excl. CODs)
12 12 Global and Domestic Business Particulars Actuals Growth in Growth in Mar 11 Mar 12 Mar 13 Amt % amt % Global Business Global Deposits Global Advances Domestic Business Domestic Deposits Domestic Advances CASA Deposits Current Deposits Savings Bank Card Rate Term Deposits Bulk Deposits (DRI+COD) of which DRI Deposits

13 13 Global Business Composition
 14 Mar-12")


 31.")
14 CASA Deposits (Domestic) 14 Mar-12 Dec-12 Mar-13 Deposits 147,707 Deposits 150,723 Deposits 167,055 CASA 46,478 CASA 48,323 CASA 51,926 CASA (%) CASA (%) CASA (%) 31.08
15 Bulk Deposits (DRI+COD) 15 DRI Deposits % of DRI to Domestic Deps CoDs % of CoDs to Domestic Deps Total Bulk Deposits % of Bulk to Domestic Deps

16 16 Deposits
17 17 Core Term Deposits- Actuals Vs. Average (Domestic) Average Actual Mar 12 June 12 Sep 12 Dec 12 Mar 13
18 18 Advances - Actuals Vs. Average (Domestic) Average Actual Mar 12 June 12 Sep 12 Dec 12 Mar 13
19 Credit Portfolio 19 Particulars Mar Mar Domestic Advances (Gross) y o y Growth (%) 110, , Retail Credit 18,295 19, MSE Credit (Mfg) 13,492 15, Agriculture Credit 17,409 20, Credit to Weaker Section 11,034 11, MSME Credit 14,736 16, Domestic Advances (Net) Average Domestic Advances 108, , , ,
20 Retail Credit Components 20 Particulars Housing Loans (Direct) Education Loans Advance March, 2012 March, 2013 % to Gr. Adv. % to amt. o/s Advance % to Gr. Adv. % to amt. o/s Growth over March, 2012 Amt % 8, , , , Vehicle Loans 1, , Personal Loans 4, , (51) (1.16) Gold Loans , Mortgage Loans 1, (160) (14.17) Others (28) (14.21) Total Retail Credit 18, ,
21 Social Lending - Targets Surpassed under Priority Sector 21 Particulars March, 2012 March, 2013 Y-o-Y Growth (%) Mandatory Target (%) Achievement (%) Priority Sector Advances 41,383 46, Agriculture 17,409 20, Direct Agriculture 13,585 16, Indirect Agriculture 3,824 4, Micro & Small Enterprises 13,492 15, Other Priority Sector 10,483 11, Advances to Weaker Section 11,034 11, Advances to Minority 6,609 7, Advances to Women 7,344 8, ANBC Level 91, ,
22 22 Performance under Gold Loans The Gold Loans of the Bank have shown appreciable growth during the year. Branches from various regions are sanctioning JLs and the Bank has at present 109 Gold Loan Shoppes for quick disposal of Gold loans. Particulars Mar-12 Dec 12 Mar 13 % Growth Gold Loan - Priority 2,840 4,305 4, JL - Agriculture (Crop) 1,821 2,832 3, JL - Agriculture (Non-Crop) SyndSwarna 774 1,044 1, Gold Loan - Non-Priority 730 1,206 1, SyndSwarna Express 730 1,206 1, Total Gold Loan 3,570 5,511 6,
23 Power, Telecom, Aviation and Roads (Balance outstanding) 23 Particulars March, 2012 March, 2013 Variation (%) Restructured Power State Owned Private Owned Telecom Aviation (35.92) Roads & Ports
24 24 Particulars ( Fund & Non-fund Based) Credit Portfolio Industry Wise (i) Food Processing Sugar Edible Oil & Vanaspati T ea & Coffee T extiles Out of which Cotton Textiles Other T extiles (Including Jute) Leather and Leather Product Paper and Paper Product Petroleum, Coal Product and Nuclear Fuels % to Gross Adv. % to Gross Adv. Mar 12 Mar 13 Dec Rubber & Rubber Products Tobacco & Tabbaco Products Other Industries
25 Credit Portfolio Industry Wise (ii) 25 Particulars Chemical & Chemical Products 2, , ,465 Out of which Fertilizer , Out of which Drugs & Pharmaceuticals Out of which Petro Chemicals 1, ,281 Cement & Cement Product Iron & Steel 4, , ,105 All Engineering 4, , ,514 Vehicles, Vehicles Parts & Transport Equipment Mar Gems & Jewellery , ,005 Construction 3, , ,560 % to Gross Adv. % to Gross Adv. Mar 13 Dec 12
26 Credit Portfolio Industry Wise (iii) 26 Particulars Mar 12 % to Gross Adv. Mar 13 % to Gross Adv. Dec 12 Infrastructure Finance Power Telecommunication Roads & Ports Other Computer Software Other Metals & Metal Products Coal Mining
27 27 Credit - Deposit Ratio March 11 March 12 March 13 Gross Deposits Gross Advance Global CD Ratio Domestic CD Ratio
28 Restructured Advances 28 Under As on March, 2013 (Cumulative) During FY During FY As on March, 2012 (Cumulative) Standard Assets Sub-Standard Assets Doubtful Assets Total No. of borrowers 1,27,337 64,174 40,368 1,36,631 Amount outstanding 8,189 3,147 5,617 6,020 No. of borrowers 6, ,862 Amount outstanding No. of borrowers 6, ,477 Amount outstanding No. of borrowers 1,39,538 64,292 40,924 1,45,970 Amount outstanding 9,126 3,150 5,648 6,901
 80.06 83.01 83.41 31.12.12 2.31 31.12.12 0.85 31.03.12 2.53 31.")
29 Non Performing Assets (NPA) 29 Particulars (Absolute) Mar Dec Mar Gross NPA 3,183 3,160 2,979 Net NPA 1,185 1,141 1,125 Provision Coverage Ratio (%) Gross NPA (%) Net NPA (%)
30 30 Particulars Movement as on Mar - 12 Mar - 13 A. Gross NPA at the beginning 2,599 3,183 B. Less: (i) Upgradation (incl. reduction due to Operations) (ii) Recoveries (iii) Write Offs (incl. Prudential) (iv)decrease due to operation/foreign exchange fluctuation NPA Level and Recovery Total (B) 2,573 2,346 C. Add: Fresh NPA 3,156 2,142 Gross NPA at the end (A-B+C) 3,183 2, Q4 3, ,979

31 31 Investment Portfolio (Gross)
32 Investment Category 32 Category Composition as on Mar 2012 Dec Mar HTM 35,267 35,715 37,533 % to Investment AFS 5,619 7,487 7,879 % to Investment HFT % to Investment Gross Investment 40,886 43,202 45,694 Deprn. & Provision for NPI Net Investment 40,815 43,168 45,648
33 Investment Holdings 33 Particulars Composition as on HTM AFS HFT Gross Investment Central & State Govt , , Other Approved Securities Shares Debentures & Bonds - 1, , Subsidiaries & Joint Ventures Others , ,101 Sub Total 37, , Less: Repo Net Investment 37, , ,574.22
34 Investment Scenario 34 Particulars March, 2012 March, 2013 Y-o-Y Growth Amount % SLR 36,554 40,185 3, Non - SLR 4,332 5,509 1, Total 40,886 45,694 4, Interest Income From Investments 2,736 3,
 = 2.")
35 35 Earnings Quarterly Q4( ) Q4( ) Op. Profit Net Profit Op. Profit Net Profit Quarterly Growth (Op. Profit) = 2.39% Quarterly Growth (Net Profit) = 91.59%
36 Earnings 36 Annual March, 2012 March, 2013 Op. Profit Net Profit Op. Profit Net Profit 3,347 1,313 3,450 2,004 Yearly Growth (Operating Profit) = 3.08% Yearly Growth (Net Profit) = 52.63%


37 Business and Profitability 37 Business Mar Dec (9M) Mar 2013 Per Branch Per Employee Profit ` Lakh Mar Dec. 12 (9M) Mar Per Branch Per Employee

38 Performance Indicators 38 Mar. Dec. Mar. Particulars (%) (%) (%) Return on Assets Net Interest Margin (NIM) Return on Equity Yield on Advances Cost of Deposits Gross NPA Net NPA CRAR (Basel - II)
39 Cost Ratios (%) 39 Emp. Cost & Cost to Income Ratio Quarterly Yearly Mar -12 Mar-13 Mar - 12 Mar - 13 Cost to Income Emp. Cost to Income Cost to Income Emp. Cost to Income Cost to Income Emp. Cost to Income Cost to Income Emp. Cost to Income
40 Cost and Yield (%) 40 Cost of Deposits Mar Dec Mar Yield on Advances Mar Dec Mar
")


41 Cost and Yield (%) Contd. 41 Dec Mar Cost of Funds Mar Yield on Investments Mar Dec Mar
 (9M) (Y) Dec. 12 = 3.")
 NIM for Mar. 2013 Qrtr.")
42 Key Ratios 42 (Y) Mar. 13 = 3.19%(Y) (9M) (Y) Dec. 12 = 3.27%(9M) Mar. 12 = 3.43%(Y) NIM for Mar Qrtr. = 2.97% (Y) (9M) (Y)
43 Earning / Profitability Ratio (%) 43 Particulars March, 2012 December, 2012 (9M) March, 2013 (Y) Return on Assets ( Net Profit / AWF) Return on Equity (Net Profit / Equity) Book Value per Share (`) [FV - ` 10] Earning per Share (%) [FV - ` 10] Other Income to Total Income (%) Asset Utilisation (Op. Profit / AWF) Net Interest Income to AEA Other Income to AWF Equity Dividend proposed (%) 38-67
44 Earnings and Profitability 44 Particulars March 2012 March 2013 INCOME y-o-y Growth (%) Interest Income on Advances 12,371 13, Interest Income on Investments 2,736 3, Interest on IT Refund Other Interest Income Other Income 1,076 1, TOTAL INCOME 16,344 18, EXPENDITURE Interest Expended 10,183 11, Staff Expenses 1,892 2, Other Operating Expenses 923 1, TOTAL EXPENSES 12,997 14, OPERATING PROFIT 3,347 3, Provision & Contingencies 2,034 1,446 (28.95) NET PROFIT 1,313 2,
45 Earnings and Profitability (Quarterly) 45 Particulars Mar 2012 Dec 2012 Mar 2013 INCOME Growth Q4-o-Q4 (%) Growth Q4-o-Q3 (%) Interest Income on Advances 3,300 3,333 3, Interest Income on Investments Other Interest Income Net Profit on Sale of Investments Other Income TOTAL INCOME 4,424 4,490 4, EXPENDITURE Interest Expended 2,788 2,821 3, Staff Expenses Other Operating Expenses TOTAL EXPENSES 3,544 3,626 3, OPERATING PROFIT Provisions & Contingencies (45.92) (13.19) NET PROFIT

46 46 Net Interest Income Net Interest Income (NII) Quarterly Yearly Mar - 12 Mar - 13 Mar - 12 Mar -13 1,337 1,344 5,085 5,454 Quarterly Growth 0.52 % Yearly Growth 7.26%
47 NII & Burden (Quarterly) 47 Particulars (` in Crore) Mar Dec Mar Q4-o-Q4 Growth (%) Q4-o-Q3 Growth (%) Interest Income 4,125 4,221 4, Interest Expended 2,788 2,821 3, Net Interest Income (NII) 1,337 1,400 1, (4.00) Other Income Operating Expenses Burden (Operating Expenses - Non Interest Income) (3.07) (17.54)
48 NII & Burden (Y-o-Y) 48 Particulars (` in Crore) Y-o-Y Mar Mar Growth (%) Dec (9M) Interest Income 15,268 17, ,739 Interest Expended 10,183 11, ,630 Net Interest Income (NII) 5,085 5, ,109 Other Income 1, Operating Expenses 2,814 3, ,336 Burden (Operating Expenses - Non Interest Income) 1,738 2, ,561
49 Interest Analysis 49 (` in Crore) Particulars FY ENDED Mar Mar Growth (%) Dec (9M) Interest Income 15,268 17, ,739 Interest on Advances 12,371 13, ,059 Interest on Investments 2,736 3, ,400 Interest on Call Money Lending / Repo Others (Int. on IT Refund) Interest Expended 10,183 11, ,630 Interest Paid on Deposits 9,326 10, ,961 Interest paid on RBI and Inter Bank Borrowings (5.00) 57 Other Interest Expenditure Net Interest Income 5,085 5, ,109 Net Interest Margin (NIM) 3.43% 3.19% 3.27%
50 50 Particulars Quarterly Interest Analysis Quarterly Growth (%) Mar Dec Mar Q4-o-Q4 Q4-o-Q3 Interest Income 4,125 4,221 4, Interest on Advances 3,300 3,333 3, Interest on Investments Interest on Call Money Lending / Repo (` in Crore) Others (Int. on IT Refund) Interest Expended 2,788 2,821 3,037 Interest Paid on Deposits 2,582 2,572 2,793 Interest paid on RBI and Inter Bank Borrowings (9.52) Other Interest Expenditure (1.32) Net Interest Income 1,337 1,400 1,344 Net Interest Margin (NIM) 3.60% 3.29% 2.97% 0.52 (4.00)
51 Other Income 51 (` in Crore) Particulars FY Ended Mar Mar Growth (%) Dec (9M) Commission & Brokerage (0.19) 350 Commission on Govt. Business (8.11) 24 Sub Total Net Profit from FX Transactions (0.73) (30.77) Dividend Earned Recovery in w/o A/c.s Miscellaneous Income Total (Excl. Trading Profit) 987 1, Net Profit on Sale of Investment GRAND TOTAL 1,076 1,
52 Other Income (Quarterly) 52 (` in Crore) Particulars Q4 vis a vis Q3 Growth (%) Mar Dec Mar Q4-o-Q4 Q4-o-Q3 Commission & Brokerage Commission on Govt. Business Net Profit from FX Transactions 9 7 Sub Total (35.40) (30.79) Dividend Earned (100.00) Recovery in w/o A/c.s Miscellaneous Income Total (Excl. Trading Profit) Net Profit on Sale of Investment GRAND TOTAL
53 Operating Expenses 53 Particulars FY Ended Mar Mar Growth (%) (` in Crore) Dec (9M) Staff Expenses 1,891 2, ,600 Rent, Taxes & Lighting Printing & Stationary Advertisement & Publicity Depreciation on Fixed Assets Auditors Fees (16.67) 17 Law Charges Postage, Telephone etc Repairs & Maintenance (21.05) 56 Insurance & Guarantee Fee Other Expenditure TOTAL 2,814 3, ,336
54 Operating Expenses (Quarterly) 54 (` in Crore) Growth (%) Particulars Mar Dec Mar Q4-o-Q4 Q4-o-Q3 Staff Expenses Rent, Taxes & Lighting (6.12) Printing & Stationary Advertisement & Publicity Depreciation on Fixed Assets Auditors Fees (57.14) (57.14) Law Charges Postage, Telephone etc Repairs & Maintenance (34.48) (9.52) Insurance & Guarantee Fee Other Expenditure (0.99) TOTAL
55 Provisions 55 Provisions For Yearly Quarterly March, 2012 March, 2013 Dec 2012 March NPA 1,446 1, Standard Assets Restructured Assets Depreciation on Investments 39 (17) 6 (14)
56 56 AS 15 Superannuation Schemes Provision Made March, 2012 Dec 2012 (9M) March, 2013 Pension * Gratuity Leave Encashment Total * This includes additional provision of Rs. 25 Crs. made to Pension Fund over and above the actuarial liability.
57 57 AS 15 Quarterly Provisions Provision Made Mar (3M) Dec (3M) Mar (3M) Pension Gratuity Leave Encashment Total
58 58 Taxation Provisions Provision Made March, 2012 Dec, 2012 (9M) March, 2013 Income Tax (Domestic) Income Tax (London) MAT Credit Entitlement Availed - (460) (574) Deferred Tax Assets (DTA) (39) (241) (231) Write Back of Excess Provisions (256) - - Total 74 (387) (441)
59 59 Taxation Provisions (Quarterly) Provision Made Dec (3M) March, 2012 (3M) March, 2013 (3M) Income Tax (Domestic) Income Tax (London) MAT Credit Entitlement Availed (141) - (114) Deferred Tax Assets (DTA) (169) (37) 10 Write Back of Excess Provisions - (256) - Total (175) (119) (57)
60 60 Capital Adequacy Particulars December, 2012 (9M) March, 2012 March, 2013 Tier I Capital (Basel II) 8,510 8,751 10,040 Tier II Capital (Basel II) 3,972 3,225 4,063 Total Capital (Basel II) 12,482 11,976 14,103 Risk Weighted Assets (RWA) 1,09,624 97,830 1,12,060 CRAR (Basel II) (%) Tier I CRAR (Basel II) (%) Tier II CRAR (Basel II) (%) CRAR (Basel I) (%)

61 CRAR Basel II (%) 61
62 Particulars Basel I Basel - II March, 2012 March, 2013 March, 2012 March, 2013 Paid up Capital Perpetual Non-Cumulative Preference Shares Statutory Reserve 2, , , , Capital Reserve Share Premium 1, , , , Revenue and General Reserve 3, , , , Special Reserve u/s 36 (1)(viii) of IT Act, 1961 Balance of Profit Innovative Tier II Bonds Total Tier I (Core) Capital 8, , , , Less: Intangible Assets Tier I Capital - of above DTA Inv. In Subs. & Associates Total Deduction Total Tier I Capital 8, , , , Tier I Ratio
63 63 Tier II Capital Basel I Basel - II Particulars March, 2012 March, 2013 March, 2012 March, 2013 Revaluation Reserve (@ 45%) Hybrid Capital (Upper Tier II Bonds) General Provisions Investment Reserve Account Provision for Standard Assets Subordinated Term Debts 1, , , , Tier II (Gross) 3, , , , Less: Investment in Subsidiaries & Associates Total Deduction Total Tier II Capital 3, , , , Total Capital (Tier I + Tier II) 12, , , , Tier II Ratio
64 64 Net Worth Particulars Share Capital : Equity Share Capital Perpetual Non Cumulative - - Preference Shares Add: Reserves & Surplus (Excl. Revaluation Reserve) i. Statutory Reserve 2,073 2,574 ii. Capital Reserve iii. Share Premium 1,080 1,080 iv. Revenue Reserve 3,012 3,824 v. General Reserve vi. Investment Reserve - 12 vii. Special Reserve viii. Balance of Profit - - Sub Total 7,429 8,961 Capital & Free Reserves 8,031 9,563 Less: Intangible Assets - - Net Worth 8,031 9,563 Less: DTA (Net) Tangible Net Worth 7,994 9,295
65 Achievements & New Initiatives
66 Achievements & New Initiatives Bank has opened 215 new branches across the country taking the Bank s Branch Network to 2934 Branches including one at London branch. Bank has expanded its Network to 35 more districts in the country. Bank has 41 Regional Offices, 60 SME branches, 69 Mid Corporate Branches, 23 Service branches, 9 Foreign Exchange Processing Centres, 8 Regional Inspectorates, 7 Staff Training Centers, 27 Lead District Offices, 19 Central Processing Centres, 41 Currency Chests,1 Central Pension Processing Centres, 8 Stationary Pools, and 1 Electronic Payments And Settlement Offiice. Total Delivery Channels (Branches, ATMs, Ultra Small Branches, Satellite Offices and Extension Counters) stood at 5262 as at 31 st March To have better control and business focus, 3 new Regions have been formed at Bangalore, Delhi and Mumbai taking the number of Regional Offices from 38 to 41. Mid Corporate Credit Department and New Vertical for Fee Based Income created last year have started giving results. 6 ARMB new branches opened to improve recovery. START Team formed at RO s for improving recovery performance and monitoring of NPAs & SMAs of loans below ` lakh.
67 Achievements & New Initiatives Bank is the SLBC convener in Karnataka state and UTLBC Lakshadweep. Lead Bank responsibility has increased to 27 districts (7 in Karnataka, 2 in Kerala,5 in AP,9 in UP, 3 in Haryana & 1 in Lakshadweep) during Bank has surpassed all the mandatory targets under Priority Sector Credit and its subsectors for the year % achievement of coverage of unbanked villages under Financial Inclusion Plan. Bank has taken a no of steps for smooth roll out of Direct Benefit Transfer in the identified Districts. These initiatives are expected to go a long way in passing on the Economic benefits to the intended beneficiaries seamlessly. SB cum OD product with a limit of Rs.10,000 /- introduced with provision to pay interest on credit balances. SyndicateBank in association with National Payment Corporation of India (NPCI) is issuing SyndicateBank RuPay Kisan Card to farmers who have availed Kisan credit card facility from the bank.
68 Achievements & New Initiatives Bank has commenced the distribution of Mutual Fund products of 9 Asset Management Companies at select branches. Bank has introduced Gold Loan Shoppe concept from April 2012 to facilitate quick and easy sanction of loans against Gold and has opened 109 Gold Loan Shoppe at select Branches. Bank has launched SyndicateBank VISA International Gold Debit Card. The GOLD Card provides customers with higher daily transactions limits with a daily limit of Rs.25,000/- for Cash withdrawal and Rs.50,000/- limit for use at Merchant Establishments. Bank offers Debit / Credit Card Swiping machines SYNDPOS for use at Merchant Establishments for accepting payments by customers through Credit / Debit / Pre-paid/ Charge card. Other than the conventional POS machines, Bank is also offering GPRS POS machine for wireless operations.
69 Customer Conveniences 69 SyndNavaratna Savings Account has been launched for improving its CASA base. The product caters well for the salaried class employed with MNCs/Blue chip companies/reputed private organizations/government and semi-government undertakings. E-Lounge facilities have commenced at our Bangalore HSR Layout branch. This is a Self Service Customer Kiosks with facilities for Passbook Printing, Cash Deposit and Cheque Deposit. Bank has opened a Business Process Management Centre at Bangalore for carrying out the Back Office functions of the Bank and for faster opening of accounts. On the occasion of its Foundation day, Bank has launched an online facility for remittances of donations by the customers towards the Prime Minister s National Relief Fund. Bank has designated totally 64 Branches as specialized MSME Branches to provide the focused thrust for growth of MSMEs, of which 9 new Branches are designated during Bank has entered tie-up arrangement with manufacturers for financing commercial vehicles with M/s Tata Motors, M/s TVS Motors, M/s Bajaj Auto, M/s Force Motors, M/s Maruthi, Hyundai and Piaggio.
70 Capital/ Fund Raising 70 Bank has raised USD 500 Million on 12 th October 2012 under MTN programme for funding requirement of London Branch at very competitive rates. The issue was oversubscribed by more than 5 times. Bank has plans to raise further MTN Bonds funds for London Branch during Bank has plans to raise Equity Capital during the current fiscal.
71 Mutual Fund and Insurance products Distribution 71 Bank has commenced the distribution of Mutual Fund products of 9 Asset Management Companies at select branches. Bank has approved the distribution of LIC Products and will start the delivery shortly. Bank is already having tie-up arrangement with M/s. United India Insurance Company for distribution of Non-Life Insurance Products.

72 Awards and Recognition Financial Inclusion: Based on a survey commissioned by Business Standard on the contribution of large public sector Banks towards Financial Inclusion, the Bank along with SBI has been awarded the Best Bank award for its contribution towards Financial Inclusion. SKOCH Foundation s Digital Inclusion Awards 2012: Gold award has been conferred to SyndicateBank at SKOCH Foundation s Digital Inclusion Awards 2012, for BCP and IT DR Project, the highest Independent honour in India, at a colourful function on 18/09/2012 at New Delhi A Certificate of Merit was also awarded to SyndicateBank for BCP & IT DR Project for being rated amongst the TOP 100 ICT projects in India during Self Help Groups: During the year , Bank was adjudged Best Performer among commercial banks operating in Karnataka by NABARD for its performance under the category of Highest Average Loan Size in relation to the SHG-Bank linkage programme. SyndRSETIs: our Manipal and Kumta RSETIs have been adjudged as the Country s best and Second Best RSETIs as on for imparting Training and encouraging the youth to take up Self-Employment ventures in order to mitigate the problem of unemployment/ under employment of educated youth in the rural / semi-urban areas in the country. Shri. Jairam Ramesh, Hon ble Minister for Rural Development, Govt of India has presented the awards at Vigyan Bhavan, New Delhi on
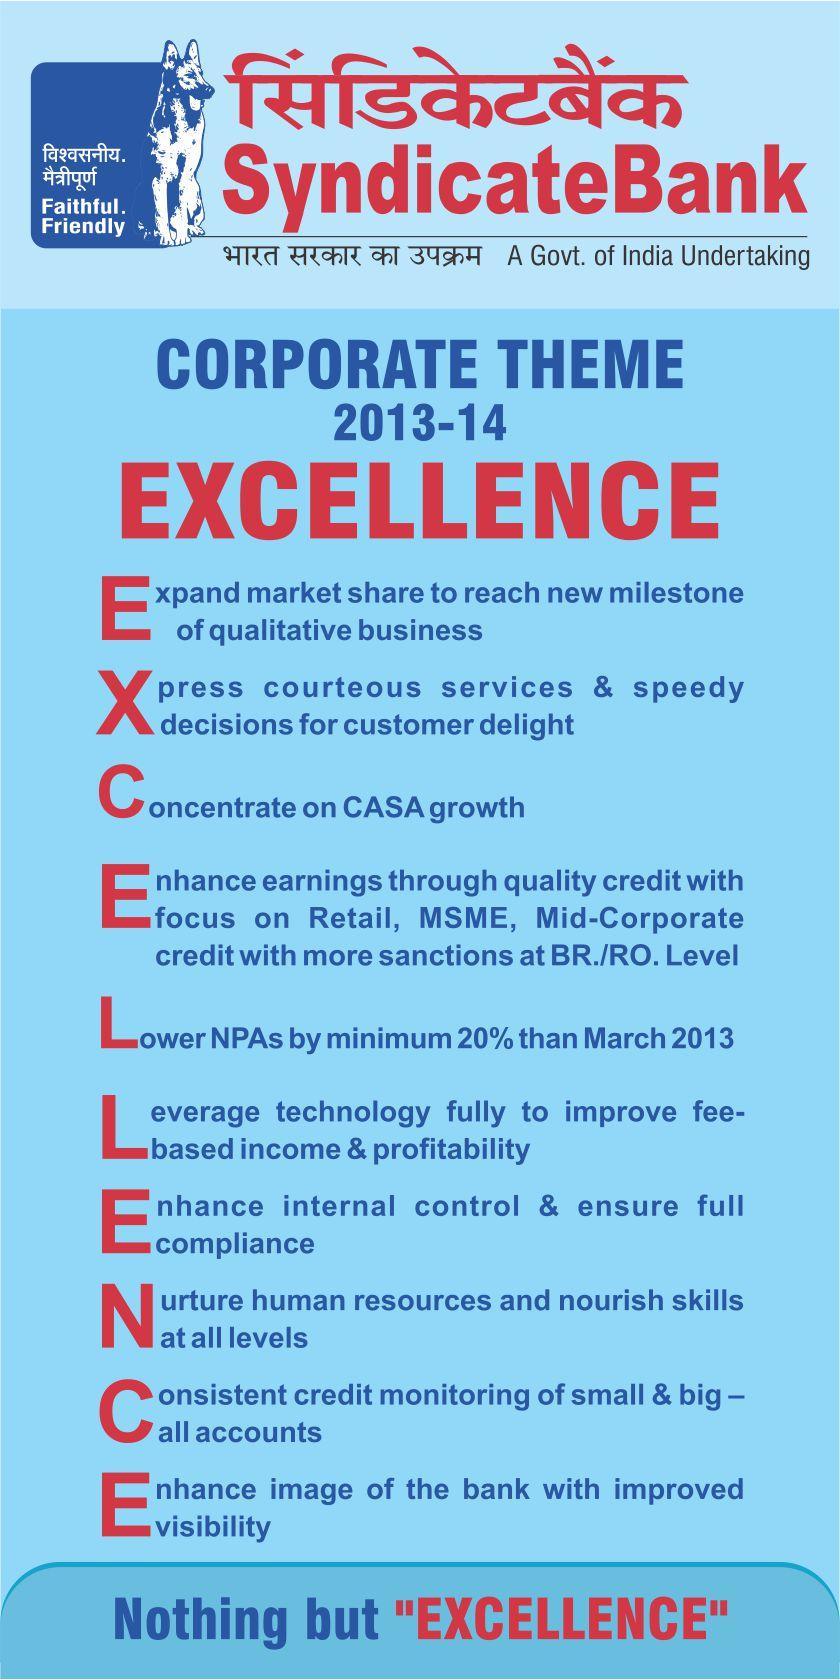
73 Road Ahead 73 Bank is targeting substantial business level of `4,19,000 crore by pursuing Excellence, nothing but Excellence and adopted the same as the Corporate Theme for
74 74

75 Priorities Ahead 75 Stabilization of Business Process Management Centre (BPMC), for facilitating the centralised Account Opening and extending the same to other centers. Stabilization of E-Lounge at our Bangalore HSR layout Branch and extending the same to other select centers. Establishment of HNI lounge in important centers to extend focused service to HNI customers. Strengthening Central Processing Centers (CPC) to drive housing Loans aggressively. Activating the MSME, MID Corporate branches to cater to the needs of borrowers of these segments. Reaching 3000 Branch Network by and the 3200 mark by December 2013.

76
Welcome to Analysts Meet
 PERFORMANCE HIGHLIGHTS For the Quarter Ended 30 th JUNE, 2013 Welcome to Analysts Meet 31 st July- 2013 Mumbai INDEX Sl. No. Slide Details Slide No. 1 Financial Highlights 4 2 Earnings Cross Section 5
Financial Results Q3/FY February 2019
 Financial Results Q3/FY18-19 08 February 2019 HIGHLIGHTS - DEC 2018 Total Business Total Deposit Gross Advance Operating Profit (Q-3) Rs. 291519 Crore Rs. 177906 Crore Rs.113610 Crore Rs. 381 Crore Basel
HIGHLIGHTS OF WORKING RESULTS
 1 HIGHLIGHTS OF WORKING RESULTS 2 Business Global Business at ` 4,67,626 Crore Savings Deposits grew by 23% (Y-o-Y) Income Non - Interest Income increased by 38% (Y-o-Y) Profit Advances Consistent and
Financial Results Q1 FY July 28, 2015
 Financial Results Q1 FY 2015-16 July 28, 2015 A Step Towards Digitalization 2 Performance Highlights Business Opex Profitability Global Business increased by 8.6% to ` 582817 crore Savings Deposits grew
INVESTOR PRESENTATION FEDERAL BANK
 INVESTOR PRESENTATION FY 2010-11 Fourth Quarter & Annual Results as on 31.03.2011 PERFORMANCE HIGHLIGHTS Q4 FY 11 FY 2011 (YOY growth) (YOY growth) Net Interest Income Fee Income Total Income Net Profit
Investor Presentation Q3 FY 12
 Investor Presentation Q3 FY 12 Performance Highlights Profitability Measure ROA 1.30 1.44 1.41 11.37 14.29 14.56 Shareholder Value Measure ROE 37.30 38.91 37.13 Efficiency Measure COST-INCOME 0.81 0.58
Analysts Meet. PERFORMANCE HIGHLIGHTS for the Financial Year ended 31st MARCH, Analysts Meet: 08/05/2014
 1 Analysts Meet PERFORMANCE HIGHLIGHTS for the Financial Year ended 31st MARCH, 2014 Analysts Meet: 08/05/2014 INDEX Sl. No. Slide Details Slide No. 1 Financial Highlights Quarterly 3 2 Interest Analysis
Financial Results Q2 & H1 FY November 06, 2015
 Financial Results Q2 & H1 FY 2015-16 November 06, 2015 Highest Gainer in Brand Value Brand value rises 72% on accelerated digitalization efforts. 2 Structural Transformation Initiative 3 Performance Highlights
154 years in service of the Nation and going strong
 Financial Results Q4 & Welcome Board of Directors 11 th May 2018 154 years in service of the Nation and going strong The Bank s Key Strengths Robust CASA Stable Operating Profit Young & energetic workforce
Capital Adequacy Ratio (Basel III) Earnings Per share, Book Value Per Share & Share Holdings Pattern
 Earnings Per share, Book Value Per Share & Share Holdings Pattern") 1 Sl. No. Areas of Presentation Slide No 1 Highlights 3 2 Business Cross Section 4 3 Domestic CASA 5 4 Domestic Advances 6 5 Retail Credit Components 7 6 Industry & NBFC Exposure 8 7 Restructured Advances,
1 Sl. No. Areas of Presentation Slide No 1 Highlights 3 2 Business Cross Section 4 3 Domestic CASA 5 4 Domestic Advances 6 5 Retail Credit Components 7 6 Industry & NBFC Exposure 8 7 Restructured Advances,
Q2 FY 12 INVESTOR PRESENTATION
 Q2 FY 12 INVESTOR PRESENTATION PERFORMANCE HIGHLIGHTS Profitability Measure ROA 1.34 1.15 1.44 11.48% 11.28% 14.29% Shareholder Value Measure ROE 38.60% 38.91% Efficiency Measure COST-INCOME 33.90% 0.68
Financial Results Q4 FY & FY May 13, 2016
 Financial Results Q4 FY 2015-16 & FY 2015-16 May 13, 2016 Table of Contents #1 Story of Transformation #2 Business Performance #3 Financials 2 Structural Transformation 3 Structural Transformation Medium
HIGHLIGHTS OF WORKING RESULTS
 1 HIGHLIGHTS OF WORKING RESULTS 2 Business Global Business at ` 4,96,122 Crore. Grew by 6% (Y-o-Y) Global Advances at ` 2,23,346 Crore. Grew by 8%(Y-o-Y) Income Net - Interest Income increased by 4% (Y-o-Y)
Q4 FY 13. Investor Information
 Q4 FY 13 Investor Information Key Messages : FY 13 Retail Advance grew by 25.47% (12.58%) SME Advance grew by 22.44% (9.49%) Retail & SME Customer base increased by 79.8% in 12 months (32.90%) Other Income
INVESTOR PRESENTATION FEDERAL BANK FY
 INVESTOR PRESENTATION FY 2010-11 Second Quarter Results as on 30.09.2010 PERFORMANCE HIGHLIGHTS (Q2 FY 2011 vs Q2 FY 2010) Net Interest Income up by 32.86 % from Rs.329.95 Cr to Rs.438.37 Cr Operating
Domestic Branch Network
 Domestic Branch Network RURAL SEMI-URBAN URBAN METRO 20% 19% 20% 41% Branches 2716 Rural-1105 S-Urban-553 Urban-551 Metro-507 3000 2500 2000 1500 Branches 2415 2259 2286 2716 2516 FY'09 FY'10 FY'11 FY'12
Growth Powered by Technology, Driven by Customers. Financial Results 31 st March 2017
 Financial Results 31 st March 2017 Performance Highlights Q4 FY 2016-17 NET INTEREST INCOME ` 989.49 cr NON INTEREST INCOME ` Rs.450.16 cr OPERATING PROFIT ` Rs.703.12 cr NET PROFIT ` 203.99 cr NET INTEREST
Global Business exceeds ` 3.34 lakh crore Net Profit for at ` 2004 crore up by 52.63% Customer Base exceeds 32 Million
 Corporate Office: Bangalore 02 May, 2013 PRESS RELEASE Global Business exceeds ` 3.34 lakh crore Net Profit for 2012-13 at ` 2004 crore up by 52.63% Customer Base exceeds 32 Million Major Highlights for
Investor Presentation
 FINANCIAL RESULTS FOR THE QUARTER & NINE-MONTH ENDED DEC 2013 Investor Presentation UCO BANK 1 BANKS OPERATING ENVIRONMENT Positives in Q3: Improving liquidity situation Ebbing stress on cost of funds
isyndicateb ank has W13? W37 i3v7sl'llnvestor Relations Centre m 30$?)- 351m:
- 351m:") 2"d aria: mm am, has 560009 351m: 080-22283030 amt: 080-22283030 m 30$?)- inrc@syndlicatebank.co.in fi- F: 5 _ ' \ isyndicateb ank SyndicateBank,Corporate Office 2" Cross, Gandhi Nagar, Bengaluru - 560009
2"d aria: mm am, has 560009 351m: 080-22283030 amt: 080-22283030 m 30$?)- inrc@syndlicatebank.co.in fi- F: 5 _ ' \ isyndicateb ank SyndicateBank,Corporate Office 2" Cross, Gandhi Nagar, Bengaluru - 560009
DF-3 Capital Adequacy- Qualitative Disclosure
 DF-3 Capital Adequacy- Qualitative Disclosure The Bank actively manages its capital requirement by taking in to account the current and future Business growth of the Bank. Stress tests are used as a part
DF-2 Capital Adequacy- Qualitative Disclosure
 DF-2 Capital Adequacy- Qualitative Disclosure A Premier Public Sector Bank The Bank actively manages it s capital requirement by taking in to account the current and future Business growth of the Bank.
Performance Highlights
 Presentation on Financial Performance for the Quarter/FY March 2015 1 Performance Highlights Top Line Milestones: Global Assets- Rs. 6.0 Lac Global Deposit- Rs. 5.0 Lac Saving Deposit- Rs. 1.5 Lac Overseas
Investor Presentation June-2014
 Investor Presentation June-2014 1 IMPORTANT NOTICE No representation or warranty, express or implied is made as to, and no reliance should be placed on, the fairness, accuracy, completeness or correctness
ANALYST S MEET. Performance Highlights For the Financial Year ended 31-March-2015
 ANALYST S MEET Performance Highlights For the Financial Year ended 31-March-2015 Sl. No. Areas of Presentation Slide No. 1 Highlights 3 2 Business Cross Section 4 3 Deposits 5 4 Domestic Advances 6 5 Infrastructure
 www.allahabadbank.in Business Mix Sl. No. Parameters Jun'15 Mar'16 Jun'16 Variation Q-o-Q Y-o-Y Jun'16 over Mar'16 Jun'16 over Jun'15 Amt. (%) Amt. (%) 1 Business 334548 358352 350848-7504 -2.09 16300
Investor Presentation March-2014
 Investor Presentation March-2014 1 IMPORTANT NOTICE No representation or warranty, express or implied is made as to, and no reliance should be placed on, the fairness, accuracy, completeness or correctness
The Bank that begins with. Financial Results Q-4 / FY ( )
") The Bank that begins with Financial Results Q-4 / FY (2014-15 ) Result at A Glance. Performance Parameter Rs. crore Ratio for 2014-15 (in %) Net Profit 256 Return on Assets 0.21% Operating Profit 2428
The Bank that begins with Financial Results Q-4 / FY (2014-15 ) Result at A Glance. Performance Parameter Rs. crore Ratio for 2014-15 (in %) Net Profit 256 Return on Assets 0.21% Operating Profit 2428
Financial Results. 31st March Reorienting towards retail business and recovery for a sustained path of growth and profitability.
 Get Instant Loan Approval!!! Financial Results 31st 2016 Get Instant Loan Approval!!! CANARA BANK MULTI CURRENCY TRAVEL PREPAID CARD Reorienting towards retail business and recovery for a sustained path
Investor Presentation Sept-2014
 Investor Presentation Sept-2014 1 IMPORTANT NOTICE No representation or warranty, express or implied is made as to, and no reliance should be placed on, the fairness, accuracy, completeness or correctness
 www.allahabadbank.in Business Mix Sl. No. Parameters Mar'15 Sep'15 Variation Q-o-Q Y-o-Y over Sep'15 over Amt. (%) Amt. (%) 1 Business 331196 346519 340101 344709 4608 1.35 13513 4.08 2 Deposit 184544
NET PROFIT (Q4) INCREASED BY 110% Y-O-Y TOTAL NUMBER OF BRANCHES CROSSED 2500 PROVISION COVERAGE RATIO IMPROVED TO 58.93
 INCREASED BY 110% Y-O-Y TOTAL NUMBER OF BRANCHES CROSSED 2500 PROVISION COVERAGE RATIO IMPROVED TO 58.93") 1 NET PROFIT (Q4) INCREASED BY 110% Y-O-Y NIM @ 3.00% FOR FY 2014-15 TOTAL NUMBER OF BRANCHES CROSSED 2500 PROVISION COVERAGE RATIO IMPROVED TO 58.93 CASA DEPOSITS CROSSED 27% NET NPAs BELOW 3% 2 BRANCH
1 NET PROFIT (Q4) INCREASED BY 110% Y-O-Y NIM @ 3.00% FOR FY 2014-15 TOTAL NUMBER OF BRANCHES CROSSED 2500 PROVISION COVERAGE RATIO IMPROVED TO 58.93 CASA DEPOSITS CROSSED 27% NET NPAs BELOW 3% 2 BRANCH
FOREWORD. Shri A.B. Chakraborty, Officer-in-charge, and Dr.Goutam Chatterjee, Adviser, provided guidance in bringing out the publication.
 FOREWORD The publication, Basic Statistical Returns of Scheduled Commercial Banks in India, provides granular data on a number of key parameters of banks. The information is collected from bank branches
Audited Financial Results. For Q / FY. March, 2015
 Audited Financial Results For Q / FY March, 2015 1 BUSINESS PROFILE 200000 150000 100000 50000 0 Advances Business Mar-13 Mar-14 Mar-15 Parameter Mar 13 Mar 14 Mar 15 Y-o-Y % Growth Gross Advances 66,457
Performance During Q4 : FY17-18 * ENABLING THE STAR TO SHINE *
 Performance During Q4 : FY17-18 * ENABLING THE STAR TO SHINE * PERFORMANCE AT A GLANCE Q4 FY18 Parameter Rs. Crore Y-o-Y (%) Growth Business 896,850-3.96 Total Deposits 520,854-3.55 Gross Advances 375,995-4.52
Additional Disclosures in terms of compliance of Basel II Requirements as stipulated by Reserve Bank of India Table DF-1
 Additional Disclosures in terms of compliance of Basel II Requirements as stipulated by Reserve Bank of India Table DF-1 1. Scope of application 1.1 Corporation Bank is the top bank in the group to which
FORM L-1-A : Revenue Account. FORM L-1-A : Revenue Account UP TO THE QUARTER ENDED ON JUNE Non Participating (Linked) Total
 Total") Insurer : DHFL Pramerica Insurance Company Limited Registration No. 140 ; Date of Registration with the IRDAI: June 27, 2008 Revenue Account For the quarter Ended June 30, 2017 FORM L-1-A : Revenue Account
Insurer : DHFL Pramerica Insurance Company Limited Registration No. 140 ; Date of Registration with the IRDAI: June 27, 2008 Revenue Account For the quarter Ended June 30, 2017 FORM L-1-A : Revenue Account
Post and Telecommunications
 Post and Telecommunications This section presents operating and financial data relating to the different branches of the Department of Posts including the Post Office Savings Banks. It comprises statistics
Page 1
 Page 1 HIGHLIGHTS MARCH 2015 Major HIghlights Net profit at 2703 crore, up by 10.8% y.o.y. Gross profit at 6950 crore, up by 2.3% y.o.y. Total provisions at 4248 crore compared to 4358 crore in FY14 Non-interest
PERIODIC DISCLOSURES FORM NL-1-A-REVENUE ACCOUNT TATA AIG GENERAL INSURANCE COMPANY LIMITED IRDAI Registration No. 108, dated January 22, 2001
 FORM NL-1-A-REVENUE ACCOUNT IRDAI Registration No. 18, dated January 22, 21 1 Premium earned (Net) NL-4- Premium Schedule 2 Profit/ Loss on sale/redemption of Investments Schedule REVENUE ACCOUNT FOR THE
Fire Marine Miscellaneous Total Fire Marine Miscellaneous Total 3,37,441 23,19,275 2,14,17,685 2,40,74,401 2,67,675 22,58,259 1,81,45,741 2,06,71,675
 FORM NL-1-B-RA Name of the Insurer: TATA AIG GENERAL INSURANCE COMPANY IRDA Registration No. 108, dated January 22, 2001 REVENUE ACCOUNT FOR THE YEAR ENDED Particulars Schedule For the YEAR ENDED For the
Content. Highlights. Financial Performance. Business Performance. Treasury Operations. Asset Quality. Capital. Digital Banking & Financial Inclusion
 Q2 FY 2019 Content Highlights Financial Performance Business Performance Treasury Operations Asset Quality Capital Digital Banking & Financial Inclusion 2 Highlights 3 Highlights for Quarter September
FINANCIAL HIGHLIGHTS FOR THE 1 ST QUARTER ENDED 30 TH JUNE 2018
 FINANCIAL HIGHLIGHTS FOR THE 1 ST QUARTER ENDED 30 TH JUNE 2018 PERFORMANCE HIGHLIGHTS- FY 20 Total Business of the Bank increased to Rs. 4,68,535 crore as at June 30, 2018 compared to Rs. 4,66,360 crore
Financial Results. 30th September Reorienting towards retail business and recovery for a sustained path of growth and profitability.
 Get Instant Loan Approval!!! Financial Results 30th September 2016 Get Instant Loan Approval!!! CANARA BANK MULTI CURRENCY TRAVEL PREPAID CARD Reorienting towards retail business and recovery for a sustained
Regional Rural Banks- Sustainability through Outreach. Amarendra Sahoo Chief General Manager RBI, Mumbai
 Regional Rural Banks- Sustainability through Outreach Amarendra Sahoo Chief General Manager RBI, Mumbai Scheme of Presentation I. RRBs mandate and to what extent fulfilled II. Perceived tension between
Financial Performance For the Quarter/ Nine Months Ended 31ST DEC. 2017
 Financial Performance For the Quarter/ Nine Months Ended 31ST DEC. 2017 12th FEBRUARY 2018 1 Corporation Bank was founded in the Year 1906 in Udupi a small town in South India Nationalized in the year
Business Delivery Channels. Branches Extension Counters ATMs Satellite Offices TOTAL
 1 Branch Mix METRO RURAL SEMI-URBAN URBAN Business Delivery Channels 31.12.2014 31.03.2015 31.12.2015 Branches 2287 2507 2748 27% 16% Extension Counters 9 8 4 ATMs 2156 2232 2323 Satellite Offices 35 35
Disclosures under Pillar 3 in terms of Guidelines on composition of Capital Disclosure Requirements of Reserve Bank of India as on 30 th June 2016
 Disclosures under Pillar 3 in terms of Guidelines on composition of Capital Disclosure Requirements of Reserve Bank of India as on 30 th June 2016 Table DF-2 : Capital Adequacy Quantitative disclosures:
Year Ended March 31, 2011
 FORM NL-1-B-RA Name of the Insurer: TATA AIG GENERAL INSURANCE COMPANY LIMITED IRDA Registration No. 108, dated January 22, 2001 REVENUE ACCOUNT FOR THE YEAR ENDED MARCH 31, 2011 Particulars Schedule Year
Disclosures under Pillar 3 in terms of New Capital Adequacy Framework (Basel III) of Reserve Bank of India as on 30 th June 2013
 of Reserve Bank of India as on 30 th June 2013") Disclosures under Pillar 3 in terms of New Capital Adequacy Framework (Basel III) of Reserve Bank of India as on 30 th June 2013 Table DF-2 : Capital Adequacy The Bank s Minimum Capital Requirement and
Disclosures under Pillar 3 in terms of New Capital Adequacy Framework (Basel III) of Reserve Bank of India as on 30 th June 2013 Table DF-2 : Capital Adequacy The Bank s Minimum Capital Requirement and
INVESTOR PRESENTATION MARCH 2012
 INVESTOR PRESENTATION MARCH 2012 South Indian Bank At A Glance 83 Years 700 663 `64136 Cr 27% 25% `401 Cr 3.10 % 14.00% 0.28% Number of years in banking business Number of branches Number of ATM s Business
FORM L-1-A : Revenue Account. FORM L-1-A : Revenue Account UP TO THE QUARTER ENDED ON JUNE Non Participating. (Linked) Individual
 Individual") Insurer : DHFL Pramerica Insurance Company Limited Registration No. 140 ; Date of Registration with the IRDAI: June 27, 2008 Revenue Account For the quarter Ended March 31, 2018 FORM L-1-A : Revenue Account
Insurer : DHFL Pramerica Insurance Company Limited Registration No. 140 ; Date of Registration with the IRDAI: June 27, 2008 Revenue Account For the quarter Ended March 31, 2018 FORM L-1-A : Revenue Account
Disclosures under Pillar 3 in terms of Guidelines on composition of Capital Disclosure Requirements of Reserve Bank of India as on 30 th June 2014
 Disclosures under Pillar 3 in terms of Guidelines on composition of Capital Disclosure Requirements of Reserve Bank of India as on 30 th June 2014 Table DF-2 : Capital Adequacy Qualitative disclosures:
FINANCIAL HIGHLIGHTS FOR THE QUARTER / NINE MONTHS ENDED
 FINANCIAL HIGHLIGHTS FOR THE QUARTER / NINE MONTHS ENDED 31 ST DECEMBER 2015 PERFORMANCE HIGHLIGHTS- / 20 Total Business of the Bank increased to Rs. 4,59,266 crore from Rs. 4,41,510 crore in December
Investor Presentation
 Investor Presentation 31.12.2016 Awards and Accolades IDRBT Award for the Best Bank Among Small Banks for Digital Banking, 2015-16 on 18.07.2016 IDRBT Award for the Best Bank Among Small Banks for Managing
FINANCIAL RESULTS HY 1 / Q2 FY 18
 1 FINANCIAL RESULTS HY 1 / Q2 FY 18 2 EMERGING ECONOMIC & BANKING SCENARIO Domestic Economy Reset in New Normal Govt s Mega Recapitalization Plan Improved Economic Macros Credit Growth shows green shoots
Analyzing Data of Pradhan Mantri Jan Dhan Yojana
 Technical Report 217 Analyzing Data of Pradhan Mantri Jan Dhan Yojana Tulika Dutta and Ashish Das Department of Mathematics Indian Institute of Technology Bombay Mumbai-476, India May 217 Indian Institute
Note on ICP-CPI Synergies: an Indian Perspective and Experience
 2 nd Meeting of the Country Operational Guidelines Task Force March 12, 2018 World Bank, Washington, DC Note on ICP-CPI Synergies: an Indian Perspective and Experience 1. Meaning and Scope 1.1 International
INVESTOR PRESENTATION DEC 2011
 INVESTOR PRESENTATION DEC 2011 South Indian Bank At A Glance 83 Years 674 614 `58884 Cr 27% 25% `280 Cr `102 Cr 3.05 % 12.03% 0.24% Number of years in banking business Number of branches Number of ATM
The Bank that begins with. Financial Results Q3 ( )
") The Bank that begins with Financial Results Q3 (2013-14 ) HIGHLIGHTS 31.12.2013. Total Business at Rs.188867 crore, with a y-o-y growth of 19.78%. Highlights Total Deposits increased to Rs.109891 crore,
The Bank that begins with Financial Results Q3 (2013-14 ) HIGHLIGHTS 31.12.2013. Total Business at Rs.188867 crore, with a y-o-y growth of 19.78%. Highlights Total Deposits increased to Rs.109891 crore,
Dr. Najmi Shabbir Lecturer Shia P.G. College, Lucknow
 Banking Development after Nationalization and Social Control in India (1967 To 1991) Dr. Najmi Shabbir Lecturer Shia P.G. College, Lucknow Abstract: This paper mainly analyses the impact of Nationalisation
Total Business Gross Advances Total Deposits 12.05% 9.91% 13.82% NIM CASA. CRAR Basel III 2.59% 11.20% 12.52%
 1 Total Business Gross Advances Total Deposits 12.05% 9.91% 13.82% CASA NIM CRAR Basel III 12.52% 2.59% 11.20% 2 PARTICULARS 31.03.2015 31.03.2016 No. of Share % Holding No. of Share % Holding Govt of
PRESS RELEASE. Performance driven Progress
 CORPORATE OFFICE: GANDHINAGAR BANGALORE PRESS RELEASE 30.07.2012 SyndicateBank Announces its Financial Results for the quarter ended 30 th June 2012 Performance driven Progress (Q 1 of 2012 vis a vis Q
Investor Presentation Q2 FY November 2017
 Investor Presentation Q2 FY 2017-18 November 2017 Disclaimer 2 This presentation is confidential and may not be copied, published, distributed or transmitted. The information in this presentation is being
FINANCIAL HIGHLIGHTS FOR THE QUARTER ENDED
 FINANCIAL HIGHLIGHTS FOR THE QUARTER ENDED 30 th JUNE 2015 PERFORMANCE HIGHLIGHTS- FY 20 Total Business of the Bank increased to Rs. 4,51,739 crore from Rs. 4,26,829 crore in June 2014, recording Y-o-Y
JOINT STOCK COMPANIES
 This section contains statistics relating to joint stock companies which are based on returns received from Registrars of Joint Stock Companies. Tables 25.1 (A) (B) to 25.4 These tables present data regarding
REPORT ON THE WORKING OF THE MATERNITY BENEFIT ACT, 1961 FOR THE YEAR 2010
 REPORT ON THE WORKING OF THE MATERNITY BENEFIT ACT, 1961 FOR THE YEAR 2010 1. Scope and Objective 1.1 The Maternity Benefit Act, 1961 extends to the whole of the Indian Union and applies to every factory,
FINANCIAL HIGHLIGHTS FOR THE QUARTER / NINE MONTHS ENDED
 FINANCIAL HIGHLIGHTS FOR THE QUARTER / NINE MONTHS ENDED 31 ST DECEMBER 2014 PERFORMANCE HIGHLIGHTS- / 20 Total Business of the Bank increased to Rs. 4,41,510 crore from Rs. 4,12,164 crore in December
IRDA Public Disclosures
 IRDA Public Disclosures QUARTER ENDED 31st DEC 2018 Aviva Life Insurance Company India Limited S. No. Form No. Description Page No. 1 L-1 REVENUE ACCOUNT 1-2 2 L-2 PROFIT & LOSS ACCOUNT 3 3 L-3 BALANCE
IRDA Public Disclosures
 IRDA Public Disclosures QUARTER ENDED 31st MARCH 2018 Aviva Life Insurance Company India Limited S. No. Form No. Description Page No. 1 L-1 REVENUE ACCOUNT 1-2 2 L-2 PROFIT & LOSS ACCOUNT 3 3 L-3 BALANCE
International Journal for Research in Applied Science & Engineering Technology (IJRASET) Status of Urban Co-Operative Banks in India
 Status of Urban Co-Operative Banks in India") Status of Urban Co-Operative Banks in India Siddhartha S Vishwam 1, Dr. B. S. Chandrashekar 2 1 Research Scholar, DOS in Economics and Co-operation, University of Mysore, Manasagangothri, Mysore 2 Assistant
Status of Urban Co-Operative Banks in India Siddhartha S Vishwam 1, Dr. B. S. Chandrashekar 2 1 Research Scholar, DOS in Economics and Co-operation, University of Mysore, Manasagangothri, Mysore 2 Assistant
Un-Audited/ Reviewed Financial Results For the Quarter ended June 30,2018
 Un-Audited/ Reviewed Financial Results For the Quarter ended June 30,2018 1 BUSINESS PROFILE 200000 150000 100000 50000 0 Advances Deposit Business June-17 March-18 June-18 Parameter June 17 Mar 18 June
Disclosures under Pillar 3 in terms of Guidelines on composition of Capital Disclosure Requirements of Reserve Bank of India as on 30 th June 2018
 Disclosures under Pillar 3 in terms of Guidelines on composition of Capital Disclosure Requirements of Reserve Bank of India as on 30 th June 2018 Table DF-2 : Capital Adequacy Quantitative disclosures:
Highlights. Core Deposits stood at Rs.1,33,672 cr. as at the end of Sept,16 showing growth of 10.53% Y-o-Y basis
 Highlights Total Business stood at Rs. 3,44,428 cr. as at the end of Sept 16 against Rs.3,27,807 cr. as on Jun 16.(Increase by Rs.16,621 cr. over the qrt.) Global Deposits stood at Rs. 2,09,485 cr. as
The Bank that begins with Financial Results Q3 & 9-Months
 The Bank that begins with Financial Results Q3 & 9-Months 2011-12 Tele-Conference with Analysts February 7 th, 2012; 3.30 P.M. Performance Highlights Dec - 2010 Dec - 011 Percent 141915 Total Business
Eligible students have to contact our branches where they have availed/availing loans.
 Eligible students have to contact our branches where they have availed/availing loans. The last date for Banks to submit subsidy claims to Nodal Bank is 31.08.2014. Hence, we advise the students to submit
IRDA Public Disclosures
 IRDA Public Disclosures QUARTER ENDED 31st DECEMBER 2016 Aviva Life Insurance Company India Limited S. No. Form No. Description Page No. 1 L-1 REVENUE ACCOUNT 1-2 2 L-2 PROFIT & LOSS ACCOUNT 3 3 L-3 BALANCE
Table DF-2: Capital Adequacy
 ANDHRA BANK ( A Govt. of India Undertaking) Disclosures under Basel III Capital Regulations (Pillar III) as on 30.06.2018 Table DF-2: Capital Adequacy Qualitative disclosures: A summary discussion of the
INVESTOR PRESENTATION
 INVESTOR PRESENTATION 1 South Indian Bank At A Glance 83 Years 644 568 `56386 Cr 31% 25% `177 Cr `95 Cr 3% 13.48% 0.25% Number of years in banking business Number of branches Number of ATM s Business as
IIP growth (%) Rates FY CPI(YoY) in % Repo Reverse Repo MSF Call Money(Daily movement) A p r.
 Rates FY CPI(YoY) in % Repo Reverse Repo MSF Call Money(Daily movement) A p r.") 2 Rates FY13-14 Repo Reverse Repo MSF Call Money(Daily movement) 13.5 12.5 11.5 10.5 9.5 8.5 7.5 6.5 5.5 A p r M a y J u n J u l A u g S e p O c t N o v D e c J a n F e b M a r IIP growth (%) 3.5 2.6 2.7
2 Rates FY13-14 Repo Reverse Repo MSF Call Money(Daily movement) 13.5 12.5 11.5 10.5 9.5 8.5 7.5 6.5 5.5 A p r M a y J u n J u l A u g S e p O c t N o v D e c J a n F e b M a r IIP growth (%) 3.5 2.6 2.7
Financial Results Q4-10 & FY Analyst Presentation
 Financial Results Q4-10 & FY 2010 Analyst Presentation 6th May, 2010 HIGHLIGHTS OF BUSINESS GROWTH Total Business increased from Rs.236968 Cr. to Rs.291289 Cr. an increase of 22.92% Total Deposits registered
Disclosures -NON LIFE INSURANCE COMPANIES
 Disclosures -NON LIFE INSURANCE COMPANIES Sr No Form No Description 1 NL-1-B-RA Revenue Account 2 NL-2-B-PL Profit & Loss Account 3 NL-3-B-BS Balance Sheet 4 NL-4-PREMIUM SCHEDULE Premium 5 NL-5-CLAIMS
POPULATION PROJECTIONS Figures Maps Tables/Statements Notes
 8 POPULATION PROJECTIONS Figures Maps Tables/Statements 8 Population projections It is of interest to examine the variation of the Provisional Population Totals of Census 2011 with the figures projected
Financial Results. Q3 FY15 & Nine-months ended December th January 2015
 Financial Results Q3 FY15 & Nine-months ended December 27 th January 2015 1 Highlights Capital CRAR (Basel III) at 10.30%; CET 1: 7.02% Margin Domestic NIM stable at 2.6% Fee Income Core Fee Income up
Audited Quarterly & Full-Year Results March 31, 2015
 Earnings Update Audited Quarterly & Full-Year Results March 31, 2015 The Board of Directors of The Jammu & Kashmir Bank Ltd. at their meeting held on May 16, 2015 took on record the Audited Financial Results
Performance Analysis:
 Performance Analysis: Q3 FY 2016 (April December 2015) February 13, 2016 2016 Bank of Baroda. All Rights Reserved 1 Bank of Baroda: Our Key Strengths Bank of Baroda is a 107 years old State-owned Bank
FINANCIAL HIGHLIGHTS FOR THE 4 TH QUARTER & FINANCIAL YEAR ENDED 31 ST MARCH 2018
 FINANCIAL HIGHLIGHTS FOR THE 4 TH QUARTER & FINANCIAL YEAR ENDED 31 ST MARCH 2018 PERFORMANCE HIGHLIGHTS- & 20 Total Business of the Bank improved to Rs. 4,72,323 crore in March 31, 2018 as against Rs.
Financial Results for Quarter/ Financial Year ended 31 st March 2018 SMALL STEPS TOWARDS BIG CHANGE
 Financial Results for Quarter/ Financial Year ended 31 st March 2018 SMALL STEPS TOWARDS BIG CHANGE Performance Highlights Assets, Liabilities & Business Overview Loans & Advances Asset Quality Investments
ROLE OF PRIVATE SECTOR BANKS FOR FINANCIAL INCLUSION
 270 ROLE OF PRIVATE SECTOR BANKS FOR FINANCIAL INCLUSION ABSTRACT DR. BIMAL ANJUM*; RAJESHTIWARI** *Professor and Head, Department of Business Administration, RIMT-IET, Mandi Gobindgarh, Punjab. **Assistant
FINANCIAL RESULTS Q1 FY 18
 1 FINANCIAL RESULTS Q1 FY 18 2 EMERGING ECONOMIC & BANKING SCENARIO Strengthening of NPA Resolution Process Strong Macro Economic Environment Good Monsoon Improves Rural Business Growth Outlook Re-emergence
THE BANKER TO EVERY INDIAN. Annual Results FY
 THE BANKER TO EVERY INDIAN Annual Results FY 2011-12 Healthy Growth in NII and Operating Profit - a Snapshot (1/2) Rs. In Crores Q4 FY11 Q4 FY12 Gr.% FY11 FY12 Gr.% Interest Income 21721 28583 31.59 Interest
Financial Highlights FY
 Financial Highlights FY 2014-15 Corporation Bank was founded in the Year 1906 in Udupi a small town in South India Nationalized in the year 1980 and went public in 1998 The Bank holds a unique record of
State Government Borrowing: April September 2015
 November 5, 2015 Economics State Government Borrowing: April September 2015 State Development Loans (SDL) are debt issued by state governments to fund their fiscal deficit. States in India like the centre,
XVII. STATUTORY FINANCIAL CORPORATIONS. TABLE 17.1 INDUSTRIAL FINANCE CORPORATION OF INDIA LTD. FINANCIAL ASSISTANCE TO INDUSTRIES (Rs.
 XVII. STATUTORY FINANCIAL CORPORATIONS TABLE 17.1 INDUSTRIAL FINANCE CORPORATION OF INDIA LTD. FINANCIAL ASSISTANCE TO INDUSTRIES (Rs.crore) Sanctions for Cumulative sanctions the period as on Industry
AN EVALUATION OF FINANCIAL INCLUSION
 AN EVALUATION OF FINANCIAL INCLUSION 1 2 3 Mary Sunita Dutto, Namratha R D, Dr. R. Himachalapathy 1 Research Scholar, St. Joseph's College of Commerce, Bangalore 2 Research Scholar, St. Joseph's College
IRDA Public Disclosures
 IRDA Public Disclosures QUARTER ENDED 31st MARCH 2017 Aviva Life Insurance Company India Limited S. No. Form No. Description Page No. 1 L-1 REVENUE ACCOUNT 1-2 2 L-2 PROFIT & LOSS ACCOUNT 3 3 L-3 BALANCE
EXPORT OF GOODS AND SOFTWARE REALISATION AND REPATRIATION OF EXPORT PROCEEDS LIBERALISATION
 Corporate Law Alert J. Sagar Associates advocates and solicitors Vol.16 April 30, 2011 RBI EXPORT OF GOODS AND SOFTWARE REALISATION AND REPATRIATION OF EXPORT PROCEEDS LIBERALISATION The Reserve Bank of
GOVERNMENT OF INDIA MINISTRY OF AGRICULTURE AND FARMERS WELFARE DEPARTMENT OF AGRICULTURE, COOPERATION AND FARMERS WELFARE
 GOVERNMENT OF INDIA MINISTRY OF AGRICULTURE AND FARMERS WELFARE DEPARTMENT OF AGRICULTURE, COOPERATION AND FARMERS WELFARE 425 SHRI VENKATESH BABU T.G.: SHRI KESHAV PRASAD MAURYA: DR. A. SAMPATH: ADV.
CENTRAL BANK OF INDIA FINANCIAL HIGHLIGHTS FOR THE HALF YEAR
 CENTRAL BANK OF INDIA FINANCIAL HIGHLIGHTS FOR THE HALF YEAR ENDED SEPTEMBER 2011 30 th Performance Highlights Sept 2011-12(` in crore) Parameters Q2FY2012 Q2FY2011 YOY Growth (%) FY2011 Total Business
For Q4 FY 09, Net Profit for Q4 FY 09 increased to Rs 2,742 crores, up by 45.62% as compared to Rs 1,883 crore in Q4 FY 08.
 Press Release FY 09 Results SBI net profit crosses Rs. 9100 crores For FY 09, Net Profit for FY 09 increased to Rs 9,121 crores up by 35.5% as compared to Rs 6,729 crore in FY 08. For Q4 FY 09, Net Profit