COUNCIL STAFF REPORT. City Council Members. FROM: Jennifer Bruno, Deputy Director Sean Murphy, Policy Analyst
|
|
|
- Gervais Hill
- 5 years ago
- Views:
Transcription

1 COUNCIL STAFF REPORT CITY COUNCIL of SALT LAKE CITY TO: City Council Members FROM: Jennifer Bruno, Deputy Director Sean Murphy, Policy Analyst DATE: January 30, 2014 at 3:23 PM RE: IMPACT FEE REVISIONS PROJECT TIMELINE: Briefing: 2/4/14 Set Date: TBD Public Hearing: TBD Potential Action: TBD Council Sponsor: Council Member Stan Penfold ISSUE AT-A-GLANCE The Administration is proposing that the Council consider adopting an ordinance to reduce the City s impact fees. The Administration s proposal has a few components: 1. Reduce the parks impact fee this year, with the intention (codified by the proposed ordinance), that this fee is automatically increased each year, in order to eventually charge the full (current) fee. 2. Only charge road fees on the west side, since all of the road projects on the plan are on the West Side (staff note: West Side charge only is how the City structured these fees prior to the 2013 change in fees see policy questions #2). 3. Update the consolidated fee schedule to reflect the Mayor s proposed fees as well as establish fees for appeals of the City s impact fee ($50 per appeal. $150 for independent calculation). The Administration indicates they are making this recommendation based on development community feedback, not necessarily because Salt Lake City s fees are higher than other comparable cities. The attached benchmarking analysis shows that the City s fees are consistent with, or in many cases, less than those of municipalities outside the state. The City s fees are also consistent with, or in some cases, less than fees in other Utah municipalities. The Council may wish to note that much like comparing property tax rates, comparing impact fees between Cities may not be entirely relevant. What is considered a baseline level of service in one community may not be a baseline level of service in another community. Because impact fees are set up by statute to achieve this baseline level, comparing two places that have different standards may not be a fair comparison. Nonetheless, the Administration has prepared this analysis (attached to this report). Goal of the briefing: The goal of the briefing is to gauge Council support for the various aspects of the Administration s proposal. Depending on the Council s decisions, additional public process in the form of hiring an impact fee consultant to revise the Capital Facilities Plan, and/or public hearings, would be necessary. Staff has identified the following options: CITY COUNCIL OF SALT LAKE CITY 451 SOUTH STATE STREET, ROOM 304 P.O. BOX , SALT LAKE CITY, UTAH COUNCIL.SLCGOV.COM TEL FAX KYLE LAMALFA DISTRICT 2 COUNCIL CHAIR JILL REMINGTON LOVE DISTRICT 5 COUNCIL VICE CHAIR CARLTON CHRISTENSEN DISTRICT 1 STAN PENFOLD DISTRICT 3 LUKE GARROTT DISTRICT 4 CHARLIE LUKE DISTRICT 6 SØREN SIMONSEN DISTRICT 7
2 1. Accept the Administration s proposal and adopt the proposed ordinance, lowering the fees. o Because the fees will not be sufficient to fund all projects identified in the plan, the Council may wish to reconsider the plan to prioritize projects for funding. (The projects in the plan were not put in priority order and the total dollar amount for the proposed projects did not equal the projected funding available, so reducing the fee and lowering the over-all revenue available exacerbates a problem that previously needed further attention.) 2. Open up the 10 Year Plan for discussion again, and retain the City s impact fee consultant to do a revised fee schedule based on the revised plan. o It has been suggested by Council Members in the past that it makes sense to review the plan every 2 years, perhaps coinciding with election schedules. The last time the plan was reviewed was o This would mean that the current fees would stand as is until the plan is revised and new fees are adopted, unless the Council were to adopt an interim fee schedule (based on the current 10 year plan, but recognizing that the plan would be further out-of-balance with projected funding). 3. Keep the fees as they are, and ask the Administration to consider how to more effectively maximize the use of impact fees for the FY 2015 CIP cycle, so that the development community can more immediately see the benefit of the fees they are paying. o If the Council desires to keep fees as is, then the impact fee ordinance still needs to be clarified with regard to the collection of roadway fees. Currently there is a disconnect between the Council s intent (which was to collect fees City wide), and the existing ordinance (which states that roadway fees are only to be collected in the West Side industrial area). POLICY QUESTIONS 1. The Administration s transmittal acknowledges that this proposal would result in projects not being fully funded as outlined in the current plan. However there is no recommendation of prioritization (which projects don t get funded). Does the Council wish to re-visit the Capital Facilities Plan in order to prioritize? Without prioritization, there could be an impression left with developers and the public that there is a possibility that all of the projects could be completed. 2. If the Council accepts the Administration s recommendation and only charges road fees to west side industrial area development, then the amount collected would not be enough to fund the projects identified on the list. Additionally, projects that are city-wide such as bike lanes, pedestrian safety devices, and new traffic signals, would be limited to that area, instead of City wide. Does the Council wish to re-visit the plan in order to prioritize? Or would the Council want to increase fees for roads on the west side in order to fully fund the projects listed on the plan? Does the Council wish to further discuss whether there is a need for impact fees to be applied to city-wide growthrelated projects such as bike lanes, pedestrian safety devices, etc.? 3. The Council is consistently looking for funding tools other than the City s general fund to enable the City to build and provide the amenities that SLC residents and business have come to expect as a base level of service. Impact fees are one of the most direct ways for growth to, in essence pay for itself. To the extent that the Council doesn t fully charge the eligible impact fees, other sources (such as the general fund) will have to make up the funding for these projects, or the projects themselves will need to be eliminated or reduced. Does the Council wish to discuss the policy of using impact fees as a funding Page 2
3 tool? Note: Impact fees cannot pay for the maintenance of these new facilities. That must be accommodated in the general fund budget. 4. The Council may wish to ask the Administration how it assesses whether a CIP request is eligible for impact fees, and whether this aspect of the budget is being utilized to its fullest extent each budget cycle. ADDITIONAL & BACKGROUND INFORMATION Staff has prepared a very basic review of Impact Fees for the Council s reference (see attached power point presentation), and is happy to go into further detail on the topic of impact fees in general. Staff has also attached the Impact Fee Quick Guide, which is a review of current Impact Fee-eligible projects (the projects identified that determine the level of impact fee), as well as the current amount of impact fees in each account. Staff has gathered data where available, in order to assess how Impact Fees might affect other economic factors, such as home sale price, and office lease rates. The Council should note that this is very basic research with information that is free and available. More extensive research will require the purchase of data and additional staff time. The charts below illustrate that Salt Lake City fees are average within Utah, when compared to home sales price and commercial office lease rates for cities within Utah, and that Salt Lake City fees are lower than average, when compared to homes sales price and commercial office lease rates elsewhere. Housing Impact Fee (per unit) Home Prices* (detached, single family) Fee as a % of home price Utah Cities SLC $4,583 $307, % Park City $4,775 $922, % Layton $4,773 $234, % Sandy $4,538 $328, % Provo $4,074 $279, % Tooele $3,990 $175, % Average Utah Cities $4,456 $374, % Other Western Region Markets Salem, OR $5,50223, % Spokane, WA $5,50203, % Phoenix, AZ $5,334 $273, % Glendale, AZ $4,036 $232, % Fresno, CA $4,56272, % Average Other Markets $4,987 $241, % *Source: Onboard Informatics, Housing Price by City Houses and Residents, all cities and states, referenced January 29, 2014 ( Page 3
4 Commercial/Office Note: this analysis only includes markets where Council Staff was able to obtain commercial lease rates from local real estate brokerages. Impact Fee (per office square foot) Office Lease Rate * (Class A, per square foot ) Fee as a % of Office lease rate City Utah Cities SLC- Downtown $2.68 $ % Notes South Jordan $2.94 $ % Sandy/Southtowne submarket Layton $2.66 $ % not officially tracked - $18-20 Draper $2.58 $ % Draper submarket West Jordan $1.75 $ % Sandy / Southtowne submarket West Valley City $1.44 $ % W Valley submarket Average Utah Cities $2.34 $ % Other Western Region Markets Albuquerque - Downtown $3.50 $ % Glendale $2.92 $ % W/NW Phoenix submarket Average Other Markets $ % *Source: CBRE, Local Market Real Estate Reports Quarter 3, all cities, referenced January 29, 2014 ( Staff is also attempting to, in a more complete way, compare the true cost of development, and showing how different impact fees might affect a development pro forma. Staff will have this completed in time for the Council s next discussion on this topic. ATTACHMENTS 1. Impact Fees Impact Fee Quick Guide 3. Benchmarking study of current Salt Lake City Impact Fees 4. Most recent impact fee study (April 2012) report from the City s impact fee consultant a detailed explanation of the process for how Salt Lake City s fees are calculated Page 4
5 Impact Fees 101 B A S I C I N T R O D U C T I O N T O I M P A C T F E E S F O R C O U N C I L M E M B E R S
6 What are Impact Fees? a one-time charge imposed by the City to help fund the cost of providing infrastructure to new development Can only be used to fund the expansion component of what is required to provide the same level of service as is being provided to the current city. Can only be spent on projects that they were originally identified for in the City s adopted 10 Year Plan.
7 How are impact fees calculated? Administration/Council decides what projects are needed to service the new development coming to the City. City hires an impact fee consultant, who determines which portions of those projects might be attributable to growth, and which portions are needed for the existing population. City s consultant also verifies the expected growth in the next 10 years (square feet of office/commercial, number of residential units, etc).


8 How are impact fees calculated? The City s consultant then uses this formula: Cost of projects needed for growth Number of units of growth (or square feet) Impact Fee per unit Helps growth to pay for itself - except maintenance
9 Impact Fee Process Departments submit projects to Admin for consideration for the 10 year plan Consultant narrows down the plan with Admin to identify projects that could be funded, and identifies which projects qualify for impact fees Administration transmits 10 year plan, with impact fees identified, to Council for adoption Council makes changes to 10 year plan, if need be, and impact fees are recalculated by the City s impact fee consultant Fees are adopted by Council Fees are collected incrementally as development happens Fees are allocated by the Council during the annual CIP process.
10 Types of Projects Fee type Current Project Examples Parks Police Additional park space, Jordan/Salt Lake Canal, Restroom Improvements, Off-leash dog parks, Open Space & Trails Master Plan Evidence and Crime Lab Facility Fire Roads Fire Station #3 (Sugar House) land acquisition and construction; Fire Station #14 (including truck) 500/700 South to 5600 West, Indiana Ave Redwood Rd to 3600 West; 4400 West 700 South to 850 South; Pedestrian Safety Devices, Bike Lane improvements citywide, new traffic signals
11 Impact Fee Components Fee type Parks Fee Police Fee Fire Fee Roadway Fee Fee charged to: New residential only All All All Notes: Only new residential pays the parks impact fee Roadway fees are assessed throughout the City now, although the Administration is proposing to assess these fees only in the Westside industrial area, since this is where the projects are located (the City used to structure it this way prior to 2013).
12 Current SLC Impact Fees Single Family Residential (per unit) Multi- Family Residential (per unit) Retail (per square foot) Office (per square foot) Industrial (per square foot) Parks Fee $3, $3, $0 $0 $0 Police Fee $41.00 $41.00 $0.03 $0.03 $0.03 Fire Fee $ $ $0.32 $0.32 $0.32 Roads Fee $ $ $3.28 $2.33 $2.26 Total Fee $4, $4, $3.63 $2.68 $2.61
13 Impact Fee Quick Guide Guidelines: Fire Impact fees are to be used to keep a current level of service in areas of new growth Cannot be used to cure deficiencies serving existing development May not raise the established level of service in existing development Cannot include an expense for overhead, such as any cost for operation and maintenance Must consider all revenue sources Must be incurred or encumbered within 6 years from the date they are collected Must use the Impact Fees Facilities Plan (10-Year Plan) to determine the public facilities needed to serve new growth Repair and replacement projects are not growth related Upgrade projects are not growth related Repair, replacement, or upgrades can be included as part of a mixed project where the scope will create capacity to serve projected growth Growth is expected to pay only the portion of the cost of capital facilities that are related to growth Total amount of impact fees available as of June 30, 2013: $4,947,022 Total amount of impact fees that must be spent before end of the year: $311,086 Eligible projects: Fire Station #3 (Sugar House) Land Acquisition 33% Fire Station #3 Construction 33% Fire Station #14 33% Fire Station #14 Truck 100% Impact Fee Study 100% Standard of Cover Study 50% Police Total amount of impact fees available as of June 30, 2013: $3,137,790 Total amount of impact fees that must be spent before end of the year: $-0- Eligible projects: Evidence and Crime Lab Facility 25% Impact Fee Study 100% Prepared September 2013
14 Parks Total amount of impact fees available as of June 30, 2013: $1,900,987 Total amount of impact fees that must be spent before end of the year: $233,508 Eligible projects: Additional acres of parks 100% Additional acres of open space 100% (Non growth related open space acquisition is not eligible) Jordan and Salt Lake Canal Shared Use Pathway 10% City Creek Trail 10% Restroom improvements 11% Jogging/walking path improvements 3% Plaza improvements 4% Off-leash dog parks 3% BMX/bike park improvements 5% Impact Fee study 100% Parks, Open Space, Trails Master Plan 5% Jordan River Master Plan 5% Foothills Recreation and Management Plan 5% Streets and Transportation Total amount of impact fees available as of June 30, 2013: $8,330,937 Total amount of impact fees that must be spent before end of the year: $-0- Eligible projects: 500/700 South 2800 West to 5600 West 57% Indiana Avenue/900 South from Redwood 57% to 3600 West Gladiola Street 1650 South to 2100 South 57% 4400 West from 700 South to 850 South 57% Pedestrian safety devices 10% Bike lane/pedestrian improvements citywide 10% New traffic signals 100% Impact Fee Study 100% Transportation Master Plan 10% Prepared September 2013
15 Attachment A Comparison of Impact Fees to Other Municipalities
16 Roads Impact Fees single family multi family retail/sf office/sf industrial/sf Salt Lake City - current $ 8.62 $ 4.20 $ 2.00 Salt Lake City mayor fee $ 450 $ 264 $ $ 2.01 Salt Lake City - council adopted fee $ 424 $ 249 $ 3.28 $ National Average Sample Size $ 3,227 $ 2,179 $ 5.95 $ 3.36 $ 2.06 Western States 1 Sample Size Arizona 30 $ 2,630 $ 1,818 $ 4.40 $ California 37 $ 6,499 $ 4,322 $ $ 6.76 $ 3.96 Colorado 17 $ 2,69 1,897 $ $ 1.93 Idaho 3,456 $ 1,950 $ 8.86 $ 9.28 $ 2.13 Montana 3,432 $ 2,124 $ 5.93 $ 1.96 $ 1.46 New Mexico 8 $ 2,932 $ 1,815 $ 3.80 $ 3.18 $ 2.32 Nevada 5 $ 2,15 1,676 $ $ 1.48 Oregon 1 3,573 $ 2,482 $ 7.90 $ 4.23 $ 2.88 Utah 18 $ 1,140 $ 1,073 $ 2.03 $ 1.04 $ 0.63 Washington 15 $ 1,889 $ 1,198 $ 4.72 $ 3.26 $ 2.15 average $ 3,039 $ 2,036 $ 6.24 $ 3.69 $ $ 2.26 Western Capital Cities Population Phoenix AZ 1,445,632 $ 650 $ 449 $ 0.99 $ 0.68 $ 0.41 Sacramento CA 486,189 $ 4,65 3, $ 2.16 Boise ID 211,720 $ 3,456 $ 1,950 $ 8.86 $ 9.28 $ 2.13 Santa Fe NM 75,764 $ 2,100 $ 1,554 $ 4.60 $ 2.42 $ 1.61 Salem OR 156,690 $ 1,953 $ 1,274 $ 8.14 $ 2.09 $ 1.32 Olympia WA 42,514 $ 3,015 $ 1,957 $ 4.84 $ 6.46 $ 3.74 average $ 2,638 $ 1,839 $ 5.74 $ 4.58 $ 1.90 Similarly Sized-Cities 2 Chandler AZ 247,140 $ 3,983 $ 2,446 $ 7.39 $ 5.88 $ 1.66 Gilbert AZ 216,449 $ 423 $ 297 $ 1.59 $ 0.57 $ 0.41 Glendale AZ 251,522 $ 1,160 $ $ 2.17 $ 1.23 Boise ID 211,720 $ 3,535 $ 1,950 $ 8.86 $ 9.28 $ 2.13 Reno NV 218,000 $ 4,177 $ 2,845 $ $ 2.53 Salem OR 156,690 $ 1,953 $ 1,274 $ 8.14 $ 2.09 $ 1.32 Spokane WA 208,916 $ 638 $ 412 $ 2.65 $ average $ 2,267 $ 1,402 $ 5.77 $ 3.67 $ 1.42 Primary cities in similary-sized MSAs 3 Tucson AZ 541,81 4,300 $ 2,150 $ 4.28 $ 5.09 $ 2.20 Fresno CA 495,913 per acre per acre per acre per acre per acre Albuquerque NM 528,497 $ 3,662 $ 1,520 $ $ 3.35 Utah Cities 4 5 average $ 3,98 1,835 $ 3.95 $ 4.26 $ 2.78 Draper UT 42,274 $ 1,447 $ 994 $ $ 1.05 Herriman UT 21,785 Layton UT 67,31 2,399 $ 1,508 $ 3.73 $ 2.19 $ 2.55 Lehi UT 47,407 $ 1,513 $ 1,513 $ 1.04 $ 1.04 $ 0.21 Logan UT 48,174 $ 669 $ $ 0.14 $ 0.05 Park City UT 7,558 $ 315 $ 290 $ Provo UT 112,488 $ 986 $ 657 $ 2.40 $ Riverton UT 38,753 $ 764 $ 2,675 $ 3.20 $ 1.60 $ 0.67 St George UT 72,897 $ 754 $ 754 unavailable unavailable unavailable Sandy UT 87, South Jordan UT 50,418 $ 1,880 $ 1,316 $ 4.74 $ 2.94 $ 1.31 Tooele UT 31,605 $ 1,515 West Jordan UT 103,712 $ 1,89 4,340 $ 4.34 $ 1.4 $ 0.77 West Valley UT 129,480 $ 846 $ 514 $ 1.34 $ 1.2 $ 0.81 average $ 1,140 $ 1,073 $ 2.03 $ 1.0 $ 0.63
17 Parks Impact Fees single family multi family Salt Lake City - current $ Salt Lake City Mayor Fee $ 1,752 $ 1,752 Salt Lake City - council adopted fee $ 3,999 $ 3,999 National Average Sample Size $ 2,955 $ 2,254 Western States 1 Sample Size Arizona 30 $ 2,385 $ 1,801 California 37 $ 8,622 $ 6,681 Colorado 17 $ 3,560 $ 2,774 Idaho 1,355 $ 1,050 Montana 738 $ 738 New Mexico 8 $ 1,747 $ 1,261 Nevada 5 $ 2,034 $ 1,625 Oregon 1 5,095 $ 3,817 Utah 18 $ 2,78 1,811 Washington 15 $ 2,244 $ 1,506 average $ 3,056 $ 2,306 Western Capital Cities Population Phoenix AZ 1,445,632 $ 4,018 $ 1,876 Sacramento CA 486,189 $ 5,19 3,058 Boise ID 211,720 $ 1,355 $ 1,050 Santa Fe NM 75,764 $ 1,214 $ 971 Salem OR 156,690 $ 3,548 $ 1,937 Olympia WA 42,514 $ 2,930 $ 1,771 average $ 3,043 $ 1,777 Similarly Sized-Cities 2 Chandler AZ 247,140 $ 5,057 $ 3,873 Gilbert AZ 216,449 $ 4,547 $ 3,911 Glendale AZ 251,522 $ 2,072 $ 1,555 Boise ID 211,720 $ 1,355 $ 1,050 Reno NV 218,000 $ 1,000 $ 1,000 Salem OR 156,690 $ 3,548 $ 1,937 Spokane WA 208,916 $ - average $ 2,51 1,904 Primary cities in similary-sized MSAs 3 Tucson AZ 541,81 1,720 $ 860 Fresno CA 495,913 $ 3,398 $ 2,764 Albuquerque NM 528,497 $ 3,990 $ 2,463 average $ 3,036 $ 2,029 Utah Cities 4 5 Draper UT 42,274 $ 3,990 $ 2,463 Herriman UT 21,785 $ 3,445 $ 3,445 Layton UT 67,31 1,873 $ 1,381 Lehi UT 47,407 $ 3,819 $ 3,198 Logan UT 48,174 $ - Park City UT 7,558 $ 3,855 $ 3,150 Provo UT 112,488 $ 3,088 $ 2,391 Riverton UT 38,753 $ 2,675 $ 469 St George UT 72,897 $ 2,730 $ 2,730 Sandy UT 87,46 3,316 $ 1,841 South Jordan UT 50,418 $ 4,346 $ 2,850 Tooele UT 31,605 $ 2,125 $ - West Jordan UT 103,712 $ 1,633 $ - West Valley UT 129,480 $ 2,032 $ 1,429 average $ 2,78 1,811
18 Police Impact Fees single family multi family retail/sf office/sf industrial/sf Salt Lake City - current $ 452 $ 452 $ 0.30 $ 0.30 $ 0.30 Salt Lake City Mayor Fee $ 357 $ 357 $ 0.24 $ 0.24 $ 0.24 Salt Lake City council adopted fee $ $ $ National Average Sample Size $ 385 $ 303 $ 4.30 $ 0.26 $ 0.18 Western States 1 Sample Size Arizona 30 $ 467 $ 368 $ 0.59 $ 0.28 $ 0.20 California 37 $ 802 $ 635 $ 0.68 $ 0.52 $ 0.40 Colorado 17 $ 356 $ 325 $ 0.28 $ 0.26 $ 0.15 Idaho 628 $ 628 $ 0.08 $ 0.08 Montana - New Mexico 8 $ $ $ 0.06 Nevada 5 Oregon 1 - Utah 18 $ $ 0.12 $ Washington 15 $ $ 0.79 $ average $ 283 $ 236 $ 0.27 $ 0.14 $ 0.11 Western Capital Cities Population Phoenix AZ 1,445,632 $ 344 $ 153 $ $ 0.20 $ 0.22 Sacramento CA 486,189 Boise ID 211,720 $ 628 $ 628 $ 0.08 $ 0.08 Santa Fe NM 75,764 $ 48 $ 39 $ 0.04 $ 0.03 Salem OR 156,690 Olympia WA 42,514 average $ 170 $ 137 $ 3.17 $ 0.05 $ 0.06 Similarly Sized-Cities 2 Chandler AZ 247,140 $ 268 $ $ 0.28 $ 0.09 Gilbert AZ 216,449 $ 643 $ 643 $ 0.34 $ 0.34 $ 0.34 Glendale AZ 251,522 $ 395 $ 297 $ 0.58 $ 0.30 $ 0.17 Boise ID 211,720 $ 628 $ 628 $ 0.08 $ 0.08 Reno NV 218,000 Salem OR 156,690 Spokane WA 208,916 average $ 276 $ 256 $ 0.26 $ 0.14 $ 0.10 Primary cities in similary-sized MSAs 3 Tucson AZ 541, $ 499 $ 0.70 $ 0.70 $ 0.70 Fresno CA 495,913 $ 624 $ 508 $ 6.65 $ 6.65 $ 4.22 Albuquerque NM 528,497 $ 218 $ $ 0.08 $ 0.08 average $ 505 $ 359 $ 2.56 $ 2.48 $ 1.67 Utah Cities 4 5 Draper UT 42,274 $ 218 $ Herriman UT 21,785 Layton UT 67,31 - $ 0.07 Lehi UT 47,407 $ 340 $ 340 $ 0.07 $ 0.07 $ 0.07 Logan UT 48,174 $ 34 $ 28 $ 0.03 $ 0.03 $ 0.01 Park City UT 7,558 $ 605 $ 495 $ 0.56 $ 0.56 $ 0.45 Provo UT 112,488 Riverton UT 38,753 $ 308 $ 308 $ 0.09 $ 0.02 $ 0.31 St George UT 72,897 $ 109 $ 109 $ 0.10 $ 0.07 $ 0.01 Sandy UT 87, $ South Jordan UT 50,418 $ 323 $ 208 Tooele UT 31,605 $ 350 $ 320 $ 0.32 $ 0.32 $ 0.32 West Jordan UT 103,712 $ 105 $ 160 $ 0.14 $ 0.08 $ 0.05 West Valley UT 129,480 $ 66 $ 45 $ $ 0.04 average $ $ 0.12 $
19 Fire Impact Fees single family multi family retail/sf office/sf industrial/sf Salt Lake City - current $ 485 $ 485 $ 0.32 $ 0.32 $ 0.32 Salt Lake City mayor fee $ 218 $ 218 $ 0.39 $ 0.39 $ 0.39 Salt Lake City adopted council fee $ 119 $ 119 $ 0.32 $ 0.32 $ 0.32 National Average Sample Size $ 512 $ $ 0.38 $ 0.26 Western States 1 Sample Size Arizona 30 $ 634 $ $ 0.53 $ 0.36 California 37 $ 1,022 $ 690 $ 0.58 $ Colorado 17 $ 644 $ 407 $ 0.33 $ 0.35 $ 0.25 Idaho 479 $ 479 $ 0.25 $ 0.25 Montana 823 $ 692 $ 0.19 $ 0.19 $ 0.19 New Mexico 8 $ 477 $ 308 $ 0.57 $ 0.37 $ 0.36 Nevada 5 $ 1,780 $ 1,180 $ 0.80 $ 0.14 $ 0.57 Oregon 1 - Utah 18 $ 159 $ 119 $ 0.16 $ 0.14 $ 0.05 Washington 15 $ 634 $ 670 $ 0.38 $ 0.26 $ 0.26 average $ 665 $ 506 $ 0.35 $ 0.28 $ 0.26 Western Capital Cities Population Phoenix AZ 1,445,632 $ 322 $ 270 $ 0.10 $ 0.12 $ 0.17 Sacramento CA 486,189 Boise ID 211,720 $ 479 $ 479 $ 0.25 $ 0.25 Santa Fe NM 75,764 $ 136 $ 110 $ 0.12 $ 0.07 Salem OR 156,690 Olympia WA 42,514 average $ 156 $ 143 $ 0.02 $ 0.08 $ 0.08 Similarly Sized-Cities 2 Chandler AZ 247,140 $ 577 $ 442 $ 0.72 $ 0.55 $ 0.18 Gilbert AZ 216,449 $ 1,100 $ 1,100 $ 0.59 $ 0.59 $ 0.59 Glendale AZ 251,522 $ 409 $ 307 $ 0.30 $ 0.45 $ 0.28 Boise ID 211,720 $ 479 $ 479 $ 0.25 $ 0.25 Reno NV 218,000 Salem OR 156,690 Spokane WA 208,916 average $ 366 $ 333 $ 0.23 $ 0.26 $ 0.19 Primary cities in similary-sized MSAs 3 Tucson AZ 541, $ 360 $ 0.27 $ 0.27 $ 0.27 Fresno CA 495,913 $ 539 $ 439 $ 2.36 $ 2.36 $ 1.50 Albuquerque NM 528,497 $ 310 $ 107 Utah Cities 4 5 average $ 446 $ 302 $ 0.88 $ 0.88 $ 0.59 Draper UT 42,274 $ 310 $ 107 $ $ 0.04 Herriman UT 21,785 Layton UT 67, $ 0.47 Lehi UT 47,407 $ 576 $ 576 $ 0.25 $ 0.25 $ 0.25 Logan UT 48,174 $ 118 $ 85 $ 0.09 $ 0.10 $ 0.02 Park City UT 7,558 Provo UT 112,488 Riverton UT 38,753 St George UT 72,897 $ 216 $ 216 $ 0.18 $ 0.19 $ 0.06 Sandy UT 87, $ 92 $ 0.32 $ 0.09 $ 0.13 South Jordan UT 50,418 Tooele UT 31,605 West Jordan UT 103,712 $ 247 $ 140 $ 0.16 $ 0.20 $ 0.13 West Valley UT 129,480 $ 9 62 $ 0.16 $ average $ 159 $ 119 $ 0.16 $ 0.14 $ 0.05
20 Total Impact Fees (roads, parks, police and fire) single family multi family retail/sf office/sf industrial/sf Salt Lake City - current $ 1,618 $ 1,618 $ 9.24 $ 4.82 $ 2.62 Salt Lake City - mayor fee $ 2,777 $ 2, $ 2.70 $ 2.64 Salt Lake City - Adopted Council Fee $ 4,583 $ 4,408 $ 3.63 $ 2.68 $ 2 61 National Average Sample Size $ 7,079 $ 5,617 $ $ 2.69 Western States 1 Sample Size Arizona 30 $ 6,116 $ 4,640 $ 5.22 $ 3.08 $ 1.89 California 37 $ 16,945 $ 15,496 $ $ $ 7.40 Colorado 17 $ 7,25 4,759 $ $ 5.86 $ 3.07 Idaho 5,918 $ 4,107 $ 8.86 $ Montana 4,993 $ 2,816 $ 6.12 $ 2.15 $ 1.65 New Mexico 8 $ 5,387 $ 2,772 $ 4.40 $ 3.46 $ 2.97 Nevada 5 $ 5,965 $ 3,735 $ 2.65 $ 1.79 $ 1.30 Oregon 1 8,668 $ 6, $ 4.50 $ 3.17 Utah 18 $ 4,06 3, Washington 15 $ 4,928 $ 4,120 $ 4.57 $ 3.19 $ 2.29 average $ 7,023 $ 5,174 $ 6.82 $ 4.53 $ 2.69 Western Capital Cities Population Phoenix AZ 1,445,632 $ 5,334 $ 2,748 $ $ 1.00 $ 0.80 Sacramento CA 486,189 $ 9,842 $ 6,909 $ $ 2.16 Boise ID 211,720 $ 5,918 $ 4,107 $ 8.86 $ Santa Fe NM 75,764 $ 3,498 $ 2,674 $ 4.60 $ 2.58 $ 1.71 Salem OR 156,690 $ 5,50 3, $ 2.09 $ 1.32 Olympia WA 42,514 $ 5,945 $ 3,728 $ 4.84 $ 6.46 $ 3.74 average $ 6,006 $ 3,896 $ 8.92 $ 4.72 $ 2.03 Similarly Sized-Cities 2 Chandler AZ 247,140 $ 9,885 $ 6,982 $ 8.48 $ Gilbert AZ 216,449 $ 6,713 $ 5, $ 1.50 $ 1.34 Glendale AZ 251,522 $ 4,036 $ 2,750 $ $ 1.68 Boise ID 211,720 $ 5,997 $ 4,107 $ 8.86 $ Reno NV 218,000 $ 5,50 3,845 $ $ 2.53 Salem OR 156,690 $ 5,50 3, $ 2.09 $ 1.32 Spokane WA 208,916 $ 638 $ 412 $ 2.65 $ average $ 5,467 $ 3,894 $ 6.18 $ 4.08 $ 1.71 Primary cities in similary-sized MSAs 3 Tucson AZ 541,81 7,182 $ 3,869 $ 5.25 $ 6.06 $ 3.17 Fresno CA 495,913 $ 4,56 3, Albuquerque NM 528,497 $ 8,180 $ 4, $ 3.50 $ 3.43 Utah Cities 4 5 average $ 6,64 3,914 $ 6.07 $ 6.19 $ 4.11 Draper UT 42,274 $ 5,965 $ 3,635 $ 3.95 $ 2.58 $ 1.13 Herriman UT 21,785 $ 3,445 $ 3,445 Layton UT 67,31 4,773 $ 3,280 $ 4.38 $ 2.66 $ 2.62 Lehi UT 47,407 $ 6,248 $ 5,627 $ 1.36 $ 1.36 $ 0.53 Logan UT 48,174 $ $ 0.42 $ 0.27 $ 0.08 Park City UT 7,558 $ 4,775 $ 3,935 $ 0.97 $ 0.97 $ 0.77 Provo UT 112,488 $ 4,074 $ 3,048 $ 2.40 $ Riverton UT 38,753 $ 3,747 $ 3,452 $ 3.29 $ 1.62 $ 0.98 St George UT 72,897 $ 3,809 $ 3,809 $ 0.28 $ 0.26 $ 0.07 Sandy UT 87,46 4,538 $ 1,973 $ 0.32 $ 0.30 $ 0.19 South Jordan UT 50,418 $ 6,549 $ 4,374 $ 4.74 $ 2.94 $ 1.31 Tooele UT 31,605 $ 3,990 $ 320 $ 0.32 $ 0.32 $ 0.32 West Jordan UT 103,712 $ 1,089 $ 4,640 $ 4.64 $ 1.75 $ 0.95 West Valley UT 129,480 $ 3,035 $ 2,050 $ $ 0.90 average $ 4,06 3,154 $ 2.05 $ 1.22 $ 0.73

21 Salt Lake City Impact Fees Facilities Plan and Impact Fee Study Final Report April 9, 2012 Prepared by: Anne Wescott Galena Consulting
22 Section I. Introduction This report regarding updated impact fees for Salt Lake City includes the following: An overview of the report s background and objectives; A definition of impact fees and a discussion of their appropriate use; An overview of land use and demographics; A description of the City s 10-Year Fiscally Constrained Impact Fees Facilities Plan (IFFP); 1 A step-by-step calculation of impact fees; A list of implementation recommendations; and A brief summary of conclusions. Background and Objectives Salt Lake City hired Galena Consulting to complete an update of the City s police, fire, parks, and roadway impact fees. The scope of work included an analysis of current conditions, service areas, levels of service, and capital infrastructure; an analysis of current and future land uses and growth projections; the development of an updated, fiscally-constrained Impact Fees Facilities Plan (IFFP); a calculation of impact fees required to finance capital facilities necessitated by growth to continue the current levels of service; and recommendations on the implementation and administration of proposed fees. This document presents impact fees based on the City s demographic data and infrastructure costs; calculates the City s monetary participation; and outlines specific fee implementation recommendations. Credits can be granted on a case-by-case basis; these credits are assessed when each individual building permit is pulled. Definition of Impact Fees Impact fees are one-time assessments established by local governments to assist with the provision of capital improvements necessitated by new growth and development. Impact fees are governed by principles established in Title 11, Chapter 36a, Utah Code, known as the Impact Fee Act, which specifically gives local political subdivision the authority to levy impact fees. The Impact Fees Act defines an impact fee as a payment of money imposed upon new 1 The Utah Impact Fee Act was amended in May 2011 to require the development of an Impact Fees Facilities Plan (IFFP). This reference is interchangeable with what the City has been required to refer to in the past as a Capital Improvement Plan (CIP) and Capital Facilities Plan (CFP). 2 FINAL REPORT
23 development activity as a condition of development approval to mitigate the impact of the new development on public infrastructure. The Impact Fees Act defines development activity as any construction or expansion of a building, structure, or use, and change in use of a building or structure, or any changes in the use of land that creates additional demand and need for public facilities. 2 Development approval means any written authorization from a local political subdivision that authorizes the commencement of development activity. Public facilities means only the following impact fee facilities that have a life expectancy of 10 or more years and are owned or operated on behalf of a local political subdivision or private entity: water rights and water supply, treatment, and distribution facilities; wastewater collection and treatment facilities; storm water, drainage, and flood control facilities; municipal power facilities; roadway facilities; parks, recreation, open space and trails; and public safety facilities. Roadway facilities means streets or roads that have been designated on an officially adopted subdivision plat, roadway plan, or general plan of a political subdivision, together with all necessary appurtenances. "Roadway facilities" also includes associated facilities to federal or state roadways only when the associated facilities: (i) are necessitated by the new development; and (ii) are not funded by the state or federal government. Public safety facility means a building constructed or leased to house police, fire, or other public safety entities; or a fire suppression vehicle costing in excess of $500,000. Parks, recreation, open space and trails is not specifically defined. Utah fee restrictions and requirements. The Impact Fee Act places numerous restrictions on the calculation and use of impact fees, all of which help ensure that local governments adopt impact fees that are consistent with federal law. Some of those restrictions include: Impact fees may not cure deficiencies in a public facility serving existing development; 3 Impact fees may not raise the established level of service of a public facility serving existing development; 4 Impact fees cannot include an expense for overhead, such as any cost for operation and maintenance of public facilities; 5 and Impact fees cannot require residential development to pay for a fire suppression vehicle; 6 2 See Section 11-36a-102 (3), Utah Code. 3 See Section 11-36a-202 (1)(a)(i), Utah Code 4 See Section 11-36a-202 (1)(a)(ii), Utah Code 5 See Section 11-36a-202 (1)(a)(iv), Utah Code 6 See Section 11-36a-202 (2)(a)(i), Utah Code 3 FINAL REPORT
24 In addition, the Impact Fee Act requires the following: The City must consider all revenue sources, including impact fees and the anticipated dedication of system facilities, to finance the impacts on system facilities; 7 The City must prepare and adopt a Impact Fees Facilities Plan to determine the public facilities required to serve development resulting from new development activity; 8 Impact fees must be maintained in one or more interest-bearing accounts; 9 The City must file an annual report identifying all impact fees collected and revenues expended; 10 and Impact fees must be incurred or encumbered within 6 years from the date they are collected. Fees may be held in certain circumstances beyond the 6-year time limit if the governmental entity can identify an extraordinary and compelling reason; 11 How should fees be calculated? State law requires the City to implement the Impact Fees Facilities Plan (IFFP) methodology to calculate impact fees. The City can implement fees of any amount not to exceed the fees as calculated by the IFFP approach. This methodology requires the City to describe its service areas, forecast the land uses, densities and population that are expected to occur in those service areas over the 10-year IFFP time horizon, and identify the capital facilities that will be needed to serve the forecasted growth at the planned levels of service, assuming the planned levels of service do not exceed the current levels of service. Only those items identified as growth-related on the IFFP are eligible to be funded by impact fees. Once the essential facilities planning has taken place, impact fees can be calculated. The Impact Fee Act places many restrictions on the way impact fees are calculated and spent, particularly via the principal that local governments cannot charge new development more than a proportionate share of the cost of public facilities to serve that new growth. The proportionate share concept is designed to ensure that impact fees are calculated by measuring the needs created for capital facilities by development being charged the impact fee; do not exceed the cost of such facilities; and are earmarked to fund growth-related capital facilities to benefit those that pay the impact fees. 7 See Section 11-36a-302 (2), Utah Code. 8 See Section 11-36a-301 (1), Utah Code. 9 See Section 11-36a-601 (1), Utah Code. 10 See Section 11-36a-601 (4), Utah Code. 11 See Section 11-36a-602 (2)(a), Utah Code. 4 FINAL REPORT
25 Impact fees should take into account the following: Any appropriate credit, offset or contribution of money, dedication of land, or construction of system facilities; Payments reasonably anticipated to be made by or as a result of a new development in the form of user fees and debt service payments; That portion of general tax and other revenues allocated by the City to growthrelated system facilities; and All other available sources of funding such system facilities. Through data analysis and interviews with the City, Galena Consulting identified the share of each capital facility needed to serve growth. The total projected capital facilities needed to serve growth were then allocated to new residential and non-residential development with the resulting amounts divided by the appropriate growth projections from 2012 to Among the advantages of the IFFP approach is its establishment of a spending plan to give developers and new residents more certainty about the use of the particular impact fee revenues. Other fee calculation considerations. The basic IFFP methodology used in the fee calculations is presented above. However, implementing this methodology requires a number of decisions. The considerations accounted for in the fee calculations include the following: Allocation of costs is made using a service unit which is a standard measure of consumption, use, generation or discharge attributable to an individual unit.. The service units chosen by the study team for every fee calculation in this study are linked directly to residential dwelling units and non-residential square feet. A second consideration involves refinement of cost allocations to different land uses. In this analysis, the study team has chosen to use the highest level of detail supportable by available data. As a result, in this study all impact fees are allocated among residential and non-residential development, with the exception of streets impact fees. Streets fees are allocated to specific land uses according to trip generation data from the Institute of Transportation Engineers (ITE) manual. These land uses include single and multi-family residential; and retail, office, and industrial land uses. Current Assets and Capital Improvement Plans The IFFP approach estimates future capital facility investments required to serve growth over a fixed period of time. The impact fee study team has used a 10-year time period. The types of costs eligible for inclusion in this calculation include contract construction prices; the costs of acquiring land, improvements, materials and fixtures; the cost for planning, surveying and engineering fees for service provided for and directly related to the construction of system improvements; and debt service on obligations issued to finance the costs of system 5 FINAL REPORT
26 improvements. 12 Fire suppression vehicles with a value over $500,000 are also eligible. 13 The total cost of facilities over the 10 years is referred to as the IFFP Value throughout this report. The cost of this impact fee study is also impact fee eligible for all impact fee categories. Each fee category was charged its pro-rated percentage of the cost of the impact fee study. The forward-looking 10-Year IFFP includes some facilities that are only partially necessitated by growth (e.g., facility expansion partially due to upgrade and partially in order to add capacity for service provision). The study team met with the City to determine a defensible metric for including a portion of these facilities in the impact fee calculations. A general methodology used to determine this metric is discussed below. In some cases, a more specific metric was used to identify the growth-related portion of such facilities. In these cases, notations were made in the applicable section. Fee Calculation In accordance with the IFFP approach described above, we calculated impact fees by answering the following seven questions: 1. Who is currently served by the City Police, Fire, Parks, and Streets/ Transportation Departments? This includes the number of residential units and non-residential square feet. 2. What is the current level of service provided by the City? Since an important purpose of impact fees is to fund the capital facility necessary to maintain the current service level, it is necessary to know the levels of service it is currently providing to the community. 3. What current assets allow the City to provide this level of service? This provides a current inventory of assets used by the City, such as facilities, land and equipment (where eligible). In addition, each asset s replacement value was calculated and summed to determine the total value of the Departments current assets. 4. What is the current investment per residential household and non-residential square foot? In other words, how much have current residential and non-residential land uses paid into the total value of current departmental assets? 5. What future growth is expected in the City? How many new residential households and non-residential square feet will the City serve over the IFFP period? How many more people will be demanding a continuation of the current level of service enjoyed by City residents? 6. What new infrastructure is required to serve future growth? For example, how many new parks or fire stations will be needed by the City within the next ten years to maintain the current service level? 12 See Section 11-36a-201 (16)(a)(ii). 13 See Section 11-36a-102 (14). 6 FINAL REPORT
27 7. What impact fee is required to pay for the new infrastructure? We calculated an apportionment of new infrastructure costs to future residential and nonresidential land-uses for the City. Then, using this distribution, the impact fees were determined. Addressing these seven questions, in order, provides the most effective and logical way to calculate impact fees for the City. In addition, these seven steps satisfy and follow the regulations set forth earlier in this section. Not all capital costs are associated with growth. Some capital costs are for repair and replacement of aging facilities (e.g., standard periodic investment in existing facilities such as roofing or HVAC repairs). These costs are not impact fee eligible. Some capital costs are for betterment of facilities, or implementation of new services (e.g., an upgraded training facility). These costs are generally not entirely impact fee eligible. Some costs are for expansion of facilities to accommodate new development at the current level of service (e.g., acquisition and construction of a fire station to serve new growth). These costs are impact fee eligible. Because there are different reasons why the City invests in capital projects, the study team conducted an analysis on all projects listed in each IFFP: Growth. To determine if a project is solely related to growth, we ask Is this project designed to maintain the current level of service as growth occurs? and Would the City still need this capital project if it weren t growing at all? Growth projects are only necessary to maintain the City s current level of service as growth occurs. It is thus appropriate to include 100 percent of their cost in the impact fee calculations. An example of a purely growth related project would be additional park acreage to continue the current ratio of acreage to population. Repair & Replacement. We ask, Is this project related only to fixing existing infrastructure? and Would the City still need it if it weren t growing at all? Repair and replacement projects have nothing to do with growth. It is thus not appropriate to include any of their cost in the impact fee calculations. One example of this type of project would be a playground replacement. Upgrade. We ask, Would this project improve the City s current level of service? and Would the City still do it even if it weren t growing at all? Upgrade projects have nothing to do with growth. It is thus not appropriate to include any of their cost in the impact fee calculations. One example of this type of project would be the parking pay station major capital asset project. Mixed. Some capital projects are partially necessitated by growth, but also include an element of repair, replacement and/or upgrade. In this instance, a cost amount between 0 and 100 percent should be included in the fee calculations. Although the project might be an upgrade of or replacement to an existing facility, its scope will create capacity necessary to serve projected growth. A specific example of this within this study is the new Evidence/Crime Lab facility. While this project can be considered an upgrade to the current facility, which is not generally impact fee 7 FINAL REPORT
28 eligible, part of the purpose of the new facility is to add space to process and house additional evidence associated with growth. It should be understood that growth is expected to pay only the portion of the cost of capital facilities that are growth-related. The City will need to plan to fund the pro rata share of partially growth-related capital facilities with revenue sources other than impact fees within the time frame that impact fees must be spent. These values will be calculated and discussed in Section VII of this report. Acknowledgements We would like to thank the following for their cooperation in the development of this report: LuAnn Clark and Michael Akerlow, Housing and Neighborhood Development Division, for service as the project managers and City liaisons. Deputy Chief Tim Doubt, Sergeant Scott Teerlink, Deputy Chief Brian Dale, Battalion Chief Robert McMicken, John Vuyk, Rick Graham, Emy Maloutas, Lee Bollwinkel, Dell Cook, John Naser, Lynn Jarman, Tim Harpst, Kevin Young, Dan Bergenthal, Alden Breinholt, Paul Nielson, Marilyn Lewis, Gina Chamness, Randy Hillier, Sherrie Collins, Dan Mulé and Marina Scott for their significant attention to the development of the updated Impact Fees Facilities Plan. 8 FINAL REPORT
29 Section II. Land Uses City services are measured in terms of number of population served, physical structures to be protected, and trips generated. Knowing how much the population, residential households and non-residential square feet are projected to increase assists city staff in determining how many and what type of new capital facilities will be needed within the planning period. As noted in Section I, it is necessary to allocate impact fee facilities plan (IFFP) costs to residential and non-residential development when calculating impact fees. The study team performed this allocation based on the number of new households, non-residential square footage, and new trips projected to be added over the ten-year period. The following Exhibit II-1 presents the current and future population projections for the Salt Lake City. Exhibit II-1. Current and Future Population for Salt Lake City Net Increase Percent Increase Population 186, ,263 8,823 5% Source: 2010 U.S. Census, the Wasatch Front Regional Council Transportation Plan , and the 2009 American Community Survey. Salt Lake City currently serves 186,440 persons. By 2020, the population is projected to increase by 8,823 persons to 195,263 persons, a 5% increase. The City must plan for the necessary capital facilities to serve these additional residents. In order to apportion the costs of the capital facilities necessitated by growth over the ten-year planning period, it is necessary to determine the number of new units of development among residential and non-residential development, and then convert both land uses to square feet. The following Exhibit II-2 presents the current and future number of residential households and nonresidential square feet, and their distribution as a total of all new development. 9 FINAL REPORT
30 Exhibit II-2. Land Use Distribution, Salt Lake City, Utah, Notes: Units or Square Feet Net Increase Net Increase in Percent of in Units Square Feet Total Growth Residential (in units) 80,362 84,165 3,803 5,667,781 59% Single-Family 42,270 53% 44,271 2,000 3,704,717 Multi-Family 38,092 47% 39,894 1,803 1,963,064 Nonresidential (in square feet) 82,909,311 86,832,873 3,923,562 41% Total 9,591, % Number of residential units was based on American Community Survey data and U.S. Census housing characteristics data from Non-residential square footage of 1,031 square feet per residential unit was obtained by CB Richard Ellis Real Estate 2010 Year-End Report. Salt Lake City currently has 80,362 residential units. 53% of these (42,270) are single-family, while 47% (38,092) are multi-family. There are currently 82,909,311 square feet of nonresidential square footage (office, retail, and industrial). Based on square foot conversion, residential development represents 59% of current land use, while non-residential development represents 41%. Growth projections provided by the Wasatch Front Regional Council indicate Salt Lake City is expected to grow by approximately 3,803 residential units by ,000 of these are anticipated to be single-family units, while 1,803 are anticipated to be multi-family units. An additional 3,923,562 square feet of non-residential square footage is expected to be added by Demographic and land-use projections are some of the most variable and potentially debatable components of an impact fee study, and in all likelihood the projections used in our study will not prove to be 100 percent correct. As each IFFP is tied to the City s land use growth, the IFFP and resulting fees can be revised based on actual growth as it occurs. 10 FINAL REPORT
31 Section III. Fire Impact Fees In this section, we calculate impact fees for the Salt Lake City Fire Department following the seven question method outlined in Section I of this report. 1. Who is currently served by the Salt Lake City Fire Department? As outlined in Section II, the Salt Lake City Fire Department currently serves 186,440 residents in 80,362 residential units, and 82,909,311 square feet of non-residential square footage (office, retail, industrial and institutional). 2. What is the current level of service provided by the Salt Lake City Fire Department? Salt Lake City s Fire Department currently provides a level of service of an average response time of 4 minutes 28 seconds. 3. What current assets allow the Salt Lake City Fire Department to provide this level of service? The following Exhibit III-1 summarizes the current capital assets of the Salt Lake City Fire Department. 11 FINAL REPORT
32 Exhibit III-1. Current Assets Salt Lake City Fire Department Replacement Amount to Type of Capital Facility Address Value Include in Fee Comparison Facilities New Public Safety Complex $ 25,000,000 $25,000,000 Existing Public Safety Building 315 East 200 South $ 5,487,200 $5,487,200 Fire Station #1 211 South 500 East $ 4,756,500 $4,756,500 Fire Station #2 270 West 300 North $ 2,305,500 $2,305,500 Fire Station # East Simpson $ 2,835,000 $2,835,000 Fire Station #4 830 East 11th Avenue $ 2,405,700 $2,405,700 Fire Station # East 900 South $ 2,520,000 $2,520,000 Fire Station #6 948 West 800 South $ 2,197,800 $2,197,800 Fire Station #7 273 North 1000 West $ 2,405,700 $2,405,700 Fire Station #8 15 West 1300 South $ 3,000,000 $3,000,000 Fire Station # West Amelia Earhart Drive $ 3,303,000 $3,303,000 Fire Station # Arapeen Drive $ 2,929,500 $2,929,500 Fire Station # North 2360 West $ 2,813,282,813,281 Fire Station # North 4030 West $ 2,700,000 $2,700,000 Fire Station # East Parleys Way $ 1,944,000 $1,944,000 Fire Station # South Industrial Road $ 1,440,000 $1,440,000 Fire Station #15 - land only $ 790,000 $790,000 Fire Training Tower 1600 South Industrial Road $ 5,085,000 $5,085,000 Fleet Facility $ 3,937,500 $3,937,500 Land for Fire Training Center $ 650,000 $650,000 Apparatus 25 Engines $ 12,500,000 $12,500,000 5 Ladder Trucks $ 4,250,000 $4,250,000 Total Infrastructure $ 95,255,6895,255,681 Plus Cost of Fee-Related Research Impact Fee Study Update $ 11,150 $11,150 Plus Impact Fee Fund Balance $ 2,396,845 $2,396,845 Grand Total $ 97,663,676 $97,663,676 Source: Salt Lake City Fire Department and Impact Fee Study Team. Notes: Replacement cost assumption is $300 per square foot. All cost assumptions based on replacement cost in 2011 dollars. Impact Fee fund balance as of 3/31/11. As shown above, the Salt Lake City Fire Department currently owns approximately $97.6 million of capital assets 14. These assets are used to provide the Department s current level of service of an average response time of 4 minutes 28 seconds. 4. What is the current investment per unit? By dividing the total replacement value of the current capital assets of the Salt Lake City Fire Department by the number of current households and non-residential square feet whose owners have invested in these assets, we can determine that the Department has invested $718 per existing residential unit and $0.48 per non-residential square foot. We will compare our final impact fee with this figure to determine if the two results will be similar; this represents a check to see if future City residents will be paying for infrastructure at a level commensurate with what existing City residents have invested in infrastructure. 14 Current impact fee fund balance is added into the value of the current assets to reflect revenues already paid into the City for capital infrastructure necessary to address the service needs of recent growth. 12 FINAL REPORT
33 5. What future growth is expected for the Salt Lake City Fire Department? As shown in Exhibit II-1, the resident population of the Salt Lake City is projected to increase by 8,823 people over the ten-year planning period. As indicated in Exhibit II-2, this equates to approximately 3,803 new residential units and 3,923,562 new square feet of non-residential square footage. 6. What new infrastructure is required to serve future growth? The Salt Lake City Fire Department has developed an Impact Fees Facilities Plan (IFFP) that identifies the capital facilities the City will need to build within the next ten years. Because City residents approved a bond to construct a $125 million Public Safety Building which will be completed in 2013, no future capacity for additional growth-related administrative staff is required. However, the Fire Department must relocate and expand Fire Station #3 in order to continue providing the current service level to projected growth. In addition, it must construct and outfit Fire Station #14 to accommodate the service needs of projected growth. The following Exhibit III-2 summarizes the investment the Salt Lake City Fire Department plans to make in capital facilities over the next ten years to continue its current level of service. Exhibit III-2. Salt Lake City Fire Department Impact Fees Facilities Plan Square Land Estimated Portion Impact Fee Other Type of Capital Facility Feet Acreage Cost Attributable Eligible Funding to Growth Sources Facilities 2013 Fire Station #3 - Relocation and Expansion; Land Acquisition $ 1,500,000 33% $ 495,000 $ 1,005, Fire Station #3 - Relocation and Expansion; Construction 15, $ 6,000,000 33% $ 1,980,000 $ 4,020, Fire Station #14 15, $ 5,100,000 33% $ 1,683,000 $ 3,417,000 Apparatus 2021 Truck for Fire Station #14 to serve Southwest growth $ 950, % $ 950,000 Total Infrastructure $ 13,550,000 $ 5,108,000 $ 8,442,000 Plus Cost of Fee-Related Research Impact Fee Study $ 11, % $ 11,150 Standards of Cover Study $ 50,000 50% $ 25,000 $ 25,000 Minus Impact Fee Fund Balance $ 3,427,416 $ 3,427,416 Grand Total $ 10,183,734 $ 1,716,734 $ 8,467,000 Source: Salt Lake City Fire Department and Impact Fee Study Team. Notes: Replacement cost assumption is $300 per square foot. All cost assumptions based on replacement cost in 2011 dollars. The Standards of Cover study will assist the Department in determining the location of future stations. Fund balance as of 3/31/12. As shown above, the Salt Lake City Fire Department plans to invest approximately $10 million in capital facilities over the next ten years, $1.7 million of which is impact fee eligible. The impact fee eligible portion includes a proportional share of the cost to plan for and construct the relocated Fire Station #3 and the new Fire Station #14, and to provide Fire Station #14 with a fire suppression vehicle. The remaining $8.5 million is the result of correcting an existing deficiency 13 FINAL REPORT
34 and is not impact fee eligible. This amount must be funded with revenue sources other than impact fees. 7. What impact fee is required to pay for the new capital facilities? The following Exhibit III-3 takes the projected future growth from Exhibits II-1 and II-2, and the impact fee eligible costs from Exhibit III-2 to calculate impact fees for the Salt Lake City Fire Department. If the cost of the infrastructure necessary to continue the level of service currently enjoyed by City residents to an additional 8,823 new residents (growth-related IFFP cost of $1.7 million 15 ), was divided by the number of households and non-residential square footage correlated to the new residents (3,803 households and 3.9 million square feet), every new household and nonresidential square foot s proportional share of the IFFP cost would be as follows: Exhibit III-3. Salt Lake City Fire Department Impact Fee Calculation Note: (1) From Exhibit III-2. (2) From Exhibit II-2. Source: Salt Lake City Fire Department and Impact Fee Study Team. Amount to Include in Impact Fees 1 Facilities and Fee-Related Research (apportioned to all growth) $ 766,734 Fire Supression Vehicle (apportioned to non-residential growth only) $ 950,000 Percent of Future Growth Residential 59% Nonresidential 41% Amount Attributable to Future Land Use Residential $ 453,084 Nonresidential $ 1,263,650 Future Growth by Land Use 2 Residential (housing units) 3,803 Nonresidential (square feet) 3,923,562 Calculated Impact Fee Residential (housing units) $ 119 Nonresidential (square feet) $ 0.32 The amount per household is less than the current $712 investment per household and $0.48 investment per non-residential square foot we calculated based on Exhibit III-I of this report. This confirms that new growth is not being asked to contribute more to continue the current service level than existing residents have already invested in the current system. The Department cannot assess fees greater than the amounts shown above. The Department may assess fees lower than these amounts, but would then experience a decline in service levels unless the Department used other revenues to make up the difference. A comparison of current investment, current impact fees and 2012 calculated fire impact fees is as follows: 15 The impact fee-eligible costs associated with Fire Station #3, Fire Station #14, the impact fee study, and standards of cover study are allocated to residential and non-residential growth according to their relative percentage of total growth based on total square footage. The fire suppression vehicle is allocated to non-residential development as it is this development in the southwest area of the City that will require a specialized vehicle to address rescue and hazmat activities associated primarily with non-residential uses. 14 FINAL REPORT
35 Residential Unit Current Investment per Unit $718 Current Fire Impact Fee $485 Proposed Fire Impact Fee $119 Non-Residential Square Foot Current Investment per Square Foot $0.48 Current Fire Impact Fee $0.32 Proposed Fire Impact Fee $ FINAL REPORT
36 Section IV. Police Impact Fees In this section, we calculate impact fees for the Salt Lake City Police Department following the seven question method outlined in Section I of this report. 1. Who is currently served by the Salt Lake City Police Department? As outlined in Section II, the Salt Lake City Police Department currently serves 186,440 residents in 80,362 residential units, and 82,909,311 square feet of non-residential square footage (office, retail, industrial and institutional). 2. What is the current level of service provided by the Salt Lake City Police Department? Salt Lake City s Police Department currently provides a level of service of 2.35 sworn officers per every 1,000 residents. 3. What current assets allow the Salt Lake City Police Department to provide this level of service? These officers are currently housed in 202,604 square feet of physical space 16. The following Exhibit IV-1 summarizes the current capital assets of the Salt Lake City Police Department. Exhibit IV-1. Current Assets Salt Lake City Police Department Square Land Replacement Equity Amount to Type of Capital Facility Feet Acreage Value times Percentage equals Include in Fee Comparison Facilities New Public Safety Building 146, $ 100,000, % $ 100,000,000 Existing Public Safety Building 72, $ 21,948, % $ 21,948,800 Pioneer Police Precinct 27, $ 5,624, % $ 5,624,600 Motor Shed/Evidence Warehouse 12, $ 1,864, % $ 1,864,000 Fleet Facility 16,96 3,937, % $ 3,937,500 Total Infrastructure 275, ,374,900 $ 133,374,900 Plus Cost of Fee-Related Research Impact Fee Study Update $ 11, % $ 11,150 Plus Impact Fee Fund Balance 100% $ - Grand Total $ 133,386,050 $ 133,386,050 Source: Salt Lake City Police Department and Impact Fee Study Team. Notes: Replacement cost assumptions were $300 per square foot for the Public Safety Building, $200 per square foot for the Pioneer Police Precinct, $100 per square foot for the Motor Shed/Evidence Warehouse, and $232 per square foot for the Fleet Facility. All cost assumptions based on replacement cost in 2011 dollars. 16 For the sake of a forward-looking IFFP, current square footage includes the new Public Safety Building, not the current facility. 16 FINAL REPORT
37 As shown above, the Salt Lake City Police Department currently owns approximately $133.4 million of capital assets. These assets are used to provide the Department s current level of service of 2.35 sworn officers per 1,000 population. 4. What is the current investment per unit? By dividing the total replacement value of the current capital assets of the Salt Lake City Police Department by the number of current households and non-residential square feet whose owners have invested in these assets, we can determine that the Department has invested $981 per existing residential unit and $0.66 per non-residential square foot. We will compare our final impact fee with this figure to determine if the two results will be similar; this represents a check to see if future City residents will be paying for infrastructure at a level commensurate with what existing City residents have invested in infrastructure. 5. What future growth is expected for the Salt Lake City Police Department? As shown in Exhibit II-1, the resident population of the Salt Lake City is projected to increase by 8,823 people over the ten-year planning period. As indicated in Exhibit II-2, this equates to approximately 3,803 new residential units and 3,923,562 new square feet of non-residential square footage. 6. What new infrastructure is required to serve future growth? The Salt Lake City Police Department has developed an Impact Fees Facilities Plan (IFFP) that identifies the capital facilities the City will need to build within the next ten years. Because City residents approved a bond to construct a $125 million Public Safety Building which will be completed in 2013, no future capacity for additional growth-related officers is needed. However, the Police Department must replace its current Police Evidence and Crime Lab in order to provide its desired level of service. This facility will be larger than the existing facility that is being replaced in order to provide capacity for processing and housing evidence associated with the projected growth in population. The following Exhibit IV-2 summarizes the investment the Salt Lake City Police Department plans to make in capital facilities over the next ten years to continue its current level of service. Exhibit IV-2. Salt Lake City Police Department Impact Fees Facilities Plan Square Acreage Estimated Portion Impact Fee Other Funding Type of Capital Facility Feet Cost Attributable Eligible Sources to Growth Facilities 2014 Police Evidence and Crime Lab Facility 100, $ 9,000,000 25% $ 2,250,000 $ 6,750,000 Total Infrastructure $ 9,000,000 $ 2,250,000 $ 6,750,000 Plus Cost of Fee-Related Research Impact Fee Study $ 11, % $ 11,150 Minus Impact Fee Fund Balance $ 1,998,649 $ 1,998,649 Grand Total $ 7,012,501 $ 262,50 6,750,000 Source: Salt Lake City Police Department and Impact Fee Study Team. 17 FINAL REPORT
38 As shown above, the Salt Lake City Police Department plans to invest approximately $7.0 million in capital facilities over the next ten years, $262,501 of which is impact fee eligible. The impact fee eligible portion includes a proportional share of the police evidence and crime lab facility. The remaining $6.8 million is the result of correcting an existing deficiency in available space and investing in improved service levels, and is not impact fee eligible. This amount must be funded with revenue sources other than impact fees. 7. What impact fee is required to pay for the new capital facilities? The following Exhibit IV-3 takes the projected future growth from Exhibits II-1 and II-2, and the impact fee eligible costs from Exhibit IV-2 to calculate impact fees for the Salt Lake City Police Department. If the cost of the infrastructure necessary to continue the level of service currently enjoyed by City residents to an additional 8,823 new residents (growth-related IFFP cost of $262,501), was divided by the number of households and non-residential square footage correlated to the new residents (3,803 households and 3.9 million square feet), every new household and nonresidential square foot s proportional share of the IFFP cost would be as follows: Exhibit IV-3. Salt Lake City Police Department Impact Fee Calculation Note: (1) From Exhibit IV-2. (2) From Exhibit II-2. Source: Salt Lake City Police Department and Impact Fee Study Team. Amount to Include in Impact Fees 262,501 Percent of Future Growth Residential 59% Nonresidential 41% Amount Attributable to Future Land Use Residential $ 155,119 Nonresidential $ 107,382 Future Growth by Land Use 2 Residential (housing units) 3,803 Nonresidential (square feet) 3,923,562 Calculated Impact Fee Residential (housing units) $ 41 Nonresidential (square feet) $ 0.03 The amount per household is less than the current $981 investment per household and $0.66 investment per non-residential square foot we calculated based on Exhibit IV-I of this report. This confirms that new growth is not being asked to contribute more to continue the current service level than existing residents have already invested in the current system. The Department cannot assess fees greater than the amounts shown above. The Department may assess fees lower than these amounts, but would then experience a decline in service levels unless the Department used other revenues to make up the difference. 18 FINAL REPORT
39 A comparison of current investment, current impact fees and 2012 calculated police impact fees is as follows: Residential Unit Current Investment per Unit $981 Current Police Impact Fee $452 Proposed Police Impact Fee $41 Non-Residential Square Foot Current Investment per Square Foot $0.66 Current Police Impact Fee $0.30 Proposed Police Impact Fee $ FINAL REPORT
40 Section V. Parks, Recreation, Open Space and Trails Impact Fees In this section, we calculate impact fees for the Salt Lake City Parks and Public Lands Division following the seven question method outlined in Section I of this report. 1. Who is currently served by the Salt Lake City Parks and Public Lands Division? As outlined in Section II, the Salt Lake City Parks and Public Lands Division currently serves 186,440 residents in 80,362 residential units. Parks impact fees are not assessed on nonresidential development. 2. What is the current level of service provided by the Salt Lake City Parks and Public Lands Division? Salt Lake City s Parks and Public Lands Division currently provides a level of service of 5.05 acres of developed park land and trails and 6.15 acres of open space per every 1,000 residents. Total level of service is 11.2 acres per 1,000 population. 3. What current assets allow the Salt Lake City Parks and Public Lands Division to provide this level of service? The following Exhibit V-1 summarizes the current capital assets of the Salt Lake City Parks and Public Lands Division. Exhibit V-1. Current Assets Salt Lake City Parks and Public Lands Division Land Replacement Equity Amount to Type of Capital Facility Acreage/ Value times Percentage equals Include in Fee Miles Comparison Regional Parks $ 112,500, % $ 112,500,000 Community Parks $ 79,080, % $ 79,080,000 Neighborhood Parks $ 70,860, % $ 70,860,000 Special Use Parks $ 9,915, % $ 9,915,000 Community Gardens 2.25 $ 337, % $ 337,396 Mini Parks $ 2,726, % $ 2,726,908 Greenbelt/Shared Use Pathways 32 miles $ 33,390, % $ 33,390,000 Open Space/Trails 1, $ 11,474, % $ 11,474,751 Total Infrastructure 2, $ 320,284,055 $ 320,284,055 Plus Cost of Fee-Related Research Impact Fee Study Update $ 11, % $ 11,150 Plus Impact Fee Fund Balance $ 1,040, % $ 1,040,221 Grand Total $ 321,335,426 $ 321,335,426 Source: Salt Lake City Parks and Public Lands Division and Impact Fee Study Team. Notes: Replacement cost assumptions range from $10,000 to $300,000 per acre; based on current value. 20 FINAL REPORT
41 As shown above, the Salt Lake City Parks and Public Lands Division currently owns approximately $321.3 million of capital assets. These assets are used to provide the Division s current level of service of 5.05 acres of developed park land and trails and 6.15 acres of open space per every 1,000 residents. 4. What is the current investment per unit? By dividing the total replacement value of the current capital assets of the Salt Lake City Parks and Public Lands Division by the number of current households whose owners have invested in these assets, we can determine that the Division has invested $3,999 per existing residential unit. We will compare our final impact fee with this figure to determine if the two results will be similar; this represents a check to see if future City residents will be paying for infrastructure at a level commensurate with what existing City residents have invested in infrastructure. 5. What future growth is expected for the Salt Lake City Parks and Public Lands Division? As shown in Exhibit II-1, the resident population of the Salt Lake City is projected to increase by 8,823 people over the ten-year planning period. As indicated in Exhibit II-2, this equates to approximately 3,803 new residential units. 6. What new infrastructure is required to serve future growth? The Salt Lake City Parks and Public Lands Division has developed an Impact Fees Facilities Plan (IFFP) that identifies the capital facilities the City will need to build within the next ten years. The following Exhibit V-2 summarizes the investment the Salt Lake City Parks and Public Lands Division plans to make in capital facilities over the next ten years to continue its current level of service: 21 FINAL REPORT
42 Exhibit V-2. Salt Lake City Parks and Public Lands Division Impact Fees Facilities Plan Acres/ Estimated Portion Impact Fee Other Funding Type of Capital Facility Miles Cost times Attributable equals Eligible Sources to Growth Parks/Open Space Acquisition and Development Additional acres of developed parks to continue current level of service for growth $ 15,603, % $ 15,603,000 $ - Additional acres of open space to continue current level of service for growth $ 543, % $ 543,000 Additional non growth-related open space acquisition TBD $ 2,100,000 0% $ 2,100,000 Trail/Shared Use Pathway Development Jordan and Salt Lake (McClelland) Canal Shared Use Pathway $ 4,000,000 10% $ 400,000 $ 3,600,000 City Creek Trail $ 1,200,000 10% $ 120,000 $ 1,080,000 Improvements to Existing Parks - Specific projects to be determined on an annual basis Includes playgrounds, restrooms, fields, courts, paths, pavilions, plazas, off-leash dog parks skate parks, BMX/bike parks, irrigation and landscaping, and other miscellaneous improvements Playground Improvements $ 1,816,200 0% $ 1,816,200 Restroom Improvements $ 3,000,000 11% $ 300,000 $ 2,700,000 Multipurpose Field Improvements $ 950,000 0% $ 950,000 Basketball Improvements $ 150,000 0% $ 150,000 Tennis Court Improvements $ 4,613,400 0% $ 4,613,400 Volleyball Court Improvements $ 70,000 0% $ 70,000 Softball Field Improvements $ 400,000 0% $ 400,000 Baseball Field Improvements $ 1,400,000 0% $ 1,400,000 Jogging/Walking Path Improvements $ 501,608 3% $ 16,000 $ 485,608 Pavilion Improvements $ 1,200,000 0% $ 1,200,000 Plaza Improvements $ 1,200,000 4% $ 50,000 $ 1,150,000 Off-Leash Dog Park Improvements $ 500,000 3% $ 12,500 $ 487,500 Skate Park Improvements $ 700,000 0% $ 700,000 BMX/Bike Park Improvements $ 300,000 5% $ 15,000 $ 285,000 Miscellaneous Amenities Drinking Fountains $ 70,000 0% $ 70,000 Picnic Tables $ 240,000 0% $ 240,000 Horseshoes $ 15,000 0% $ 15,000 Water Features $ 250,000 0% $ 250,000 Bridges $ 250,000 0% $ 250,000 Bleachers $ 112,000 0% $ 112,000 Benches $ 90,000 0% $ 90,000 Earthen Trails $ 375,223 0% $ 375,223 Concessions $ 500,000 0% $ 500,000 Other Improvements Landscaping $ 2,305,000 0% $ 2,305,000 Lighting $ 694,770 0% $ 694,770 Irrigation $ 2,394,220 0% $ 2,394,220 Fencing $ 350,000 0% $ 350,000 Asphalt $ 1,182,020 0% $ 1,182,020 Signage $ 312,093 0% $ 312,093 Cemetery $ 2,000,000 0% $ 2,000,000 Total Improvements to Existing Parks $ 27,941,534 $ 393,500 $ 27,548,034 Percent for Art $ 500,000 0% $ 500,000 Cost Overruns $ 300,000 0% $ 300,000 Total Infrastructure $ 52,187,534 $ 17,059,500 $ 35,128,034 Plus Cost of CIP/Fee-Related Research Impact Fee Study $ 11, % $ 11,150 $ - Parks Recovery Plan $ 50,000 0% $ 50,000 Parks, Open Space and Trails Master Plan $ 75,000 5% $ 3,750 $ 71,250 Jordan River Master Plan $ 100,000 5% $ 5,000 $ 95,000 Foothills Recreation and Management Plan $ 75,000 5% $ 3,750 $ 71,250 Total Infrastructure Plus CIP/Fee-Related Research $ 52,498,684 $ 17,083,150 $ 35,415,534 Minus Impact Fee Balance $ 1,184, % $ 1,184,928 $ - Grand Total $ 51,313,756 $ 15,898,222 $ 35,415,534 Source: Salt Lake City Parks and Public Lands Division and Impact Fee Study Team. As shown above, the Salt Lake City Parks and Public Lands Division plans to invest approximately $51.3 million in capital facilities over the next ten years, $15.9 million of which is impact fee eligible. The remaining $35.4 million is the result of correcting existing deficiencies in facilities and investing in improved service levels, and is not impact fee eligible. This amount must be funded with revenue sources other than impact fees. To continue the current level of service of 11.2 acres per 1,000, the Division will need to add acres of growth-related parks and open space acreage. These acres will be acquired and 22 FINAL REPORT
43 developed according to the speed and geographic pattern of anticipated growth. The City desires to further increase the level of service for open space. As this is an upgrade or improvement to the current level of service, it cannot be financed with impact fees. Instead, the Division intends to allocate the remaining balance from the Open Space bond ($2.1 million) to achieve this goal. To continue the current level of service for trails and pathways, which are measured in miles instead of acres, the City intends to construct two shared use pathways the Jordan and Salt Lake Canal, and the City Creek Trail. Only a small portion of these projects (10%) is impact fee eligible. This percentage is tied to the historical increase in multi-modal trip generation (i.e., bike traffic) on greenbelts and shared use pathways. The other 90% of the projects will need to be funded with sources other than impact fees. The Division intends to expend approximately $27.9 million over the next ten years to make improvements to existing City parks and facilities. A very small percentage ($393,500 or 1%) of these improvements relate to adding capacity to existing amenities to support anticipated growth. The remainder of the costs for these improvements must come from sources other than impact fees. Improvements to the City s Cemeteries, allocations to the Percent for Art program, cost overruns for repair and replacement projects, and the Parks Recovery Plan are not impact fee eligible. A small percentage (5%) of the Parks, Open Space, and Trails Master Plan, the Jordan River Parkway Master Plan, and the Foothills Recreation and Management Plan is impact fee eligible, as these studies will facilitate Impact Fees Facilities Planning. 7. What impact fee is required to pay for the new capital facilities? The following Exhibit V-3 takes the projected future growth from Exhibits II-1 and II-2, and the impact fee eligible costs from Exhibit V-2 to calculate impact fees for the Division s Parks, Recreation, Open Space and Trails. If the cost of the infrastructure necessary to continue the level of service currently enjoyed by City residents to an additional 8,823 new residents (growth-related IFFP cost of $15.9 million), was divided by the number of households correlated to the new residents (3,803 households), every new household s proportional share of the IFFP cost would be as follows: Exhibit V-3. Salt Lake City Parks, Recreation, Open Space and Trails Impact Fee Calculation Note: (1) From Exhibit V-2. (2) From Exhibit II-2. Source: Salt Lake City Parks and Public Lands Division and Impact Fee Study Team. Amount to Include in Impact Fees 15,898,222 Percent of Future Growth Residential 100% Amount Attributable to Future Land Use Residential $ 15,898,222 Future Growth by Land Use 2 Residential (housing units) 3,803 Calculated Impact Fee Residential (housing units) $ 4, FINAL REPORT
44 The amount per household is close to the current $3,999 investment per household we calculated based on Exhibit V-I of this report. The Division cannot assess fees greater than the amounts shown above. The Division may assess fees lower than these amounts, but would then experience a decline in service levels unless the Division used other revenues to make up the difference. A comparison of current investment, current impact fees and 2012 calculated parks and recreation impact fees is as follows: Residential Unit Current Investment per Unit $3,999 Current Parks, Recreation, Open Space and Trails Impact Fee $ 681 Proposed Parks, Recreation, Open Space and Trails Impact Fee $4, FINAL REPORT
45 Section VI. Roadway (Streets and Transportation) Impact Fees In this section, we calculate impact fees for the Salt Lake City Streets and Transportation Divisions following the seven question method outlined in Section I of this report. 1. Who is currently served by the Salt Lake City Streets and Transportation Divisions? As outlined in Section II, the Salt Lake City Streets and Transportation Divisions currently serve 186,440 residents in 80,362 residential units, and 82,909,311 square feet of non-residential square footage (office, retail, industrial and institutional). Unlike police, fire, and parks fee calculations in which fees are calculated for residential units and nonresidential square feet, roadway fees are calculated for residential and nonresidential land uses based on street and facility usages generated by each land use type. Exhibit VI-1 below shows the specific allocation of existing and projected square feet for Salt Lake City by land use type over the next ten years. Exhibit VI-1. Salt Lake City Growth Projections by Square Feet and Land Use Land Use Square Feet Net Increase in Percent of Square Feet Total Growth Residential 119,766, ,434,426 5,667,781 59% Single-Family 78,284,870 81,989,587 3,704,717 39% Multi-Family 41,481,775 43,444,839 1,963,064 20% Nonresidential 82,909,311 86,832,873 3,923,562 41% Retail 5,019,924 5,255, ,936 3% Office 15,050,719 15,758, ,384 7% Industrial 62,838,668 65,818,909 2,980,241 31% Total 202,675, ,267,299 9,591, % Source: Salt Lake City and Impact Fee Study Team. Based on this distribution, we calculate trip generation based on figures from the Institute of Transportation Engineers Trip Generation Manual. The trip generation figures estimate the number of p.m. peak hour trips generated by particular land uses. Peak hour trips are appropriate for this calculation because street infrastructure is sized according to the expected peak. Since peak hour trips will be used to distribute infrastructure costs, peak hour estimates should be employed. Exhibit VI-2 below presents trip generation rates for land uses in Salt Lake City. 25 FINAL REPORT
46 Exhibit VI-2. Trip Generation Rates by Land Use Category Notes: (1) Reflects weekday traffic generation patterns, weekday p.m. peak hour trip rate formula. (2) Reflects average of office, commercial, retail and industrial land uses, weekday p.m. peak hour trip rate formula. Source: International Transportation Engineering Trip Generation Manual. Trip Generation Land Use Category Relative Weighting 1 Single Family Units 1.0 Multi Family Units 0.7 1,000 retail square feet 5.0 1,000 office square feet 1.3 1,000 industrial square feet What is the current level of service provided by the Salt Lake City Streets and Transportation Division? Salt Lake City s Streets and Transportation Divisions currently provide an average level of service of C within the City roadway network What current assets allow the Salt Lake City Streets and Transportation Division to provide this level of service? The following Exhibit VI-3 summarizes the current capital assets of the Salt Lake City Streets and Transportation Divisions Level-of- Service C describes at or near free-flow operations. Ability to maneuver through lanes is noticeably restricted and lane changes require more driver awareness. Minimum vehicle spacing is about 220ft(67m) or 11 car lengths. At LOS C most experienced drivers are comfortable, roads remain safely below but efficiently close to capacity, and posted speed is maintained. Minor incidents may still have no affect but localized service will have noticeable affects and traffic delays will form behind the incident. This is the targeted LOS for some urban and most rural highways. 18 As vehicles and equipment are not eligible to be purchased with impact fees, these capital items are not included in the above capital facilities inventory. 26 FINAL REPORT
47 Exhibit VI-3. Current Assets Salt Lake City Streets and Transportation Divisions Amount to Replacement Equity Include in Fee Type of Capital Facility Value times % equals Comparison Roadways 1,843 lane miles of roadway $ 1,105,800, % $ 1,105,800,000 Bridges 23 bridges $ 23,000, % $ 23,000,000 Curb and Gutter 4,750,000 lineal feet of curb and gutter $ 199,500, % $ 199,500,000 Sidewalks 20,000,000 sf of sidewalk $ 200,000, % $ 200,000,000 12,000 accessible ramps $ 45,600, % $ 45,600,000 Drive Approaches 7,680,000 sf of concrete drive approaches $ 99,840, % $ 99,840,000 Bike Facilities 83 linear miles of bike lanes incl. in roadway cost 100% Traffic Signals 200 Traffic Signals $ 32,000, % $ 32,000,000 Crosswalk Lights 31 flashing crosswalk lights $ 1,860, % $ 1,860, flashing school crosswalk lights $ 1,975, % $ 1,975,000 Driver Feedback Signs 44 driver feedback signs $ 352, % $ 352,000 Facilities Streets Facility $ 9,250, % $ 9,250,000 Fleet Facility $ 2,520, % $ 2,520,000 Salt Storage $ 1,017, % $ 1,017,405 Total Infrastructure $1,722,714,405 $1,722,714,405 Plus Cost of Fee-Related Research Impact Fee Study Update $11, % $ 11,150 Plus Impact Fee Fund Balance $6,529, % $ 6,529,700 Grand Total $1,729,255,255 $1,729,255,255 Source: Salt Lake City Streets and Transportation Divisions and Impact Fee Study Team. As shown above, the Salt Lake City Streets and Transportation Divisions currently own approximately $1.7 billion of capital assets. These assets are used to provide the Divisions current level of service of C. 4. What is the current investment per unit? By dividing the total replacement value of the current capital assets of the Salt Lake City Streets and Transportation Divisions by the number of current households and non-residential square feet whose owners have invested in these assets, we can determine that the Divisions have invested $10,161 per existing single-family residential unit; $7,113 per existing multi-family residential unit; $50.81 per existing square foot of retail development; $13.21 per existing square foot of office development; and $9.15 per existing square foot of industrial development. We will compare our final impact fee with this figure to determine if the two results will be similar; this represents a check to see if future City residents will be paying for infrastructure at a level commensurate with what existing City residents have invested in infrastructure. 27 FINAL REPORT
48 5. What future growth is expected for the Salt Lake City Streets and Transportation Divisions? As shown in Exhibit II-1, the resident population of the Salt Lake City is projected to increase by 8,823 people over the ten-year planning period. As indicated in Exhibit II-2, this equates to approximately 3,803 new residential units and 3,923,562 new square feet of non-residential square footage. 6. What new infrastructure is required to serve future growth? The Salt Lake City Streets and Transportation Divisions have developed an Impact Fees Facilities Plan (IFFP) that identifies the capital facilities the City will need to build within the next ten years. The following Exhibit VI-4 summarizes the investment the Salt Lake City Streets and Transportation Divisions plan to make in capital facilities over the next ten years to continue its current level of service: Exhibit VI-4. Salt Lake City Streets and Transportation Divisions Impact Fees Facilities Plan Estimated Portion Impact Fee Other Funding Type of Capital Facility Cost times Attributable equals Eligible Sources to Growth Roadway Projects 1300 South Viaduct Rehabilitation $ 10,000,000 0% $ 10,000, /700 South West to 5600 West $ 14,760,000 57% $ 8,413,200 $ 6,346,800 ADA Accessible Ramps $ 1,300,000 0% $ 1,300,000 Sidewalk Rehabilitation/Sawcutting $ 700,000 0% $ 700,000 Deteriorated Sidewalk Replacement $ 1,300,000 0% $ 1,300,000 Indiana Avenue/900 South from Redwood to 3600 West $ 3,640,000 57% $ 2,074,800 $ 1,565,200 Gladiola Street South to 2100 South $ 4,000,000 57% $ 2,280,000 $ 1,720, West from 700 South to 850 South $ 1,600,000 57% $ 912,000 $ 688,000 Street Pavement Overlay and Preservation $ 7,000,000 0% $ 7,000,000 Local Street Reconstruction $ 6,500,000 0% $ 6,500,000 Major Rehabilitation and Reconstruction of City Streets $ 8,360,000 0% $ 8,360,000 Concrete Street Rehabilitation $ 2,000,000 0% $ 2,000,000 Bridge Rehabilitation $ 180,000 0% $ 180,000 Percent for Art $ 500,000 0% $ 500,000 Cost Overruns $ 300,000 0% $ 300,000 $ 62,140,000 $ 13,680,000 $ 48,460,000 Transportation Projects Replacement Traffic Signals $ 2,400,000 0% $ 2,400,000 Pedestrian Safety Devices $ 250,000 10% $ 25,000 $ 225,000 Bike Lane/Pedestrian Improvements - Citywide $ 7,020,000 10% $ 702,000 $ 6,318,000 New Traffic Signals $ 1,440, % $ 1,440,000 $ East Traffic Safety - Phase 2 $ 500,000 0% $ 500,000 Street Lighting Replacement $ 200,000 0% $ 200,000 $ 11,810,000 $ 2,167,000 $ 9,643,000 Total Infrastructure $73,950,000 $ 15,847,000 $ 58,103,000 Plus Cost of Fee-Related Research Impact Fee Study $ 11, % $ 11,150 $ - Transportation Master Plan $ 200,000 10% $ 20,000 $ 180,000 Minus Impact Fee Balance $ 5,441, % $ 5,441,542 $ - Grand Total $68,719,608 $ 10,436,608 $ 58,283,000 Source: Salt Lake City Streets and Transportation Divisions and Impact Fee Study Team. 28 FINAL REPORT
49 As shown above, the Salt Lake City Streets and Transportation Divisions plan to invest approximately $68.7 million in capital facilities over the next ten years, $10.4 million of which is impact fee eligible. The remaining $58.3 million is the result of correcting an existing deficiency in available space and investing in improved service levels, and is not impact fee eligible. This amount must be funded with revenue sources other than impact fees. The only major roadway projects that are impact fee eligible are four projects within the Westside Industrial Area 500/700 South from 2800 West to 5600 West; Indiana Avenue/900 South from Redwood to 3600 West; Gladiola from 1650 South to 2100 South; and 4400 West from 700 South to 850 South. 57% of each of these projects is impact fee eligible, as this is the percent of each project related to the widening and expansion of each roadway for projected growth. The remainder of these projects costs must be funded from sources other than impact fees. 100% of new traffic signals are impact fee eligible, as these facilities would not be installed were it not for growth-related congestion at various intersections. The growth-related portion of facilities such as pedestrian safety devices and bike lane installations are impact fee eligible as well. As indicated in Exhibit VI-1, 59% of new growth over the next ten years is anticipated to be residential development, while the remaining 41% is anticipated to be non-residential development. As indicated in Exhibit VI-5 below, of the $9.5 million in impact fee eligible projects, approximately $1.4 million is associated with growth-related demand citywide from residential uses. This represents 59% of the growth-related costs of all transportation projects, including the Transportation Master Plan and Impact Fee Study. No part of the four Westside roadway projects is attributed to residential growth. The remaining $8.1 million represents growth-related demand citywide from non-residential uses. This includes 41% of the growth-related costs of all transportation projects, including the Transportation Master Plan and Impact Fee Study, as well as 100% of the growth-related costs of the four Westside roadway projects. The four Westside roadway projects primarily benefit nonresidential uses by providing infrastructure to connect products, employees, and freight to other parts of the City. Exhibit VI-5. Distribution of IFFP Costs by Development Type Impact Fee Project Allocation Residential Non-Residential $ 1,296,909 $ 9,139,700 Total $ 10,436,608 Exhibits VI-7 and VI-8 identify how these costs can be most appropriately recovered through separate residential and non-residential roadway impact fees. 29 FINAL REPORT
50 7. What impact fee is required to pay for the new capital facilities? As noted above, the calculation of roadway impact fees is based on the projected number of trips each land-use type will generate in the next ten years. Using the current land use by square foot within Salt Lake City found in Exhibit VI-1, and the trip generation figures from Exhibit VI-2, total current trips can be distributed to each land use. Exhibit VI-6 below displays the projected trip generation distribution. Exhibit VI-6. Salt Lake City Distribution by Weighted Trip Generation Current Weighted Trip New Weighted Trip Land Use Development Generation Factors Percent Development Generation Factors Percent Single Family Units (*1.0) 42,270 42,270 25% 2,000 2,000 25% Multi Family Units (*0.7) 38,092 26,664 16% 1,803 1,262 16% Retail Square Feet (*5.0/1,000 sf) 5,019,924 25,100 15% 235,896 1,179 15% Office Square Feet (*1.3/1,000 sf) 15,050,719 19,566 11% 707, % Industrial Square Feet (*0.9/1,000 sf) 62,868,338 56,582 33% 2,950,812 2,656 33% Total 170,182 8, % Source: Salt Lake City and Impact Fee Study Team. As shown above, the number of daily trips in Salt Lake City is expected to increase by approximately 8,017 trips by % of those trips will be for single-family residential uses; 16% will be for multi-family residential uses; 15% will be for retail uses; 11% will be for office uses; and 33% will be for industrial uses. Exhibits VI-7 and VI-8 below use the distribution of the IFFP by weighted trip generation figures from Exhibit VI-6 and the growth-related IFFP from Exhibit VI-4 to calculate roadway impact fees for the Salt Lake City Streets and Transportation Divisions. Exhibit VI-7 relates to the portion of the IFFP that represents the trip demand generated by new residential development citywide. 30 FINAL REPORT
51 Exhibit VI-7. Salt Lake City Residential Roadway Fee Calculation Note: (1) From Exhibit VI-4; 59% of the growthrelated costs of all transportation projects and studies. (2) From Exhibit II-2. Source: Impact Fee Study Team. Amount to Include in Impact Fees 1,296,909 Percent of Future Trips Residential Single Family 65% Multi Family 35% Allocated Value by Land Use Category Residential Single Family $ 847,718 Multi Family $ 449,191 Future Land Uses 2 Residential (total dwelling units) Single Family 2,000 Multi Family 1,803 Calculated Impact Fee Residential (per dwelling unit) Single Family $ 424 Multi Family $ 249 The amount per household is less than the current $10,161 per single family residential unit and $7,113 per multi-family residential unit investment per household we calculated based on Exhibit VI-3 of this report. This confirms that new residential growth is not being asked to contribute more to continue the current service level than existing residents have already invested in the current system. Exhibit VI-8 relates to the portion of the IFFP that represents the trip demand generated by new non-residential development citywide. 31 FINAL REPORT
52 Exhibit VI-8. Salt Lake City Non- Residential Roadway Fee Calculation Note: (1) From Exhibit VI-4; 100% of roadway projects in Westside Industrial Area, plus 41% of all transportation projects. Credited 100% of impact fee fund balance as these revenues was paid into the City by non-residential development. (2) From Exhibit II-2. Source: Impact Fee Study Team. Amount to Include in Impact Fees 9,139,700 Percent of Future Trips Nonresidential Retail 8% Office 18% Industrial 74% Allocated Value by Land Use Category Nonresidential Retail $ 773,024 Office $ 1,647,808 Industrial $ 6,740,554 Future Land Uses 2 Nonresidential (in square feet) Retail 235,936 Office 707,384 Industrial 2,980,241 Calculated Impact Fee Non-Residential (per square foot) Retail $ 3.28 Office $ 2.33 Industrial $ 2.26 The amount per square foot is less than the current $50.81 per square foot investment for retail development, $13.21 per square foot investment for office development, and $9.15 per square foot investment for industrial development we calculated based on Exhibit VI-I of this report. This confirms that new non-residential growth is not being asked to contribute more to continue the current service level than existing residents have already invested in the current system. The Divisions cannot assess fees greater than the amounts shown above. The Divisions may assess fees lower than these amounts, but would then experience a decline in service levels unless the Division used other revenues to make up the difference. A comparison of current investment, current impact fees and 2012 calculated roadways impact fees is as follows: Residential Unit Current Investment per Single Family Unit $10,161 Current Investment per Multi Family Unit $ 7,113 Current Roadways Impact Fee no fee is currently in effect Proposed Residential Roadways Impact Fee $ 424 Proposed Residential Roadways Impact Fee $ FINAL REPORT
53 Non-Residential Square Foot Current Retail Investment per Square Foot $50.81 Current Office Investment per Square Foot $13.21 Current Industrial Investment per Square Foot $9.15 Current Retail Roadway Fee per Square Foot $8.62 Current Office Roadway Fee per Square Foot $4.20 Current Industrial Roadway Fee Square Foot $2.00 Proposed Retail Roadways Impact Fee $3.28 Proposed Office Roadways Impact Fee $2.33 Proposed Industrial Roadways Impact Fee $2.26 The significant decrease in non-residential impact fee is related to the changing nature of the Streets and Transportation Division s growth-related Impact Fees Facilities Plans. As the City addresses future congestion created by growth, it has few options to widen or extend existing roads. Instead, it must consider the incremental modal shift by residents and commuters from vehicles to bikes, and create capacity for these alternative transportation forms as well. These capacity-creating capital facilities benefit all land uses, residential and non-residential alike. Therefore, the City has determined it is appropriate to spread the cost of these facility improvements among all land uses. Residential uses will be assessed a modest fee to recover their proportional share of the growth-related portion of the Impact Fees Facilities Plan, and nonresidential roadway fees will be reduces as the total cost is spread over more users. 33 FINAL REPORT
54 Section VII. Summary The following Exhibit VII-1 summarizes the Fire, Police, Parks and Roadways Impact Fees for Salt Lake City. Exhibit VII-1. Salt Lake City Impact Fee Summary Fire Residential (per dwelling unit) $ 119 Nonresidential (per square foot) $ 0.32 Police Residential (per dwelling unit) $ 41 Nonresidential (per square foot) $ 0.03 Parks Residential (total dwelling units) $ 4,180 Nonresidential (per square foot) $ - Roadways Residential (per dwelling unit) Single Family $ 424 Multi Family $ 249 Commercial (per square foot) Retail $ 3.28 Office $ 2.33 Industrial $ 2.26 TOTAL FEES Residential (per dwelling unit) Single Family $ 4,764 Multi Family $ 4,589 Commercial (per square foot) Retail $ 3.63 Office $ 2.68 Industrial $ 2.61 The current impact fees being assessed by Salt Lake City to new development are identified in Exhibit VII-2 below: 34 FINAL REPORT
55 Exhibit VII-2. Salt Lake City Current Impact Fee Summary Fire Residential (per dwelling unit) $ 485 Nonresidential (per square foot) $ 0.32 Police Residential (per dwelling unit) $ 452 Nonresidential (per square foot) $ 0.30 Parks Residential (total dwelling units) $ 681 Nonresidential (per square foot) $ - Roadways Residential (per dwelling unit) Single Family $ - Multi Family $ - Commercial (per square foot) Retail $ 8.62 Office $ 4.20 Industrial $ 2.00 TOTAL FEES Residential (per dwelling unit) Single Family $ 1,618 Multi Family $ 1,618 Commercial (per square foot) Retail $ 9.24 Office $ 4.82 Industrial $ 2.62 City Participation Not all of the capital facilities listed in the IFFPs are 100 percent growth-related. Many projects are not growth related at all, and a few projects are only partially growth-related. The City would assume the responsibility of paying for the non-growth portions of these capital facilities. These payments would come from other sources of revenue such as general funds, state revenuesharing, federal grants, user fees, bond proceeds, etc. To arrive at this participation amount, the expected impact fee revenue and any shared facility amount needs to be subtracted from the total IFFP value. Exhibit VII-3 divides the City s participation amount into two categories: Required the non-growth portion of partially impact fee eligible projects. This amount must be funded in order to maintain the integrity of the impact fee program. Discretionary strictly non-growth related facilities. The City is not under any obligation to fund these capital facilities within a certain timeframe (although this could result in a decrease in the level of service over time). 35 FINAL REPORT
56 Exhibit VII-3. Salt Lake City IFFP Participation Summary, Source: Salt Lake City and Impact Fee Study Team. Required Discretionary Total Fire $ 8,467,000 $0 $ 8,467,000 Police $ 6,750,000 $0 $ 6,750,000 Parks $4,967,500 $31,495,200 $ 36,462,700 Roadways $ 17,043,000 $ 41,240,000 $ 58,283,000 Total $ 22,010,500 $ 72,735,200 $ 94,745,700 The total amount the City would be required to contribute over 10 years, should the City adopt impact fees at the calculated amount, will be approximately $22.0 million. The remaining $72.8 million will be necessary for the City to fund in order to complete the 10-Year IFFP, but can be considered discretionary. Implementation Recommendations As City Council evaluates whether or not to adopt the Impact Fees Facilities Plans and impact fees presented in this report, we also offer the following information for your consideration. Please note that this information will be included in the amended impact fee enabling ordinance. Specialized assessments. If permit applicants are concerned they would be paying more than their fair share of future infrastructure purchases, the applicant can request an individualized assessment to ensure they will only be paying their proportional share. The applicant would be required to prepare and pay for all costs related to such an assessment. Donations. If the City receives donations for capital facilities listed on the IFFP, they must account for the donation in one of two ways. If the donation is for a non- or partially growth-related facility, the donation can contribute to the City s General Fund participation along with more traditional forms, such as revenue transfers from the General Fund. If, however, the donation is for a growth-related project in the IFFP, the donor s impact fees should be reduced dollar for dollar. This means that the City will either credit the donor or reimburse the donor for that portion of the impact fee. Credit/reimbursement. If a developer constructs or contributes all or part of a growth-related project that would otherwise be financed with impact fees, that developer must receive a credit against the fees owed for this category. This prevents double dipping by the City. The presumption would be that builders/developers owe the entirety of the impact fee amount until they make the City aware of the construction or contribution. If credit or reimbursement is due, the governmental entity must enter into an agreement with the fee payer that specifies the amount of the credit or the amount, time and form of reimbursement. Impact fee accounting. The City should maintain Impact Fee Funds separate and apart from the General Fund. All current and future impact fee revenue should be immediately deposited into this account and withdrawn only to pay for growth-related capital facilities of the same category. 36 FINAL REPORT
57 General Funds should be reserved solely for the receipt of tax revenues, grants, user fees and associated interest earnings, and ongoing operational expenses including the repair and replacement of existing capital facilities not related to growth. Spending policy. The City should establish and adhere to a policy governing their expenditure of monies from the Impact Fee Fund. The Fund should be prohibited from paying for any operational expenses and the repair and replacement or upgrade of existing infrastructure not necessitated by growth. In cases when growth-related capital facilities are constructed, impact fees are an allowable revenue source as long as only new growth is served. In cases when new capital facilities are expected to partially replace existing capacity and to partially serve new growth, cost sharing between the General Fund or other sources of revenue Impact Fee Fund should be allowed on a pro rata basis. Update procedures. The fees calculated in this study can be updated as the City monitors the future development patterns. Fees can be updated on an annual basis using an inflation factor for building material from a reputable source such as McGraw Hill s Engineering News Record. Certification. As required by Utah Code 11-36a-306: "I certify that the attached Impact Fee Facilities Plan includes only the costs of public facilities that are allowed under the Impact Fees Act and actually incurred or projected to be incurred or encumbered within six years after the day on which each impact fee is paid. The Impact Fee Facilities Plan does not include costs of operation and maintenance of public facilities; costs for qualifying public facilities that will raise the level of service for the facilities, through impact fees, above the level of service that is supported by existing residents; an expense for overhead, unless the expense is calculated pursuant to a methodology that is consistent with generally accepted cost accounting practices and the methodological standards set forth by the federal Office of Management and Budget for federal grant reimbursement; and complies in each and every relevant respect with the Impact Fees Act." "I certify that the attached impact fee analysis includes only the costs of public facilities that are allowed under the Impact Fees Act and actually incurred or projected to be incurred or encumbered within six years after the day on which each impact fee is paid. The Impact Fee Analysis does not include costs of operation and maintenance of public facilities; costs for qualifying public facilities that will raise the level of service for the facilities, through impact fees, above the level of service that is supported by existing residents; an expense for overhead, unless the expense is calculated pursuant to a methodology that is consistent with generally accepted cost accounting practices and the methodological standards set forth by the federal Office of Management and Budget for federal grant reimbursement; offsets costs with grants or other alternate sources of payment; and complies in each and every relevant respect with the Impact Fees Act." Anne Wescott, President Galena Consulting 37 FINAL REPORT
58 Salt Lake City - Sources and Uses Impact Fees Facilities Plan Fiscally Constrained SOURCES FY11-12 FY12-13 FY13-14 FY14-15 FY15-16 FY16-17 FY17-18 FY18-19 FY19-20 FY year totals On-Going General Fund Contribution - 7% $ 13,543,847 $ 13,723,562 $ 14,135,269 $ 14,559,327 $ 14,996,107 $ 15,445,990 $ 15,909,370 $ 16,386,65 16,878,250 $ 17,384,598 $ 152,962,971 Ongoing General Fund Revenues $ 13,543,847 $ 13,723,562 $ 14,135,269 $ 14,559,327 $ 14,996,107 $ 15,445,990 $ 15,909,370 $ 16,386,65 16,878,250 $ 17,384,598 $ 152,962,971 Impact Fees (including current fund balances) $ 3,420,000 $ 8,060,589 $ 4,477,389 $ 4,207,389 $ 2,271,989 $ 2,939,289 $ 3,059,289 $ 5,824,889 $ 3,191,889 $ 2,913,889 $ 40,366,600 Open Space Bond Fund Balance $ 750,000 $ 750,000 $ 600,000 $ 2,100,000 Class C CIP Funds $ 2,400,000 $ 2,400,000 $ 2,400,000 $ 2,400,000 $ 2,400,000 $ 2,400,000 $ 2,400,000 $ 2,400,000 $ 2,400,000 $ 2,400,000 $ 24,000,000 CDBG CIP Funds $ 1,304,175 $ 1,100,000 $ 1,100,000 $ 1,100,000 $ 1,100,000 $ 1,100,000 $ 1,100,000 $ 1,100,000 $ 1,100,000 $ 1,100,000 $ 11,204,175 Facilities - Fleet Bond Revenue $ 1,264,29 - $ 1,264,291 Grants for Shared Use Pathw ays $ 250,000 $ 250,000 Streets Viaduct Match-already in CIP account $ 200,000 $ 200,000 Federal Grant - FHWA $ 9,320,000 $ 9,320,000 Sale of Public Safety/Evidence Property $ 6,000,000 $ 5,000,000 $ 11,000,000 Total General Fund Revenues $ 20,668,022 $ 36,818,442 $ 28,862,658 $ 27,866,716 $ 20,768,096 $ 21,885,279 $ 22,468,659 $ 25,961,540 $ 23,570,139 $ 23,798,487 $ 252,668,037 USES FY11-12 FY12-13 FY13-14 FY14-15 FY15-16 FY16-17 FY17-18 FY18-19 FY19-20 FY year totals Debt Service Sales Tax Bonds $ 3,757,013 $ 4,161,854 $ 4,401,174 $ 2,930,705 $ 6,864,51 9,354,07 9,342,669 $ 9,333,578 $ 9,332,520 $ 9,337,67 68,815,766 CAM Bond Issuance - estimated/placeholder Parking Pay Stations $ 665,780 $ 665,780 $ 665,780 $ 665,780 $ 665,780 $ 665,780 $ 665,780 $ 4,660,460 Streetcar $ 250,000 $ 250,000 $ 250,000 $ 250,000 $ 250,000 $ 250,000 $ 250,000 $ 250,000 $ 250,000 $ 2,250,000 Pay Station Test $ 291,777 $ 291,777 UPAC BAN $ 262,000 $ 262,000 $ 524,000 Remainder of CAM Bond Issuance Placeholder $ 2,408,223 $ 1,322,220 $ 1,322,220 $ 1,584,220 $ 1,584,220 $ 1,584,220 $ 1,584,220 $ 1,584,220 $ 2,250,000 $ 2,250,000 $ 17,473,763 Ongoing Debt Service $ 6,457,013 $ 6,661,854 $ 6,901,174 $ 5,430,705 $ 9,364,51 11,854,07 11,842,669 $ 11,833,578 $ 11,832,520 $ 11,837,67 94,015,766 Capital Projects Fire $ 550,000 $1,000,000 $ 6,000,000 $ 2,500,000 $ 2,000,000 $ 1,550,000 $ 13,600,000 Police $ 5,000,000 $ 4,000,000 $ 9,000,000 Parks and Open Space $ 2,159,174 $ 5,759,849 $ 7,086,389 $ 7,679,589 $ 4,829,589 $ 4,904,589 $ 5,229,589 $ 4,529,589 $ 5,629,589 $ 3,879,589 $ 51,687,534 Streets $ 8,981,709 $ 14,888,300 $ 5,753,850 $ 4,980,229 $ 4,797,029 $ 3,741,479 $ 4,468,379 $ 5,912,729 $ 3,109,729 $ 4,706,570 $ 61,340,000 Transportation $ 1,190,000 $ 2,785,000 $ 2,965,000 $ 2,615,000 $ 345,000 $ 510,000 $ 320,000 $ 480,000 $ 320,000 $ 480,000 $ 12,010,000 Facilities - ongoing $ 490,000 $ 390,000 $ 390,000 $ 390,000 $ 390,000 $ 390,000 $ 390,000 $ 390,000 $ 390,000 $ 390,000 $ 4,000,000 Facilities - discretionary $ 1,227,539 $ 623,439 $ 606,245 $ 611,193 $ 837,367 $ 325,140 $ 58,022 $ 155,644 $ 128,302 $ 794,657 $ 5,367,548 CIP/Impact Fee Update $ 44,600 $ 44,600 Percent for Art $ 130,000 $ 100,000 $ 100,000 $ 100,000 $ 100,000 $ 100,000 $ 100,000 $ 100,000 $ 100,000 $ 100,000 $ 1,030,000 Overruns $ 32,587 $ 60,000 $ 60,000 $ 60,000 $ 60,000 $ 60,000 $ 60,000 $ 60,000 $ 60,000 $ 60,000 $ 572,587 Ongoing General Fund Expenditures $ 14,211,009 $ 30,156,588 $ 21,961,484 $ 22,436,010 $ 11,403,584 $ 10,031,207 $ 10,625,989 $ 14,127,96 11,737,619 $ 11,960,815 $ 158,652,269 Total General Fund Capital Expenditures $ 20,668,022 $ 36,818,442 $ 28,862,658 $ 27,866,715 $ 20,768,095 $ 21,885,278 $ 22,468,658 $ 25,961,539 $ 23,570,139 $ 23,798,486 $ 252,668,035 difference $ (0) $ 0 $ (0) $ 0 $ 0 $ 0 $ 0 $ 0 $ (0) $ 0 $ 1
59 Salt Lake City - All Departments Impact Fees Facilities Plan Fiscally Constrained CIP Approved Value FY11-12 FY12-13 FY13-14 FY14-15 FY15-16 FY16-17 FY17-18 FY18-19 FY19-20 FY year total Fire $ 13,600,000 $ 550,000 $ 1,000,000 $ 6,000,000 $ 2,500,000 $ 2,000,000 $ 1,550,000 $ 13,600,000 Police $ 9,000,000 $ 5,000,000 $ 4,000,000 $ 9,000,000 Parks and Open Space $ 51,687,534 $ 2,159,174 $ 5,759,849 $ 7,086,389 $ 7,679,589 $ 4,829,589 $ 4,904,589 $ 5,229,589 $ 4,529,589 $ 5,629,589 $ 3,879,589 $ 51,687,534 Streets $ 61,340,000 $ 8,981,709 $ 14,888,300 $ 5,753,850 $ 4,980,229 $ 4,797,029 $ 3,741,479 $ 4,468,379 $ 5,912,729 $ 3,109,729 $ 4,706,570 $ 61,340,000 Transportation $ 12,010,000 $ 1,190,000 $ 2,785,000 $ 2,965,000 $ 2,615,000 $ 345,000 $ 510,000 $ 320,000 $ 480,000 $ 320,000 $ 480,000 $ 12,010,000 Facilities $ 9,367,549 $ 1,717,539 $ 1,000,000 $ 1,000,000 $ 1,000,000 $ 1,227,367 $ 715,140 $ 448,022 $ 545,644 $ 518,302 $ 1,195,535 $ 9,367,549 CIP/Impact Fee Update $ 44,600 $ 44,600 $ 44,600 Percent for Art $ 1,030,000 $ 130,000 $ 100,000 $ 100,000 $ 100,000 $ 100,000 $ 100,000 $ 100,000 $ 100,000 $ 100,000 $ 100,000 $ 1,030,000 Overruns $ 572,587 $ 32,587 $ 60,000 $ 60,000 $ 60,000 $ 60,000 $ 60,000 $ 60,000 $ 60,000 $ 60,000 $ 60,000 $ 572,587 Sub-Total $ 158,652,270 $ 14,211,009 $ 30,143,149 $ 21,965,239 $ 22,434,817 $ 11,403,584 $ 10,031,207 $ 10,625,989 $ 14,127,96 11,737,619 $ 11,971,693 $ 158,652,270 Major Capital Items TBD $ - $ 158,652,270 $ 14,211,009 $ 30,143,149 $ 21,965,239 $ 22,434,817 $ 11,403,584 $ 10,031,207 $ 10,625,989 $ 14,127,96 11,737,619 $ 11,971,693 $ 158,652,270
60 Salt Lake City - All Departments Impact Fees Facilities Plan Fiscally Constrained CIP Impact Fee Other Funding Funding Sources - Detail Value Eligible Sources General Fund Class C CDBG Impact Fees FHWA Other Total 7% Fire $ 13,600,000 $ 5,133,000 $ 8,467,000 $ 3,467,000 $ 5,133,000 $ 5,000,000 $ 13,600,000 Police $ 9,000,000 $ 2,250,000 $ 6,750,000 $ 750,000 $ 2,250,000 $ 6,000,000 $ 9,000,000 Parks and Open Space $ 51,687,534 $ 17,072,000 $ 34,615,534 $ 26,965,534 $ 5,300,000 $ 17,072,000 $ 2,350,000 $ 51,687,534 Streets $ 61,340,000 $ 13,680,000 $ 47,660,000 $ 9,335,825 $ 24,000,000 $ 4,804,175 $ 13,680,000 $ 9,320,000 $ 200,000 $ 61,340,000 Transportation $ 12,010,000 $ 2,187,000 $ 9,823,000 $ 9,823,000 $ 2,187,000 $ 12,010,000 Facilities $ 9,367,549 $ 9,367,549 $ 8,103,258 $ 1,264,29 9,367,549 CIP/Impact Fee Update $ 44,600 $ 44,600 $ 44,600 $ 44,600 Percent for Art $ 1,030,000 $ 1,030,000 $ 400,000 $ 630,000 $ 1,030,000 Overruns $ 572,587 $ 572,587 $ 102,587 $ 470,000 $ 572,587 Sub-Total $ 158,652,270 $ 40,366,600 $ 118,285,670 $ 58,947,204 $ 24,000,000 $ 11,204,175 $ 40,366,600 $ 9,320,000 $ 14,814,29 158,652,270 Major Capital Items TBD $ 158,652,270 $ 40,366,600 $ 118,285,670 $ 58,947,204 $ 24,000,000 $ 11,204,175 $ 40,366,600 $ 9,320,000 $ 14,814,29 158,652,270 This summary does not include existing Debt Service: See Sources and Uses tab General Fund Class C CDBG Impact Fees FHWA Other Total available after debt service $ 58,947,204 $ 24,000,000 $ 11,204,175 $40,366,600 $ 9,320,000 $ 14,814,29 158,652,270 difference $ 0 $ 0
61 Salt Lake City Fire Department Impact Fees Facilities Plan Fiscally Constrained Square Land Estimated Portion Impact Fee Other Type of Capital Facility Feet Acreage Cost Attributable Eligible Funding to Growth Sources Facilities 2013 Fire Station #3 - Relocation and Expansion; Land Acquisition $ 1,500,000 33% $ 495,000 $ 1,005, Fire Station #3 - Relocation and Expansion; Construction 15, $ 6,000,000 33% $ 1,980,000 $ 4,020, Fire Station #14 15, $ 5,100,000 33% $ 1,683,000 $ 3,417,000 Apparatus 2021 Truck for Fire Station #14 to serve Southwest growth $ 950, % $ 950,000 Total Infrastructure $ 13,550,000 $ 5,108,000 $ 8,442,000 Plus Cost of Fee-Related Research Impact Fee Study $ 11, % $ 11,150 Standards of Cover Study $ 50,000 50% $ 25,000 $ 25,000 Minus Impact Fee Fund Balance $ 3,427,416 $ 3,427,416 Grand Total $ 10,183,734 $ 1,716,734 $ 8,467,000 Notes: Impact Fee Fund Balance as of 3/1/12
62 Salt Lake City Police Department Impact Fees Facilities Plan Fiscally Constrained Square Acreage Estimated Portion Impact Fee Other Funding Type of Capital Facility Feet Cost Attributable Eligible Sources to Growth Facilities 2014 Police Evidence and Crime Lab Facility 100, $ 9,000,000 25% $ 2,250,000 $ 6,750,000 Total Infrastructure $ 9,000,000 $ 2,250,000 $ 6,750,000 Plus Cost of Fee-Related Research Impact Fee Study $ 11, % $ 11,150 Minus Impact Fee Fund Balance $ 1,998,649 $ 1,998,649 Grand Total $ 7,012,501 $ 262,50 6,750,000
63 Salt Lake City Parks Division Impact Fees Facilities Plan Fiscally Constrained Acres/ Estimated Approved Portion Impact Fee Other Funding Type of Capital Facility Miles Cost FY11-12 FY12-13 FY13-14 FY14-15 FY15-16 FY16-17 FY17-18 FY18-19 FY19-20 FY year total times Attributable equals Eligible Sources to Growth Parks/Open Space Acquisition and Development Additional acres of developed parks to continue current level of service for growth ,603,000 $ 1,733,667 $ 1,733,667 $ 1,733,667 $ 1,733,667 $ 1,733,667 $ 1,733,667 $ 1,733,667 $ 1,733,667 $ 1,733,667 $ 15,603,000 $ $ 100% $ 15,603,000 - $ 100% $ 543,000 Additional acres of open space to continue current level of service for growth ,000 $ 60,333 $ 60,333 $ 60,333 $ 60,333 $ 60,333 $ 60,333 $ 60,333 $ 60,333 $ 60,333 $ 543,000 $ 0% Additional non growth-related open space acquisition TBD 2,100,000 $ 750,000 $ 750,000 $ 600,000 $ 2,100,000 $ 2,100,000 Trail/Shared Use Pathway Development Jordan and Salt Lake (McClelland) Canal Shared Use Pathway 4,000,000 $ 500,000 $ 500,000 $ 1,500,000 $ 1,500,000 $ 4,000,000 $ $ 10% $ 400,000 3,600,000 $ 10% $ 120,000 1,080,000 City Creek Trail 1,200,000 $ 750,000 $ 450,000 $ 1,200,000 $ Improvements to Existing Parks - Specific projects to be determined on an annual basis Includes playgrounds, restrooms, fields, courts, paths, pavilions, plazas, off-leash dog parks skate parks, BMX/bike parks, irrigation and landscaping, and other miscellaneous improvements Playground Improvements 1,816,200 $ 116,200 $ 150,000 $ 193,750 $ 193,750 $ 193,750 $ 193,750 $ 193,750 $ 193,750 $ 193,750 $ 193,750 $ 1,816,200 $ $ 0% 1,816,200 Restroom Improvements 3,000,000 $ 25,000 $ 275,000 $ 375,000 $ 375,000 $ 375,000 $ 375,000 $ 375,000 $ 325,000 $ 375,000 $ 125,000 $ 3,000,000 $ $ 11% $ 300,000 2,700,000 Multipurpose Field Improvements 950,000 $ 118,750 $ 118,750 $ 118,750 $ 118,750 $ 118,750 $ 118,750 $ 118,750 $ 118,750 $ 950,000 $ $ 0% 950,000 Basketball Improvements 150,000 $ 16,667 $ 16,667 $ 16,667 $ 16,667 $ 16,667 $ 16,667 $ 16,667 $ 16,667 $ 16,667 $ 150,000 $ $ 0% 150,000 Tennis Court Improvements 4,613,400 $ 130,500 $ 457,900 $ 875,000 $ 1,400,000 $ 700,000 $ 700,000 $ 350,000 $ 4,613,400 $ $ 0% 4,613,400 Volleyball Court Improvements 70,000 $ 7,778 $ 7,778 $ 7,778 $ 7,778 $ 7,778 $ 7,778 $ 7,778 $ 7,778 $ 7,778 $ 70,000 $ $ 0% 70,000 Softball Field Improvements 400,000 $ 44,444 $ 44,444 $ 44,444 $ 44,444 $ 44,444 $ 44,444 $ 44,444 $ 44,444 $ 44,444 $ 400,000 $ $ 0% 400,000 Baseball Field Improvements 1,400,000 $ 155,556 $ 155,556 $ 155,556 $ 155,556 $ 155,556 $ 155,556 $ 155,556 $ 155,556 $ 155,556 $ 1,400,000 $ $ 0% 1,400,000 Jogging/Walking Path Improvements 501,608 $ 410,608 $ 91,000 $ 501,608 $ $ 3% $ 16, ,608 Pavilion Improvements 1,200,000 $ 133,333 $ 133,333 $ 133,333 $ 133,333 $ 133,333 $ 133,333 $ 133,333 $ 133,333 $ 133,333 $ 1,200,000 $ $ 0% 1,200,000 Plaza Improvements 1,200,000 $ 133,333 $ 133,333 $ 133,333 $ 133,333 $ 133,333 $ 133,333 $ 133,333 $ 133,333 $ 133,333 $ 1,200,000 $ $ 4% $ 50,000 1,150,000 Off-Leash Dog Park Improvements 500,000 $ 250,000 $ 35,714 $ 35,714 $ 35,714 $ 35,714 $ 35,714 $ 35,714 $ 35,714 $ 500,000 $ $ 3% $ 12, ,500 Skate Park Improvements 700,000 $ 77,778 $ 77,778 $ 77,778 $ 77,778 $ 77,778 $ 77,778 $ 77,778 $ 77,778 $ 77,778 $ 700,000 $ $ 0% 700,000 BMX/Bike Park Improvements 300,000 $ 33,333 $ 33,333 $ 33,333 $ 33,333 $ 33,333 $ 33,333 $ 33,333 $ 33,333 $ 33,333 $ 300,000 $ $ 5% $ 15, ,000 Miscellaneous Amenities Drinking Fountains $ 70,000 $ 7,778 $ 7,778 $ 7,778 $ 7,778 $ 7,778 $ 7,778 $ 7,778 $ 7,778 $ 7,778 $ 70,000 0% $ 70,000 Picnic Tables $ 240,000 $ 26,667 $ 26,667 $ 26,667 $ 26,667 $ 26,667 $ 26,667 $ 26,667 $ 26,667 $ 26,667 $ 240,000 0% $ 240,000 Horseshoes $ 15,000 $ 1,667 $ 1,667 $ 1,667 $ 1,667 $ 1,667 $ 1,667 $ 1,667 $ 1,667 $ 1,667 $ 15,000 0% $ 15,000 Water Features $ 250,000 $ 27,778 $ 27,778 $ 27,778 $ 27,778 $ 27,778 $ 27,778 $ 27,778 $ 27,778 $ 27,778 $ 250,000 0% $ 250,000 Bridges $ 250,000 $ 250,000 $ 250,000 0% $ 250,000 Bleachers $ 112,000 $ 12,444 $ 12,444 $ 12,444 $ 12,444 $ 12,444 $ 12,444 $ 12,444 $ 12,444 $ 12,444 $ 112,000 0% $ 112,000 Benches $ 90,000 $ 10,000 $ 10,000 $ 10,000 $ 10,000 $ 10,000 $ 10,000 $ 10,000 $ 10,000 $ 10,000 $ 90,000 0% $ 90,000 Earthen Trails $ 375,223 $ 150,223 $ 25,000 $ 25,000 $ 25,000 $ 25,000 $ 25,000 $ 25,000 $ 25,000 $ 25,000 $ 25,000 $ 375,223 0% $ 375,223 Concessions $ 500,000 $ 55,556 $ 55,556 $ 55,556 $ 55,556 $ 55,556 $ 55,556 $ 55,556 $ 55,556 $ 55,556 $ 500,000 0% $ 500,000 Other Improvements Landscaping 2,305,000 $ 256,111 $ 256,111 $ 256,111 $ 256,111 $ 256,111 $ 256,111 $ 256,111 $ 256,111 $ 256,111 $ 2,305,000 $ $ 0% 2,305,000 $ 0% 694,770 Lighting 694,770 $ 102,710 $ 232,060 $ 45,000 $ 45,000 $ 45,000 $ 45,000 $ 45,000 $ 45,000 $ 45,000 $ 45,000 $ 694,770 $ $ 0% 2,394,220 Irrigation 2,394,220 $ 616,820 $ 500,000 $ 182,486 $ 182,486 $ 182,486 $ 182,486 $ 182,486 $ 182,486 $ 182,486 $ 2,394,220 $ $ 0% 350,000 Fencing 350,000 $ 38,889 $ 38,889 $ 38,889 $ 38,889 $ 38,889 $ 38,889 $ 38,889 $ 38,889 $ 38,889 $ 350,000 $ $ 0% 1,182,020 Asphalt 1,182,020 $ 295,020 $ 98,556 $ 98,556 $ 98,556 $ 98,556 $ 98,556 $ 98,556 $ 98,556 $ 98,556 $ 98,556 $ 1,182,020 $ $ 0% 312,093 Signage 312,093 $ 312,093 $ 312,093 $ Cemetery 2,000,000 $ 222,222 $ 222,222 $ 222,222 $ 222,222 $ 222,222 $ 222,222 $ 222,222 $ 222,222 $ 222,222 $ 2,000,000 $ $ 0% 2,000,000 Total Improvements to Existing Parks $ 27,941,534 $ 2,159,174 $ 2,590,849 $ 3,992,389 $ 3,735,589 $ 3,035,589 $ 3,035,589 $ 2,685,589 $ 2,285,589 $ 2,335,589 $ 2,085,589 $ 27,941,534 $ 393,500 $ 27,548,034 Percent for Art 500,000 $ 65,000 $ 48,333 $ 48,333 $ 48,333 $ 48,333 $ 48,333 $ 48,333 $ 48,333 $ 48,333 $ 48,333 $ 500,000 $ $ 0% 500,000 Cost Overruns 300,000 $ 16,294 $ 31,523 $ 31,523 $ 31,523 $ 31,523 $ 31,523 $ 31,523 $ 31,523 $ 31,523 $ 31,523 $ 300,000 $ $ 0% 300,000 Total Infrastructure $ 52,187,534 $ 2,240,468 $ 5,714,705 $ 7,116,245 $ 7,709,445 $ 4,909,445 $ 4,909,445 $ 5,309,445 $ 4,609,445 $ 5,709,445 $ 3,959,445 $ 52,187,534 $ 17,059,500 $ 35,128,034 Plus Cost of CIP/Fee-Related Research Impact Fee Study 11,150 $ $11,150 11,150 $ $ 100% $ 11,150 - $ 0% 50,000 Parks Recovery Plan 50,000 $ $50,000 50,000 $ $ 5% $ 3,750 71,250 Parks, Open Space and Trails Master Plan 75,000 $ $75,000 75,000 $ $ 5% $ 5,000 95,000 Jordan River Master Plan 100,000 $ $50,000 $50, ,000 $ $ 5% $ 3,750 71,250 Foothills Recreation and Management Plan 75,000 $ $75,000 75,000 $ Total Infrastructure Plus CIP/Fee-Related Research $ 52,498,684 $ 2,240,468 $ 5,839,705 $ 7,166,245 $ 7,759,445 $ 4,920,595 $ 4,984,445 $ 5,309,445 $ 4,609,445 $ 5,709,445 $ 3,959,445 $ 52,498,684 $ 17,083,150 $ 35,415,534 Minus Impact Fee Balance 1,184,928 $ $1,184,928 1,184,928 $ $ 100% $ 1,184,928 - Grand Total 51,313,756 $ 2,240,468 $ 4,654,777 $ 7,166,245 $ 7,759,445 $ 4,920,595 $ 4,984,445 $ 5,309,445 $ 4,609,445 $ 5,709,445 $ 3,959,445 $ $51,313,756 15,898,222 $ $ 35,415,534
64 Funded FY11-12 Unit Cost Total Cost Growth Growth Cost Replacement/ Repair R&R Cost Impact Fees General Fund/ CDBG Playgrounds TOTAL COST GF 1 Herman Franks 116,200 $ 116, , ? 2 Lindsey Gardens 150,000 $ 150, ,000 3 Fairmont 200,000 $ 200, ,000 4 Swede Town 150,000 $ 150, ,000 5 Poplar Grove 150,000 $ 150, ,000 6 Popperton 150,000 $ 150, ,000 7 Cotton 150,000 $ 150, ,000 8 Stratford 150,000 $ 150, ,000 9 Sunnyside 200,000 $ 200, , Jordan 200,000 $ 200, , Riverside 200,000 $ 200, ,000 $ 1,816,200 $ 1,816,200 $ 1,816,200 $ 1,816,200 Other Priorities 12 Jefferson 150,000 $ 150, , Pugsley Ouray 150,000 $ 150, , Jordan 200,000 $ 200, , Wasatch Hollow 200,000 $ 200, , Fairmont 200,000 $ 200, , Taufer 150,000 $ 150, , Jordan 200,000 $ 200, , Laird Park 150,000 $ 150, , Liberty 200,000 $ 200, , th East 150,000 $ 150, , Sorenson 200,000 $ 200, , Post Street Tot Lot 150,000 $ 150, , Redwood Meadows 150,000 $ 150, , Richmond 150,000 $ 150, , Inglewood 150,000 $ 150, , Westpointe 150,000 $ 150, , Galagher Tot Lot 150,000 $ 150, , Peoples Freeway Park 150,000 $ 150, , Kletting 150,000 $ 150, ,000 Restrooms GF 1 Rotary Glen-design 25,000 25, ? 1 Rotary Glen 275, ,000 2 Warm Springs 300,000 $ 300, ,000 3 Parley's Historic Nature 300,000 $ 300, ,000 4 Glendale Park 300,000 $ 300, ,000 5 Poplar Grove 300,000 $ 300, ,000 6 Wasatch Hollow 300,000 $ 300, ,000 7 Cottonwood 300,000 $ 300, ,000 8 Pioneer 300,000 $ 300, ,000 9 Herman Franks 300,000 $ 300, , Memory Grove Pavillion 300,000 $ 300, ,000 $ 3,000,000 $ 300,000 $ 2,700,000 $ 300,000 $ 2,700,000 $ 3,000,000 Other Priorities 10 Fairmont 300,000 $ 300, , Jordan 300,000 $ 300, , Lindsey Garden 300,000 $ 300, , th South River 300,000 $ 300, , Sherwood Park 300,000 $ 300, , Riverside 300,000 $ 300, , Herman Franks 300,000 $ 300, , Westpointe 300,000 $ 300, , Jordan 300,000 $ 300, , Riverside 300,000 $ 300, , Fairmont 300,000 $ 300, , Pioneer 300,000 $ 300, , Riverside 300,000 $ 300, ,000
65 Multipurpose Fields 1 Fairmont 150,000 $ 150, ,000 2 Fairmont 150,000 $ 150, ,000 3 Fairmont 150,000 $ 150, ,000 4 Fairmont 150,000 $ 150, ,000 5 Jordan 2 $ 100,000 $ 200,000 2 $ 200,000 6 Rosewood 150,000 $ 150, ,000 $ 950,000 $ 950,000 $ 950,000 $ 950,000 Other Priorities 7 Sorenson 100,000 $ 100, ,000 8 Laird 100,000 $ 100, ,000 9 Stratford 100,000 $ 100, , Westpointe 150,000 $ 150, , Riverside 150,000 $ 150, , Dilworth 100,000 $ 100, ,000 Basketball Courts 1 Swede Town 75,000 $ 75,000 75,000 2 Madsen 75,000 $ 75,000 75,000 $ 150,000 $ 150,000 $ 150,000 $ 150,000 Council wants to address indoor BB courts at Futsal and Steiner with ZAP Bond in (cost estimate needed) Other Priorities 3 Pioneer $ 40,000-4 Poplar Grove $ 40,000 - Tennis Courts GF 1 Sunnyside/Pioneer/Reservoir - resurfacing 5 $ 63,400 5 $ 63,400 CDBG 2 5th Ave & C Street -design 67,100 67, th Ave & C Street - reconstruction 107, , Lindsey Gardens 2 $ 175,000 $ 350,000 2 $ 350, Fairmont 5 $ 175,000 $ 875,000 5 $ 875, Dee Glen Smith 4 $ 175,000 $ 700,000 4 $ 700, Fire Station 2 $ 175,000 $ 350,000 2 $ 350, Warm Springs 2 $ 175,000 $ 350,000 2 $ 350, th Avenue 8 $ 175,000 $ 1,400,000 8 $ 1,400, Victory Park 2 $ 175,000 $ 350,000 2 $ 350,000 $ 4,613,400 $ 4,613,400 $ 4,613,400 $ 4,613,400 Other Priorities 11 Riverside 4 $ 175,000 $ 700,000 4 $ 700, Jordan 2 $ 175,000 $ 350,000 2 $ 350, Poplar Grove 2 $ 175,000 $ 350,000 2 $ 350, Westpointe 2 $ 175,000 $ 350,000 2 $ 350, Ensign Downs 2 $ 175,000 $ 350,000 2 $ 350, Dilworth 2 $ 175,000 $ 350,000 2 $ 350, Reservior 2 $ 175,000 $ 350,000 2 $ 350,000 Volleyball Courts 1 Sherwood 35,000 $ 35,000 35,000 2 Richmond 35,000 $ 35,000 35,000 $ 70,000 $ 70,000 $ 70,000 $ 70,000 Other Priorities 3 Jordan 35,000 $ 35,000 35,000 Softball Fields 1 Lindsey Gardens 200,000 $ 200, ,000 2 Ensign Downs 200,000 $ 200, ,000 $ 400,000 $ 400,000 $ 400,000 $ 400,000 Other Priorities 3 Riverside 200,000 $ 200, ,000
66 Baseball Fields 1 Lindsey Gardens 200,000 $ 200, ,000 2 Herman Franks 3 $ 200,000 $ 600,000 3 $ 600,000 3 Glendale 2 $ 200,000 $ 400,000 2 $ 400,000 4 Rosewood 200,000 $ 200, ,000 $ 1,400,000 $ 1,400,000 $ 1,400,000 $ 1,400,000 Other Priorities 5 Sorenson 200,000 $ 200, ,000 6 Poplar Grove 200,000 $ 200, ,000 7 Westpointe 200,000 $ 200, ,000 8 Dilworth 200,000 $ 200, ,000 Jogging/Walking Paths GF 1 Memory Grove $ 299, ,078 GF 2 Wasatch Hollow Open Space $ 111, , Riverview 75,000 $ 75,000 75, th S RiverPark 16,000 $ 16,000 16,000 $ 501,608 $ 16,000 $ 485,608 $ 16,000 $ 485,608 $ 501,608 Other Priorities 6 City Creek Park 50,000 $ 50,000 50,000 7 Cottonwood 4,000 $ 4,000 4, th Avenue 4,000 $ 4,000 4,000 9 Hidden Hollow 15,000 $ 15,000 15, Ensign Pavilions 1 Rotary Glen 400,000 $ 400, ,000 2 Jordan 2 $ 400,000 $ 800,000 2 $ 800,000 $ 1,200,000 $ 1,200,000 $ 1,200,000 $ 1,200,000 Other Priorities 3 Riverside 400,000 $ 400, ,000 4 Cottonwood 4 $ 400,000 $ 1,600,000 4 $ 1,600,000 Plazas 1 Pioneer 1,000,000 $ 1,000,000 50,000 $ 950,000 2 Artesian Well 200,000 $ 200, ,000 $ 1,200,000 $ 50,000 $ 1,150,000 $ 50,000 $ 1,150,000 $ 1,200,000 Other Priorities 3 City Creek 50,000 $ 50,000 50,000 4 Nelli Jack 25,000 $ 25,000 25,000 5 First Encampment 50,000 $ 50,000 50,000 Off-Leash Dog Area New Dog Park - Fairmont (Council Request) 250,000 $ 250, ,000 2 Parley's Historic Nature Park 250,000 $ 250,000 12, ,500 $ 500,000 $ 12,500 $ 487,500 $ 12,500 $ 487,500 $ 500,000 Other Priorities 3 Memory Grove 250,000 $ 250, ,000 4 Lindsey Gardens 250,000 $ 250,000 12,500 $ 237,500 5 Herman Franks 400,000 $ 400, ,000 6 Jordan 250,000 $ 250,000 25,000 $ 225,000 7 Rosewood 250,000 $ 250,000 25,000 $ 225,000
67 Skate Parks Fairmont or Jordan (not yet prioritized) 700,000 $ 700, ,000 $ 700,000 $ 700,000 $ 700,000 $ 700,000 Other Priorities Fairmont or Jordan 700,000 $ 700, ,000 BMX and Bike Parks Parley's Historic Nature Park 300,000 $ 300,000 15,000 $ 285,000 $ 300,000 $ 15,000 $ 285,000 $ 15,000 $ 285,000 $ 300,000 Council wants to look at new areas/options for BMX users Drinking Fountains 20 drinking fountains-various parks 20 $ 3,500 $ 70, $ 70,000 $ 70,000 $ 70,000 $ 70,000 $ 70,000 Other Priorities 20 drinking fountains - various parks 20 $ 3,500 $ 70, $ 70,000 Cottonwood 1 Fairmont 2 Herman Franks 2 Int'l Peace Gardens 1 Jordan 2 Riverside 1 Warm Springs 1 Washington Square 2 11th Avenue 1 9th South 1 City Creek 1 Donner Trail 1 Ensign Downs 1 Lindsey Gardens 1 Pioneer Park 1 Poplar Grove 2 Popperton 1 Reservoir 1 Richmond 1 Rotary Glen 1 Stratford 1 Victory 1 Westpointe 2 Artesian Well 1 Cotton 1 Curtis 1 Davis 1 Faultline 1 Inglewood 1 Post Street Tot Lot 1 Puglsey Ouray 1 Taufer 1 Glendale 2
68 Picnic Tables 120 tables - various parks 120 $ 2,000 $ 240, $ 240,000 $ 240,000 $ 240,000 $ 240,000 $ 240,000 Other Priorities 120 tables - various parks 120 $ 2,000 $ 240, ,000 Liberty Washington Park Cottonwood Fairmont Jordan Memory Grove Riverside Rosewood Sunnyside Warm Springs 11th Avenue 9th South Donner Trail Laird Lindsey Gardens Madsen Poplar Grove Popperton Reservoir Rotary Glen Richmond Sherwood Stratford Westpointe Cotton Faultline Guadalupe Jackson Taufer Horseshoes Jordan or Riverside (not yet prioritized) 15,000 $ 15,000 15,000 $ 15,000 $ 15,000 $ - Other Priorities Jordan or Riverside (not yet prioritized) 15,000 $ 15,000 15,000 Water Features Fairmont/Library Square/Memory Grove 250,000 $ 250, ,000 (not yet prioritized) $ 250,000 $ 250,000 $ - Other Priorities Fairmont/Library Square/Memory Grove 250,000 $ 250, ,000 Fairmont/Library Square/Memory Grove 250,000 $ 250, ,000 Council suggested Jordan Park 250,000 $ 250, ,000 Bridges 1 Wasatch Hollow Open Space 250,000 $ 250, ,000 $ 250,000 $ 250,000 $ - Other Priorities 1 Council Requested - Line Bridge need cost estimate 2 Council Requested - Jordan River at Indiana 3 Riverview 750,000 $ 750, ,000 4 Parley's Historic Nature Park 250,000 $ 250, ,000 5 Fairmont 2 $ 5,000 $ 10,000 2 $ 10,000
69 Bleachers 1 Oak Hills Ball Diamonds 2 $ 8,000 $ 16,000 2 $ 16,000 2 Sunnyside 2 $ 8,000 $ 16,000 2 $ 16,000 3 Sherwood 6 $ 8,000 $ 48,000 6 $ 48,000 4 Herman Franks 4 $ 8,000 $ 32,000 4 $ 32,000 $ 112,000 $ 112,000 $ 48,000 $ 48,000 Other Priorities 5 Lindsey Gardens $ 8,000 2 $ - 6 Riverside $ 8,000 4 $ - 7 Rosewood $ 8,000 4 $ - 8 Ensign Downs $ 8,000-9 Westpointe $ 8,000 3 $ - Benches-no priority order 30 benches - various parks 30 $ 3,000 $ 90, $ 90,000 $ 90,000 $ 90,000 $ 90,000 $ 90,000 Sorenson 4 Wasatch Hollow 3 Washington Square 25 Dilworth 2 Jefferson 2 Madsen 3 Pioneer 2 Richmond 5 Galagher Tot Lot 1 Post Street Tot Lot 3 Redwood Meadows 3 Swede Town 3 Nelli Jack 2 Other Priorities 30 benches - various parks 30 $ 3,000 $ 90,000 90,000 Earthen Trails GF 1 Parley's Historic Nature Park 150, ,223 2 Miller Bird Refuge 75,000 $ 75,000 75,000 3 Ensign Peak 75,000 $ 75,000 75,000 4 Wasatch Hollow Open Space 75,000 $ 75,000 75,000 $ 375,223 $ 375,223 $ 375,223 $ 375,223 Other Priorities 5 Bonneville Shoreline Preserve 4,000 $ 4,000 4,000 6 H-Rock 4,000 $ 4,000 4,000 7 Riverview 5,000 $ 5,000 5,000 8 Rotary Park 1,500 $ 1,500 1,500 9 Bend-In-The-River 1,000 $ 1,000 1, Twin Peaks 1,500 $ 1,500 1,500 Concessions 1 Riverside 250,000 $ 250, ,000 2 Poplar Grove 125,000 $ 125, ,000 3 Oak Hills Ball Diamonds 125,000 $ 125, ,000 $ 500,000 $ 500,000 $ 500,000 $ 500,000 Other Priorities 4 Sunnyside 125,000 $ 125, ,000 5 Herman Franks 2 $ 250,000 $ 500,000 2 $ 500,000 6 Dee Glen Smith Tennis 500,000 $ 500, ,000
70 Landscaping 1 11th Avenue 30,000 $ 30,000 30,000 2 Wasatch Hollow Open Space 675,000 $ 675, ,000 3 Parley's Historic Nature Park 1,275,000 $ 1,275,000 1,275,000 4 Faultline 15,000 $ 15,000 15,000 5 Miller Bird Refuge 250,000 $ 250, ,000 6 Fairmont 15,000 $ 15,000 15,000 7 Sorenson 7,000 $ 7,000 7,000 8 Sunnyside 30,000 $ 30,000 30,000 9 Wasatch Hollow Park 8,000 $ 8,000 8,000 $ 2,305,000 $ 2,305,000 $ 2,305,000 $ 2,305,000 Other Priorities City Creek 250,000 $ 250, ,000 Dilworth 5,000 $ 5,000 5,000 Gilgal 3,000 $ 3,000 3,000 Oak Hills Ball Diamonds 500 $ Poplar Grove 2,000 $ 2,000 2,000 Reservoir 5,000 $ 5,000 5,000 Richmond 3,000 $ 3,000 3,000 Rotary Glen 150,000 $ 150, ,000 Stratford 500 $ Victory Park 3,000 $ 3,000 3,000 10th E Senior 5,000 $ 5,000 5,000 6th East 1,000 $ 1,000 1,000 Artesian Well 5,000 $ 5,000 5,000 Curtis 2,000 $ 2,000 2,000 Davis 1,000 $ 1,000 1,000 First Encampment 1,000 $ 1,000 1,000 10th East Islands 3,000 $ 3,000 3,000 12th East/South Temple 500 $ th Avenue and J 500 $ th Avenue Stairs 1,000 $ 1,000 1,000 Foothill Islands 500 $ Glendale 5,000 $ 5,000 5,000 Research Parks Islands 500 $ th West 500 $ Bend-In-The-River 1,000 $ 1,000 1,000 Bonneville Shoreline Preserve 20,000 $ 20,000 20,000 Ensign Peak Nature Park 10,000 $ 10,000 10,000 Ensign Peak Nature Park and Trailhead 3,000 $ 3,000 3,000 Hidden Hollow Natural Area 5,000 $ 5,000 5,000 H-Rock 5,000 $ 5,000 5,000 Jordan River Parkway 30,000 $ 30,000 30,000 Modesto Park 5,000 $ 5,000 5,000 Riverview 750,000 $ 750, ,000 Lighting GF 1 Faultline 45,650 45,650 GF 2 Jordan River Trail North to 1000 North 57,060 57, Council Requested - Jordan River Trail 200 to 7 57,060 57, Council Requested - Herman Franks Park 75,000 75, Fairmont Park 100,000 $ 100, ,000 6 First Encampment 20,000 $ 20,000 20,000 7 Donner Trail 30,000 $ 30,000 30,000 8 Artesian Well 20,000 $ 20,000 20,000 9 Elizabeth Sherman 20,000 $ 20,000 20, Library Square 145,000 $ 145, , North Gateway Park 50,000 $ 50,000 50, Riverside Park 75,000 $ 75,000 75,000 $ 694,770 $ 694,770 $ 694,770 $ 694,770
71 Other Priorities Rosewood Park 60,000 $ 60,000 60,000 Warm Springs Park 50,000 $ 50,000 50,000 Wasatch Hollow Park 20,000 $ 20,000 20,000 9th South 50,000 $ 50,000 50,000 Madsen 5,000 $ 5,000 5,000 Richmond 30,000 $ 30,000 30,000 Stratford 5,000 $ 5,000 5,000 Westpointe 75,000 $ 75,000 75,000 Cotton 5,000 $ 5,000 5,000 Galagher Tot Lot 15,000 $ 15,000 15,000 Jackson 20,000 $ 20,000 20,000 Miami 5,000 $ 5,000 5,000 Pugsley Ouray 10,000 $ 10,000 10,000 Redwood 40,000 $ 40,000 40,000 Silver 20,000 $ 20,000 20,000 Steenblik 30,000 $ 30,000 30,000 Swede Town 20,000 $ 20,000 20,000 Taufer 25,000 $ 25,000 25,000 Westminster 15,000 $ 15,000 15,000 Glendale 5,000 $ 5,000 5,000 Roberta Laconia 5,000 $ 5,000 5,000 Irrigation acres GF 1 10th E Senior $ 11,920 11,920 CDBG 2 Cottonwood $ 400, ,000 CDBG 3 6th East (S Temple-6th S) 2.80 $ 204, , Parley's Historic Nature Park $ 20,000 $ 500, , East (S Temple-5S) 2.46 $ 20,000 $ 49,200 49,200 6 Rosewood $ 20,000 $ 445, ,000 7 Popperton $ 20,000 $ 583, ,200 8 Wasatch Hollow Open Space $ 20,000 $ 200, ,000 $ 2,394,220 $ 2,394,220 $ 2,394,220 $ 2,394,220 Other Priorities Jordan $ 20,000 $ 670, ,000 Pioneer $ 20,000 $ 200, ,000 Washington Square $ 20,000 $ 220, ,000 Bend-In-The-River 4.25 $ 20,000 $ 85,000 85,000 Dee Glen Smith 2.75 $ 20,000 $ 55,000 55,000 Hillcrest 0.75 $ 20,000 $ 15,000 15,000 Memory Grove 8.75 $ 20,000 $ 175, ,000 Sunnyside $ 20,000 $ 510, ,000 Warm Springs 9.00 $ 20,000 $ 180, ,000 Wasatch Hollow 3.55 $ 20,000 $ 71,000 71,000 11th Avenue $ 20,000 $ 500, ,000 5th Ave. & "C" Street 0.37 $ 20,000 $ 7,400 7,400 City Creek 4.00 $ 20,000 $ 80,000 80,000 Dilworth 4.50 $ 20,000 $ 90,000 90,000 Donner Trail $ 20,000 $ 340, ,000 Glendale Park 0.75 $ 20,000 $ 15,000 15,000 Gilgal 0.95 $ 20,000 $ 19,000 19,000 Kay Rees Park 5.35 $ 20,000 $ 107, ,000 Madsen 2.00 $ 20,000 $ 40,000 40,000 Parley's Way 3.37 $ 20,000 $ 67,400 67,400 Poplar Grove 6.75 $ 20,000 $ 135, ,000 Reservoir 6.50 $ 20,000 $ 130, ,000 Rotary Glen $ 20,000 $ 490, ,000 Stratford 2.00 $ 20,000 $ 40,000 40,000 Westside Senior 2.00 $ 20,000 $ 40,000 40,000 6th East Park 0.25 $ 20,000 $ 5,000 5,000 Artesian Well 0.25 $ 20,000 $ 5,000 5,000 Beatrice Evans Park 0.25 $ 20,000 $ 5,000 5,000 Cotton Park 0.25 $ 20,000 $ 5,000 5,000 Curtis Park 1.25 $ 20,000 $ 25,000 25,000 Davis Park 0.50 $ 20,000 $ 10,000 10,000
72 Faultline 1.00 $ 20,000 $ 20,000 20,000 Guadalupe Park 1.00 $ 20,000 $ 20,000 20,000 Jackson Park 1.00 $ 20,000 $ 20,000 20,000 Kletting 0.50 $ 20,000 $ 10,000 10,000 Post Street Tot Lot 0.50 $ 20,000 $ 10,000 10,000 Redwood Meadows 1.25 $ 20,000 $ 25,000 25,000 Silver Park 0.25 $ 20,000 $ 5,000 5,000 Steenblik Park 2.00 $ 20,000 $ 40,000 40,000 Swede Town 0.75 $ 20,000 $ 15,000 15,000 City Creek 5.00 $ 20,000 $ 100, ,000 Ensign Peak Nature Park $ 20,000 $ 2,539,800 2,539,800 Ensign Peak Nature Park and Trailhead 0.25 $ 20,000 $ 5,000 5,000 Hidden Hollow Natural Area 3.19 $ 20,000 $ 63,800 63,800 H-Rock $ 20,000 $ 1,004,000 1,004,000 Jordan River Parkway $ 20,000 $ 1,488,800 1,488,800 Miller Bird Refuge 8.68 $ 20,000 $ 173, ,600 Modesto Park 4.70 $ 20,000 $ 94,000 94,000 Regional Athletic Complex $ 20,000 $ 537, ,000 Riverview ,000 $ 210, ,200 10th E. Islands 0.86 $ 20,000 $ 17,200 17, East Parking 1.75 $ 20,000 $ 35,000 35, South 1500 East 0.25 $ 20,000 $ 5,000 5,000 13th Ave. & J 0.06 $ 20,000 $ 1,200 1,200 13th East 0.25 $ 20,000 $ 5,000 5,000 13th South Island 1.03 $ 20,000 $ 20,600 20,600 2 West (6N-Wall) 1.60 $ 20,000 $ 32,000 32,000 2nd South Islands 0.18 $ 20,000 $ 3,600 3, West (N Temple -4N) 0.17 $ 20,000 $ 3,400 3,400 8th West Islands (100 S-300 N) 1.50 $ 20,000 $ 30,000 30,000 7th East (13S-21S) 3.50 $ 20,000 $ 70,000 70,000 8th West (6-9s) 4.50 $ 20,000 $ 90,000 90,000 Elizabeth Sherman 1.50 $ 20,000 $ 30,000 30,000 Federal Heights Islands 0.63 $ 20,000 $ 12,600 12,600 Foothills Islands 0.67 $ 20,000 $ 13,400 13,400 Harvard Islands 0.37 $ 20,000 $ 7,400 7,400 Jefferson Circle 2.00 $ 20,000 $ 40,000 40,000 Laird Circle 0.25 $ 20,000 $ 5,000 5,000 Normandy 0.04 $ 20,000 $ Oneida 0.75 $ 20,000 $ 15,000 15,000 Prison Island 0.50 $ 20,000 $ 10,000 10,000 Research Park Islands 8.47 $ 20,000 $ 169, ,400 Skyline Island 0.25 $ 20,000 $ 5,000 5,000 17th South Retention 0.75 $ 20,000 $ 15,000 15, Plaza 0.25 $ 20,000 $ 5,000 5,000 Almond Park 0.10 $ 20,000 $ 2,000 2,000 Court Building 0.25 $ 20,000 $ 5,000 5,000 Weseman 0.25 $ 20,000 $ 5,000 5,000 Nelli Jack Park 0.25 $ 20,000 $ 5,000 5,000 Roberta LaConia 0.25 $ 20,000 $ 5,000 5,000 Stanton 0.25 $ 20,000 $ 5,000 5,000 Washington Park Parleys $ 20,000 $ 200, ,000 Mountain Dell $ 20,000 $ 200, ,000 Fencing 1 Parley's Historic Nature Park 265,000 $ 265, ,000 2 Ensign Peak Nature Park 20,000 $ 20,000 20,000 3 Wasatch Hollow Open Space 25,000 $ 25,000 25,000 4 Miller Bird Refuge 15,000 $ 15,000 15,000 5 Riverview 25,000 $ 25,000 25,000 $ 350,000 $ 350,000 $ 350,000 $ 350,000 Other Priorities Jordan River Parkway 800,000 $ 800, ,000 Riverside 5,000 $ 5,000 5,000 Sorensen 5,000 $ 5,000 5,000 Sunnyside 10,000 $ 10,000 10,000 Rotary Glen 15,000 $ 15,000 15,000 Sherwood 5,000 $ 5,000 5,000 Victory 2,500 $ 2,500 2,500 Hidden Hollow Natural Area 8,000 $ 8,000 8,000 H-Rock 8,000 $ 8,000 8,000 Modesto Park 5,000 $ 5,000 5,000
73 Asphalt GF 1 Jordan River Trail Repaving 295,020 $ 295, ,020 1 Rosewood 91,000 $ 91,000 91,000 2 Lindsey Gardens 52,000 $ 52,000 52,000 3 Rotary Glen 76,000 $ 76,000 76, th E Senior 105,000 $ 105, ,000 5 Sunnyside 183,000 $ 183, ,000 6 Memory Grove 380,000 $ 380, ,000 $ 1,182,020 $ 1,182,020 $ 1,182,020 $ 1,182,020 Other Priorities Sherwood 94,000 $ 94,000 94,000 Silver 11,000 $ 11,000 11,000 Almond 11,000 $ 11,000 11,000 11th Avenue 35,000 $ 35,000 35,000 9th South 26,000 $ 26,000 26,000 Popperton 22,000 $ 22,000 22,000 Steiner Aquatics 352,000 $ 352, ,000 Signage GF Open Space Signage Citywide: $ 312,093 $ 312,093 Parley's Historic Nature Park Ensign Peak Nature Park and Trailhead Wasatch Hollow Open Space Jordan River Parkway Miller Bird Refuge Bonneville Shoreline Trail H-Rock Hidden Hollow $ 312,093 $ 312,093 $ 312,093 $ 312,093 Other Priorities Modesto Park 3,000 $ 3,000 3,000 Bend-In-The-River 4 $ 3,000 $ 12,000 12,000 Alan Parsons-BST 3,000 $ 3,000 3,000 City Creek 11,000 $ 11,000 11,000 Popperton Park 3,000 $ 3,000 3,000 Riverview 6,000 $ 6,000 6,000 Rotary Park 3,000 $ 3,000 3,000 Twin Peaks 3,000 $ 3,000 3,000 Cemetery $ 2,000,000 $ 2,000,000 $ 2,000,000 $ 2,000,000 $ 27,941,534 $ 393,500 $ 27,548,034 $ 393,500 $ 27,548,034 $ 27,941,534
74 Salt Lake City Streets/Transportation Divisions Impact Fees Facilities Plan Fiscally Constrained Estimated Approved Type of Capital Facility Cost FY11-12 FY12-13 FY13-14 FY14-15 FY15-16 FY16-17 FY17-18 FY18-19 FY19-20 FY year total Roadway Projects 1300 South Viaduct Rehabilitation $ 10,000,000 $ 200,000 $ 9,520,000 $ 280,000 $ 10,000, /700 South West to 5600 West $ 14,760,000 $ 4,070,000 $ 3,160,000 $ 2,810,000 $ 2,400,000 $ 2,320,000 $ 14,760,000 ADA Accessible Ramps $ 1,300,000 $ 506,175 $ 88,000 $ 88,000 $ 88,000 $ 88,000 $ 88,000 $ 88,000 $ 88,000 $ 88,000 $ 89,825 $ 1,300,000 Sidewalk Rehabilitation/Sawcutting $ 700,000 $ 200,000 $ 100,000 $ 50,000 $ 50,000 $ 50,000 $ 50,000 $ 50,000 $ 50,000 $ 50,000 $ 50,000 $ 700,000 Deteriorated Sidewalk Replacement $ 1,300,000 $ 402,700 $ 99,700 $ 250,000 $ 78,229 $ 78,229 $ 78,229 $ 78,229 $ 78,229 $ 78,229 $ 78,229 $ 1,300,000 Indiana Avenue/900 South from Redwood to 3600 West $ 3,640,000 $ 300,000 $ 1,000,000 $ 1,800,000 $ 540,000 $ 3,640,000 Gladiola Street South to 2100 South $ 4,000,000 $ 2,900,000 $ 1,100,000 $ 4,000, West from 700 South to 850 South $ 1,600, $ 1,350,000 $ 1,600,000 Street Pavement Overlay and Preservation $ 7,000,000 $ 1,000,000 $ 700,000 $ 700,000 $ 700,000 $ 700,000 $ 700,000 $ 700,000 $ 700,000 $ 700,000 $ 400,000 $ 7,000,000 Local Street Reconstruction $ 6,500,000 $ 950,034 $ 620,000 $ 620,000 $ 620,000 $ 620,000 $ 620,000 $ 620,000 $ 620,000 $ 620,000 $ 589,966 $ 6,500,000 Major Rehabilitation and Reconstruction of City Streets $ 8,360,000 $ 596,000 $ 440,600 $ 795,850 $ 884,000 $ 780,800 $ 1,045,250 $ 972,150 $ 776,500 $ 1,163,500 $ 905,350 $ 8,360,000 Concrete Street Rehabilitation $ 2,000,000 $ 756,800 $ 140,000 $ 140,000 $ 140,000 $ 140,000 $ 140,000 $ 140,000 $ 140,000 $ 140,000 $ 123,200 $ 2,000,000 Bridge Rehabilitation $ 180,000 $ 20,000 $ 20,000 $ 20,000 $ 20,000 $ 20,000 $ 20,000 $ 20,000 $ 20,000 $ 20,000 $ 180,000 Percent for Art $ 500,000 $ 65,000 $ 48,333 $ 48,333 $ 48,333 $ 48,333 $ 48,333 $ 48,333 $ 48,333 $ 48,333 $ 48,333 $ 500,000 Cost Overruns $ 300,000 $ 16,294 $ 31,523 $ 31,523 $ 31,523 $ 31,523 $ 31,523 $ 31,523 $ 31,523 $ 31,523 $ 31,523 $ 300,000 $ 62,140,000 $ 9,063,003 $ 14,968,156 $ 5,833,706 $ 5,060,085 $ 4,876,885 $ 3,821,335 $ 4,548,235 $ 5,992,585 $ 3,189,585 $ 4,786,426 $ 62,140,000 Transportation Projects Replacement Traffic Signals $ 2,400,000 $ 480,000 $ 160,000 $ 320,000 $ 160,000 $ 320,000 $ 160,000 $ 320,000 $ 160,000 $ 320,000 $ 2,400,000 Pedestrian Safety Devices $ 250,000 $ 120,000 $ 25,000 $ 25,000 $ 25,000 $ 25,000 $ 30,000 $ 250,000 Bike Lane/Pedestrian Improvements - Citywide $ 7,020,000 $ 550,000 $ 2,000,000 $ 2,520,000 $ 1,950,000 $ 7,020,000 New Traffic Signals $ 1,440,000 $ 160,000 $ 160,000 $ 160,000 $ 160,000 $ 160,000 $ 160,000 $ 160,000 $ 160,000 $ 160,000 $ 1,440, East Traffic Safety - Phase 2 $ 500,000 $ 500,000 $ 500,000 Street Lighting Replacement $ 200,000 $ 40,000 $ 160,000 $ 200,000 $ 11,810,000 $ 1,190,000 $ 2,685,000 $ 2,865,000 $ 2,615,000 $ 345,000 $ 510,000 $ 320,000 $ 480,000 $ 320,000 $ 480,000 $ 11,810,000 Total Infrastructure $73,950,000 $10,253,003 $17,653,156 $8,698,706 $7,675,085 $5,221,885 $4,331,335 $4,868,235 $6,472,585 $3,509,585 $5,266,426 $73,950,000 Plus Cost of Fee-Related Research Impact Fee Study $ 11,150 $ 11,150 $ 11,150 Transportation Master Plan $ 200,000 $ 100,000 $ 100,000 $ 200,000 Minus Impact Fee Balance $ 5,441,542 $ 3,420,000 $ 2,021,542 $ 5,441,542 Grand Total $68,719,608 $6,833,003 $15,731,614 $8,798,706 $7,675,085 $ 5,233,035 $ 4,331,335 $ 4,868,235 $ 6,472,585 $ 3,509,585 $ 5,266,426 $68,719,608
75 Salt Lake City Streets/Transportation Divisions Impact Fees Facilities Plan Fiscally Constrained 10 Year Totals Portion Impact Fee Other Funding Funding Sources Type of Capital Facility times Attributable equals Eligible Sources General Fund Class C CDBG Impact Fees FHWA Other Total to Growth 7% (including fund balance) Roadway Projects 1300 South Viaduct Rehabilitation 0% $ 10,000,000 $ 480,000 $9,320,000 $ 200,000 $ 10,000, /700 South West to 5600 West 57% $ 8,413,200 $ 6,346,800 $ 3,173,400 $ 3,173,400 $ 8,413,200 $ 14,760,000 ADA Accessible Ramps 0% $ 1,300,000 $ 1,300,000 $ 1,300,000 Sidewalk Rehabilitation/Sawcutting 0% $ 700,000 $ 700,000 $ 700,000 Deteriorated Sidewalk Replacement 0% $ 1,300,000 $ (204,175) $ 1,504,175 $ 1,300,000 Indiana Avenue/900 South from Redwood to 3600 West 57% $ 2,074,800 $ 1,565,200 $ 782,600 $ 782,600 $ 2,074,800 $ 3,640,000 Gladiola Street South to 2100 South 57% $ 2,280,000 $ 1,720,000 $ 860,000 $ 860,000 $ 2,280,000 $ 4,000, West from 700 South to 850 South 57% $ 912,000 $ 688,000 $ 344,000 $ 344,000 $ 912,000 $ 1,600,000 Street Pavement Overlay and Preservation 0% $ 7,000,000 $ 7,000,000 $ 7,000,000 Local Street Reconstruction 0% $ 6,500,000 $ 3,500,000 $ 3,000,000 $ 6,500,000 Major Rehabilitation and Reconstruction of City Streets 0% $ 8,360,000 $ 6,360,000 $ 2,000,000 $ 8,360,000 Concrete Street Rehabilitation 0% $ 2,000,000 $ 2,000,000 $ 2,000,000 Bridge Rehabilitation 0% $ 180,000 $ 180,000 $ 180,000 Percent for Art 0% $ 500,000 $ 350,000 $ 150,000 $ 500,000 Cost Overruns 0% $ 300,000 $ 50,000 $ 250,000 $ 300,000 $ 13,680,000 $ 48,460,000 $ 9,735,825 $ 24,000,000 $ 5,204,175 $ 13,680,000 $ 9,320,000 $ 200,000 $ 62,140,000 Transportation Projects Replacement Traffic Signals 0% $ 2,400,000 $ 2,400,000 $ 2,400,000 Pedestrian Safety Devices 10% $ 25,000 $ 225,000 $ 225,000 $ 25,000 $ 250,000 Bike Lane/Pedestrian Improvements - Citywide 10% $ 702,000 $ 6,318,000 $ 6,318,000 $ 702,000 $ 7,020,000 New Traffic Signals 100% $ 1,440,000 $ 1,440,000 $ 1,440, East Traffic Safety - Phase 2 0% $ 500,000 $ 500,000 $ 500,000 Street Lighting Replacement 0% $ 200,000 $ 200,000 $ 200,000 $ 2,167,000 $ 9,643,000 $ 9,643,000 $ 2,167,000 $0 $0 $11,810,000 Total Infrastructure $ 15,847,000 $ 58,103,000 $ 19,378,825 $ 24,000,000 $ 5,204,175 $ 15,847,000 $ 9,320,000 $ 200,000 $ 73,950,000 Plus Cost of Fee-Related Research Impact Fee Study 100% $ 11,150 $ 11,150 $ 11,150 Transportation Master Plan 10% $ 20,000 $ 180,000 $ 180,000 $ 20,000 $ 200,000 Minus Impact Fee Balance 100% $ 5,441,542 $ - Grand Total $ 10,436,608 $ 58,283,000 $ 19,558,825 $ 24,000,000 $ 5,204,175 $ 15,878,150 $ 9,320,000 $ 200,000 $ 74,161,150 Council wants to add: Impact Fee Project Allocation General Fund Class C CDBG Impact Fees FHWA Other Total Concrete replacement study Residential Non-Residential proposed $ 19,558,825 $ 24,000,000 $ 5,204,175 $ 15,878,150 $ 9,320,000 $ 200,000 $ 74,161,150 50/50 program $ 1,296,909 $ 9,139,700 available funds $ 19,558,825 $ 24,000,000 $ 5,204,175 $ 15,878,150 $ 9,320,000 $ 200,000 $ 74,161, East from S Temple to 900 S difference $ E from 1700 S/South of I-80 Total $ 10,436, West and 700 West - concrete infrastructure Indiana Bridge? Hawk Signals - Chapman Library
76 Salt Lake City Facilities Division Capital Facilities Plan This list does not reflect the amount of funding available each year. Instead, it prioritizes projects for application within each funding year. See Sources and Uses for estimated annual allocation. Approved Priority Building Project Estimated Project FY11-12 FY12-13 FY13-14 FY14-15 FY15-16 FY16-17 FY17-18 FY18-19 FY19-20 FY20-21 Cost 1 Pioneer Precinct HVAC System and Lighting Energy Conservation $493,790 $493,790 2 Justice Courts HVAC System Upgrade and Energy Conservation $377,100 $377,100 3 CBD - Area 4 Downtown Irrigation Water Conservation and Asset Renewal Project Design, Engineering and Development. $135,586 $135,586 4 Central Plant Centeral Plant Heating, cooling system and structural study $233,783 $233,783 5 Building Shell Retrofit including roofing, siding and gutters. Westside Senior Center $110,093 $110,093 6 SBD Sugarhouse Business District Irrigation Water Conservation and Asset Renewal Project Design, Engineering and Development. $291,928 $291,928 7 Spring Mobile Field Energy efficiency project replacing HVAC, Controls, and Lighting systems $663,518 $663, th South Properties Replace single pane window with Thermal double pane Windows $60,119 $60,119 9 City & County Building Fan Coil Unit Replacement 1st Floor South Half $170,292 $170,292 Admin Req City & County Building Washington Square Event Power, which provides in ground distributed connection points to elminiate the need for portable generators on the East side of the Square. $499,996 $499,966 Admin Req City&County Building Fifth Floor Renovation to office space $884,30884, City&County Building Exterior Painting and Repair work at all wood window frames, $190,000 $190, City&County Building City & County Building, Stone Repairs, this is needed work to restore damage or broken Kyune sand stone and stone sculptures. Consultaing work pending for final scope of restorative and protective work $200,000 $200, City & County Bldg City & County Building, Stone Upkeep including testing, cleaning, stone hardner and water proofing $1,400,000 $1,400, CBD - Area 4 Downtown Irrigation Water Conservation and Asset Renewal Project Construction Work $800,000 $800, Fire Station 5 and 2 Replace single-pane window with Thermal double pane Windows $73,200 $73, Fire Stations 1,4,6,7 Upgrade Fire station with full DDC controls and intergated system interfaces 900, , City & County Building Design and Construction of New Base Isolator System $1,000,000 $1,000, Fire Stations 9,10,13, Upgrade Fire station with full DDC controls and intergated system interfaces 900, , Fire Stations 1,4,6,7,9,10,13, Replace heating and Air-conditioning add DDC controls to systems $244,200 $244, th South Properties Replace heating and Air-conditioning add DDC controls to systems to remaining properties. $80,500 $80, Sugarhouse Business Sugarhouse Business District Irrigation Water Conservation and Asset Renewal Project Design, Engineering Dist and Development. $268,886 $268, Sugarhouse Business Dist Sugarhouse Business District Irrigation Water Conservation and Asset Renewal Project Construction Work $1,200,000 $1,200, City & County Building Fan Coil Unit Replacement 3rd Floor South Half $194,620 $194, City & County Building Fan Coil Unit Replacement 3rd Floor North Half $182,456 $182, City & County Building Fan Coil Unit Replacement 1st Floor North Half $137,176 $137, City & County Building Fan Coil Unit Replacement 4th Floor North Half $170,292 $170, City & County Building Fan Coil Unit Replacement 2nd Floor North Half $158,129 $158, City & County Building Fan Coil Unit Replacement 2nd Floor South Half $137,176 $137, City & County Building Fan Coil Unit Replacement 4th Floor South Half $170,292 $170, City & County Building Fan Coil Unit Replacement 5th Floor $206,784 $206, City & County Building 3rd & 5th Floor Carpet, Access Flooring and Electrical Replacement $748,907 $748, City & County Building 2nd Floor, Carpet, Access Flooring and Electrical Replacement $561,68561, City & County Building 4th Floor Carpet, Access Flooring and Electrical Replacement $748,907 $748, Fire Station 4,5, and WSC Parking Lot Repairs and Replacements $338,192 $338, East Side Senior Center ESSC - Re-roofing of Senior Center $109,800 $109, City & County Building 1st Floor Carpet, Access Flooring and Electrical Replacement $748,907 $748, Library Parking Structure Waterproofing of Concrete Structure Joint/Expansion Joint Repairs $305,000 $305, Plaza 349 Plaza Parking Structure Repairs and Resurface $261,682 $261, Spring Mobile Field Spring Mobile Field Concourse B Level Waterproofing Project $368,915 $368, Spring Mobile Field Spring Mobile Field Building Steel and Roof-deck Painting Project $1,079,763 $1,079,763
77 Salt Lake City Facilities Division Capital Facilities Plan Approved Priority Building Project Estimated Project FY11-12 FY12-13 FY13-14 FY14-15 FY15-16 FY16-17 FY17-18 FY18-19 FY19-20 FY20-21 Cost 41 Memorial House Replace single pane window with Thermal double pane Windows $73,200 $73, Central Plant Chiller replacment and controls upgrade $300,000 $300, Stiener East HVAC replacment and controls upgrade $800,000 $800,000 Admin Req Fisher Mansion Renovate and Restore Historic Fisher Mansion $1,900,000 $1,900, Fire Station 8 FS 8 Re-roofing of Station Built Up Roofing $61,000 $61, Fire Station 9 FS 9 Re-roofing of Station Built Up Roofing $61,000 $61, Chase House Replace heating and Air-conditioning add DDC controls to systems $55,000 $55, Pioneer Precinct Re-roofing of Pioneer Precinct $109,800 $109, City and County Bldg Replace Main Air-handlers on each floor $1,220,000 $1,220, Chase House Exterior Painting and Repair work $100,000 $100, Art Barn Exterior Painting and Repair work $100,000 $100, SLC Cemetary Exterior Painting and Repair work $100,000 $100, City&County Building Generator and Fuel Tank Upgrade $250,000 $250, Various Buildings Upgrade and Replace Carpet and tile and other floor coverings $250,000 $250, Various Buildings Upgrade and Replace Life Safety Systems such as Fire Detection, Fire Suppression $250,000 $250, Various Buildings Upgrade and Replace HVAC and Control Systems $250,000 $250, Various Buildings Upgrade and Replace Roofs and Insulation and decking $250,000 $250, Various Buildings Upgrade and Replace Carpet and tile and other floor coverings $250,000 $250, Various Buildings Upgrade and Replace Windows and glazing to higher efficiency resistance to cold and heat $250,000 $250, Various Buildings Address structural and foundation issues identified $250,000 $250, Various Buildings Replace and upgrade water proofing systems $250,000 $250, Various Buildings Replace and upgrade CBD/SBD Pavers and Irrigations systems $250,000 $250, Various Buildings Replace and upgrade Generators and Fuel Systems $250,000 $250, Various Buildings Repaint Exterior of Buildings needing such action $250,000 $250, Various Buildings Upgrade and Replace Life Safety Systems such as Fire Detection, Fire Suppression $250,000 $250, Various Buildings Upgrade and Replace HVAC and Control Systems $250,000 $250, Various Buildings Upgrade and Replace Roofs and Insulation and decking $250,000 $250, Various Buildings Upgrade and Replace Carpet and tile and other floor coverings $250,000 $250, Various Buildings Upgrade and Replace Windows and glazing to higher efficiency resistance to cold and heat $250,000 $250, Various Buildings Address structural and foundation issues identified $250,000 $250, Various Buildings Replace and upgrade water proofing systems $250,000 $250, Various Buildings Replace and upgrade CBD/SBD Pavers and Irrigations systems $250,000 $250, Various Buildings Replace and upgrade Generators and Fuel Systems $250,000 $250, Various Buildings Repaint Exterior of Buildings need such action $250,000 $250, Various Buildings Upgrade and Replace Life Safety Systems such as Fire Detection, Fire Suppression $250,000 $250, Various Buildings Upgrade and Replace Energy/HVAC and Control Systems $250,000 $250, Various Buildings Upgrade and Replace Roofs and Insulation and decking $250,000 $250, Various Buildings Upgrade and Replace Carpet and tile and other floor coverings $250,000 $250, Various Buildings Upgrade and Replace Windows and glazing to higher efficiency resistance to cold and heat $250,000 $250, Various Buildings Address structural and foundation issues identified $250,000 $250, Various Buildings Replace and upgrade water proofing systems $250,000 $250, Various Buildings Replace and upgrade CBD/SBD Pavers and Irrigations systems $250,000 $250, Various Buildings Replace and upgrade Generators and Fuel Systems $250,000 $250, Various Buildings Repaint Exterior of Buildings needing such action $250,000 $250,000 Total $30,685,971,227,539 $3,082,937 $6,866,786 $3,416,420 $1,763,584,521,878 $2,306,800 $2,500,000 $2,500,000 $2,500,000
78 Roads Impact Fees Parks Impact Fees Police Impact Fees Fire Impact Fees Total Impact Fees (roads, parks, police and fire) single family multi family retail/sf office/sf industrial/sf single family multi family single family multi family retail/sf office/sf industrial/sf single family multi family retail/sf office/sf industrial/sf single family multi family retail/sf office/sf industrial/sf Salt Lake City - current $ 8.62 $ 4.20 $ 2.00 $ $ 452 $ 0.30 $ 0.30 $ 0.30 $ 485 $ 485 $ 0.32 $ 0.32 $ 0.32 $ 1,618 $ 1,618 $ 9.24 $ 4.82 $ 2.62 Salt Lake City - draft update $ 450 $ 264 $ $ 2.0 1,752 $ 1,752 $ 357 $ 357 $ 0.24 $ 0.24 $ 0.24 $ 218 $ 218 $ 0.39 $ 0.39 $ 0.39 $ 2,777 $ 2, $ 2.70 $ 2.64 National Average $ 3,227 $ 2,179 $ 5.95 $ 3.36 $ 2.06 $ 2,955 $ 2,254 $ 385 $ 303 $ 4.30 $ 0.26 $ 0.18 $ 512 $ $ 0.38 $ 0.26 $ 7,079 $ 5,617 $ $ 2.69 Western States 3,039 $ 2,036 $ 6.24 $ 3.69 $ 2.0 3,056 $ 2,306 $ 283 $ 236 $ 0.27 $ 0.14 $ $ 506 $ 0.35 $ 0.28 $ 0.26 $ 7,023 $ 5,174 $ 6.82 $ 4.53 $ 2.69 Western Capital Cities $ 2,638 $ 1,839 $ 5.74 $ 4.58 $ 1.90 $ 3,043 $ 1,777 $ 170 $ 137 $ 3.17 $ 0.05 $ 0.06 $ 156 $ 143 $ 0.02 $ 0.08 $ 0.08 $ 6,006 $ 3,896 $ 8.92 $ 4.72 $ 2.03 Similarly Sized-Cities 2 $ 2,267 $ 1,402 $ 5.77 $ 3.67 $ 1.42 $ 2,51 1,904 $ 276 $ 256 $ 0.26 $ 0.14 $ 0.10 $ 366 $ 333 $ 0.23 $ 0.26 $ 0.19 $ 5,467 $ 3,894 $ 6.18 $ 4.08 $ 1.71 Primary cities in similarysized MSAs 3 $ 3,98 1,835 $ 3.95 $ 4.26 $ 2.78 $ 3,036 $ 2,029 $ 505 $ 359 $ 2.56 $ 2.48 $ 1.67 $ 446 $ 302 $ 0.88 $ 0.88 $ 0.59 $ 6,64 3,914 $ 6.07 $ 6.19 $ 4.11 Utah Cities 4 5 $ 1,140 $ 1,073 $ 2.03 $ 1.04 $ 0.63 $ 2,78 1, $ 0.12 $ $ 159 $ 119 $ 0.16 $ 0.14 $ 0.05 $ 4,06 3,154 $ 2.05 $ 1.22 $ 0.73 Source: Galena Consulting Study Team; 2010 National Impact Fee Survey, Duncan Associates Notes: 1) State Average determined by 2010 National Impact Fee Survey, based on non-exhaustive sample of published fees. Average adjusted with the addition of other cities researched by Galena Consulting. Averages include cities that may not be comparable to Salt Lake City in size or circumstances. 2) Between 150,000 and 250,000 population 3) Approx. 1M population 4) Utah cities of similar size, and/or geographic proximity to Salt Lake City 5) Bountiful and Murray do not assess General Fund impact fees 6) Information could not be obtained for Ogden and Orem, but Ogden is believed to have fees
79
80
81
82
83
84 Attachment A Comparison of Impact Fees to Other Municipalities
85 Roads Impact Fees single family multi family retail/sf office/sf industrial/sf Salt Lake City - current $ 8.62 $ 4.20 $ 2.00 Salt Lake City mayor fee $ 450 $ 264 $ $ 2.01 Salt Lake City - council adopted fee $ 424 $ 249 $ 3.28 $ National Average Sample Size $ 3,227 $ 2,179 $ 5.95 $ 3.36 $ 2.06 Western States 1 Sample Size Arizona 30 $ 2,630 $ 1,818 $ 4.40 $ California 37 $ 6,499 $ 4,322 $ $ 6.76 $ 3.96 Colorado 17 $ 2,69 1,897 $ $ 1.93 Idaho 3,456 $ 1,950 $ 8.86 $ 9.28 $ 2.13 Montana 3,432 $ 2,124 $ 5.93 $ 1.96 $ 1.46 New Mexico 8 $ 2,932 $ 1,815 $ 3.80 $ 3.18 $ 2.32 Nevada 5 $ 2,15 1,676 $ $ 1.48 Oregon 1 3,573 $ 2,482 $ 7.90 $ 4.23 $ 2.88 Utah 18 $ 1,140 $ 1,073 $ 2.03 $ 1.04 $ 0.63 Washington 15 $ 1,889 $ 1,198 $ 4.72 $ 3.26 $ 2.15 average $ 3,039 $ 2,036 $ 6.24 $ 3.69 $ $ 2.26 Western Capital Cities Population Phoenix AZ 1,445,632 $ 650 $ 449 $ 0.99 $ 0.68 $ 0.41 Sacramento CA 486,189 $ 4,65 3, $ 2.16 Boise ID 211,720 $ 3,456 $ 1,950 $ 8.86 $ 9.28 $ 2.13 Santa Fe NM 75,764 $ 2,100 $ 1,554 $ 4.60 $ 2.42 $ 1.61 Salem OR 156,690 $ 1,953 $ 1,274 $ 8.14 $ 2.09 $ 1.32 Olympia WA 42,514 $ 3,015 $ 1,957 $ 4.84 $ 6.46 $ 3.74 average $ 2,638 $ 1,839 $ 5.74 $ 4.58 $ 1.90 Similarly Sized-Cities 2 Chandler AZ 247,140 $ 3,983 $ 2,446 $ 7.39 $ 5.88 $ 1.66 Gilbert AZ 216,449 $ 423 $ 297 $ 1.59 $ 0.57 $ 0.41 Glendale AZ 251,522 $ 1,160 $ $ 2.17 $ 1.23 Boise ID 211,720 $ 3,535 $ 1,950 $ 8.86 $ 9.28 $ 2.13 Reno NV 218,000 $ 4,177 $ 2,845 $ $ 2.53 Salem OR 156,690 $ 1,953 $ 1,274 $ 8.14 $ 2.09 $ 1.32 Spokane WA 208,916 $ 638 $ 412 $ 2.65 $ average $ 2,267 $ 1,402 $ 5.77 $ 3.67 $ 1.42 Primary cities in similary-sized MSAs 3 Tucson AZ 541,81 4,300 $ 2,150 $ 4.28 $ 5.09 $ 2.20 Fresno CA 495,913 per acre per acre per acre per acre per acre Albuquerque NM 528,497 $ 3,662 $ 1,520 $ $ 3.35 Utah Cities 4 5 average $ 3,98 1,835 $ 3.95 $ 4.26 $ 2.78 Draper UT 42,274 $ 1,447 $ 994 $ $ 1.05 Herriman UT 21,785 Layton UT 67,31 2,399 $ 1,508 $ 3.73 $ 2.19 $ 2.55 Lehi UT 47,407 $ 1,513 $ 1,513 $ 1.04 $ 1.04 $ 0.21 Logan UT 48,174 $ 669 $ $ 0.14 $ 0.05 Park City UT 7,558 $ 315 $ 290 $ Provo UT 112,488 $ 986 $ 657 $ 2.40 $ Riverton UT 38,753 $ 764 $ 2,675 $ 3.20 $ 1.60 $ 0.67 St George UT 72,897 $ 754 $ 754 unavailable unavailable unavailable Sandy UT 87, South Jordan UT 50,418 $ 1,880 $ 1,316 $ 4.74 $ 2.94 $ 1.31 Tooele UT 31,605 $ 1,515 West Jordan UT 103,712 $ 1,89 4,340 $ 4.34 $ 1.4 $ 0.77 West Valley UT 129,480 $ 846 $ 514 $ 1.34 $ 1.2 $ 0.81 average $ 1,140 $ 1,073 $ 2.03 $ 1.0 $ 0.63
86 Parks Impact Fees single family multi family Salt Lake City - current $ Salt Lake City Mayor Fee $ 1,752 $ 1,752 Salt Lake City - council adopted fee $ 3,999 $ 3,999 National Average Sample Size $ 2,955 $ 2,254 Western States 1 Sample Size Arizona 30 $ 2,385 $ 1,801 California 37 $ 8,622 $ 6,681 Colorado 17 $ 3,560 $ 2,774 Idaho 1,355 $ 1,050 Montana 738 $ 738 New Mexico 8 $ 1,747 $ 1,261 Nevada 5 $ 2,034 $ 1,625 Oregon 1 5,095 $ 3,817 Utah 18 $ 2,78 1,811 Washington 15 $ 2,244 $ 1,506 average $ 3,056 $ 2,306 Western Capital Cities Population Phoenix AZ 1,445,632 $ 4,018 $ 1,876 Sacramento CA 486,189 $ 5,19 3,058 Boise ID 211,720 $ 1,355 $ 1,050 Santa Fe NM 75,764 $ 1,214 $ 971 Salem OR 156,690 $ 3,548 $ 1,937 Olympia WA 42,514 $ 2,930 $ 1,771 average $ 3,043 $ 1,777 Similarly Sized-Cities 2 Chandler AZ 247,140 $ 5,057 $ 3,873 Gilbert AZ 216,449 $ 4,547 $ 3,911 Glendale AZ 251,522 $ 2,072 $ 1,555 Boise ID 211,720 $ 1,355 $ 1,050 Reno NV 218,000 $ 1,000 $ 1,000 Salem OR 156,690 $ 3,548 $ 1,937 Spokane WA 208,916 $ - average $ 2,51 1,904 Primary cities in similary-sized MSAs 3 Tucson AZ 541,81 1,720 $ 860 Fresno CA 495,913 $ 3,398 $ 2,764 Albuquerque NM 528,497 $ 3,990 $ 2,463 average $ 3,036 $ 2,029 Utah Cities 4 5 Draper UT 42,274 $ 3,990 $ 2,463 Herriman UT 21,785 $ 3,445 $ 3,445 Layton UT 67,31 1,873 $ 1,381 Lehi UT 47,407 $ 3,819 $ 3,198 Logan UT 48,174 $ - Park City UT 7,558 $ 3,855 $ 3,150 Provo UT 112,488 $ 3,088 $ 2,391 Riverton UT 38,753 $ 2,675 $ 469 St George UT 72,897 $ 2,730 $ 2,730 Sandy UT 87,46 3,316 $ 1,841 South Jordan UT 50,418 $ 4,346 $ 2,850 Tooele UT 31,605 $ 2,125 $ - West Jordan UT 103,712 $ 1,633 $ - West Valley UT 129,480 $ 2,032 $ 1,429 average $ 2,78 1,811
87 Police Impact Fees single family multi family retail/sf office/sf industrial/sf Salt Lake City - current $ 452 $ 452 $ 0.30 $ 0.30 $ 0.30 Salt Lake City Mayor Fee $ 357 $ 357 $ 0.24 $ 0.24 $ 0.24 Salt Lake City council adopted fee $ $ $ National Average Sample Size $ 385 $ 303 $ 4.30 $ 0.26 $ 0.18 Western States 1 Sample Size Arizona 30 $ 467 $ 368 $ 0.59 $ 0.28 $ 0.20 California 37 $ 802 $ 635 $ 0.68 $ 0.52 $ 0.40 Colorado 17 $ 356 $ 325 $ 0.28 $ 0.26 $ 0.15 Idaho 628 $ 628 $ 0.08 $ 0.08 Montana - New Mexico 8 $ $ $ 0.06 Nevada 5 Oregon 1 - Utah 18 $ $ 0.12 $ Washington 15 $ $ 0.79 $ average $ 283 $ 236 $ 0.27 $ 0.14 $ 0.11 Western Capital Cities Population Phoenix AZ 1,445,632 $ 344 $ 153 $ $ 0.20 $ 0.22 Sacramento CA 486,189 Boise ID 211,720 $ 628 $ 628 $ 0.08 $ 0.08 Santa Fe NM 75,764 $ 48 $ 39 $ 0.04 $ 0.03 Salem OR 156,690 Olympia WA 42,514 average $ 170 $ 137 $ 3.17 $ 0.05 $ 0.06 Similarly Sized-Cities 2 Chandler AZ 247,140 $ 268 $ $ 0.28 $ 0.09 Gilbert AZ 216,449 $ 643 $ 643 $ 0.34 $ 0.34 $ 0.34 Glendale AZ 251,522 $ 395 $ 297 $ 0.58 $ 0.30 $ 0.17 Boise ID 211,720 $ 628 $ 628 $ 0.08 $ 0.08 Reno NV 218,000 Salem OR 156,690 Spokane WA 208,916 average $ 276 $ 256 $ 0.26 $ 0.14 $ 0.10 Primary cities in similary-sized MSAs 3 Tucson AZ 541, $ 499 $ 0.70 $ 0.70 $ 0.70 Fresno CA 495,913 $ 624 $ 508 $ 6.65 $ 6.65 $ 4.22 Albuquerque NM 528,497 $ 218 $ $ 0.08 $ 0.08 average $ 505 $ 359 $ 2.56 $ 2.48 $ 1.67 Utah Cities 4 5 Draper UT 42,274 $ 218 $ Herriman UT 21,785 Layton UT 67,31 - $ 0.07 Lehi UT 47,407 $ 340 $ 340 $ 0.07 $ 0.07 $ 0.07 Logan UT 48,174 $ 34 $ 28 $ 0.03 $ 0.03 $ 0.01 Park City UT 7,558 $ 605 $ 495 $ 0.56 $ 0.56 $ 0.45 Provo UT 112,488 Riverton UT 38,753 $ 308 $ 308 $ 0.09 $ 0.02 $ 0.31 St George UT 72,897 $ 109 $ 109 $ 0.10 $ 0.07 $ 0.01 Sandy UT 87, $ South Jordan UT 50,418 $ 323 $ 208 Tooele UT 31,605 $ 350 $ 320 $ 0.32 $ 0.32 $ 0.32 West Jordan UT 103,712 $ 105 $ 160 $ 0.14 $ 0.08 $ 0.05 West Valley UT 129,480 $ 66 $ 45 $ $ 0.04 average $ $ 0.12 $
88 Fire Impact Fees single family multi family retail/sf office/sf industrial/sf Salt Lake City - current $ 485 $ 485 $ 0.32 $ 0.32 $ 0.32 Salt Lake City mayor fee $ 218 $ 218 $ 0.39 $ 0.39 $ 0.39 Salt Lake City adopted council fee $ 119 $ 119 $ 0.32 $ 0.32 $ 0.32 National Average Sample Size $ 512 $ $ 0.38 $ 0.26 Western States 1 Sample Size Arizona 30 $ 634 $ $ 0.53 $ 0.36 California 37 $ 1,022 $ 690 $ 0.58 $ Colorado 17 $ 644 $ 407 $ 0.33 $ 0.35 $ 0.25 Idaho 479 $ 479 $ 0.25 $ 0.25 Montana 823 $ 692 $ 0.19 $ 0.19 $ 0.19 New Mexico 8 $ 477 $ 308 $ 0.57 $ 0.37 $ 0.36 Nevada 5 $ 1,780 $ 1,180 $ 0.80 $ 0.14 $ 0.57 Oregon 1 - Utah 18 $ 159 $ 119 $ 0.16 $ 0.14 $ 0.05 Washington 15 $ 634 $ 670 $ 0.38 $ 0.26 $ 0.26 average $ 665 $ 506 $ 0.35 $ 0.28 $ 0.26 Western Capital Cities Population Phoenix AZ 1,445,632 $ 322 $ 270 $ 0.10 $ 0.12 $ 0.17 Sacramento CA 486,189 Boise ID 211,720 $ 479 $ 479 $ 0.25 $ 0.25 Santa Fe NM 75,764 $ 136 $ 110 $ 0.12 $ 0.07 Salem OR 156,690 Olympia WA 42,514 average $ 156 $ 143 $ 0.02 $ 0.08 $ 0.08 Similarly Sized-Cities 2 Chandler AZ 247,140 $ 577 $ 442 $ 0.72 $ 0.55 $ 0.18 Gilbert AZ 216,449 $ 1,100 $ 1,100 $ 0.59 $ 0.59 $ 0.59 Glendale AZ 251,522 $ 409 $ 307 $ 0.30 $ 0.45 $ 0.28 Boise ID 211,720 $ 479 $ 479 $ 0.25 $ 0.25 Reno NV 218,000 Salem OR 156,690 Spokane WA 208,916 average $ 366 $ 333 $ 0.23 $ 0.26 $ 0.19 Primary cities in similary-sized MSAs 3 Tucson AZ 541, $ 360 $ 0.27 $ 0.27 $ 0.27 Fresno CA 495,913 $ 539 $ 439 $ 2.36 $ 2.36 $ 1.50 Albuquerque NM 528,497 $ 310 $ 107 Utah Cities 4 5 average $ 446 $ 302 $ 0.88 $ 0.88 $ 0.59 Draper UT 42,274 $ 310 $ 107 $ $ 0.04 Herriman UT 21,785 Layton UT 67, $ 0.47 Lehi UT 47,407 $ 576 $ 576 $ 0.25 $ 0.25 $ 0.25 Logan UT 48,174 $ 118 $ 85 $ 0.09 $ 0.10 $ 0.02 Park City UT 7,558 Provo UT 112,488 Riverton UT 38,753 St George UT 72,897 $ 216 $ 216 $ 0.18 $ 0.19 $ 0.06 Sandy UT 87, $ 92 $ 0.32 $ 0.09 $ 0.13 South Jordan UT 50,418 Tooele UT 31,605 West Jordan UT 103,712 $ 247 $ 140 $ 0.16 $ 0.20 $ 0.13 West Valley UT 129,480 $ 9 62 $ 0.16 $ average $ 159 $ 119 $ 0.16 $ 0.14 $ 0.05
89 Total Impact Fees (roads, parks, police and fire) single family multi family retail/sf office/sf industrial/sf Salt Lake City - current $ 1,618 $ 1,618 $ 9.24 $ 4.82 $ 2.62 Salt Lake City - mayor fee $ 2,777 $ 2, $ 2.70 $ 2.64 Salt Lake City - Adopted Council Fee $ 4,583 $ 4,408 $ 3.63 $ 2.68 $ 2 61 National Average Sample Size $ 7,079 $ 5,617 $ $ 2.69 Western States 1 Sample Size Arizona 30 $ 6,116 $ 4,640 $ 5.22 $ 3.08 $ 1.89 California 37 $ 16,945 $ 15,496 $ $ $ 7.40 Colorado 17 $ 7,25 4,759 $ $ 5.86 $ 3.07 Idaho 5,918 $ 4,107 $ 8.86 $ Montana 4,993 $ 2,816 $ 6.12 $ 2.15 $ 1.65 New Mexico 8 $ 5,387 $ 2,772 $ 4.40 $ 3.46 $ 2.97 Nevada 5 $ 5,965 $ 3,735 $ 2.65 $ 1.79 $ 1.30 Oregon 1 8,668 $ 6, $ 4.50 $ 3.17 Utah 18 $ 4,06 3, Washington 15 $ 4,928 $ 4,120 $ 4.57 $ 3.19 $ 2.29 average $ 7,023 $ 5,174 $ 6.82 $ 4.53 $ 2.69 Western Capital Cities Population Phoenix AZ 1,445,632 $ 5,334 $ 2,748 $ $ 1.00 $ 0.80 Sacramento CA 486,189 $ 9,842 $ 6,909 $ $ 2.16 Boise ID 211,720 $ 5,918 $ 4,107 $ 8.86 $ Santa Fe NM 75,764 $ 3,498 $ 2,674 $ 4.60 $ 2.58 $ 1.71 Salem OR 156,690 $ 5,50 3, $ 2.09 $ 1.32 Olympia WA 42,514 $ 5,945 $ 3,728 $ 4.84 $ 6.46 $ 3.74 average $ 6,006 $ 3,896 $ 8.92 $ 4.72 $ 2.03 Similarly Sized-Cities 2 Chandler AZ 247,140 $ 9,885 $ 6,982 $ 8.48 $ Gilbert AZ 216,449 $ 6,713 $ 5, $ 1.50 $ 1.34 Glendale AZ 251,522 $ 4,036 $ 2,750 $ $ 1.68 Boise ID 211,720 $ 5,997 $ 4,107 $ 8.86 $ Reno NV 218,000 $ 5,50 3,845 $ $ 2.53 Salem OR 156,690 $ 5,50 3, $ 2.09 $ 1.32 Spokane WA 208,916 $ 638 $ 412 $ 2.65 $ average $ 5,467 $ 3,894 $ 6.18 $ 4.08 $ 1.71 Primary cities in similary-sized MSAs 3 Tucson AZ 541,81 7,182 $ 3,869 $ 5.25 $ 6.06 $ 3.17 Fresno CA 495,913 $ 4,56 3, Albuquerque NM 528,497 $ 8,180 $ 4, $ 3.50 $ 3.43 Utah Cities 4 5 average $ 6,64 3,914 $ 6.07 $ 6.19 $ 4.11 Draper UT 42,274 $ 5,965 $ 3,635 $ 3.95 $ 2.58 $ 1.13 Herriman UT 21,785 $ 3,445 $ 3,445 Layton UT 67,31 4,773 $ 3,280 $ 4.38 $ 2.66 $ 2.62 Lehi UT 47,407 $ 6,248 $ 5,627 $ 1.36 $ 1.36 $ 0.53 Logan UT 48,174 $ $ 0.42 $ 0.27 $ 0.08 Park City UT 7,558 $ 4,775 $ 3,935 $ 0.97 $ 0.97 $ 0.77 Provo UT 112,488 $ 4,074 $ 3,048 $ 2.40 $ Riverton UT 38,753 $ 3,747 $ 3,452 $ 3.29 $ 1.62 $ 0.98 St George UT 72,897 $ 3,809 $ 3,809 $ 0.28 $ 0.26 $ 0.07 Sandy UT 87,46 4,538 $ 1,973 $ 0.32 $ 0.30 $ 0.19 South Jordan UT 50,418 $ 6,549 $ 4,374 $ 4.74 $ 2.94 $ 1.31 Tooele UT 31,605 $ 3,990 $ 320 $ 0.32 $ 0.32 $ 0.32 West Jordan UT 103,712 $ 1,089 $ 4,640 $ 4.64 $ 1.75 $ 0.95 West Valley UT 129,480 $ 3,035 $ 2,050 $ $ 0.90 average $ 4,06 3,154 $ 2.05 $ 1.22 $ 0.73
90 Roads Impact Fees Parks Impact Fees Police Impact Fees Fire Impact Fees Total Impact Fees (roads, parks, police and fire) single family multi family retail/sf office/sf industrial/sf single family multi family single family multi family retail/sf office/sf industrial/sf single family multi family retail/sf office/sf industrial/sf single family multi family retail/sf office/sf industrial/sf Salt Lake City - current $ 8.62 $ 4.20 $ 2.00 $ $ 452 $ 0.30 $ 0.30 $ 0.30 $ 485 $ 485 $ 0.32 $ 0.32 $ 0.32 $ 1,618 $ 1,618 $ 9.24 $ 4.82 $ 2.62 Salt Lake City - draft update $ 450 $ 264 $ $ 2.0 1,752 $ 1,752 $ 357 $ 357 $ 0.24 $ 0.24 $ 0.24 $ 218 $ 218 $ 0.39 $ 0.39 $ 0.39 $ 2,777 $ 2, $ 2.70 $ 2.64 National Average $ 3,227 $ 2,179 $ 5.95 $ 3.36 $ 2.06 $ 2,955 $ 2,254 $ 385 $ 303 $ 4.30 $ 0.26 $ 0.18 $ 512 $ $ 0.38 $ 0.26 $ 7,079 $ 5,617 $ $ 2.69 Western States 3,039 $ 2,036 $ 6.24 $ 3.69 $ 2.0 3,056 $ 2,306 $ 283 $ 236 $ 0.27 $ 0.14 $ $ 506 $ 0.35 $ 0.28 $ 0.26 $ 7,023 $ 5,174 $ 6.82 $ 4.53 $ 2.69 Western Capital Cities $ 2,638 $ 1,839 $ 5.74 $ 4.58 $ 1.90 $ 3,043 $ 1,777 $ 170 $ 137 $ 3.17 $ 0.05 $ 0.06 $ 156 $ 143 $ 0.02 $ 0.08 $ 0.08 $ 6,006 $ 3,896 $ 8.92 $ 4.72 $ 2.03 Similarly Sized-Cities 2 $ 2,267 $ 1,402 $ 5.77 $ 3.67 $ 1.42 $ 2,51 1,904 $ 276 $ 256 $ 0.26 $ 0.14 $ 0.10 $ 366 $ 333 $ 0.23 $ 0.26 $ 0.19 $ 5,467 $ 3,894 $ 6.18 $ 4.08 $ 1.71 Primary cities in similarysized MSAs 3 $ 3,98 1,835 $ 3.95 $ 4.26 $ 2.78 $ 3,036 $ 2,029 $ 505 $ 359 $ 2.56 $ 2.48 $ 1.67 $ 446 $ 302 $ 0.88 $ 0.88 $ 0.59 $ 6,64 3,914 $ 6.07 $ 6.19 $ 4.11 Utah Cities 4 5 $ 1,140 $ 1,073 $ 2.03 $ 1.04 $ 0.63 $ 2,78 1, $ 0.12 $ $ 159 $ 119 $ 0.16 $ 0.14 $ 0.05 $ 4,06 3,154 $ 2.05 $ 1.22 $ 0.73 Source: Galena Consulting Study Team; 2010 National Impact Fee Survey, Duncan Associates Notes: 1) State Average determined by 2010 National Impact Fee Survey, based on non-exhaustive sample of published fees. Average adjusted with the addition of other cities researched by Galena Consulting. Averages include cities that may not be comparable to Salt Lake City in size or circumstances. 2) Between 150,000 and 250,000 population 3) Approx. 1M population 4) Utah cities of similar size, and/or geographic proximity to Salt Lake City 5) Bountiful and Murray do not assess General Fund impact fees 6) Information could not be obtained for Ogden and Orem, but Ogden is believed to have fees
91
92
93
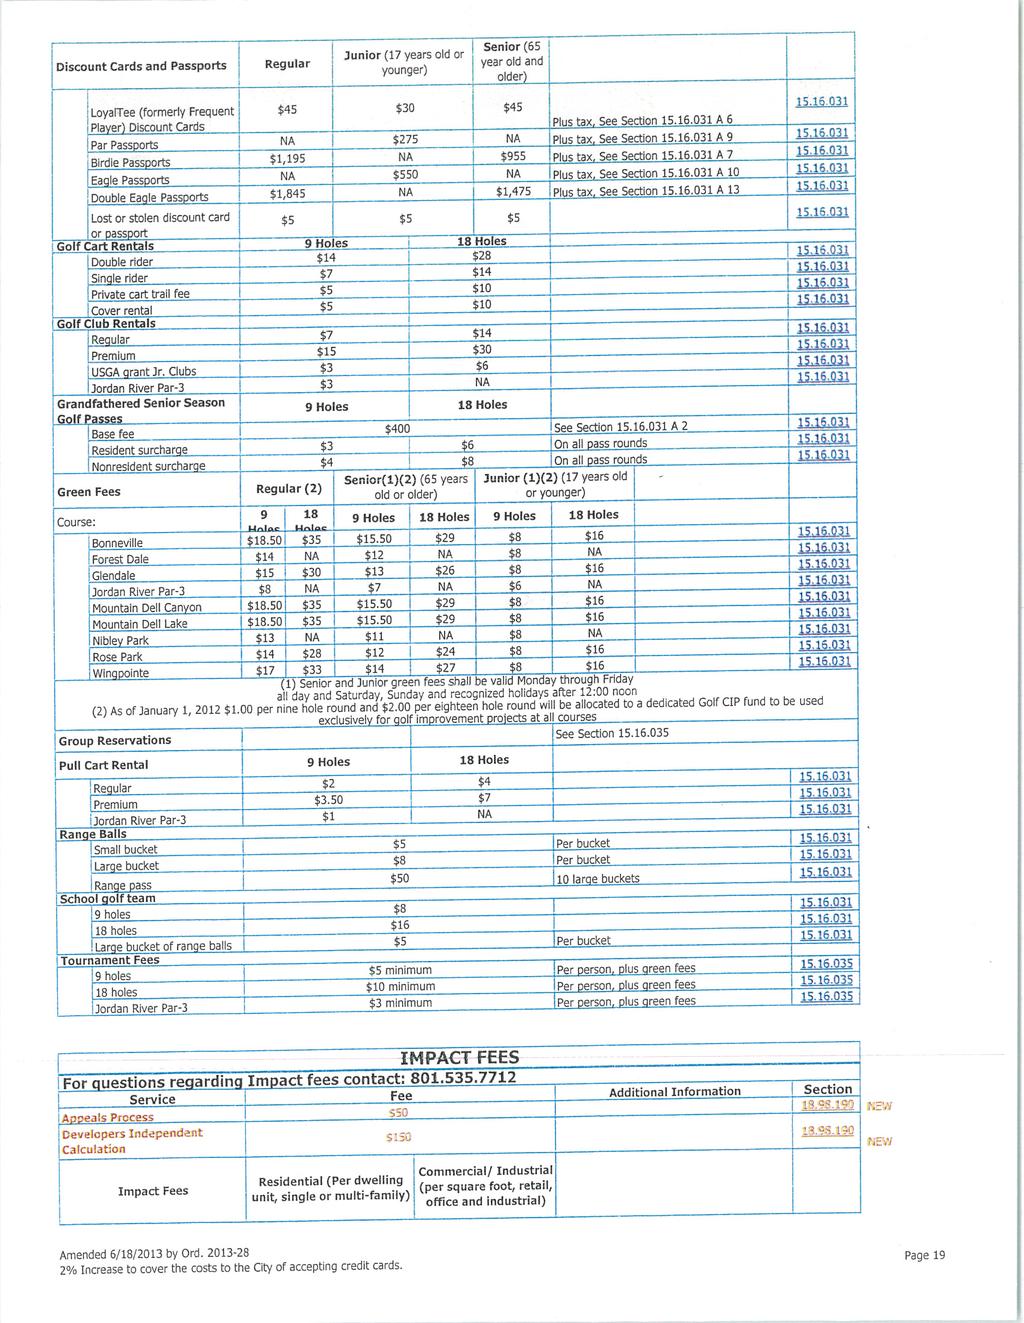
94
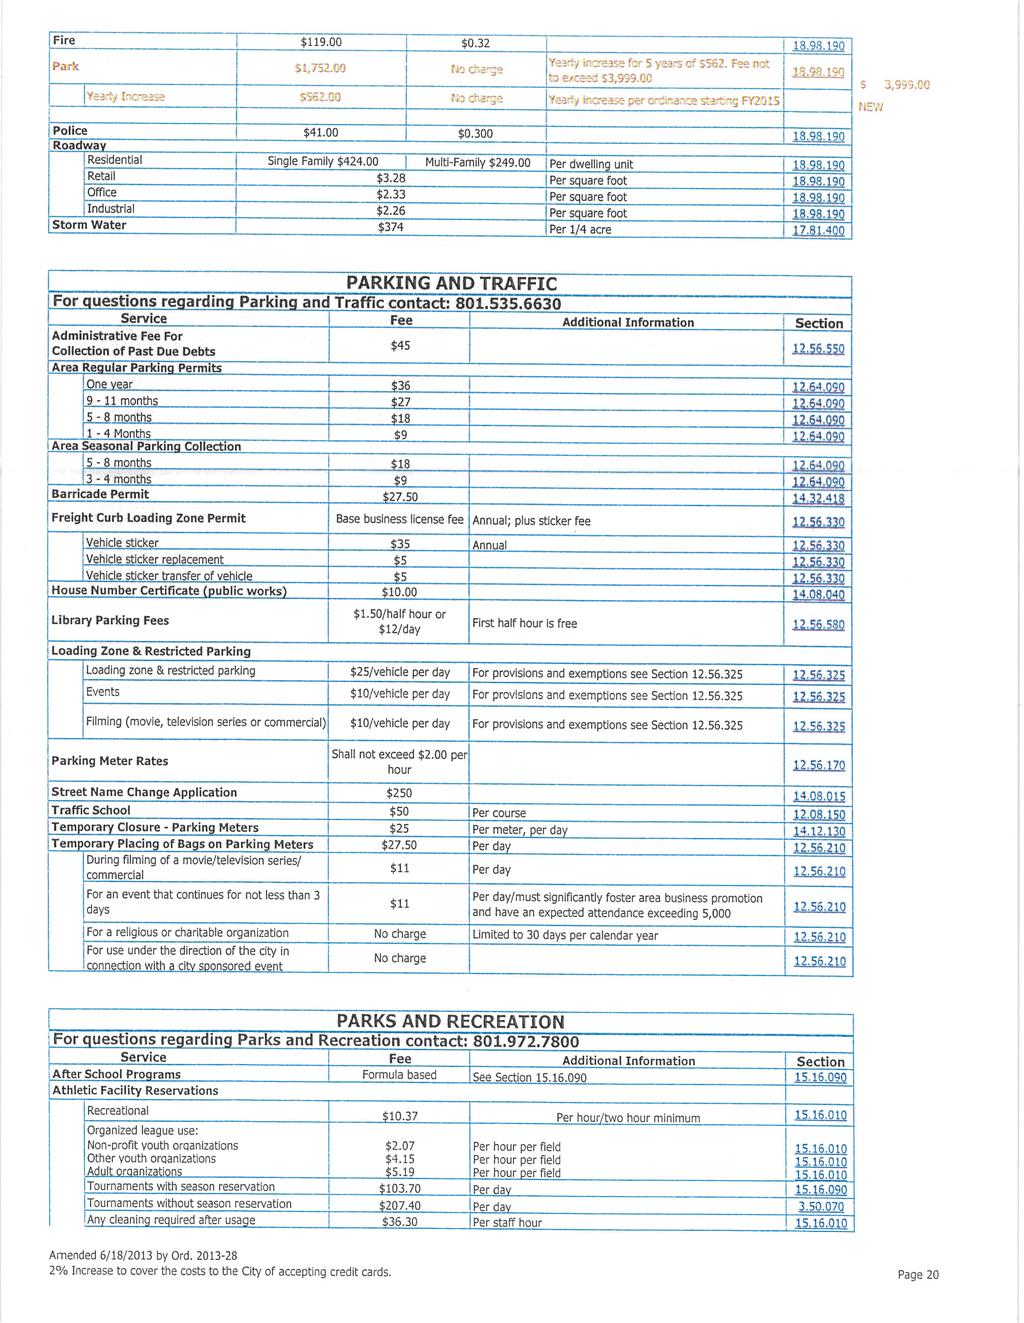
95
96
97
98
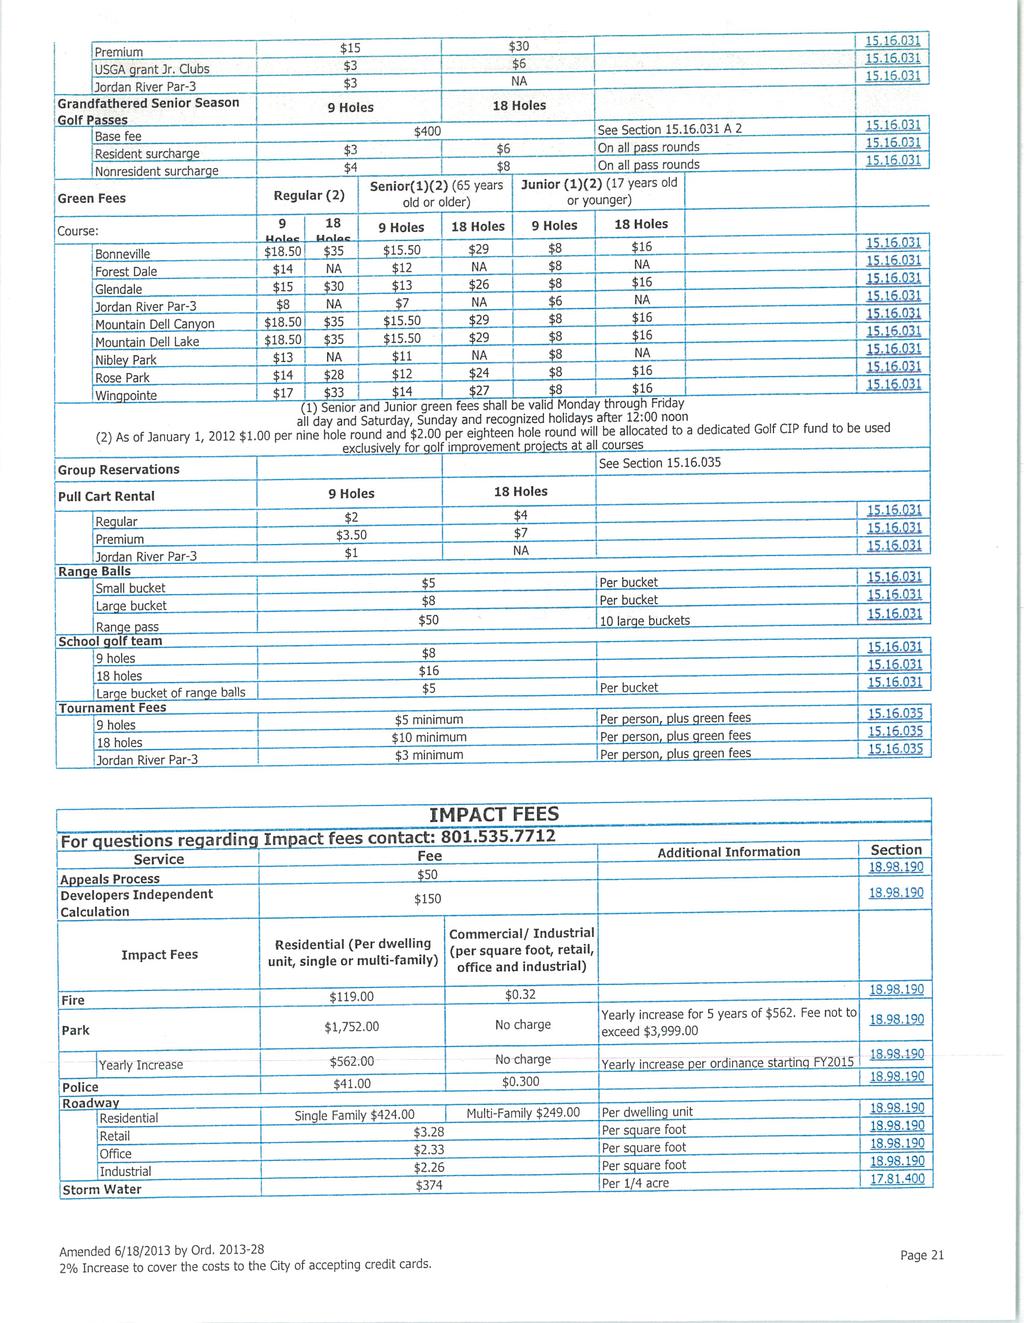
99
COUNCIL BUDGET STAFF REPORT
 COUNCIL BUDGET STAFF REPORT CITY COUNCIL of SALT LAKE CITY www.slccouncil.com/city-budget TO: City Council Members Project Timeline: FROM: Jennifer Bruno, Sylvia Richards, Sean Murphy, Lehua Weaver Budget
GRASS VALLEY TRANSPORTATION IMPACT FEE PROGRAM NEXUS STUDY
 HEARING REPORT GRASS VALLEY TRANSPORTATION IMPACT FEE PROGRAM NEXUS STUDY Prepared for: City of Grass Valley Prepared by: Economic & Planning Systems, Inc. March 2008 EPS #17525 S A C R A M E N T O 2150
PLEASANT GROVE, UTAH TRANSPORTATION IMPACT FEE FACILITIES PLAN AND ANALYSIS
 PLEASANT GROVE, UTAH TRANSPORTATION IMPACT FEE FACILITIES PLAN AND OCTOBER 2012 PREPARED BY: LEWIS YOUNG ROBERTSON & BURNINGHAM IMPACT FEE CERTIFICATION Impact Fee Facilities Plan (IFFP) Certification
City of Redding, California Development Impact Mitigation Fee Nexus Study
 , California Development Impact Mitigation Fee Nexus Study December 5, 2017 Prepared by helping communities fund to morrow This page intentionally left blank. TABLE OF CONTENTS Executive Summary...1 Background
Kootenai County, Idaho Impact Fee Study and Capital Improvement Plans
 Final Draft Report April 15, 2008 Kootenai County, Idaho Impact Fee Study and Capital Improvement Plans Prepared for Kootenai County 451 North Government Way Coeur d Alene, ID 83816 Prepared by BBC Research
TAUSSIG DEVELOPMENT IMPACT FEE JUSTIFICATION STUDY CITY OF ESCALON. Public Finance Public Private Partnerships Urban Economics Clean Energy Bonds
 DAVID TAUSSIG & ASSOCIATES, INC. DEVELOPMENT IMPACT FEE JUSTIFICATION STUDY CITY OF ESCALON B. C. SEPTEMBER 12, 2016 Public Finance Public Private Partnerships Urban Economics Clean Energy Bonds Prepared
MOTION SHEET. MOTION 2 I move that the Council not adopt the proposed ordinances. City Council Members. FROM: Jennifer Bruno Deputy Director
 MOTION SHEET CITY COUNCIL of SALT LAKE CITY TO: City Council Members FROM: Jennifer Bruno Deputy Director DATE: April 22, 2014 RE: MOTION SHEET Impact Fee Revisions Council Sponsor: Stan Penfold VIEW ADMINISTRATION
ANNUAL REPORT
 2018 ANNUAL REPORT 1 2018 ANNUAL REPORT 3 TABLE OF CONTENTS PRESIDENT S REPORT 4 CHAIRPERSON S REPORT 6 SUPERVISORY AUDITS 8 BOARD OF DIRECTORS 9 SUPERVISORY COMMITTEE 9 IMPROVING MEMBERS LIVES 10 HONORING
CITY OF SACRAMENTO CALIFORNIA. April 27, 2012
 OFFICE OF THE CITY MANAGER CALIFORNIA April 27, 2012 CITY HALL 5 th FLOOR 915 I STREET SACRAMENTO, CA 95814-2684 PH 916-808-5704 FAX 916-808-7618 Honorable Mayor and City Council Sacramento, California
System Development Charge Methodology
 City of Springfield System Development Charge Methodology Stormwater Local Wastewater Transportation Prepared By City of Springfield Public Works Department 225 Fifth Street Springfield, OR 97477 November
Quigley Canyon Ranch Cost/Benefit Study Update
 Quigley Canyon Ranch Cost/Benefit Study Update April 26, 2012 RICHARD CAPLAN & ASSOCIATES Mayor Fritz Haemmerle Hailey City Council 115 Main Street Hailey, ID 83333 April 26, 2012 Dear Mayor Haemmerle
City Services Appendix
 Technical vices 1.0 Introduction... 1 1.1 The Capital Facilities Plan... 1 1.2 Utilities Plan... 2 1.3 Key Principles Guiding Bremerton s Capital Investments... 3 1.4 Capital Facilities and Utilities Addressed
City of Antioch Development Impact Fee Study
 Report City of Antioch Development Impact Fee Study Prepared for: City of Antioch Prepared by: Economic & Planning Systems, Inc. February 2014 EPS #20001 Table of Contents 1. INTRODUCTION AND RESULTS...
Presented By: L. Carson Bise II, AICP President
 Impact Fee Basics: Methodology and Fee Design Presented By: L. Carson Bise II, AICP President Basic Options for One-Time Infrastructure Charges Funding from broad-based revenues (general taxes) Growth
SPRINGVILLE CITY CULINARY WATER IMPACT FEE ANALYSIS (IFA) MAY 2014
 MAY 2014") SPRINGVILLE CITY CULINARY WATER IMPACT FEE ANALYSIS (IFA) MAY 2014 Adopted May 20, 2014 TABLE OF CONTENTS IMPACT FEE CERTIFICATION... 3 SECTION 1: EXECUTIVE SUMMARY... 4 PROPOSED CULINARY WATER IMPACT
SPRINGVILLE CITY CULINARY WATER IMPACT FEE ANALYSIS (IFA) MAY 2014 Adopted May 20, 2014 TABLE OF CONTENTS IMPACT FEE CERTIFICATION... 3 SECTION 1: EXECUTIVE SUMMARY... 4 PROPOSED CULINARY WATER IMPACT
SPRINGVILLE CITY PRESSURIZED IRRIGATION IMPACT FEE ANALYSIS (IFA) MAY 2014
 MAY 2014") SPRINGVILLE CITY PRESSURIZED IRRIGATION IMPACT FEE ANALYSIS (IFA) MAY 2014 Adopted May 20, 2014 TABLE OF CONTENTS IMPACT FEE CERTIFICATION... 3 SECTION 1: EXECUTIVE SUMMARY... 4 PROPOSED PRESSURIZED IRRIGATION
SPRINGVILLE CITY PRESSURIZED IRRIGATION IMPACT FEE ANALYSIS (IFA) MAY 2014 Adopted May 20, 2014 TABLE OF CONTENTS IMPACT FEE CERTIFICATION... 3 SECTION 1: EXECUTIVE SUMMARY... 4 PROPOSED PRESSURIZED IRRIGATION
City Council Report 915 I Street, 1 st Floor Sacramento, CA
 City Council Report 915 I Street, 1 st Floor Sacramento, CA 95814 www.cityofsacramento.org File ID: 2017-01623 January 9, 2018 Consent Item 04 Title: Mitigation Fee Act Annual Report for the Year Ending
Millcreek City. Parks, Recreation, Trails and Open Space Impact Fee Facilities Plan DRAFT
 Millcreek City s, Recreation, Trails and Open Space Impact Fee Facilities Plan DRAFT May 2, 2018 Contents Contents... 2 Summary... 3 Background... 3 Identify the Existing and Proposed Levels of Service
HACKBERRY HIDDEN COVE PUBLIC IMPROVEMENT DISTRICT NO. 2 SERVICE AND ASSESSMENT PLAN (UTILITY IMPROVEMENTS)
") HACKBERRY HIDDEN COVE PUBLIC IMPROVEMENT DISTRICT NO. 2 SERVICE AND ASSESSMENT PLAN (UTILITY IMPROVEMENTS) SEPTEMBER 15, 2009 HACKBERRY HIDDEN COVE PUBLIC IMPROVEMENT DISTRICT NO. 2 SERVICE AND ASSESSMENT
HACKBERRY HIDDEN COVE PUBLIC IMPROVEMENT DISTRICT NO. 2 SERVICE AND ASSESSMENT PLAN (UTILITY IMPROVEMENTS) SEPTEMBER 15, 2009 HACKBERRY HIDDEN COVE PUBLIC IMPROVEMENT DISTRICT NO. 2 SERVICE AND ASSESSMENT
Millcreek City. DRAFT Parks, Recreation, Trails and Open Space Impact Fee Analysis
 Millcreek City DRAFT Parks, Recreation, Trails and Open Space Impact Fee Analysis May 2, 2018 Table of Contents Table of Contents... 2 Summary of Impact Fee Analysis (IFA)... 3 Impact on Consumption of
PARK AND RECREATION IMPACT FEE ANALYSIS (IFA) MANTUA, UT JUNE 2018 DRAFT
 MANTUA, UT JUNE 2018 DRAFT") PARK AND RECREATION IMPACT FEE ANALYSIS (IFA) MANTUA, UT JUNE 2018 TABLE OF CONTENTS IMPACT FEE CERTIFICATION... 3 DEFINITIONS... 4 SECTION 1: EXECUTIVE SUMMARY... 5 SECTION 2: GENERAL IMPACT FEE METHODOLOGY...
PARK AND RECREATION IMPACT FEE ANALYSIS (IFA) MANTUA, UT JUNE 2018 TABLE OF CONTENTS IMPACT FEE CERTIFICATION... 3 DEFINITIONS... 4 SECTION 1: EXECUTIVE SUMMARY... 5 SECTION 2: GENERAL IMPACT FEE METHODOLOGY...
DEVELOPMENT IMPACT FEE ADVISORY COMMITTEE Wednesday, September 9, 2015 Boise Depot - Meeting Station
 DEVELOPMENT IMPACT FEE ADVISORY COMMITTEE Wednesday, Boise Depot - Meeting Station MINUTES I. Call to Order Committee Chair, David Yorgason, called the meeting to order at 12:05 p.m. II. III. Attendance:
Town of Prescott Valley 2014 Development Impact Fee Report. Raftelis Financial Consultants, Inc.
 Town of Prescott Valley 2014 Development Impact Fee Report Raftelis Financial Consultants, Inc. February 13, 2014 Table of Contents Purpose of this Report... 1 Existing Development Impact Fees... 1 Summary
Performance Audit Report
 Performance Audit Report Use of Impact Fees in Federal Way, Olympia, Maple Valley, Redmond and Vancouver Report No. 1000014 October 14, 2008 AUDITOR OF STATE WA S H I N G T O N NOV 11, 1889 Washington
CITY OF BLUE ASH Interoffice Memo City Manager's Office
 TO: FROM: SUBJECT: CITY OF BLUE ASH Interoffice Memo City Manager's Office City Council City Manager and Department Directors Agenda Items for the November 9 th Council Meeting DATE: November 7, 2017 COPIES:
Pierce County School Impact Fee Program Review
 Pierce County School Impact Fee Program Review Pierce County DISCUSSION DRAFT March 15, 2018 Prepared for: Pierce County Prepared by: Community Attributes Inc. tells data-rich stories about communities
2017 WATER AND WASTEWATER IMPACT FEE STUDY CITY OF AZLE, TEXAS
 2017 WATER AND WASTEWATER IMPACT FEE STUDY CITY OF AZLE, TEXAS JULY 2017 Prepared by: Weatherford Office Address: 1508 Santa Fe Drive, Suite 203 Weatherford, Texas 76086 (817) 594-9880 www.jacobmartin.com
DEVELOPMENT CHARGES BACKGROUND STUDY
 DEVELOPMENT CHARGES BACKGROUND STUDY Town of Innisfil C o n s u l t i n g L t d. July 19, 2018 TABLE OF CONTENTS EXECUTIVE SUMMARY... 1 I PURPOSE OF THE DEVELOPMENT CHARGES BACKGROUND STUDY... 6 A. INTRODUCTION
CAPITAL IMPROVEMENT PROGRAM K-1
 Fund # begins with a Fund Type Fund Type Description/Restrictions 1 General The City's principal operating fund, which is supported by taxes and fees and which, generally, has no restrictions on its use.
CAPITAL IMPROVEMENT PROGRAM K-1
 Fund # begins with a Fund Type Fund Type Description/Restrictions 1 General The City's principal operating fund, which is supported by taxes and fees and which, generally, has no restrictions on its use.
HEMSON C o n s u l t i n g L t d
 DEVELOPMENT CHARGES BACKGROUND STUDY Town of Gravenhurst C o n s u l t i n g L t d April, 2014 TABLE OF CONTENTS EXECUTIVE SUMMARY... 1 I INTRODUCTION... 7 II A TOWN-WIDE UNIFORM CHARGE APPROACH TO ALIGN
FINANCIAL IMPACTS ANALYSIS WITHDRAWAL FROM THE SALT LAKE VALLEY LAW ENFORCEMENT SERVICE AREA MILLCREEK, UTAH SEPTEMBER 2017
 FINANCIAL IMPACTS ANALYSIS WITHDRAWAL FROM THE SALT LAKE VALLEY LAW ENFORCEMENT SERVICE AREA MILLCREEK, UTAH SEPTEMBER 2017 TABLE OF CONTENTS SECTION I: EXECUTIVE SUMMARY... 3 FINANCIAL IMPLICATIONS...
DEVELOPMENT CHARGES BACKGROUND STUDY
 DEVELOPMENT CHARGES BACKGROUND STUDY Town of New Tecumseth C o n s u l t i n g L t d. May 29, 2013 Amended June 18, 2014 TABLE OF CONTENTS EXECUTIVE SUMMARY... 1 I INTRODUCTION... 10 II THE METHODOLOGY
City of Boise Mayor s Recommendation Summary FY 2006
 City of Boise Mayor s Recommendation Summary FY 2006 Overview The City of Boise continues to reap the benefits of a robust local economy and prudent municipal budget practices. The rigorous business planning
EXHIBIT 1. Salt Lake City
 EXHIBIT 1 Salt Lake City DRAFT Cost-Benefit and Financial Need Analysis Stadler Development March 5, 2018 COST-BENEFIT AND FINANCIAL NEED ANALYSIS STADLER DEVELOPMENT Zions Public Finance, Inc., has conducted
CAPITAL IMPROVEMENT PROGRAM K-1
 Fund # begins with a Fund Type Fund Type Description/Restrictions 1 General The City's principal operating fund that is supported by taxes and fees and which, generally, has no restrictions on its use.
C APITA L IMPRO VEMENTS S CHEDULE (FIGURE CI-14)
") August 20, 2018 Staff Report to the Municipal Planning Board G M P 2 0 1 8-1 0 0 2 0 I TEM 6 S U M M A RY Applicant City of Orlando Requested Actions 1. Amend Figure CI-14 and Policy 2.2.30 of the Capital
August 20, 2018 Staff Report to the Municipal Planning Board G M P 2 0 1 8-1 0 0 2 0 I TEM 6 S U M M A RY Applicant City of Orlando Requested Actions 1. Amend Figure CI-14 and Policy 2.2.30 of the Capital
COMMUNITY FACILITIES DISTRICT NO.
 DAVID TAUSSIG & ASSOCIATES, INC. CITY OF ANAHEIM COMMUNITY FACILITIES DISTRICT NO. 1989-1 ADMINISTRATION REPORT FISCAL YEAR 2015-16 AUGUST 10, 2015 Public Finance Urban Economics Newport Beach Riverside
This page intentionally left blank
 197 This page intentionally left blank 198 Capital Improvement Program PROCEDURE Each year the Capital Improvement Program (CIP) is prepared from project requests submitted by the various departments.
FORMER MACY S DEPARTMENT STORE 1406 N GALLERIA DR NAMPA, ID
 FORMER MACY S DEPARTMENT STORE 1406 N GALLERIA DR NAMPA, ID DAVID CADWELL 208 472 3857 david.cadwell@colliers.com MIKE CHRISTENSEN 208 472 2866 mike.christensen@colliers.com This document has been prepared
LEGEND Bridges Parks Fire Stations Project Locations Libraries Schools A
 LEGEND Bridges Parks Fire Stations Project Locations Libraries Schools A Aid to Construction Fund The Aid to Construction Fund (Water) are funds received from customers for requested water service and
Policy CIE The following are the minimum acceptable LOS standards to be utilized in planning for capital improvement needs:
 Vision Statement: Provide high quality public facilities that meet and exceed the minimum level of service standards. Goals, Objectives and Policies: Goal CIE-1. The City shall provide for facilities and
PRIME DEVELOPMENT OPPORTUNITY
 FOR SALE > PARCEL > WHOLE FOODS ANCHORED CENTER PRIME DEVELOPMENT OPPORTUNITY 350 EAST MYRTLE 83702 Development Land > Hotel, Multifamily, Student Housing, Office/Medical This 1.7 acre parcel is located
SALT LAKE CITY COUNCIL MEMORANDUM
 SALT LAKE CITY COUNCIL MEMORANDUM DATE: February 16, 2012 TO: FROM: City Council Members Jan Aramaki, Council Staff Member SUBJECT: Ordinance to approve the assessment list and levying assessments for
AGENDA OF THE COUNCIL OF THE CITY OF FORT COLLINS, COLORADO. October 19, Proclamations and Presentations 5:30 p.m.
 AGENDA OF THE COUNCIL OF THE CITY OF FORT COLLINS, COLORADO October 19, 2004 Proclamations and Presentations 5:30 p.m. A. Proclamation Proclaiming October 23, 2004 as Make a Difference Day. B. Proclamation
Georgia Funders Forum June 20, Impact Fees. Georgia s Most Ignored State Law? Bill Ross ROSS+associates
 Georgia Funders Forum June 20, 2018 Impact Fees Georgia s Most Ignored State Law? Bill Ross ROSS+associates Who Is ROSS+associates? Comprehensive Planning Long-Range Comprehensive Plans Land Use and Neighborhood
GARDEN GROVE PLANNING COMMISSION B Room, Community Meeting Center Stanford Avenue, Garden Grove, CA 92840
 CALL TO ORDER: 7:00 p.m. ROLL CALL: GARDEN GROVE PLANNING COMMISSION B Room, Community Meeting Center 11300 Stanford Avenue, Garden Grove, CA 92840 Chair O Neill Vice Chair Kanzler Commissioner Barker
FY 2017 FY 2021 Capital Improvement Program (CIP) Executive Summary
 Executive Summary") FY 2017 FY 2021 Capital Improvement Program (CIP) Executive Summary The adopted FY 2017 FY 2021 CIP is $235.8 million (including prior year expenditures) and is $28 million higher than the previous CIP
FY 2017 FY 2021 Capital Improvement Program (CIP) Executive Summary The adopted FY 2017 FY 2021 CIP is $235.8 million (including prior year expenditures) and is $28 million higher than the previous CIP
CITY OF MODESTO COMMUNITY FACILITIES DISTRICT NO (HETCH HETCHY) CFD REPORT
 CFD REPORT") CITY OF MODESTO COMMUNITY FACILITIES DISTRICT NO. 2005-1 (HETCH HETCHY) CFD REPORT September 23, 2005 Goodwin Consulting Group, Inc. 555 University Avenue, Suite 280 Sacramento, California 95825 Phone
CITY OF MODESTO COMMUNITY FACILITIES DISTRICT NO. 2005-1 (HETCH HETCHY) CFD REPORT September 23, 2005 Goodwin Consulting Group, Inc. 555 University Avenue, Suite 280 Sacramento, California 95825 Phone
Strategic Growth in the Rangeview Area Structure Plan
 2018 March 22 Page 1 of 8 EXECUTIVE SUMMARY Administration has received and reviewed an Outline Plan/Land Use (OP/LU) application within the Rangeview Area Structure Plan (ASP). The developer of these
CAPITAL IMPROVEMENT ELEMENT Inventory Analysis
 CAPITAL IMPROVEMENT ELEMENT Inventory Analysis 2.191 INTRODUCTION The principal purpose of this element is to identify the capital improvements that are needed to implement the comprehensive plan and ensure
WORKSHOP 1: LONG-RANGE FINANCIAL PLANNING
 WORKSHOP 1: LONG-RANGE FINANCIAL PLANNING Tuesday, September 19, 2017 Overview of Today s Session Timeframe Topic/Discussion 20 min What is long-range financial planning and why is it important? 10 min
917 S. LUSK STREET BOISE, ID LEW MANGLOS, MBA, CCIM, SIOR
 917 S. LUSK STREET BOISE, ID 83607 LEW MANGLOS, MBA, CCIM, SIOR 208 472 2841 lew.manglos@colliers.com 917 S LUSK ST Table of Contents Property Overview Valuation Location Layout Images Demographics Area
2019 BUDGET MESSAGE. September 18, Honorable Mayor and Town Council Members,
 2019 BUDGET MESSAGE September 18, 2018 Honorable Mayor and Town Council Members, On behalf of Town staff, I am pleased to submit the 2019 Budget to Town Council and the community. The budget includes a
INTRODUCING THE CITY OF CASA GRANDE S ANNUAL REPORT
 INTRODUCING THE CITY OF CASA GRANDE S ANNUAL REPORT Each year, the City of Casa Grande produces a Popular Annual Financial Report (PAFR) to provide a glimpse of the City s financial condition. This report
DEVELOPMENT CHARGES BACKGROUND STUDY
 DEVELOPMENT CHARGES BACKGROUND STUDY CONSOLIDATION STUDY C o n s u l t i n g L t d. April 25, 2018 TABLE OF CONTENTS Executive Summary... 1 I Introduction... 12 II III The Methodology Combines A CityWide
FY Capital Improvement Program City of New Bedford, Massachusetts
 City of New Bedford, Massachusetts Background The Massachusetts Department of Revenue, credit agencies and the Government Accounting Standards Board recommend that localities develop a capital improvement
PROPOSED 2018 BUDGET MESSAGE
 PROPOSED 2018 BUDGET MESSAGE August 15, 2017 Honorable Mayor and Town Council Members, Budgets reflect priorities. On behalf of Town staff, I am pleased to submit the Proposed 2018 Budget to Town Council
GUIDE TO THE OPERATING BUDGET
 GUIDE TO THE OPERATING BUDGET I. INTRODUCTION Why This Guide? The purpose of this guide is to explain Anchorage's operating budget process and how to read the forms contained in the budget document. Budgets
WATER USER RATES & FEE STUDY
 WATER USER RATES & FEE STUDY FINAL REPORT February 2016 BARTLE WELLS ASSOCIATES Independent Public Finance Consultants 1889 Alcatraz Avenue Berkeley, California 94703 www.bartlewells.com Tel: 510/653-3399
TABLE OF CONTENTS LIST OF TABLES
 TABLE OF CONTENTS A. GOALS, OBJECTIVES, AND POLICIES... 3 B. SUMMARY... 17 LIST OF TABLES Table IX 1: City of Winter Springs Five-Year Schedule of Capital Improvements (SCI) FY 2013/14-2017/18... 11 Table
LOAN PROGRAMS COMMERCIAL RESIDENTIAL CONSTRUCTION PROVEN TRUSTED RELIABLE
 LOAN PROGRAMS 2016 COMMERCIAL PROVEN RESIDENTIAL TRUSTED RELIABLE Perhaps most compelling is the fact that over 65% of our 2015 business involved repeat clients. When clients return 5, 10 and 20 times,
CITIZEN S POPULAR ANNUAL FINANCIAL REPORT
 Clearfield City 1 CITIZEN S POPULAR ANNUAL FINANCIAL REPORT A Summary Financial Report of the 2013 Fiscal Year (July 1, 2012 through June 30, 2013) 2 Clearfield City Purpose Statement The intent of the
REDEVELOPMENT AGENCY STAFF MEMO. Stadler Rail Community Reinvestment Area Plan, and Interlocal Agreement for the Distribution of Tax Increment
 JACKIE BISKUPSKI MAYOR EXECUTIVE DIRECTOR, RDA LARA FRITTS DIRECTOR CHIEF EXECUTIVE OFFICER, RDA DATE: April 10, 2018 DEPARTMENT of ECONOMIC DEVELOPMENT REDEVELOPMENT AGENCY STAFF MEMO PREPARED BY: RE:
Capital Improvements
 Capital Improvements CAPITAL IMPROVEMENT ELEMENT GOAL 7-1: PROVIDE & MAINTAIN PUBLIC FACILITIES AND SERVICES Provide and maintain public facilities and services which protect and promote the public health,
CAPITAL IMPROVEMENTS ELEMENT
 [COMPREHENSIVE PLAN] 2025 INTRODUCTION EXHIBIT F CAPITAL IMPROVEMENTS ELEMENT A primary purpose of the Capital Improvements Element (CIE) is to assess and demonstrate the financial feasibility of the Clay
IMPLEMENTATION A. INTRODUCTION C H A P T E R
 C H A P T E R 11 IMPLEMENTATION A. INTRODUCTION This chapter addresses implementation of the General Plan. The Plan s seven elements include 206 individual actions. 1 Many are already underway or are on-going.
Fiscal Analysis of the City of Palo Alto 2030 Comprehensive Plan
 Draft Report Fiscal Analysis of the City of Palo Alto 2030 Comprehensive Plan Prepared for: City of Palo Alto Prepared by: Economic & Planning Systems, Inc. February 17, 2017 EPS #151010 Table of Contents
The media often uses words
 Best Practices Building and Maintaining Solid Infrastructure in the Town of Gilbert By Shayne Kavanagh Preserving the investment the community has made in its capital assets is a concern for all local
DEVELOPMENT CHARGES BACKGROUND STUDY. City of Woodstock. HEMSON C o n s u l t i n g L t d
 DEVELOPMENT CHARGES BACKGROUND STUDY City of Woodstock C o n s u l t i n g L t d April 6, 2018 TABLE OF CONTENTS Executive Summary... 1 I Introduction... 10 II A CityWide Methodology Aligns DevelopmentRelated
Capital Improvement Program Fund
 Capital Improvement Program Fund The Capital Improvement Program Fund provides funding for streets, public buildings (both governmental and school facilities), land, and other capital assets. Capital Improvement
TOWN OF LILLINGTON FISCAL YEAR (FY) BUDGET MESSAGE
 BUDGET MESSAGE") TOWN OF LILLINGTON June 13, 2017 Mayor Glenn McFadden Mayor Pro Tempore Judy Breeden Commissioner Rupert Langdon Commissioner Dianne Johnson Commissioner Marshall Page Commissioner Paul Phillips FISCAL
TOWN OF LILLINGTON June 13, 2017 Mayor Glenn McFadden Mayor Pro Tempore Judy Breeden Commissioner Rupert Langdon Commissioner Dianne Johnson Commissioner Marshall Page Commissioner Paul Phillips FISCAL
Toronto and Region Conservation Authority - Additional Information for the Long Term Accommodation Project
 REPORT FOR ACTION Toronto and Region Conservation Authority - Additional Information for the Long Term Accommodation Project Date: February 14, 2017 To: City Council From: Deputy City Manager & Chief Financial
LOS ANGELES COUNTY METROPOLITAN TRANSPORTATION AUTHORITY TRANSPORTATION DEVELOPMENT ACT ARTICLE 3 BICYCLE AND PEDESTRIAN FUNDS
 LOS ANGELES COUNTY METROPOLITAN TRANSPORTATION AUTHORITY TRANSPORTATION DEVELOPMENT ACT ARTICLE 3 BICYCLE AND PEDESTRIAN FUNDS FISCAL YEAR 2018-2019 FUNDING AND ALLOCATION GUIDELINES CLAIMING TDA ARTICLE
To the Residents of Cotati
 City of Cotati To the Residents of Cotati The City is proud to present you with Cotati s first Annual Financial Report to the Community for the fiscal year (FY) ended June 30, 2018. This report provides
Getting Growth to Pay for Growth. Growth is (still) coming...
 coming...") Getting Growth to Pay for Growth Growth is (still) coming... Getting Growth to Pay for Growth Washington APA Conference Spokane, WA October 17, 2014 Context and use Definition and types How to calculate
Getting Growth to Pay for Growth Growth is (still) coming... Getting Growth to Pay for Growth Washington APA Conference Spokane, WA October 17, 2014 Context and use Definition and types How to calculate
Memorandum. Background memorandum for Independence/Constitution Project fiscal impact analysis
 Memorandum To: From: Re: Thomas H. Rogers, City of Menlo Park Ron Golem, Steve Murphy, BAE Background memorandum for Independence/Constitution Project fiscal impact analysis Date: June 16, 2008 Purpose
APPENDIX - TRANSPORTATION IMPACT TAX. Basis and General Purpose for the Tax
 APPENDIX - TRANSPORTATION IMPACT TAX Basis and General Purpose for the Tax The authority to impose a Transportation Impact Tax on new development is in Chapter 52 (Article VII Development Impact Tax for
Balanced Financial Plan Projected Changes and Assumptions
 Appendix I Resolution Adopting the Three Year Plan Town of Castle Rock Projected Changes and Assumptions Unless otherwise noted, following is a general list of Townwide growth rates used in future years:
City of Ocean City Permit and Application Process Quality Improvement
 Introduction. This report embodies a thorough evaluation of Ocean City s land use approval and development permitting procedures. Specific reference is made to application requirements and administrative
Legislative Intent for 2018
 Legislative Intent for 2018 1. Remote Seating Upgrade for the Regent Street Black Box Theater It is the intent of the Council to ask Salt Lake City s RDA to place its highest priority on using remaining
Temescal Valley Water District
 Temescal Valley Water District Comprehensive Water, Recycled Water, and Wastewater Cost of Service Study Draft Report / December 7, 2016 24640 Jefferson Avenue Suite 207 Murrieta, CA 92562 Phone 951.698.0145
Infrastructure and Capital Projects Planning and Funding
 Infrastructure and Capital Projects Planning and Funding September 6, 2018 Preview of FY 2020 2024 CIP process Why are we here? Overview Current Assets Overview and Highlights of Adopted FY 2019 2023 CIP
CARSON CITY CONSOLIDATED MUNICIPALITY NOTICE OF MEETING OF THE BOARD OF SUPERVISORS AGENDA
 CARSON CITY CONSOLIDATED MUNICIPALITY NOTICE OF MEETING OF THE BOARD OF SUPERVISORS Day: Thursday Date: July 5, 2018 Time: Beginning at 8:30 am Location: Community Center, Sierra Room 851 East William
Fiscal Impact Analysis
 May 12, 2017 Fiscal Impact Analysis Westport Cupertino Development Prepared for: KT Urban, LLC Prepared by: Applied Development Economics, Inc. 1756 Lacassie Avenue, #100, Walnut Creek, CA 94596 925.934.8712
COMMUNITY FACILITIES DISTRICT NO.
 DAVID TAUSSIG & ASSOCIATES, INC. CITY OF ANAHEIM COMMUNITY FACILITIES DISTRICT NO. 1989-2 ADMINISTRATION REPORT FISCAL YEAR 2015-16 AUGUST 10, 2015 Public Finance Urban Economics Newport Beach Riverside
General Fund Revenues
 Budget Overview General Fund Revenues $16.9 $4.0 $15.9 $54.5 Property Taxes Franchise & TLT State Rev Sharing Other Sources Total Revenues - $91.3 million Property Taxes 60% of total revenue Franchise
City of Moorhead, Minnesota. Comprehensive Annual Financial Report. For The Year Ended December 31,
 City of Moorhead, Minnesota Comprehensive Annual Financial Report For The Year Ended December 31, 2009 www.cityofmoorhead.com This page intentionally left blank COMPREHENSIVE ANNUAL FINANCIAL REPORT OF
Wednesday, April 11, 2018
 1 PLANNING COMMISSION MINUTES OF MEETING 2 Wednesday, April 11, 2018 : 00 p. m. 5 A quorum being present at Centerville City Hall, 250 North Main Street, Centerville, 6 Utah. The meeting of the Centerville
Steering Committee Meeting #6. Development Charge & Impost Fee Background Study. Summary Notes
 Steering Committee Meeting #6 Development Charge & Impost Fee Background Study Summary Notes Steering Committee Meeting #6 was held on May 21 st, 2014 in the Loyalist Room, City Hall. The following briefly
DRAFT ENVISION SAN JOSÉ 2040 GENERAL PLAN UPDATE ANALYSIS OF SAN JOSÉ S FISCAL CONDITIONS AND PROJECTIONS OF FUTURE SCENARIOS
 DRAFT ENVISION SAN JOSÉ 2040 GENERAL PLAN UPDATE ANALYSIS OF SAN JOSÉ S FISCAL CONDITIONS AND PROJECTIONS OF FUTURE SCENARIOS FEBRUARY 12, 2010 Prepared for The City of San José Prepared by Applied Development
 2018 Water Connection Fee Update August 17, 2018 Page 4 environmental effect. Further, the incremental fee increase will not to fund capital projects for the expansion of the existing infrastructure system.
APPROVED OPERATING BUDGET FOR FISCAL YEAR 2015 AND FIVE-YEAR CAPITAL IMPROVEMENT PLAN FOR FISCAL YEAR
 APPROVED OPERATING BUDGET FOR FISCAL YEAR 2015 AND FIVE-YEAR CAPITAL IMPROVEMENT PLAN FOR FISCAL YEAR 2015-2019 CITY COMMISSION John R. Marks, III MAYOR Gil Ziffer MAYOR PRO-TEM Andrew D. Gillum COMMISSIONER
Section 13: Implementation
 Section 13: Implementation For the McKinney Comprehensive Plan to have a positive impact on the city, the document must be put into action and used on a daily basis. Through implementation of the Plan,
FROM: CITY MANAGER DEPARTMENT: PUBLIC WORKS DATE: SEPTEMBER 19, 2001 CMR:354:01
 TO: HONORABLE CITY COUNCIL FROM: CITY MANAGER DEPARTMENT: PUBLIC WORKS DATE: SEPTEMBER 19, 2001 CMR:354:01 SUBJECT: REQUEST APPROVAL OF A BUDGET AMENDMENT ORDINANCE FOR FISCAL YEAR 2001-02 IN THE AMOUNT
Georgetown Planning Department Plan Annual Update: Background
 2030 Plan Annual Update: 2014 Background The 2030 Comprehensive Plan was unanimously adopted by City Council on February 26, 2008. The Plan was an update from Georgetown s 1988 Century Plan. One of the
Stormwater System Development Charges
 Methodology Report Stormwater System Development Charges Prepared For City of Springfield April 20, 2009 GALARDI CONSULTING, LLC PAGE 1 OF 9 SECTION 1 Introduction Oregon legislation establishes guidelines
ENGINEER S REPORT COUNTY SERVICE AREA NO. 10 BENEFIT ZONE NO. 3 COUNTY OF SACRAMENTO THIRD ADMINISTRATIVE DRAFT NOVEMBER 21, 2005.
 ENGINEER S REPORT COUNTY SERVICE AREA NO. 10 BENEFIT ZONE NO. 3 COUNTY OF SACRAMENTO THIRD ADMINISTRATIVE DRAFT NOVEMBER 21, 2005 Oakland Office 1700 Broadway Temecula, CA Phoenix, AZ 6 th Floor Sacramento,
September 2014 Monthly Financial Report PREPARED BY
 September 2014 Monthly Financial Report PREPARED BY Financial Accounting & Reporting Division City of Phoenix Monthly Financial Report September 2014 Table of Contents by Programs Page Performance Status
SUMMARY OF SERVICES BY STRATEGIC PRIORITY
 Public Safety City Attorney's Office Municipal Prosecution $2,287,153 $2,343,199 $2,287,153 $2,343,199 Police Legal Liaison $768,508 $785,703 $768,508 $785,703 Court and Detention Services Adjudication