UBS 36 th Annual Global Media and Communications Conference. Jon Rubin Senior VP of Financial Planning and Investor Relations
|
|
|
- Bridget Gwendoline Fletcher
- 5 years ago
- Views:
Transcription

1 UBS 36 th Annual Global Media and Communications Conference Jon Rubin Senior VP of Financial Planning and Investor Relations December 8, 2008
2 Cautionary Statement This presentation includes certain statements that may be considered to be, forward-looking statements within the meaning of the Private Securities Litigation Reform Act of 1995 ( PSLRA ). These forwardlooking statements generally can be identified by words such as believe, expect, estimate, anticipate, intend, plan, foresee, project or other similar words or phrases. Similarly, statements that describe our objectives, plans or goals also are forward-looking statements. All of these forwardlooking statements are subject to certain risks and uncertainties that could cause actual results to differ materially from historical results or from those expressed or implied by the relevant forward-looking statement. Such risks and uncertainties include, but are not limited to: economic conditions; product demand and market acceptance; ability to improve customer service or create new and desirable programming content and interactive features; government action; political, economic and social uncertainties in many Latin American countries in which DTVLA operates; foreign currency exchange rates; competition; the outcome of legal proceedings; ability to achieve cost reductions; ability to renew programming contracts under favorable terms; technological risk; limitations on access to distribution channels reliance on satellites as a significant part of our infrastructure and we may face other risks described from time to time in periodic reports filed by us with the SEC. Non-GAAP Financials This presentation includes financial measures that are not determined in accordance with GAAP, such as Operating Profit before Depreciation and Amortization, Free Cash Flow and Cash Flow before Interest and Taxes. These financial measures should be used in conjunction with other GAAP financial measures and are not presented as an alternative measure of operating results, as determined in accordance with GAAP. DIRECTV management uses these measures to evaluate the profitability of DIRECTV U.S. subscriber base for the purpose of allocating resources to discretionary activities such as adding new subscribers, upgrading and retaining existing subscribers and for capital expenditures. A reconciliation of these measures to the nearest GAAP measure is posted on our website and is included at the end of this presentation package. 2
3 DIRECTV s Goal To offer the best TV experience through leadership in: Content Technology Service HD, Exclusive, Sports, Original, Interactivity User Interface, DVR/ Advanced Equipment, Internet, Whole Home Call Centers, Installer Network, Self Care 3
4 Increasing Market Share YTD 9/30/08 Subscribers (K) Net Adds % Net Adds % Net Adds % DIRECTV U.S % % % Dish Network 1,065 47% % 0 0% Cable 163 7% (520) (26)% (540) (43)% Verizon FiOS 205 9% % % AT&T U-Verse 3 0% % % Total Pay TV Market 2, % 2, % 1, % 4
5 And Increasing Subscriber Returns YTD Thru 9/30/08 ARPU $66.95 $69.61 $73.74 $79.05 $81.73 Churn 1.59% 1.70% 1.60% 1.51% 1.50% Variable Margin 39% 41% 40% 37% 42% SAC After-Tax IRRs 23% 25% 29% 27% 33% 5
6 Subscriber Growth Drivers Superior Programming/Services Most comprehensive SD, HD and DVR services Most sports/interactivity Stronger Sales and Marketing Advertising / National Offers Direct Sales Commercial Business Building the Brand The 101 Friday Night Lights, original shows and concerts New Services DVR Scheduler, DIRECTV2PC, 1080P Video-on-Demand 6
7 HD Channel Comparison 130* 102 Local Premiums National HD 75* DIRECTV Verizon DISH AT&T Time Warner Los Angeles Los Angeles Denver Florida Los Angeles Comcast Philadelphia Based on October survey of websites *Excludes Games-only Regional Sports Networks and VOD 7
8 Rapid Growth in HD/DVR Subscribers Penetration of Total Subscribers 41% 30% 6.6M 21% 4.6M 3.0M ~50% Net HD/DVR Subscriber Adds Comcast DIRECTV Q K 600K Q K 550K Q K 400K Q K 450K LTM 1,400K 2,000K Penetration of Sub Base ~30% ~50% E Cumulative HD/DVR Subscribers 8
9 Attracting More Valuable Subscribers DIRECTV U.S. Subscriber Returns 2007 YTD Thru 9/30/08 Basic Sub Advanced Sub Basic Sub Advanced Sub Monthly Churn 1.9% 0.8% 1.9% 1.1% ARPU $62 $100 $62 $106 Variable Margin 33% 44% 34% 47% SAC* $575 $760 $600 $750 IRR 20% 59% 18% 66% * Includes credit for upfront fees 9
10 A Large Opportunity ~40M U.S. Households are Expected to Sign-up for HD Service Over the Next 3 Years TV HHs with HDTVs 54M 39M 34M 23M 65M 46M 83M 76M 72M 59M TV HHs with HD Service Source: Average of Analysts/Research Groups 10


11 Interactive Services NFL Sunday Ticket The Masters Golf Tournament The Weather Channel News Mix 11


12 Advertising / National Offers 40% of customers Index Drive 60% of Profits Demographics Men 35+ Married Homeowner Income >$70K College+ 12


13 Direct Sales Growth Direct Sales as a % of Total Gross Adds 43% ~49% 34% 1.6M 1.3M E Targeted DIRECTV.COM DIRECTV 13
14 Commercial Business Growth Commercial Accounts Gross Additions (Equivalent Units) ~190K DIRECTV Market Share Target Market = 6M+ Locations 130K 140K 4% E Hotels Business/Private Bars/Restaurants 14


15 The 101 Concert Blizzcon 15


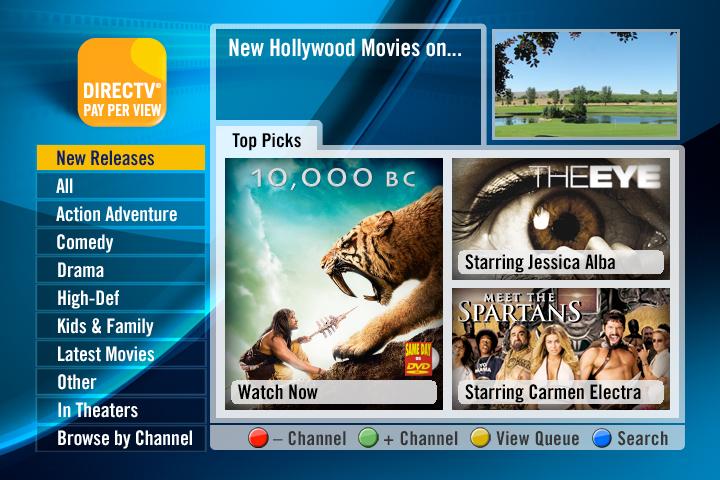
16 DIRECTV on Demand 16


17 Enhanced Services NFL Supercast DIRECTV2PC DVR Scheduler 17
18 Strong Financial Results DIRECTV U.S. $M except Margin YTD Thru 9/30/07 YTD Thru 9/30/08 Change Revenue 11,150 12,569 13% Operating Profit Before D&A (OPBDA) 2,847 3,335 17% OPBDA Margin 25.5% 26.5% 100 Bps Capital Expenditures 1,784 1,240 (30)% Cash Flow Before Interest & Taxes 974 1,819 87% 18
19 Strong Gross Additions Key Trends (000) s Change Favorable Q1 Q2 Q , ,002 4% (1)% (3)% AT&T partnership Stronger brand Commercial / MDU / International growth Q4 986 Up over last year Unfavorable Weaker economy Full Year 3,847 Up over last year FiOS / U-Verse expansion Less upfront offer discounting 19
20 Managing Churn Key Trends Q1 Q Change Favorable 1.44% 1.36% (8) bps Higher HD/DVR penetration AT&T partnership 1.58% 1.49% (9) bps Further credit tightening Q3 Q4 1.61% 1.42% 1.64% 3 bps Up slightly from last year Unfavorable FiOS/U-Verse expansion Weaker economy Full Year 1.51% Down slightly from last year More disciplined upgrade/ retention offers 20
21 ARPU Growth Key Trends Q1 Q2 Q3 Q4 Full Year Change Favorable Price increases 5.2% 8.6% 340 bps HD/DVR monthly fees 6.8% 8.3% 8.3% 7.2% 7.0% 6.1% ~4% 6-6.5% 20 bps (220) bps Unfavorable National offers/discounts Lease fees per home Free/lower equipment fees Law of large numbers 21
22 Subscriber Acquisition Costs Key Trends $/Subscriber YTD Thru 9/30/07 9/30/08 Change Favorable Lower box costs Hardware (8)% More refurbished boxes Commissions/ Direct Marketing % Owned & Operated installers Unfavorable Installation National Advertising % 7% Richer mix of HD-DVRs New products/services Broadband connection Whole Home solution Total SAC % Note: Includes expensed and capitalized costs 22
23 Upgrade and Retention Key Trends $M YTD Thru 9/30/07 9/30/08 Change Favorable Decline in box costs Upgrades (29)% Lower pent-up demand Retention % More refurbished boxes Swaps (23)% Unfavorable Slower economy/greater competition Total Upgrade & Retention 1,270 1,097 (14)% Richer mix of HD-DVRs Loyalty program Note: Includes expensed and capitalized costs 23
24 Increasing Margins % of Revenues YTD Thru 9/30/07 9/30/08 Change Key Trends Programming/ Other COS Subscriber Services G&A/Broadcast Operations 41.7% 7.6% 6.6% 41.5% 6.7% 6.8% (0.2)% (0.9)% 0.2% Greater cost controls & operating efficiencies Subscriber Services G&A Upgrade & Retention Expenses Subscriber Acquisition Costs Subtotal 6.2% 12.4% 74.5% 5.8% 12.7% 73.5% (0.4)% 0.3% (1.0)% Stabilize key costs Programming SAC Upgrade & Retention Operating Profit Before D&A Margin 25.5% 26.5% 1.0% 24
25 Declining Capital Expenditures Key Trends $M YTD Thru 9/30/07 9/30/08 Change Favorable Lower box costs Set-Top Boxes 1, (31)% More refurbished boxes Basic/Other (28)% Completion of satellite expansion plan Satellites (38)% Unfavorable Richer mix of HD-DVRs Total CapEx 1,784 1,240 (30)% New projects/new local market launches Owned and Operated installers 25


26 DIRECTV Latin America Overview ~5.5M Subscribers in the Region Sky Mexico 1.73M Subscribers 59% Televisa 41% DIRECTV Sky Brazil 1.61M Subscribers 74% DIRECTV 26% Globo PanAmericana 2.09M Subscribers 100% DIRECTV 26
27 DIRECTV Latin America Rapid Subscriber Growth Subscriber Metrics YTD Thru 9/30/07 YTD Thru 9/30/08 Change Gross Subscriber Additions 753K 1,052K 40% Monthly Churn Rate 1.40% 1.85% 45 bps Excluding Brazil Adjustments 1.40% 1.59% 19 bps Net Subscriber Additions 390K 463K 19% ARPU $46.98 $ % Subscriber Acquisition Cost (SAC) $347 $400 15% 27
28 DIRECTV Latin America Strong Financial Results $M YTD Thru 9/30/07 YTD Thru 9/30/08 Change Revenue 1,220 1,811 48% Operating Profit Before D&A % OPBDA Margin 23.0% 28.0% 500 bps Capital Expenditures % Cash Flow Before Interest & Taxes % Free Cash Flow % 28
29 DIRECTV Latin America Strategy Drive Strong Subscriber Growth Offer the best content, technology and service throughout the region Establish HD leadership position Already launched: Argentina, Colombia, Venezuela, Chile and Puerto Rico Brazil launch: 2Q 2009 Aggressively market superior set-top boxes and DVR service Expand pre-paid service Leverage DIRECTV U.S. Capabilities Speed-to-market Advanced set-top boxes at a lower cost Access to exclusive programming Mitigate Currency Exposure ~80% of costs in local currency 29
30 The DIRECTV Group (Consolidated) Generating Substantial Cash Flow $M except EPS and OPBDA Margin YTD Thru 9/30/07 YTD Thru 9/30/08 Change Revenue 12,370 14,379 16% Operating Profit Before D&A (OPBDA) 3,067 3,791 24% OPBDA Margin 24.8% 26.4% 160 bps EPS $0.91 $ % Capital Expenditures 2,052 1,572 (23)% Cash Flow Before Interest & Taxes 968 1, % Free Cash Flow 592 1, % 30
31 The DIRECTV Group (Consolidated) Strong Balance Sheet Net Debt Share Repurchases $M 12/07 9/ YTD Thru 9/30/08 Cash 1,083 2,988 Shares (M) Short Term Debt Long Term Debt Total Debt 48 3,347 3, ,755 5,850 Cum Shares (M) Total Cost ($M) 184 2, , ,838 Net Debt 2,312 2,862 Cum Cost ($M) 2,977 5,002 6,840 31
32
33 Non-GAAP Financial Reconciliations Non-GAAP Financial Measure Reconciliation Schedules DIRECTV HOLDINGS LLC (DIRECTV U.S.) Non-GAAP Financial Measure Reconciliation (Unaudited) Reconciliation of Cash Flow Before Interest and Taxes 2 and Free Cash Flow 3 to Net Cash Provided by Operating Activities Nine Months Ended S eptember 30, (Dollars in Millions) Cash Flow Before Interest and Taxes $1,819 $974 Adjustments: Cash paid for interest (175) (162) Interest income Income taxes paid (585) (624) Subtotal - Free Cash Flow 1, Add Cash Paid For: Property and equipment Subscriber leased equipment - subscriber acquisitions Subscriber leased equipment - upgrade and retention Satellites Net Cash Provided by Operating Activities $2,330 $2,032 (Unaudited) The DIRECTV Group Reconciliation of Operating Profit Before Depreciation and Amortization to Operating Profit* Nine Months Ended S eptember 30, (Dollars in Millions) Operating Profit Before Depreciation and Amortization $3,791 $3,067 Subtract: Depreciation and amortization expense 1,675 1,198 Operating Profit $2,116 $1,869 *For a reconciliation of this non-gaap financial measure for each of our segments, please see the Notes to the Consolidated Financial Statements which will be included in The DIRECTV Group s Quarterly Report on Form 10-Q for the quarter ended Sept 30, 2008, filed with the SEC in November Cash flow before interest and taxes, w hich is a financial measure that is not determined in accordance w ith GAAP, is calculated by deducting amounts under the captions Cash paid for property and equipment, Cash paid for satellites, Cash paid for subscriber leased equipment subscriber acquisitions and Cash paid for subscriber leased equipment upgrade and retention from Net cash provided by operating activities from the Consolidated Statements of Cash Flow s and adding back net interest paid and Cash paid for income taxes. This financial measure should be used in conjunction w ith other GAAP financial measures and is not presented as an alternative measure of cash flow s from operating activities, as determined in accordance w ith GAAP. The DIRECTV Group and DIRECTV U.S. management use cash flow before interest and taxes to evaluate the cash generated by our current subscriber base, net of capital expenditures, and excluding the impact of interest and taxes, for the purpose of allocating resources to activities such as adding new subscribers, retaining and upgrading existing subscribers, for additional capital expenditures and as a measure of performance for incenti The DIRECTV Group and DIRECTV U.S. believe this measure is useful to investors, along with other GAAP measures (such as cash flows from operating and investing activities), to compare our operating performance to other communications, entertainment and media companies. We believe that investors also use current and projected cash flow before interest and taxes to determine the ability of our current and projected subscriber base to fund required and discretionary spending and to help determine the financial value of the company. Free cash flow, w hich is a financial measure that is not determined in accordance w ith GAAP, is calculated by deducting amounts under the captions Cash paid for property and equipment, Cash paid for satellites, Cash paid for subscriber leased equipment subscriber acquisitions, and Cash paid for subscriber leased equipment upgrade and retention from Net cash provided by operating activities from the Consolidated Statements of Cash Flow s. This financial measure should be used in conjunction w ith other GAAP financial measures and is not presented as an alternative measure of cash flow s from operating activities, as determined in accordance w ith GAAP. The DIRECTV Group and DIRECTV U.S. management use free cash flow to evaluate the cash generated by our current subscriber base, net of capital expenditures, for the purpose of allocating resources to activities such as adding new subscribers, retaining and upgrading existing subscribers, for additional capital expenditures and as a measure of performance for incentive compensation purposes. The DIRECTV Group and DIRECTV U.S. believe this measure is useful to investors, along with other GAAP measures (such as c our operating performance to other communications, entertainment and media companies. We believe that investors also use current and projected free cash flow to determine the ability of our current and projected subscriber base to fund required and discretionary spending and to help determine the financial value of the company. The DIRECTV Group Reconciliation of Cash Flow Before Interest and Taxes and Free Cash Flow to Net Cash Provided by Operating Activities Nine Months Ended S eptember 30, (Dollars in Millions) Cash Flow Before Interest and Taxes $1,954 $968 Adjustments: Cash paid for interest (201) (176) Interest income Income taxes paid (568) (296) Subtotal - Free Cash Flow 1, Add Cash Paid For: Property and equipment 1,480 1,903 Satellites Net Cash Provided by Operating Activities $2,821 $2,644 DIRECTV Latin America Reconciliation of Cash Flow Before Interest and Taxes and Free Cash Flow to Net Cash Provided by Operating Activities Nine Months Ended S eptember 30, (Dollars in Millions) Cash Flow Before Interest and Taxes $218 $105 Adjustments: Cash paid for interest (29) (21) Interest income Income taxes paid (94) (24) Subtotal - Free Cash Flow Add Cash Paid For: Property and equipment Net Cash Provided by Operating Activities $435 $311 33
Chase Carey. President & CEO The DIRECTV Group
 Chase Carey President & CEO The DIRECTV Group The DIRECTV Group Cautionary Statement This presentation includes certain statements that may be considered to be, forward-looking statements within the meaning
DIRECTV Latin America 2008 Media Fall Preview
 DIRECTV Latin America 2008 Media Fall Preview Bruce Churchill President DIRECTV Latin America Cautionary Statement and Non-GAAP Financials Cautionary Statement: This presentation includes certain statements
4 th Quarter & Year End 2007 Results February 14, 2008
 4 th Quarter & Year End 2007 Results February 14, 2008 1 Safe Harbor Caution Concerning Forward-Looking Statements This presentation contains forward-looking statements within the meaning of the Private
INVESTOR SUMMARY. 3Q13 - November 12, 2013
 QUARTERLY INVESTOR SUMMARY 3Q13 - November 12, 2013 DISH NETWORK REPORTS THIRD QUARTER 2013 FINANCIAL RESULTS ENGLEWOOD, Colo., Nov. 12, 2013 DISH Network Corporation (NASDAQ: DISH) today reported revenue
AT&T INC. FINANCIAL REVIEW 2017
 AT&T INC. FINANCIAL REVIEW 2017 Selected Financial and Operating Data 14 Management s Discussion and Analysis of Financial Condition and Results of Operations 15 Consolidated Financial Statements 49 Notes
QUARTERLY INVESTOR SUMMARY
 QUARTERLY INVESTOR SUMMARY November 9, 2015 DISH NETWORK REPORTS THIRD QUARTER 2015 FINANCIAL RESULTS ENGLEWOOD, Colo., November 9, 2015 DISH Network Corporation (NASDAQ: DISH) today reported revenue totaling
Financial and Operational Trends
 Q4 2017 AT&T EARNINGS Financial and Operational Trends Income Statements, Cash Flows, Segment Results, Revenue Details and Operating Volumes JANUARY 31, 2018 Consolidated Statements of Income AT&T Inc.
UNITED STATES SECURITIES AND EXCHANGE COMMISSION WASHINGTON, DC FORM 8-K
 UNITED STATES SECURITIES AND EXCHANGE COMMISSION WASHINGTON, DC 20549 FORM 8-K CURRENT REPORT Pursuant to Section 13 or 15(d) of the Securities Exchange Act of 1934 Date of report (Date of earliest event
2 nd Quarter 2007 Results July 26, 2007
 2 nd Quarter 2007 Results July 26, 2007 1 Safe Harbor Caution Concerning Forward-Looking Statements This presentation contains forward-looking statements within the meaning of the Private Securities Litigation
Charter Communications Second Quarter 2008 Earnings Call August 5, 2008
 Charter Communications Second Quarter 2008 Earnings Call August 5, 2008 1 Cautionary Statement Regarding Forward Looking Statements CAUTIONARY STATEMENT REGARDING FORWARD-LOOKING STATEMENTS: This presentation
Investor Update. Third Quarter 2016 NOVEMBER 1, 2016
 184934579 Investor Update Third Quarter 2016 NOVEMBER 1, 2016 Earnings Call Agenda Strategic and Operational Review Financial Results Daniel McCarthy PRESIDENT & CHIEF EXECUTIVE OFFICER Perley McBride
Comcast Reports Third Quarter 2006 Results
 Comcast Reports Third Quarter 2006 Results Triple Play powers highest level of quarterly RGU additions in Comcast history Record additions fuel 15% growth in cable Operating Cash Flow and 12% growth in
Trend Sheet for GAAP Statement of Operations (unaudited, in thousands, except per share data)
") Trend Sheet for GAAP Statement of Operations (unaudited, in thousands, except per share data) April 30, July 31, Apr 30, Income Statement Net revenues $ 60,380 $76,850 $66,003 $59,314 $56,753 $60,768 $49,529
Trend Sheet for GAAP Statement of Operations (unaudited, in thousands, except per share data) April 30, July 31, Apr 30, Income Statement Net revenues $ 60,380 $76,850 $66,003 $59,314 $56,753 $60,768 $49,529
INVESTOR SUMMARY. 2Q13 August 6, 2013
 QUARTERLY INVESTOR SUMMARY 2Q13 August 6, 2013 DISH NETWORK REPORTS SECOND QUARTER 2013 FINANCIAL RESULTS YOY subscriber-related revenue improves 5 percent Net loss driven by $438 million of impairment
QUARTERLY INVESTOR SUMMARY
 QUARTERLY INVESTOR SUMMARY August 5, 2015 DISH NETWORK REPORTS SECOND QUARTER 2015 FINANCIAL RESULTS ENGLEWOOD, Colo., August 5, 2015 DISH Network Corp. (NASDAQ: DISH) today reported revenue totaling $3.83
DIRECTV ANNUAL REPORT L E A D I N G THE WAY
 DIRECTV ANNUAL REPORT 2008 L E A D I N G THE WAY LEADING THE WAY ON YOUR SCREEN... DIRECTV CONCERT SERIES DIRECTV ON DEMAND DVR SCHEDULER MASTERS MIX FRIDAY NIGHT LIGHTS ...TO YOUR FUTURE SCOREGUIDE Streaming
UNITED STATES SECURITIES AND EXCHANGE COMMISSION WASHINGTON, DC FORM 8-K
 UNITED STATES SECURITIES AND EXCHANGE COMMISSION WASHINGTON, DC 20549 FORM 8-K CURRENT REPORT Pursuant to Section 13 or 15(d) of the Securities Exchange Act of 1934 Date of report (Date of earliest event
Trend Sheet for GAAP Statement of Operations (unaudited, in thousands, except per share data)
") Trend Sheet for GAAP Statement of Operations (unaudited, in thousands, except per share data) Apr 30, Income Statement Net revenues $ 62,659 $ 60,380 $ 76,850 $66,003 $59,315 $ 56,753 $ 60,768 $49,529
Trend Sheet for GAAP Statement of Operations (unaudited, in thousands, except per share data) Apr 30, Income Statement Net revenues $ 62,659 $ 60,380 $ 76,850 $66,003 $59,315 $ 56,753 $ 60,768 $49,529
UNITED STATES SECURITIES AND EXCHANGE COMMISSION WASHINGTON, DC FORM 8-K
 UNITED STATES SECURITIES AND EXCHANGE COMMISSION WASHINGTON, DC 20549 FORM 8-K CURRENT REPORT Pursuant to Section 13 or 15(d) of the Securities Exchange Act of 1934 Date of report (Date of earliest event
TABLE 1 Condensed Consolidated Statement of Operations (Unaudited)
") TABLE 1 Condensed Consolidated Statement of Operations (dollars in millions, except per share data) Revenues Operating expenses Selling, general and administrative expenses Operating cash flow Depreciation
TABLE 1 Condensed Consolidated Statement of Operations (dollars in millions, except per share data) Revenues Operating expenses Selling, general and administrative expenses Operating cash flow Depreciation
2 nd Quarter 2009 Results. August 6, 2009
 2 nd Quarter 2009 Results August 6, 2009 Safe Harbor Caution Concerning Forward-Looking Statements This presentation contains forward-looking statements within the meaning of the Private Securities Litigation
WOW! REPORTS SECOND QUARTER 2018 RESULTS
 Contact: Lucas Binder VP Corporate Development & Investor Relations 303-927-4951 lucas.binder@wowinc.com WOW! REPORTS SECOND QUARTER 2018 RESULTS ENGLEWOOD, Colo. () WideOpenWest, Inc. ( WOW! or the Company
Page 2. Historical Accounting. Method 2
 Consolidated Statements of Income 3 AT&T Inc. except per share amounts Unaudited 3/31/17 6/30/17 9/30/17 12/31/17 2017 3/31/18 6/30/18 9/30/18 12/31/18 2018 3/31/18 6/30/18 9/30/18 12/31/18 2018 Operating
2 nd Quarter 2018 Earnings Results. July 24, 2018
 2 nd Quarter 2018 Earnings Results July 24, 2018 Safe Harbor statement NOTE: In this presentation we have made forward-looking statements. These statements are based on our estimates and assumptions and
TABLE 1 Condensed Consolidated Statement of Operations (Unaudited)
") TABLE 1 Condensed Consolidated Statement of Operations (dollars in millions, except per share data) Revenues Operating expenses Selling, general and administrative expenses Operating cash flow Depreciation
TABLE 1 Condensed Consolidated Statement of Operations (dollars in millions, except per share data) Revenues Operating expenses Selling, general and administrative expenses Operating cash flow Depreciation
2015 Investor Day. November 12, 2015
 2015 Investor Day November 12, 2015 Forward-Looking Statements This presentation includes certain forward-looking statements within the meaning of the Private Securities Litigation Reform Act of 1995,
Investor. Update. Fourth Quarter 2017 FEBRUARY 27, 2018
 184934579 Investor Update Fourth Quarter 2017 FEBRUARY 27, 2018 Strategic and Operational Review Daniel McCarthy PRESIDENT & CHIEF EXECUTIVE OFFICER 2 Business Update Total revenues of $2.22 billion Consumer
Industry: CABLE TV August 7, 2013 Recommendation: BUY. Company Overview
 Price Target $74.09 Price (08/07/2013) $61.11 52-WK ($) 47.71-67.85 Market Cap ($M) $34,000 Outstanding Shares 556 Insider % 7.0 Revenue $30,750 Valuation TEV ($M) $50,590 EBITDA ($M) $7,480 EV/EBITDA
Investor. Update. First Quarter 2017 MAY 2, 2017
 184934579 Investor Update First Quarter 2017 MAY 2, 2017 Earnings Call Agenda Strategic and Operational Review Financial Results Daniel McCarthy PRESIDENT & CHIEF EXECUTIVE OFFICER Perley McBride EXECUTIVE
Investor Update. First Quarter 2015
 Investor Update First Quarter 2015 May 5, 2015 Safe Harbor Statement Forward-Looking Language This report contains forward-looking statements, related to future, not past, events. Forward-looking statements
Financial and Operational Trends
 Q3 2018 AT&T EARNINGS Financial and Operational Trends INCOME STATEMENTS, CASH FLOWS, SEGMENT RESULTS, REVENUE DETAILS AND OPERATING VOLUMES OCTOBER 24, 2018 Consolidated Statements of Income 3 AT&T Inc.
AT&T INC. FINANCIAL REVIEW 2018
 AT&T INC. FINANCIAL REVIEW 2018 Selected Financial and Operating Data... 18 Management s Discussion and Analysis of Financial Condition and Results of Operations... 19 Consolidated Financial Statements...
Comcast Reports Second Quarter 2007 Results
 Comcast Reports Second Quarter 2007 Results Highest level of second quarter RGU additions in Comcast history RGU additions up 94% to 1.6 million Surpassed 3 million Comcast Digital Voice customers as the
Q Investor Call. November 6, 2014
 Q3 2014 Investor Call November 6, 2014 Safe Harbor Safe Harbor Statement Under the Private Securities Litigation Reform Act of 1995: This presentation contains forward-looking statements within the meaning
QUARTERLY INVESTOR SUMMARY
 QUARTERLY INVESTOR SUMMARY May 11, 2015 DISH NETWORK REPORTS FIRST QUARTER 2015 FINANCIAL RESULTS ENGLEWOOD, Colo., May 11, 2015 DISH Network Corporation (NASDAQ: DISH) today reported revenue totaling
Discussion and Reconciliation of Non-GAAP Measures
 Discussion and Reconciliation of Non-GAAP Measures We believe the following measures are relevant and useful information to investors as they are part of AT&T's internal management reporting and planning
2016 Investor Day. November 10, 2016
 2016 Investor Day November 10, 2016 Forward-Looking Statements This presentation includes certain forward-looking statements within the meaning of the Private Securities Litigation Reform Act of 1995,
LIBERTY GLOBAL REPORTS SECOND QUARTER 2009 RESULTS. Rebased Operating Cash Flow Growth of 8% in Q2 & YTD. Free Cash Flow of $496 Million YTD
 LIBERTY GLOBAL REPORTS SECOND QUARTER 2009 RESULTS Rebased Operating Cash Flow Growth of 8% in Q2 & YTD Free Cash Flow of $496 Million YTD Consolidated Liquidity of $3 Billion Englewood, Colorado August
UNITED STATES SECURITIES AND EXCHANGE COMMISSION WASHINGTON, D.C FORM 8-K
 UNITED STATES SECURITIES AND EXCHANGE COMMISSION WASHINGTON, D.C. 20549 FORM 8-K CURRENT REPORT Pursuant to Section 13 or 15(d) of the Securities Exchange Act of 1934 Date of Report (Date of earliest event
ViaSat, Inc. FY16 Q1 Results. August 6, 2015
 ViaSat, Inc. FY16 Q1 Results August 6, 2015 1 Safe Harbor Disclosure 2 our website at www.viasat.com. Forward-Looking Statements This presentation contains forward-looking statements regarding future events
Frontier Communications Reports 2016 Fourth Quarter and Full Year Results
 February 27, 2017 Frontier Communications Reports 2016 Fourth Quarter and Full Year Results Adjusted EBITDA 1 of $966 million and net loss of $80 million in the fourth quarter Full-year adjusted free cash
Less: Net Income Attributable to Noncontrolling Interest (82) (107) (90) (78) (357) (105) (99) (94) (99) (397) (97) (91)
 (107) (90) (78) (357) (105) (99) (94) (99) (397) (97) (91)") Consolidated Statements of Income 3 AT&T Inc. Dollars in millions except per share amounts Unaudited 3/31/16 6/30/16 9/30/16 12/31/16 2016 3/31/17 6/30/17 9/30/17 12/31/17 2017 3/31/18 3/31/18 Operating
Consolidated Statements of Income 3 AT&T Inc. Dollars in millions except per share amounts Unaudited 3/31/16 6/30/16 9/30/16 12/31/16 2016 3/31/17 6/30/17 9/30/17 12/31/17 2017 3/31/18 3/31/18 Operating
RBC Capital Markets 2009 Technology, Media & Communications Conference
 RBC Capital Markets 2009 Technology, Media & Communications Conference San Francisco, CA Brent Whittington, Executive Vice President and CFO June 10, 2009 Safe Harbor Statement Safe Harbor Statement Windstream
Charter Communications Inc.
 December 12, 2014 Charter Communications Inc. Current Recommendation NEUTRAL Prior Recommendation Underperform Date of Last Change 02/26/2014 Current Price (12/11/14) $164.16 Target Price $172.00 SUMMARY
TiVo Reports Results for the First Quarter Fiscal Year 2009 Ended April 30, 2008
 TiVo Reports Results for the First Quarter Fiscal Year 2009 Ended April 30, 2008 - TiVo posts record quarter for Net Income and Adjusted EBITDA - Adjusted EBITDA for the first quarter was $11.1 million,
Caution Concerning Forward Looking Statements and Non-GAAP Financial Measures
 Caution Concerning Forward Looking Statements and Non-GAAP Financial Measures Today s presentation includes forward looking statements within the meaning of the Safe Harbor provisions of the Private Securities
COMCAST REPORTS 2nd QUARTER 2015 RESULTS
 PRESS RELEASE COMCAST REPORTS 2nd QUARTER 2015 RESULTS Consolidated 2nd Quarter 2015 Highlights: Consolidated Revenue Increased 11.3%, Operating Cash Flow Increased 8.0%, and Operating Income Increased
SiriusXM Reports Fourth Quarter and Full-Year 2016 Results
 NEWS RELEASE SiriusXM Reports Fourth Quarter and Full-Year 2016 Results 2/2/2017-2016 Revenue Climbs 10% to $5.0 Billion - Net Subscriber Growth in 2016 of 1.75 Million - Company Beats 2016 Guidance on
THE WALT DISNEY COMPANY REPORTS IMPROVED RESULTS FOR THE YEAR ENDED SEPTEMBER 30, 2003
 FOR IMMEDIATE RELEASE November 20, 2003 THE WALT DISNEY COMPANY REPORTS IMPROVED RESULTS FOR THE YEAR ENDED SEPTEMBER 30, 2003 Significant earnings growth in the fiscal fourth quarter helped drive overall
2014 Investor Day. November 19, 2014
 2014 Investor Day November 19, 2014 Forward-Looking Statements This presentation includes certain forward-looking statements within the meaning of the Private Securities Litigation Reform Act of 1995,
SiriusXM Reports Third Quarter 2015 Results
 NEWS RELEASE SiriusXM Reports Third Quarter 2015 Results 10/22/2015 - Record Third Quarter Revenue Up 11% to $1.17 Billion - Third Quarter Net Income Climbs 22% to $167 Million - Adjusted EBITDA Climbs
APX Group Holdings, Inc. 1st Quarter 2017 Results. May 10, 2017
 APX Group Holdings, Inc. 1st Quarter 2017 Results May 10, 2017 1 forward-looking statements APX Group Holdings, Inc. (the Company, Vivint, we, our, or us ) obtained the industry, market and competitive
2017 AT&T EARNINGS. Investor Briefing. No. 299 JANUARY 31, 2018
 No. 299 JANUARY 31, 2018 Contents Consolidated Results 3 Business Solutions 6 Entertainment Group 8 Consumer Mobility 10 International 11 AT&T Mobility 12 Highlights 15 Financial and Operational Information
4th QUARTER AND FULL-YEAR 2018 RESULTS. January 23, 2019
 4th QUARTER AND FULL-YEAR 2018 RESULTS January 23, 2019 Important Information Caution Concerning Forward-Looking Statements This presentation contains forward-looking statements within the meaning of the
SiriusXM Reports Fourth Quarter and Full-Year 2017 Results
 NEWS RELEASE SiriusXM Reports Fourth Quarter and Full-Year 2017 Results 1/31/2018-2017 Revenue Climbs 8% to $5.4 Billion - Self-Pay Net Subscriber Additions of 1.56 Million in 2017-2017 Net Income Totals
Equipment 4,375 4,260 4,455 5,667 18,757 3,848 4,138 4,191 6,532 18,709 4,848 4,377 4,848 4,377
 Consolidated Statements of Income 3 AT&T Inc. except per share amounts Unaudited 3/31/16 6/30/16 9/30/16 12/31/16 2016 3/31/17 6/30/17 9/30/17 12/31/17 2017 3/31/18 6/30/18 3/31/18 6/30/18 Operating Revenues
COMCAST REPORTS 4 th QUARTER AND YEAR END 2014 RESULTS
 PRESS RELEASE COMCAST REPORTS 4 th QUARTER AND YEAR END 2014 RESULTS Full Year 2014 Highlights: Consolidated Revenue Increased 6.4%, Operating Cash Flow Increased 6.9%, Operating Income Increased 9.9%
UBS Global Media and Communications Conference
 UBS Global Media and Communications Conference David Frear, EVP & CFO December 5, 2011 Disclaimer on forward-looking statements The guidance contained herein are based upon a number of assumptions and
Comcast Reports 2nd Quarter 2017 Results
 Comcast Reports 2nd Quarter 2017 Results July 27, 2017 Consolidated 2nd Quarter 2017 Highlights: Consolidated Revenue Increased 9.8%; Net Income Attributable to Comcast Increased 23.9%; Adjusted EBITDA
VIRGIN MEDIA REPORTS THIRD QUARTER 2007 RESULTS
 VIRGIN MEDIA REPORTS THIRD QUARTER 2007 RESULTS London, England, November 7, 2007 Virgin Media Inc. (NASDAQ: VMED) announces results for the quarter ended September 30, 2007. Quarterly highlights Significant
THE WALT DISNEY COMPANY REPORTS FIRST QUARTER EARNINGS
 FOR IMMEDIATE RELEASE February 9, THE WALT DISNEY COMPANY REPORTS FIRST QUARTER EARNINGS BURBANK, Calif. The Walt Disney Company today reported earnings for its first fiscal quarter ended January 2,. Diluted
TIVO ANNOUNCES RESULTS FOR FOURTH QUARTER AND FISCAL YEAR 2007 ENDING JANUARY 31, 2007
 Contacts: Investor Relations Media Relations Derrick Nueman Jeffrey Weir Sloane & Company 408-519-9677 212-446-1878 ir@tivo.com jweir@sloanepr.com TIVO ANNOUNCES RESULTS FOR FOURTH QUARTER AND FISCAL YEAR
Third Quarter November 8, 2017
 Third Quarter 2017 November 8, 2017 Safe Harbor Statement Forward Looking Language Certain statements in this presentation constitute forward-looking statements within the meaning of the Private Securities
Charter Announces Third Quarter 2018 Results
 NEWS Charter Announces Third Quarter 2018 Results Stamford, Connecticut - October 26, 2018 - Charter Communications, Inc. (along with its subsidiaries, the Company or Charter ) today reported financial
THE WALT DISNEY COMPANY REPORTS SECOND QUARTER EARNINGS
 FOR IMMEDIATE RELEASE May 11, THE WALT DISNEY COMPANY REPORTS SECOND QUARTER EARNINGS BURBANK, Calif. The Walt Disney Company today reported earnings for its second fiscal quarter and six months ended.
Third Quarter November 9, 2016
 Third Quarter 2016 November 9, 2016 Safe Harbor Statement Forward Looking Language Certain statements in this presentation constitute forward-looking statements within the meaning of the Private Securities
Annual General Meeting of Shareholders. April 29, 2009
 Annual General Meeting of Shareholders April 29, 2009 Alan Horn Chairman of the Board of Directors Agenda Opening Remarks Alan Horn Business of the Meeting Alan Horn Operational Review Nadir Mohamed Financial
AT$T Retiree DIRECTV Discount Details Learn More About Retire Discounts, Change Your Existing Service, And Enroll In New Discounts.
 Communications Workers of America Local 4250/CTU#16, Chicago IL 18225 Burnham Ave. Suite 11, Lansing, IL 60438 Published: January 4, 2017 AT$T Retiree DIRECTV Discount Details Learn More About Retire Discounts,
Investor Update. Second Quarter 2016 AUGUST 1, 2016
 184934579 Investor Update Second Quarter 2016 AUGUST 1, 2016 Earnings Call Agenda Strategic and Operational Review Financial Results Daniel McCarthy PRESIDENT & CHIEF EXECUTIVE OFFICER John Jureller EXECUTIVE
APX Group Holdings, Inc.
 APX Group Holdings, Inc. Imperial Capital Security Investor Conference December 11, 2014 preliminary statement APX Group, Inc. (the Company, we, our, or us ) obtained the industry, market and competitive
COMCAST REPORTS 1st QUARTER 2017 RESULTS
 PRESS RELEASE COMCAST REPORTS 1st QUARTER 2017 RESULTS Consolidated 1st Quarter 2017 Highlights: Consolidated Revenue Increased 8.9%; Net Income Attributable to Comcast Increased 20.2%; Adjusted EBITDA
TIME WARNER CABLE INC.
 FORM 10-Q (Quarterly Report) Filed 10/31/13 for the Period Ending 09/30/13 Address 60 COLUMBUS CIRCLE, 17TH FLOOR NEW YORK, NY 10023 Telephone 212-364-8200 CIK 0001377013 Symbol TWC SIC Code 4841 - Cable
November 8, Q18 Earnings Presentation
 November 8, 2018 3Q18 Earnings Presentation Participants Tony Thomas Chief Executive Officer Bob Gunderman Chief Financial Officer & Treasurer Chris King VP, Investor Relations 2 Safe Harbor Statement
FOR IMMEDIATE RELEASE Contacts: Zenia Mucha November 18, John Spelich
 FOR IMMEDIATE RELEASE Contacts: Zenia Mucha November 18, 2004 818-560-5300 John Spelich 818-560-8543 THE WALT DISNEY COMPANY REPORTS RESULTS FOR THE YEAR AND QUARTER ENDED SEPTEMBER 30, 2004 EPS before
AT&T Investor Update 2018 AT&T EARNINGS. 2 nd Quarter Earnings. July 24, 2018
 AT&T Investor Update 2 nd Quarter Earnings July 24, 2018 Q2 2018 AT&T EARNINGS AT&T Investor Update Results and Outlook Business Update John Stephens Senior Executive Vice President and Chief Financial
2018 AT&T EARNINGS. Investor Briefing. No. 300 APRIL 25, 2018
 No. 300 APRIL 25, 2018 Contents Consolidated Results 3 Business Solutions 6 Entertainment Group 8 Consumer Mobility 10 International 11 AT&T Mobility 12 Highlights 15 Financial and Operational Information
Frontier Communications Reports Fourth Quarter and Full Year 2017 Results
 401 Merritt 7 Norwalk, CT 06851 (203) 614-5600 www.frontier.com Frontier Communications Reports Fourth Quarter and Full Year 2017 Results Fourth Quarter Total revenue of $2.22 billion Consumer customer
4th quarter and full year FY16 results. 22 nd March 2016
 4th quarter and full year FY16 results 22 nd March 2016 Disclaimer This document contains certain forward-looking statements with respect to Astro Malaysia Holdings Berhad s ( Astro ) financial condition,
JAMES MURDOCH CHIEF EXECUTIVE OFFICER FORWARD-LOOKING STATEMENTS
 JAMES MURDOCH CHIEF EXECUTIVE OFFICER FORWARD-LOOKING STATEMENTS This document contains certain forward-looking statements within the meaning of the United States Private Securities Litigation Reform Act
Frontier Communications Reports 2017 First Quarter Results
 May 2, 2017 Frontier Communications Reports 2017 First Quarter Results Adjusted EBITDA 1 of $923 million and quarterly Net Loss of $75 million Third sequential quarter of improved FiOS gross adds in CTF
3Q Presentation. November 7, 2017
 3Q Presentation November 7, 2017 SAFE HARBOR Statements contained in this presentation that are not historical and reflect our views about future periods and events, including our future performance, constitute
Condensed Consolidated Statements of Income
 Condensed Consolidated Statements of Income (dollars in millions, except per share amounts) Operating Revenues $ 30,818 $ 29,420 4.8 Operating Expenses Cost of services and sales 11,189 10,932 2.4 Selling,
NYSE:BLD. Third Quarter 2016 Earnings Presentation
 NYSE:BLD Third Quarter 2016 Earnings Presentation 2 Safe Harbor Statements contained in this presentation that are not historical and reflect our views about future periods and events, including our future
Investor Update. Second Quarter 2018 July 31, Frontier Communications
 Investor Update Second Quarter July 31, Agenda 1 Strategic and Operational Review Daniel McCarthy President & Chief Executive Officer 2 Financial Review Perley McBride Executive Vice President & Chief
Ziggo N.V. Q Results. October 19, 2012
 Ziggo N.V. Q3 2012 Results October 19, 2012 Disclaimer This document does not constitute or form a part of any offer or solicitation to purchase or subscribe for securities in the United States or any
TIVO ANNOUNCES RESULTS FOR THIRD QUARTER ENDED OCTOBER 31, 2007
 Contacts: Investor Relations Media Relations Derrick Nueman Whit Clay Sloane & Company 408-519-9677 212-446-1864 ir@tivo.com wclay@sloanepr.com TIVO ANNOUNCES RESULTS FOR THIRD QUARTER ENDED OCTOBER 31,
Frontier Communications Reports 2018 First Quarter Results
 401 Merritt 7 Norwalk, CT 06851 (203) 614-5600 www.frontier.com Frontier Communications Reports 2018 First Quarter Results First Quarter Total revenue of $2.20 billion Achieved sequential growth in consumer
PT Link Net Tbk 1H 2015 Results Update August 5, 2015
 PT Link Net Tbk 1H 2015 Results Update August 5, 2015 Section 1 Financial performance Key highlights 1H 2015 Delivered steady financial results and yoy growth over last 2 quarters amidst external pressures
3 rd Quarter 2011 Earnings Results
 3 rd Quarter 2011 Earnings Results Fran Shammo Chief Financial Officer October 21, 2011 Safe Harbor Statement NOTE: This presentation contains statements about expected future events and financial results
FORWARD-LOOKING STATEMENTS
 WWE INVESTOR PRESENTATION DECEMBER 2018 FORWARD-LOOKING STATEMENTS This presentation contains forward-looking statements pursuant to the safe harbor provisions of the Securities Litigation Reform Act of
Credit Suisse Global Credit Products Conference. October 4, 2012
 Credit Suisse Global Credit Products Conference October 4, 2012 Ralph Kelly SVP and Treasurer Basis of Presentation All financial and operating results included in this presentation (except for capital
Citi Credit Conference. Bill Bradley, Treasurer November 15, 2012
 NLSN @ Citi Credit Conference Bill Bradley, Treasurer November 15, 2012 Forward Looking Statements The following discussion may contain forward-looking statements, including those about Nielsen s outlook
Q Results Conference Call. August 4, 2016
 Q2 2016 Results Conference Call August 4, 2016 Safe harbour notice Certain statements made in this presentation are forward-looking statements. These statements include, without limitation, statements
Hillhouse Research Partners
 Hillhouse Research Partners DISH Network Corp. DISH NASDAQ Rating : HOLD Industry: Cable TV Changes From To November 25, 2009 (Previous) (Current) Rating - HOLD Target Price - $23.50 Initiate with HOLD
Change % Net sales 101, , Net income 7, , Net income attributable to stockholders of the Company
 INVESTOR RELATIONS 2/21/2019 4:30 PM FOR IMMEDIATE RELEASE e Full Year 2018 Highlights Consolidated Net Sales and Operating Segment Income grew 8.2 and 8.5, respectively Advertising sales grew 2.1 during
Segment net sales 26, , Operating segment income (1) 10, , (1)
 10, , (1)") INVESTOR RELATIONS FOR IMMEDIATE RELEASE Highlights Consolidated Net Sales and Operating Segment Income grew 10.5 and 10.4, respectively Double-digit growth in Cable Segment Sales and Operating Segment
INVESTOR RELATIONS FOR IMMEDIATE RELEASE Highlights Consolidated Net Sales and Operating Segment Income grew 10.5 and 10.4, respectively Double-digit growth in Cable Segment Sales and Operating Segment
William Blair Growth Stock Conference. June 13, 2012
 NLSN @ William Blair Growth Stock Conference June 13, 2012 Forward Looking Statements The following discussion contains forward-looking statements, including those about Nielsen s outlook and prospects,
Investor presentation
 Investor presentation 1 Cautionary note The following materials are for presentation purposes only. These materials should be read in conjunction with the disclosure documents referenced below. Certain
August 9, Q18 Earnings Presentation
 August 9, 2018 2Q18 Earnings Presentation Participants Tony Thomas Chief Executive Officer Bob Gunderman Chief Financial Officer & Treasurer Chris King VP, Investor Relations 2 Safe Harbor Statement Windstream
TIVO REPORTS FIRST FULL YEAR OF PROFITABILITY FOR FISCAL YEAR ENDED JANUARY 31, 2009
 Contacts: Investor Relations Media Relations Derrick Nueman Mike Boccio Sloane & Company 408-519-9677 212-446-1867 ir@tivo.com mboccio@sloanepr.com TIVO REPORTS FIRST FULL YEAR OF PROFITABILITY FOR FISCAL