JQ 14 Results Presentation July 28, 2014
|
|
|
- Corey Ward
- 5 years ago
- Views:
Transcription

1 JQ 14 Results Presentation July 28,
2 Safe Harbor Statement This Release / Communication, except for the historical information, may contain statements, including the words or phrases such as expects, anticipates, intends, will, would, undertakes, aims, estimates, contemplates, seeks to, objective, goal, projects, should and similar expressions or variations of these expressions or negatives of these terms indicating future performance or results, financial or otherwise, which are forward looking statements. These forward looking statements are based on certain expectations, assumptions, anticipated developments and other factors which are not limited to, risk and uncertainties regarding fluctuations in earnings, market growth, intense competition and the pricing environment in the market, consumption level, ability to maintain and manage key customer relationship and supply chain sources and those factors which may affect our ability to implement business strategies successfully, namely changes in regulatory environments, political instability, change in international oil prices and input costs and new or changed priorities of the trade. The Company, therefore, cannot guarantee that the forward looking statements made herein shall be realized. The Company, based on changes as stated above, may alter, amend, modify or make necessary corrective changes in any manner to any such forward looking statement contained herein or make written or oral forward looking statements as may be required from time to time on the basis of subsequent developments and events. The Company does not undertake any obligation to update forward looking statements that may be made from time to time by or on behalf of the Company to reflect the events or circumstances after the date hereof. 2

3 Agenda 1 Strategy 2 Business Context 3 Current Quarter Performance 4 Looking Ahead 3


4 Clear and Compelling Strategy Strategic framework Sustainable Living Plan Goals Consistent Growth Competitive Growth Profitable Growth Responsible Growth 4
5 JQ 2014 Context Business environment remains challenging Further slowdown in market growth (volume & value) across categories Premium segments & discretionary categories still remain soft Input costs firm, up on y-o-y basis Competitive activity remains high despite lower media intensity 5

6 Input costs firm Up year-on-year basis Source: Bloomberg data and internal estimates INR numbers arrived at by applying the average exchange rate of the quarter to the average USD cost of the commodity 6
7 JQ 2014 Competitive and profitable growth sustained Domestic Consumer business grows by 13%, ahead of market 6% underlying volume growth Operating profit (PBIT) at Rs.1250 crores, up 23%; margin expands +130 bps COGS higher by 60 bps; led by input cost inflation Employee cost includes one time credit of Rs. 32 crores (~45 bps) for pension corpus adjustment Competitive spends maintained; A&P up Rs. 55 crores (6%); 12.5% of sales (-80 bps) Other expenditure down 20 bps through operating efficiencies PAT (bei) at Rs crores, up 15% Net Profit at Rs crores, up 4% Growth impacted by exceptional items high property sales and tax credit in base quarter Domestic Consumer business = Domestic FMCG + Water A&P: Advertising & Promotion 7

8 Healthy volume growth in a slowing market * Intrinsic UVG is after adjusting for impact of transport strike related up-stocking at end March
9 Double digit growth across all segments Sales growth % Soaps & Detergents Personal Products Beverages Packaged Foods Domestic Consumer grows at 13% Sales growth = Segment Turnover growth excluding Other Operational Income 9
10 CATEGORY HIGHLIGHTS


11 Winning with Brands Continued focus on innovations 11


12 Winning with Brands Impactful 360 activation 12


13 Skin Cleansing Double digit growth Dove leads category performance Pears, Lux, Liril, Hamam and Lifebuoy deliver double digit growth Lux re-launched with improved product sensorials and aesthetics Step up in price growth; judicious pricing and cost savings to manage input cost inflation Liquids perform well led by Lifebuoy handwash 13


14 Home Care Double digit growth led by the premium segment Laundry Surf delivers one of its strongest quarters Rin accelerates across both powders and bars Wheel growth improves post re-launch Comfort continues to do well and lead market development Household Care Double digit growth led by robust performance on Vim 14


 Facial")

15 Skin Care Double digit growth in a challenging market FAL, Ponds and Lakme deliver double digit growth FAL continues to build momentum post relaunch Pond s growth led by premium skin lightening and talc Lakme buoyed by CC cream and Perfect Radiance range Launch of Pond s Men range (Moisturizer + Facewash) Facial cleansing portfolio sustains strong broad based growth FAL = Fair and Lovely 15


16 Hair Care Volume led double digit growth Shampoos deliver another quarter of strong performance Dove performance accelerates Clinic Plus continues to do well; TRESemmé making good progress Broad-based growth across formats; sachets grow faster Conditioners market development sustained 16

17 Oral Care Continued investments to sustain competitiveness Close Up delivers double digit growth Core re-launched; Diamond Attraction introduced Small packs leading growth Pepsodent recovery underway 17


18 Color Cosmetics Innovation led double digit growth Lakme sustains strong growth led by premium make up 9 to 5 and eyeconic doing very well Exciting launch of the Lakme Absolute Gloss Addict range Elle 18 delivers another robust performance 18


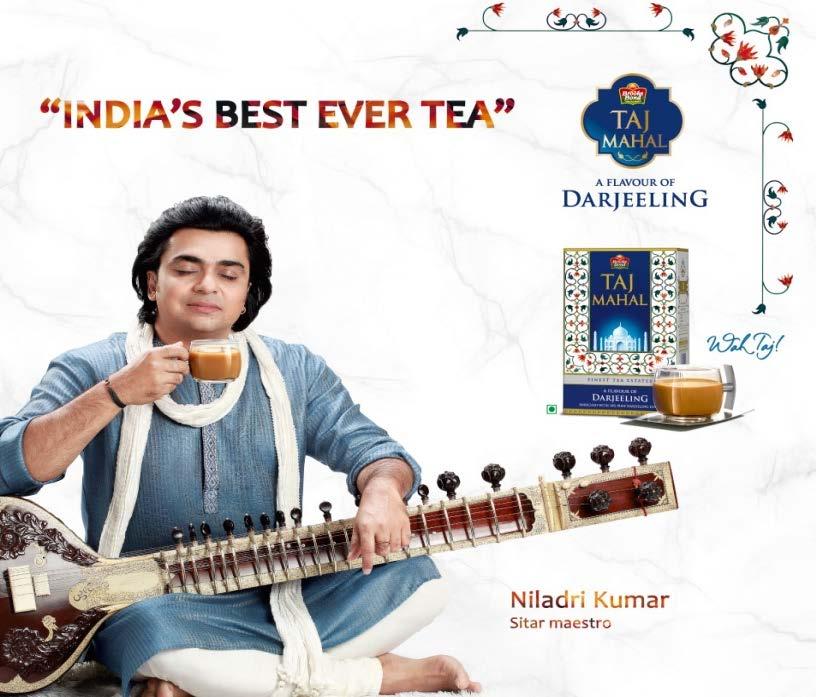
19 Beverages Double digit growth in Tea and Coffee Tea growth led by strong volumes Driven by strengthened brands & sharper in-market activation Green tea delivers another good quarter; continued focus on market development Premium offering Taj A Flavor of Darjeeling launched Tea price growth fades Coffee growth steps up; Bru Gold sustains momentum 19


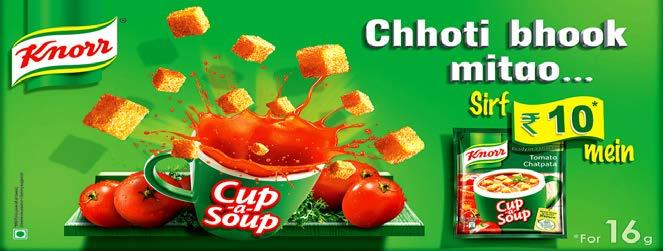
20 Packaged Foods Double digit growth in Kissan, Knorr & Kwality Walls Kissan sustains strong growth momentum Driven by impactful market development Knorr growth led by Soups; Instant Soups more than double Driving product experience and trial generation Kwality Walls and Magnum deliver a strong quarter Sharper in-market execution during extended summer season 20


21 Pureit Double digit growth in a challenging durables market Pureit continues to strengthen its category leadership Growth driven by the premium end Pureit Ultima (RO + UV) well received Modern Trade and Pureit Perfect Stores lead growth UV: Ultra Violet; RO: Reverse Osmosis 21
22 JQ 2014 Results summary Rs Crores Particulars JQ'13 JQ'14 Growth % Net Sales* 6,687 7, PBIT , PBIT margin (%) bps PAT bei Net Profit * Domestic Consumer grows at 13% 22
23 JQ 2014 PBIT to Net Profit Rs Crores Particulars JQ 13 JQ 14 Growth % PBIT Add : Other Income Less : Finance Costs 6 6 Exceptional Items Credit / (Charge) PBT Less : Tax (277) (428) Net Profit Other income includes Interest, dividend and net gain on sale of other non trade current investments of Rs. 88 crores (JQ 13: Rs. 80 crores) Net gain on sale of non current investments Rs. 106 crores (JQ 13 : Rs. 73 crores) Interest on income tax refunds of Rs. 8 crores (JQ 13: Rs. 24 crores). Employee benefit expenses include a one-time credit of Rs. 32 crores for un-utilized pension corpus adjustment Exceptional items include profit on sale of surplus properties of Rs. 40 crores (JQ 13: Rs. 106 crores) Taxation includes net write back of excess tax provisions of earlier years of Rs. 11 crores (JQ 13: Rs. 64 crores) Effective tax rate for the quarter is 29.5% (JQ'13: 25.6%) 23
24 JQ 2014 Results summary Competitive and profitable growth sustained 13% Domestic Consumer growth, ahead of market o 6% underlying volume growth (transport strike impact in base quarter) PBIT margin expands +130 bps o Inflation impact, competitive A&P spend, one time pension credit, operating efficiencies 24
25 Looking ahead Continued headwinds - market growth, consumer spending and inflation Positive on the medium-long term outlook for FMCG Strategy unchanged o Manage the business for long term growth Consistent, Competitive, Profitable, Responsible Growth o Invest to strengthen the core and lead development of emerging categories HUL well positioned : Brands, Capabilities, Talent 25


26 For more information & updates VISIT OUR WEBSITE HUL INVESTOR APP 26
SQ 14 Results Presentation October 27, 2014
 SQ 14 Results Presentation October 27, 2014 1 Safe Harbor Statement This Release / Communication, except for the historical information, may contain statements, including the words or phrases such as expects,
MQ 2015 & FY Results Presentation May 8, 2015
 MQ 2015 & FY 2014-15 Results Presentation May 8, 2015 1 Safe Harbor Statement This Release / Communication, except for the historical information, may contain statements, including the words or phrases
September Quarter 2015 Results Presentation October 14, 2015
 September Quarter 2015 Results Presentation October 14, 2015 1 Safe Harbor Statement This Release / Communication, except for the historical information, may contain statements, including the words or
DQ 14 Results Presentation January 19, 2015
 DQ 14 Results Presentation January 19, 2015 1 Safe Harbor Statement This Release / Communication, except for the historical information, may contain statements, including the words or phrases such as expects,
DQ 2015 Results Presentation January 15, 2016
 DQ 2015 Results Presentation January 15, 2016 1 Safe Harbor Statement This Release / Communication, except for the historical information, may contain statements, including the words or phrases such as
Results SQ 10. October 26, Investor Presentation
 Results SQ 10 October 26, 2010 Investor Presentation Safe Harbour Statement This Release / Communication, except for the historical information, may contain statements, including the words or phrases such
RESULTS FOR SEPTEMBER QUARTER % DOMESTIC CONSUMER SALES GROWTH, OPERATING PROFIT (PBIT) UP 11% IN SEPTEMBER QUARTER 2013
 UP 11% IN SEPTEMBER QUARTER 2013") RESULTS FOR SEPTEMBER QUARTER 2013 10% DOMESTIC CONSUMER SALES GROWTH, OPERATING PROFIT (PBIT) UP 11% IN SEPTEMBER QUARTER 2013 Mumbai, October 26 th, 2013: Hindustan Unilever Limited announced its results
RESULTS FOR SEPTEMBER QUARTER 2013 10% DOMESTIC CONSUMER SALES GROWTH, OPERATING PROFIT (PBIT) UP 11% IN SEPTEMBER QUARTER 2013 Mumbai, October 26 th, 2013: Hindustan Unilever Limited announced its results
Hindustan Unilever Limited. SQ 18 Results Presentation : 12 th October 2018
 Hindustan Unilever Limited SQ 18 Results Presentation : 12 th October 2018 Safe Harbor Statement This Release / Communication, except for the historical information, may contain statements, including the
Safe Harbor Statement
 Hindustan Unilever Limited DQ 17 Results Presentation : 17 th January 2018 1 Safe Harbor Statement This Release / Communication, except for the historical information, may contain statements, including
Hindustan Unilever Limited SQ 17 Results Presentation : 25 th Oct 2017
 Hindustan Unilever Limited SQ 17 Results Presentation : 25 th Oct 2017 1 Safe Harbor Statement This Release / Communication, except for the historical information, may contain statements, including the
Hindustan Unilever Limited. MQ 18 & FY Results Presentation : 14 th May 2018
 Hindustan Unilever Limited MQ 18 & FY 17-18 Results Presentation : 14 th May 2018 Safe Harbor Statement This Release / Communication, except for the historical information, may contain statements, including
August A Research Report On. By Islami Tijara Research Team. Copyright Reserved
 A Research Report On By Islami Tijara Research Team Hindustan Unilever Limited Hindustan Unilever Limited (HUL) is India's largest Fast Moving Consumer Goods Company; the company was first incorporated
RESULTS FOR THE QUARTER ENDING 31 st MARCH % COMPARABLE* DOMESTIC CONSUMER GROWTH, 11% UNDERLYING VOLUME GROWTH
 RESULTS FOR THE QUARTER ENDING 31 st MARCH 2018 16% COMPARABLE* DOMESTIC CONSUMER GROWTH, 11% UNDERLYING VOLUME GROWTH Mumbai, May 14 th, 2018: Hindustan Unilever Limited announced its results for the
RESULTS FOR THE QUARTER ENDING 30 st JUNE % COMPARABLE* DOMESTIC CONSUMER GROWTH, 12% UNDERLYING VOLUME GROWTH
 RESULTS FOR THE QUARTER ENDING 30 st JUNE 2018 16% COMPARABLE* DOMESTIC CONSUMER GROWTH, 12% UNDERLYING VOLUME GROWTH Mumbai, July 16 th, 2018: Hindustan Unilever Limited announced its results for the
Sneha Sharma* Ravi Kumar Bakshi** ABSTRACT
 GROWTH OF FMCG SECTOR CONSUMER GOODS WITH SPECIAL REFRENCE TO HUL AND ITS CORRELATION WITH FMCG INDEX AND SENSEX Sneha Sharma* Ravi Kumar Bakshi** ABSTRACT Purpose: The major focus of this paper is to
BUY HINDUSTAN UNILEVER LTD. Result Update: Q4 FY14. CMP Target Price APRIL 29 th 2014 SYNOPSIS
 BUY CMP 564.50 Target Price 625.00 HINDUSTAN UNILEVER LIMITED Result Update: Q4 FY14 APRIL 29 th 2014 ISIN: INE030A01027 Index Details Stock Data Sector FMCG BSE Code 500696 Face Value 1.00 52wk. High
BUY HINDUSTAN UNILEVER LTD. Result Update: Q3 FY14. CMP Target Price JANUARY 28 th 2014 SYNOPSIS
 BUY CMP 560.00 Target Price 620.00 HINDUSTAN UNILEVER LIMITED Result Update: Q3 FY14 JANUARY 28 th 2014 ISIN: INE030A01027 Index Details Stock Data Sector FMCG BSE Code 500696 Face Value 1.00 52wk. High
SQ 02 Results - Snapshot
 SQ 02 Results - Snapshot HPC Power Brands up by 6.8%, driving HPC growth of 4.9% Foods decline by 15.7% leading to flat FMCG sales Operating Profits (PBIT) up 16.6%, Margin Expansion by 390 bps Declining
Presentation at Citigroup Smith Barney India Corporate Day. London, June 2003
 Presentation at Citigroup Smith Barney India Corporate Day London, June 2003 HINDUSTAN LEVER LIMITED Contents Economy Overview Strategy FY 2002 MQ 2003 2003 & Beyond.. HINDUSTAN LEVER LIMITED Contents
Hindustan Unilever. Source: Company Data; PL Research
 Levered to play recovery in demand; Accumulate May 09, 2016 Amnish Aggarwal amnishaggarwal@plindia.com +91 22 66322233 Gaurav Jogani gauravjogani@plindia.com +91 22 66322238 Rating Accumulate Price Rs846
HUL. Q4FY17 Result Update Healthy performance, rich valuations. Sector: FMCG CMP: ` Recommendation: Hold
 HUL QFY17 Result Update Healthy performance, rich valuations Sector: FMCG CMP: ` 1009 Recommendation: Hold Market Statistics Current stock price (`) 1,009 Shares O/S (cr.) 21. Mcap (`cr) 218,9 52W H/L
Hindustan Unilever (HINLEV) 789
 789") Result Update Rating matrix Rating : Buy Target : 117 Target Period : 12 months Potential Upside : 29% What s changed? Target Unchanged EPS FY16E Changed from 21. to 2.8 EPS FY17E Changed from 2.9 to 24.8
Result Update Rating matrix Rating : Buy Target : 117 Target Period : 12 months Potential Upside : 29% What s changed? Target Unchanged EPS FY16E Changed from 21. to 2.8 EPS FY17E Changed from 2.9 to 24.8
Hindustan Unilever (HINLEV) 919
 919") Result Update Rating matrix Rating : Buy Target : 117 Target Period : 12 months Potential Upside : 11% What s changed? Target Changed from 92 to 117 EPS FY16E Changed from 2.8 to 21.2 EPS FY17E Changed
Result Update Rating matrix Rating : Buy Target : 117 Target Period : 12 months Potential Upside : 11% What s changed? Target Changed from 92 to 117 EPS FY16E Changed from 2.8 to 21.2 EPS FY17E Changed
Hindustan Unilever (HINLEV) 868
 868") Result Update May 11, 215 Rating matrix Rating : Hold Target : 92 Target Period : 12 months Potential Upside : 4% What s changed? Target EPS FY16E EPS FY17E Rating Unchanged Unchanged Unchanged Unchanged
Result Update May 11, 215 Rating matrix Rating : Hold Target : 92 Target Period : 12 months Potential Upside : 4% What s changed? Target EPS FY16E EPS FY17E Rating Unchanged Unchanged Unchanged Unchanged
Hindustan Unilever. Q1FY19 Result Update Maintaining strong volume trajectory on high base is the key. Sector: FMCG CMP: ` 1,644. Recommendation: HOLD
 Hindustan Unilever Q1FY19 Result Update Maintaining strong volume trajectory on high base is the key Sector: FMCG CMP: ` 1, Recommendation: HOLD Market Statistics Current stock price (`) 1, Shares O/S
UNILEVER TRADING STATEMENT THIRD QUARTER 2013 GOOD PROGRESS IN SLOWER MARKETS
 UNILEVER TRADING STATEMENT THIRD QUARTER 2013 GOOD PROGRESS IN SLOWER MARKETS Nine months highlights Underlying sales growth 4.4% with emerging markets up 8.8% Underlying volume growth 2.4% ahead of our
HINDUSTAN UNILEVER Core story intact; wait for better entry point
 RESULT UPDATE HINDUSTAN UNILEVER Core story intact; wait for better entry point India Equity Research Consumer Goods Hindustan Unilever s (HUL) sales were in line while PAT surpassed estimate. Key positives
Unilever Q Roadshow
 Unilever Q1 2008 Roadshow INDEX - Unilever Q1 2008 Results Highlights 3 Accelerate Restructuring Programme Simplification 13 Strong Organic Growth 3 Accelerate Restructuring Programme Progress to Date
The success of a business firm is largely dependent on the efficiency of its liquidity
 Volume - 5, Issue- 6, June 2017 IC Value : 56.46 e-issn : 2347-9671 p- ISSN : 2349-0187 EPRA International Journal of Economic and Business Review SJIF Impact Factor(2016) : 6.484 ISI Impact Factor (2013):
Hindustan Unilever Ltd.
 . RESULT UPDATE 25th October 2017 Oct-14 Apr-15 Oct-15 Apr-16 Oct-16 Apr-17 Oct-17 India Equity Institutional Research II Result Update - II 25th October 2017 CMP INR 1273 Target INR 1392 Potential Upside
Hindustan Unilever. CMP:INR324 TP:INR302 Neutral
 BSE SENSEX S&P CNX 18,197 5,482 29 July 2011 1QFY12 Results Update Sector: FMCG Hindustan Unilever CMP:INR324 TP:INR302 Neutral Bloomberg HUVR IN Equity Shares (m) 2,159.5 52-Week Range (INR) 347/250 1,6,12
Hindustan Unilever (HINLEV) 1158
 1158") Result Update Rating matrix Rating : Hold Target : 1180 Target Period : 12 months Potential Upside : 2% What s changed? Target Changed from 1120 to 1180 EPS FY18E Changed from 22.8 to 25.1 EPS FY19E Changed
Result Update Rating matrix Rating : Hold Target : 1180 Target Period : 12 months Potential Upside : 2% What s changed? Target Changed from 1120 to 1180 EPS FY18E Changed from 22.8 to 25.1 EPS FY19E Changed
Unilever Trading Statement Q Jean-Marc Huët / James Allison. October 23 rd 2014
 Unilever Trading Statement Q3 2014 Jean-Marc Huët / James Allison October 23 rd 2014 Jean-Marc Huët SAFE HARBOUR STATEMENT This announcement may contain forward-looking statements, including forward-looking
Hindustan Unilever. Institutional Equities. Company Update. Faster And Stronger BUY. Sector: FMCG CMP: Rs1,350 Target Price: Rs1,570 Upside: 16%
 Company Update Institutional Equities Hindustan Unilever Reuters: HLL.BO; Bloomberg: HUVR IN Faster And Stronger We reiterate our positive view on the Home and Personal Care (HPC) space and continue to
Hindustan Unilever (HINLEV) 862
 862") Result Update Rating matrix Rating : Buy Target : 1 Target Period : 12 months Potential Upside : 16% What s changed? Target Unchanged EPS FY17E Changed from 23.2 to 22.1 EPS FY18E Changed from 26.7 to
Result Update Rating matrix Rating : Buy Target : 1 Target Period : 12 months Potential Upside : 16% What s changed? Target Unchanged EPS FY17E Changed from 23.2 to 22.1 EPS FY18E Changed from 26.7 to
HINDUSTAN LEVER LIMITED
 India HINDUSTAN LEVER LIMITED CLSA Investors Meet Hong Kong, May 2001 Hindustan Lever Leading consumer products company Financials - 2000 - Turnover Rs. 106 bln - Net Profit Rs. 13 bln - EPS Rs. 5.95 -
Unilever at Deutsche Bank Conference Paul Polman CEO Paris, June 11 th 2015
 Unilever at Deutsche Bank Conference Paul Polman CEO Paris, June 11 th 2015 SAFE HARBOUR STATEMENT This presentation may contain forward-looking statements, including forward-looking statements within
HINDUSTAN UNILEVER Volumes skirt deflationary pressures
 RESULT UPDATE HINDUSTAN UNILEVER Volumes skirt deflationary pressures India Equity Research Consumer Goods Hindustan Unilever s (HUL) Q2FY16 numbers came in line with our estimates. Key positives: (i)
Hindustan Unilever Ltd.
 . RESULT UPDATE 18 th July 2017 Jul-16 Sep-16 Nov-16 Jan-17 Mar-17 May-17 Jul-17 125 105 India Equity Institutional Research II Result Update - FY18 II 18th July, 2017 CMP INR 1158 Target INR 1206 MARKET
Unilever Roadshow. Third Quarter & Year to Date 2004 Results
 Unilever Roadshow Third Quarter & Year to Date 2004 Results This presentation may contain forward-looking statements, including forward-looking statements within the meaning of the United States Private
Unilever Q2 and First Half 2008 Results 31 July Unilever Q2 and First Half 2008 Roadshow
 Unilever Q2 and First Half 2008 Results 31 July 2008 Unilever Q2 and First Half 2008 Roadshow Patrick Cescau Group Chief Executive Clearer image to be sourced Jim Lawrence Chief Financial Officer Unilever
Soft volume growth, cautious outlook
 BSE Sensex S&P CNX 25,228 7,542 13 June 2014 Annual Report Update Sector: Consumer Hindustan Unilever CMP: INR634 TP: INR600 Sell Soft volume growth, cautious outlook Improved profitability and return
Financial Management
 Financial Management Code: MB0045 Marks(140) Section-A Time (3 hrs) 1Mark * 40= 40 Marks 1. The modern approach in financial management aims at procurement of least cost funds and its effective utilisation
Unilever H Results
 Unilever H1 2011 Results Paul Polman CEO Jean-Marc Huët CFO James Allison Head of IR and M&A August 4 th 2011 Safe Harbour Statement This announcement may contain forward-looking statements, including
Hindustan Unilever. Q4FY18 Result Update Strong volume growth on weak base and uptick in rural. Sector: FMCG CMP: ` 1,516. Recommendation: HOLD
 Hindustan Unilever QFY18 Result Update Strong volume growth on weak base and uptick in rural Sector: FMCG CMP: ` 1,1 Recommendation: HOLD Market Statistics Current stock price (`) 1,1 Shares O/S (cr.)
UNILEVER TRADING STATEMENT FIRST QUARTER 2019
 UNILEVER TRADING STATEMENT FIRST QUARTER 2019 Performance highlights Underlying performance GAAP measures vs 2018 vs 2018 Underlying sales growth (USG) (a) 3.1% Turnover 12.4bn (1.6)% Quarterly dividend
PRESS RELEASE. Mumbai, May 3, 2016: Godrej Consumer Products Limited (GCPL), a leading emerging
, a leading emerging") PRESS RELEASE 4Q FY 2016 results GCPL delivers a net profit growth of 17% on an organic constant currency net sales growth of 12%. Mumbai, May 3, 2016: Godrej Consumer Products Limited (GCPL), a leading
PRESS RELEASE 4Q FY 2016 results GCPL delivers a net profit growth of 17% on an organic constant currency net sales growth of 12%. Mumbai, May 3, 2016: Godrej Consumer Products Limited (GCPL), a leading
Hindustan Unilever Ltd.
 Nov-16 Dec-16 Jan-17 Feb-17 Mar-17 Apr-17 May-17 Jun-17 Jul-17 Aug-17 Sep-17 Oct-17 Nov-17. Volume No.. I Issue No. 152 Hindustan Unilever Ltd. December 1, 2017 BSE Code: 500696 NSE Code: HINDUNILVR Reuters
Unilever - CAGE Conference. Paul Polman CEO Roger Seabrook VP Investor Relations London - 19 th March 2012
 Unilever - CAGE Conference Paul Polman CEO Roger Seabrook VP Investor Relations London - 19 th March 2012 Contents 1 2011 key takeaways 2 Our progress over the last 3 years 3 Your questions addressed 2011
UNILEVER TRADING STATEMENT FIRST QUARTER 2015 GOOD START TO 2015, HELPED BY CURRENCIES
 UNILEVER TRADING STATEMENT FIRST QUARTER 2015 GOOD START TO 2015, HELPED BY CURRENCIES First quarter highlights Turnover increased 12.3% to 12.8 billion including a positive currency impact of 10.6% Underlying
UNILEVER TRADING STATEMENT THIRD QUARTER 2018 IMPROVED GROWTH ACROSS ALL DIVISIONS
 UNILEVER TRADING STATEMENT THIRD QUARTER 2018 IMPROVED GROWTH ACROSS ALL DIVISIONS Performance highlights Underlying performance GAAP measures vs 2017 vs 2017 Third quarter Underlying sales growth (USG)
2012 FIRST HALF YEAR RESULTS CONSISTENT PERFORMANCE SUSTAINED DESPITE CHALLENGING MARKETS
 2012 FIRST HALF YEAR RESULTS CONSISTENT PERFORMANCE SUSTAINED DESPITE CHALLENGING MARKETS First half highlights Turnover up 11.5% at 25.4 billion with a positive impact from foreign exchange of 1.9% and
2012 FULL YEAR AND FOURTH QUARTER RESULTS STRONG, BROAD-BASED GROWTH IN Paul Polman: Chief Executive Officer statement
 Page 1 of 11 2012 FULL YEAR AND FOURTH QUARTER RESULTS STRONG, BROAD-BASED GROWTH IN 2012 Full year highlights Turnover increased by 10.5% to 51.3 billion with a positive impact from foreign exchange of
Hindustan Unilever (HINLEV) 862
 862") Result Update January 24, 2017 Rating matrix Rating : Buy Target : 978 Target Period : 12 months Potential Upside : 13% What s changed? Target Unchanged EPS FY17E Changed from 20.7 to 20.3 EPS FY18E Changed
Result Update January 24, 2017 Rating matrix Rating : Buy Target : 978 Target Period : 12 months Potential Upside : 13% What s changed? Target Unchanged EPS FY17E Changed from 20.7 to 20.3 EPS FY18E Changed
Safe Harbour Statement
 Jim Lawrence Chief Financial Officer Lehman Back to School Conference 3 September 2008 Safe Harbour Statement This presentation may contain forward-looking statements, including 'forward-looking statements'
CHAPTER FOUR PROFILE OF SELECTED BRANDS RETAILERS AND CONSUMERS
 CHAPTER FOUR PROFILE OF SELECTED BRANDS RETAILERS AND CONSUMERS PROFILE OF SELECTED BRANDS, RETAILERS AND CUSTOMERS INTRODUCTION The previous chapter discussed about the theoretical aspects concerning
2013 FULL YEAR AND FOURTH QUARTER RESULTS GOOD PROGRESS IN TOUGH MARKETS. Paul Polman: Chief Executive Officer statement
 Page 1 of 13 FULL YEAR AND FOURTH QUARTER RESULTS GOOD PROGRESS IN TOUGH MARKETS Full year highlights Turnover down (3.0)% to 49.8 billion with foreign exchange (5.9)% and net acquisitions & disposals
Performance Update - 4Q FY16 May 3, 2016
 Performance Update - 4Q FY16 May 3, 2016 PERFORMANCE UPDATE 1 Executive Summary - Key Highlights 2 Business Overview - India 3 Business Overview - International 2 I GCPL I Performance Update 4Q FY16 I
GODREJ CONSUMER PRODUCTS INVESTOR PRESENTATION
 1 GODREJ CONSUMER PRODUCTS INVESTOR PRESENTATION GODREJ CONSUMER PRODUCTS SNAPSHOT strong positions in core categories largest home grown HPC company US $1.3 billion in sales in FY 14 home care hair care
UNILEVER TRADING STATEMENT FIRST QUARTER 2018 A GOOD START WITH STRONG VOLUME GROWTH
 UNILEVER TRADING STATEMENT FIRST QUARTER 2018 A GOOD START WITH STRONG VOLUME GROWTH Performance highlights Underlying performance GAAP measures vs 2017 vs 2017 Underlying sales growth (USG) (a) 3.4% Turnover
HOLD. Hindustan Unilever Limited FMCG RETAIL EQUITY RESEARCH. 2 nd August 2018 Q1FY19 RESULT UPDATE. CMP Rs. 1,733 TARGET Rs.
 Q1FY19 RESULT UPDATE Aug-17 Sep-17 Oct-17 Nov-17 Dec-17 Jan-18 Feb-18 Mar-18 Apr-18 GEOJIT RESEARCH May-18 Jun-18 Jul-18 Aug-18 RETAIL EQUITY RESEARCH Hindustan Unilever Limited FMCG BSE CODE: 500696 NSE
UNILEVER SECOND QUARTER AND HALF YEAR RESULTS 2003 (Unaudited)
") UNILEVER SECOND QUARTER AND HALF YEAR RESULTS 2003 (Unaudited) Outlook for full year earnings confirmed, supported by the sustained benefits of the Path to Growth strategy. FINANCIAL HIGHLIGHTS Millions
UNILEVER SECOND QUARTER AND HALF YEAR RESULTS 2003 (Unaudited) Outlook for full year earnings confirmed, supported by the sustained benefits of the Path to Growth strategy. FINANCIAL HIGHLIGHTS Millions
Firstsource Solutions Limited Q4 and FY2018 Earnings Update
 Firstsource Solutions Limited Q4 and FY2018 Earnings Update May 07, 2018 Proprietary Notice: This document contains proprietary and confidential statement information of Firstsource. No part of this document
2011 FULL YEAR AND FOURTH QUARTER RESULTS STRONG GROWTH DESPITE DIFFICULT MARKETS
 2011 FULL YEAR AND FOURTH QUARTER RESULTS STRONG GROWTH DESPITE DIFFICULT MARKETS Full year highlights Underlying sales growth ahead of our markets at 6.5% with price up 4.8% and volume growth 1.6%. Emerging
Hindustan Unilever. Institutional Equities. 1QFY19 Result Update
 1QFY19 Result Update Institutional Equities Hindustan Unilever 17 July 218 Reuters: HLL.BO; Bloomberg: HUVR IN Breakout Growth Hindustan Unilever (HUVR) has delivered strong volume led top-line growth
Hindustan Unilever HLL.NS HUVR IN
 Hindustan Unilever HLL.NS HUVR IN EQUITY: GENERAL CONSUMER Buy for urban demand revival Upgrade to Buy on account of premiumising portfolio and improving margins Action: Business transformation under way,
PRESS RELEASE. Mumbai, January 27, 2016: Godrej Consumer Products Limited (GCPL), a leading
, a leading") PRESS RELEASE 3Q FY 2016 results GCPL delivers a net profit growth of 23% on an organic constant currency net sales growth of 9%. Mumbai, January 27, 2016: Godrej Consumer Products Limited (GCPL), a leading
PRESS RELEASE 3Q FY 2016 results GCPL delivers a net profit growth of 23% on an organic constant currency net sales growth of 9%. Mumbai, January 27, 2016: Godrej Consumer Products Limited (GCPL), a leading
Investor Communication. Quarter and Half Year ended 30 th September, 2016
 Investor Communication Quarter and Half Year ended 30 th September, 2016 October 26, 2016 Demand Slowdown : Underlying Factors 10 Index of Industrial Production 0 4 Sources of income have been affected
Unilever Q Trading Statement Paul Polman / Jean-Marc Huët October 24 th 2013
 Unilever Q3 2013 Trading Statement Paul Polman / Jean-Marc Huët October 24 th 2013 SAFE HARBOUR STATEMENT This announcement may contain forward-looking statements, including forward-looking statements
UNILEVER TRADING STATEMENT THIRD QUARTER 2017 EMERGING MARKETS DRIVING GROWTH IN THE THIRD QUARTER
 Trading Statement 3rd Quarter 2017 Released : 19/10/2017 07:00 RNS Number : 0130U Unilever PLC 19 October 2017 UNILEVER TRADING STATEMENT THIRD QUARTER 2017 EMERGING MARKETS DRIVING GROWTH IN THE THIRD
Pioneers of laminated tubes in India. Corporate Presentation
 Pioneers of laminated tubes in India Corporate Presentation M17617 Safe Harbour Certain statements in this presentation concerning our future growth prospects are forward-looking statements. The Company
Kao Corporation News Release July 24, 2006
 Summary of Consolidated Business Results for the First Quarter Ended June 30, 2006 Tokyo, July 24, 2006 today announced its consolidated business results for the three months ended June 30, 2006, the first
AGENDA. Result of AGMS & EGMS Unilever Indonesia Performance. USLP 2015 Update. Winning with Consumers in Key Moments
 AGENDA 1 Result of AGMS & EGMS 2016 2 Unilever Indonesia Performance 3 USLP 2015 Update 4 Winning with Consumers in Key Moments AGMS & EGMS 2016 OUTCOMES RESULT OF ANNUAL GENERAL MEETING OF SHAREHOLDERS
PRESS RELEASE. de-stocking; consolidated net profit without exceptional items is INR 230 crore
 PRESS RELEASE 1Q FY2018 results India business delivers 6% sales growth despite GST driven de-stocking; consolidated net profit without exceptional items is INR 230 crore Mumbai, July 31, 2017: Godrej
AMOREPACIFIC GROUP 2Q 2014 Earnings Release
 IR AMOREPACIFIC GROUP 2Q 2014 Earnings Release 1 1H 2014 Earnings Summary 2 2Q 2014 Earnings Summary 3 Earnings by Subsidiary 4 Financial Summary As a note, it is suggested to use this material only as
GODREJ CONSUMER PRODUCTS LIMITED 1Q FY2016 PERFORMANCE UPDATE
 GODREJ CONSUMER PRODUCTS LIMITED 1Q FY2016 PERFORMANCE UPDATE July 29, 2015 PERFORMANCE UPDATE EXECUTIVE SUMMARY : MAJOR HIGHLIGHTS BUSINESS OVERVIEW : INDIA BUSINESS OVERVIEW : INTERNATIONAL OVERALL 1Q
Hindustan Unilever Ltd (HUVR IN) Recovery to be protracted
 Recovery to be protracted") INSTITUTIONAL EQUITY RESEARCH Hindustan Unilever Ltd (HUVR IN) Recovery to be protracted INDIA FMCG Company Update Key highlights of HUL s FY15 annual report and management commentary: Demand environment
INSTITUTIONAL EQUITY RESEARCH Hindustan Unilever Ltd (HUVR IN) Recovery to be protracted INDIA FMCG Company Update Key highlights of HUL s FY15 annual report and management commentary: Demand environment
GODREJ CONSUMER PRODUCTS INVESTOR PRESENTATION JUNE 2013
 GODREJ CONSUMER PRODUCTS INVESTOR PRESENTATION JUNE 2013 GODREJ CONSUMER PRODUCTS SNAPSHOT strong positions in core categories largest home grown HPC company US $1.2 billion in sales in FY 13 home care
FIRST QUARTER RESULTS million First Quarter 2006 Current rates. Turnover ahead by 8.6%, benefiting from 6.3% favourable currency movement.
 Unilever on-track to meet objectives for 2006. FINANCIAL HIGHLIGHTS FIRST QUARTER RESULTS 2006 million First Quarter 2006 Current rates Current rates Constant rates Continuing operations: Turnover 9 535
Performance Update - 3Q FY18 January 30, 2018
 Performance Update - 3Q FY18 January 30, 2018 PERFORMANCE UPDATE 1 Executive Summary - Key Highlights 2 Business Overview - India 3 Business Overview - International 2 I GCPL I Performance Update 3Q FY18
Unilever Roadshow. Q2 and First Half 2005 Results
 Unilever Roadshow Q2 and First Half 2005 Results Handout Version This presentation may contain forward-looking statements, including forward-looking statements within the meaning of the United States Private
UNILEVER TRADING STATEMENT THIRD QUARTER 2017 EMERGING MARKETS DRIVING GROWTH IN THE THIRD QUARTER
 UNILEVER TRADING STATEMENT THIRD QUARTER 2017 EMERGING MARKETS DRIVING GROWTH IN THE THIRD QUARTER Performance highlights Underlying performance GAAP measures vs 2016 vs 2016 Nine months Underlying sales
Hindustan Lever Limited Economy
 Hindustan Lever Limited February 2002 1 the company 2 H i n d u s t a n L e v e r...leadin consumer products company Financials - Turnover Net Profit EPS (Re 1) Rs110 bln Rs16 bln Rs7.46 Market Capitalisation
2010 FIRST QUARTER RESULTS STRONG MOMENTUM: VOLUME GROWTH ACCELERATES TO 7.6%
 2010 FIRST QUARTER RESULTS STRONG MOMENTUM: VOLUME GROWTH ACCELERATES TO 7.6% First Quarter highlights Underlying volume growth 7.6%. Underlying sales growth also accelerated to 4.1%. Underlying price
PRESS RELEASE. Mumbai, January 30, 2017: Godrej Consumer Products Limited (GCPL), a leading
, a leading") PRESS RELEASE 3Q FY2017 results GCPL delivers sales growth of 8% and EBITDA growth of 14% Mumbai, January 30, 2017: Godrej Consumer Products Limited (GCPL), a leading emerging markets FMCG company, today
PRESS RELEASE 3Q FY2017 results GCPL delivers sales growth of 8% and EBITDA growth of 14% Mumbai, January 30, 2017: Godrej Consumer Products Limited (GCPL), a leading emerging markets FMCG company, today
Business snapshot. ~50% of revenues comes from international businesses. Leading market share in home care, hair care and personal care
 May 24, 2016 Business snapshot Emerging markets FMCG leader Excellent track record of value creation among FMCG companies in India Growing presence in Asia, Africa and Latin America $ Leading market share
UNILEVER PAKISTAN LIMITED COMPANY INFORMATION
 UNILEVER PAKISTAN LIMITED COMPANY INFORMATION BOARD OF DIRECTORS Mr. Ehsan A. Malik Mr. Imran Husain Mr. M. Qaysar Alam Ms. Shazia Syed Mr. Amir R. Paracha Mr. Zaffar A. Khan Mr. Khalid Rafi Chairman &
Dabur India Limited. Investor Communication. Quarter and Half Year ended September 30, 2014
 Dabur India Limited Investor Communication Quarter and Half Year ended September 30, 2014 November 3, 2014 Performance Overview : Q2 FY2014-15 Consolidated Sales Consolidated EBITDA EBITDA Margins Consolidated
NAVIGATING THE NEW WORLD
 NAVIGATING THE NEW WORLD ANNUAL INVESTOR MEET 04 HARISH MANWANI AGENDA Unilever Journey Stepping up Performance Winning in Developing & Emerging Markets Over the last 5 years - A very different company
Consolidated Financial Results for the Six Months Ended June 30, 2017 [IFRS]
![Consolidated Financial Results for the Six Months Ended June 30, 2017 [IFRS]](/thumbs/82/85721626.jpg "Consolidated Financial Results for the Six Months Ended June 30, 2017 [IFRS]") Consolidated Financial Results for the Six Months Ended June 30, 2017 [IFRS] July 27, 2017 Company name: Kao Corporation Tokyo Stock Exchange in Japan Stock code: 4452 (URL: http://www.kao.com/jp/en/corp_ir/investors.html)
Consolidated Financial Results for the Six Months Ended June 30, 2017 [IFRS] July 27, 2017 Company name: Kao Corporation Tokyo Stock Exchange in Japan Stock code: 4452 (URL: http://www.kao.com/jp/en/corp_ir/investors.html)
Hindustan Unilever. Institutional Equities. 2QFY19 Result Update
 2QFY19 Result Update Institutional Equities Hindustan Unilever 15 October 2018 Reuters: HLL.BO; Bloomberg: HUVR IN Best Proxy In A VUCA World Hindustan Unilever s (HUVR) overall performance in 2QFY19 was
Hindustan Unilever Limited Annual Report & Accounts 07
 078_2724_HLL_Annual Repot_Cover Monday, March 03, 2008 8:33:10 PM Our journey began 75 years ago, in 1933, when the Company, was first incorporated. Today, Hindustan Unilever Limited is a pre-eminent
Unilever. Q2 and First Half 2007 Results. Agenda business performance. Accelerating change. Patrick Cescau Group Chief Executive
 Unilever Q2 and First Half 2007 Results Patrick Cescau Group Chief Executive John Rothenberg SVP Investor Relations 2 nd August 2007 Agenda 2007 business performance First half and second quarter results
Hindustan Unilever Ltd (HUVR IN) Gross margin pressure managed well
 Gross margin pressure managed well") INSTITUTIONAL EQUITY RESEARCH Hindustan Unilever Ltd (HUVR IN) Gross margin pressure managed well INDIA FMCG Quarterly Update Top takeaways from Q2FY19 HUL saw its fourth consecutive quarter of double
INSTITUTIONAL EQUITY RESEARCH Hindustan Unilever Ltd (HUVR IN) Gross margin pressure managed well INDIA FMCG Quarterly Update Top takeaways from Q2FY19 HUL saw its fourth consecutive quarter of double
2017 FULL YEAR RESULTS GOOD ALL-ROUND PERFORMANCE WITH ACCELERATED VALUE CREATION
 2017 FULL YEAR RESULTS GOOD ALL-ROUND PERFORMANCE WITH ACCELERATED VALUE CREATION Performance highlights (unaudited) Full Year Underlying performance GAAP measures vs 2016 vs 2016 Underlying sales growth
Consolidated Financial Results for the Three Months Ended March 31, 2019 [IFRS]
![Consolidated Financial Results for the Three Months Ended March 31, 2019 [IFRS]](/thumbs/96/129254274.jpg "Consolidated Financial Results for the Three Months Ended March 31, 2019 [IFRS]") Consolidated Financial Results for the [IFRS] April 24, 2019 Company name: Kao Corporation Tokyo Stock Exchange in Japan Stock code: 4452 (URL: www.kao.com/global/en/investor-relations/library/results/)
Consolidated Financial Results for the [IFRS] April 24, 2019 Company name: Kao Corporation Tokyo Stock Exchange in Japan Stock code: 4452 (URL: www.kao.com/global/en/investor-relations/library/results/)
Unilever Investor Event Graeme Pitkethly, CFO Singapore, 2 nd December 2015
 Unilever Investor Event Graeme Pitkethly, CFO Singapore, 2 nd December 2015 Agenda 1 First principles of our business model 2 Creating value through our portfolio 3 Getting to the next level on costs 4
Colgate-Palmolive Company Third Quarter 2016 Earnings Release Prepared Remarks Thursday, October 27, 2016
 This commentary, the remarks made during our third quarter 2016 earnings release conference call and our third quarter 2016 earnings press release filed with the SEC are integrally related and are intended
ITC. Buy. Rs169. 3QFY11 Results Update 19,008 5,697
 Results Update SECTOR: FMCG BSE SENSEX S&P CNX 19,8 5,697 Bloomberg ITC IN Equity Shares (m) 7,75.9 52-Week Range (Rs) 185/112 1,6,12 Rel. Perf. (%) 6/9/3 M.Cap. (Rs b) 1,31.5 M.Cap. (US$ b) 29.3 Rs169
Business snapshot. 48% of revenue comes from international businesses. Leading market share in home care, hair care and personal care
 May 26, 2017 Business snapshot Emerging markets FMCG leader Excellent track record of value creation among FMCG companies in India Growing presence in Asia, Africa and Latin America Leading market share