Interim Results Ralph Findlay, Chief Executive Officer Andrew Andrea, Chief Financial and Corporate Development Officer
|
|
|
- Shawn Terry
- 5 years ago
- Views:
Transcription


1 Interim Results 2018 Ralph Findlay, Chief Executive Officer Andrew Andrea, Chief Financial and Corporate Development Officer

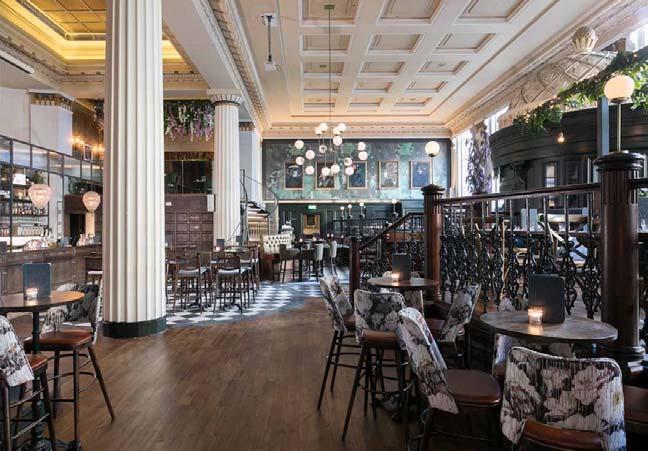
2 Ralph Findlay Chief Executive Officer The Leeds Club
3 Marston s PLC Interim Results HIGHLIGHTS 1. Continued progress in 2018 Turnover up 20% to 528m PBT growth of 8%, EPS in line reflecting share issuance Dividend maintained at 2.7 pence per share Proforma leverage down and fixed charge cover maintained 2. Pub profit growth in challenging market Like-for-like sales unchanged in managed and franchised pubs Wet-led pubs growth. Destination impacted by weather Profit per pub +1% Six pubs and bars and six lodges opened 3. Brewing in growth Growth from underlying business and CWBB Market share gains in on and off-trade 4. Anticipate full-year growth in revenue and PBT 15 pubs and bars and 6 lodges Annualisation of CWBB benefit Strong results despite poor weather in H1
4 Marston s PLC Interim Results CLEAR STRATEGY AND GROWTH PLANS, VALUABLE ASSETS Clear strategy Good track record Valuable assets, secure financing Clear growth plans Pubs Organic growth Broad sector representation No significant tail Increasing profit per pub Like-for-like sales Margin control Growing beer market share 2.2bn estate value 93% freehold 59% LTV NAV 142p 2018 Proforma CWBB New pub openings New lodges Brewing Market leader in premium ale Licensed portfolio - lager -craft Leading service business Creating value CROCCE > WACC Attractive dividend payout Secure financing Long-term structure Bank facility to 2023 Fixed Charge Cover 2.6x Beyond 2018 New-build pipeline Beer Co opportunities Consistent strategy underpinned by strong asset base

5 Marston s PLC Interim Results MARKET DYNAMICS Consumer outlook Sector supply Economic, Political Leisure spend anticipated to grow Eating out vs drinking out Signs of consumer caution Consumer experience is key Slowdown in opening rates Some closures in casual dining Freehold opportunities outside hotspots Increased opportunity alongside residential development Regulatory and tax cost increases likely Limited direct interest rate exposure No material Brexit impact anticipated Growing importance of health agenda Dynamics remain unchanged challenging but opportunities for growth
6 Marston s PLC Interim Results PUB SEGMENTATION 2018 Operating profit m No. of pubs Average no. of pubs Average profit per pub vs LY% Destination and Premium Taverns Leased Total ,564 1, Profit Mix 2018 H1 Profit Mix 17% 16% 36% 51% 33% Average MAT profit per pub 47% 73k +52% 111k Destination and Premium Taverns Leased High quality and balanced portfolio delivering long-term profit growth


7 Marston s PLC Interim Results DESTINATION: OFFERING VALUE FOR EXPERIENCE Pub values A place to socialise and dine Focus on drinks category management Traditional pub food Entertainment, live music Premiumisation Design, ambience Premium brands Menu development Service Flexibility Firebrand development EPOS investment Customer experience Moving customer focus away from price to experience

8 Marston s PLC Interim Results ACCOMMODATION- PUB & LODGE INCREASINGLY ATTRACTIVE Stand-alone rationale Good locations, strong demand Business/leisure mix Opportunity alongside great pubs Stand-alone ROC strong Access wider leisure market Pub benefits Additional reason to visit Incremental income stream for pub Smoother trading patterns 2018: strong performance MAT RevPAR up 3% Six lodges opened including Ebbsfleet 100+ rooms C.1,500 rooms Future: 5-10 lodges p.a. New-build sites Existing pub opportunities Integrated pub-lodge building under design Strong rooms performance supports expansion strategy


9 EBBSFLEET OUR FIRST 100+ ROOM LODGE


10 Marston s PLC Interim Results PREMIUM GROWTH OPPORTUNITIES Great pubs and bars, beautiful buildings
11 Marston s PLC Interim Results CHANGES TO CAPITAL ALLOCATION plans remain unchanged 15 pub-restaurants and bars 6 lodges plans moderate reduction in expansion Reflects caution on consumer backdrop 10 pubs and bars and 5 lodges Land bank pipeline pace being maintained 25m reduction in spend vs New openings remain key driver of earnings growth 3. Increased investment in conversions in 2019 and 2020 Conversion from Two-for-One C.50 conversions per annum 5m additional spend allocated for 2019/20 Appropriate capital spend; no compromise to returns


12 Marston s PLC Interim Results MARSTON S BEER CO UK NO.1 PREMIUM ALE BREWER Local beer, national scale, premium focus Award winning beers and marketing Sector leaders 12,000 distribution points c.90% external sales c.75% premium brands Hobgoblin Gold, gold medal at World Beers Awards Wainwright MA top cask brand to stock Hobgoblin Digital and Social Media Company of the Year PRCA Dove Awards Best Ale Supplier MA Wychwood Trip Advisor Best Brewery Tour Ringwood Visit England Hidden Gem Award Premium packaged ale 24% Premium cask ale 23% Represented in growth segments Premium strategy demonstrating continued growth and market leadership


13 MARSTON S BEER CO LICENSED AND EXPORT Marston s PLC Interim Results Licensed Export Estrella Damm Mediterranean lager 19 brands sold in 55 countries 8% of external volumes US Craft Shipyard 40% MAT growth Founders Cider Kingstone Press World Beer Warsteiner Erdinger Kirin Kaltenberg Key target regions: Canada US France Russia Future opportunities South America Growth opportunities in new segments and new markets

14 Marston s PLC Interim Results MARSTON S BEER CO BEST IN CLASS INDUSTRY SERVICE BREWING PACKAGING LOGISTICS 1.4 million brls capacity Scale lager brewing 73% utilised Marston s, Banks s and Eagle Breweries >BRC A Soil Association Organic accreditation Bottling and canning Burton Centre of Excellence 8m new canning line 42% of UK PBA 13 depots in E & W Distribution contracts: Punch B, Hawthorn, Brakspear Further opportunity Further opportunity Further opportunity Profit opportunities from supply chain expertise

15 Andrew Andrea Chief Financial and Corporate Development Officer Lost & Found, Leeds
16 Marston s PLC Interim Results FINANCIAL SUMMARY 2018 YOY Revenue 528m EBITDA 95m Operating profit 74m PBT 36m 20% Growth in all trading divisions 5% Growth in all trading divisions 5% 8% EPS 4.8 pence In-line Reflects equity issuance in May 2017 Dividend 2.7 pence Unchanged Solid PBT growth; dividend unchanged
17 Marston s PLC Interim Results MANAGED AND FRANCHISE LIKE-FOR-LIKE PERFORMANCE YOY margin % (0.4) +0.2 (0.7) (0.2) Weather impact (0.2) H1 Destination and Premium Managed and Franchised Taverns Total Robust long-term LFL sales performance, disciplined approach to margins

18 Marston s PLC Interim Results BEER COMPANY Turnover 169m +79% Core business in growth CWBB strong Estrella Damm growth Distribution contracts Punch, Hawthorn, Brakspear Operating profit 13m +29% Strong underlying performance CWBB synergies on track at least 4m Operating margin -3% CWBB customer and product mix Distribution contracts Expect improvement in H2 Strong performance, CWBB on track
19 Marston s PLC Interim Results COST GUIDANCE Drink Food Brewing raw materials Energy inflation Labour cost inflation - National Minimum Wage - National Living Wage Apprenticeship levy, NEST Rates Rent 2018 c.2% c.2% c.2% c.3% c.4% + 1.0m c.4% + 1.5m c.85% fixed for 2018 c.80% contracted to 2020 c.70% fixed for 2018 c.50% contracted to 2020 Fixed for 2018 c.85% commodity contracted to 2019/20 Increased electricity levies in 2019 No change to operating cost outlook for Similar inflationary profile for 2019
20 Marston s PLC Interim Results CASH FLOW SUMMARY Operating cash flow Net interest Pre-investment FCF Organic capex Disposals Dividend FCF pre new-build and acquisitions New-build and acquisitions Net underlying cashflow 2018 m 2017 m Profit growth H2 working capital opportunity (43) (43) (46) (39) Full year c. 80m; 2019 c. 80m (30) (27) (30) (15) Full year 45-50m; 2019 c. 30m (37) (40) Full year c. 75m; 2019 c. 50m (67) (55) Stronger operating cash flow, capex guidance unchanged, expect strong H2 cashflow
21 Marston s PLC Interim Results FINANCE STRUCTURE 2017 m 2018 m Illustrative 2018 (all new-build leasehold) m Securitised (amortisation profile to 2035) Bank ( 320m facility to 2023) Debt excluding property leasing 1,061 1,059 1,059 Property leasing (35-40 year financing) Total Debt 1,322 1,393 1,059 Leverage excluding property leasing* 5.0x 4.8x 4.8x Leverage including property leasing* 6.2x 6.3x 4.8x Fixed charge cover 2.6x 2.6x 2.6x Loan to value 59% 59% 52% EBITDA outside securitisation c.46% c.46% c.46% Freehold mix 94% 93% 86% * Proforma EBITDA to account for annualisation of CWBB profits Property backed finance funding estate expansion

22 Marston s PLC Interim Results ESTATE VALUATION AND PENSION 1. Estate value broadly in line at 2.2bn Impairment of 32m - 40m recognised in P&L offset by increase in revaluation reserve Upsides from new-builds and franchised pubs Reduced values for value end of Destination 2. September 2017 triennial pension valuation concluded Deficit reduced to 40m from 50m in 2014 Contributions maintained can be ceased when deficit is cleared Current target to clear deficit by 2021/22 assuming no gilt yield benefit NAV of 1.42 underpinned by strong asset values and limited pension exposure
23 Marston s PLC Interim Results SUMMARY 1. Solid H1 performance Revenue growth across all segments despite poor weather PBT growth underpins maintained dividend CWBB performance on target 15 new-builds and 6 lodges in current financial year 2. NAV 142p per share Estate valuation confirms 2.2bn asset value 93% freehold Improved pension deficit target to clear by 2021/22 3. Modest changes to 2019 capital allocation Reduced new build spend opening 10 pubs and bars and five lodges Redirect 5m capex into existing estate conversions 4. Clear and consistent strategy 5. Revenue and PBT growth anticipated for full year Strong business well placed for future growth

24 Appendices
25 Marston s PLC Interim Results FINANCIAL SUMMARY STATUTORY BASIS Revenue 529m 452m Operating profit 29m 72m PBT (13)m 37m EPS (2.0) pence 5.2 pence
26 Marston s PLC Interim Results SEGMENTAL PROFIT 2018 m 2017 m YOY % Turnover Destination & Premium % Taverns % Leased % Beer Division % Total % EBITDA Destination & Premium % Taverns % Leased % Beer Division % Group Services (10.2) (10.1) (1.0)% Total % EBIT Destination & Premium % Taverns % Leased % Beer Division % Group Services (12.3) (12.0) (2.5)% Total % Margin % Destination & Premium 16.4% 17.1% (0.7)% Taverns 20.2% 20.4% (0.2)% Leased 52.6% 53.9% (1.3)% Beer Division 7.9% 11.0% (3.1)% Total 14.1% 16.1% (2.0)% Finance costs (38.0) (37.3) (1.9)% Profit before tax %
27 Marston s PLC Interim Results PUB NUMBERS Destination and Premium Taverns Leased Total 2017 Closing ,568 New-build additions/acquisitions Transfers - 4 (4) - Disposals (1) (4) (5) (10) H Closing , average numbers , average numbers ,566
28 Marston s PLC Interim Results HISTORICAL LFL Destination and Premium Taverns Total Total Total Total 52 wks to 04/10/14 3.1% 2.1% 2.8% 52 wks to 03/10/15 1.8% 2.0% 1.9% 16 wks to 23/01/16 3.0% 2.7% 26 wks to 02/04/16 3.0% 3.0% 16 wks to 23/07/16 1.8% 2.5% 42 wks to 23/07/16 2.5% 2.8% 10 wks to 01/10/16 1.8% 2.0% 52 wks to 01/10/16 2.3% 2.7% 2.4% 16 wks to 21/01/17 1.5% 1.5% 26 wks to 01/04/17 1.1% 1.1% 1.1% 30 wks to 29/04/17 1.6% 1.7% 12 wks to 22/07/17 0.6% 2.1% 42 wks to 22/07/17 1.3% 1.9% 10 wks to 30/09/17 (0.8%) 0.3% 52 wks to 30/09/17 0.9% 1.6% 1.1% 16 wks to 20/01/18 (0.9%) 2.6% 0.4% 26 wks to 31/03/18 (1.8%) 2.9% -
29 Marston s PLC Interim Results CAPEX, TAX AND SHARE CAPITAL Actual 2017 Forecast 2018 Forecast 2019 New-build capex c. 75m 50m Organic capex c. 80m 80m Total c. 155m 130m Disposals 45-50m 30m Net capex c 110m 100m Tax rate 15.6% c17% Average number of shares in m Shares in issue at 31 March m Additional dilutive number of shares 7.6m
30 Marston s PLC Interim Results SECURITISED DEBT PROFILE Tranche Type Principal outstanding at 31 March 2018 Step-up date Final maturity date A1 Floating 50.2m July A2 Fixed/Floating 214.0m July A3 Fixed/Floating 200.0m April A4 Floating 177.2m October B Fixed/Floating 155.0m July Total 796.4m
31 Marston s PLC Interim Results SECURITISATION PROFILE Max Debt Service m Interest A2, B step- A3 step-up Principal '17 '18 '19 '20 '21 '22 '23 '24 '25 '26 '27 '28 '29 '30 '31 '32 '33 '34 '35 Financial year FY2017 FY2018 FY2019 FY2020 FY2021 FY2022 FY2023 FY2024 FY2025 FY2026 FY2027 FY2028 FY2029 FY2030 FY2031 FY2032 FY2033 FY2034 FY2035 Principal m Interest m Debt Service m
32 Marston s PLC Interim Results CROCCE CROCCE FY2017** FY2016 FY2015 FY2014 FY2013* FY2012 NON-CURRENT ASSETS: Bal Depn Reval Adj Bal Depn Reval Adj Bal Depn Reval Adj Adj Adj Adj Goodwill Other intangible assets Property, plant and equipment 2, (624.2) 1, , (623.1) 1, , (616.0) 1, , , ,653.3 Other non-current assets CURRENT ASSETS: Inventories Assets held for sale Trade and other receivables LIABILITIES: Creditors*** (286.9) (286.9) (234.3) (234.3) (228.5) (228.5) (199.0) (188.4) (175.2) CASH CAPITAL EMPLOYED 2, (624.2) 2, , (623.1) 1, , (616.0) 1, , , ,869.2 Weighted average 2,001.9 EBITDA CROCCE 10.7% 10.9% 10.8% 10.5% 10.5% 10.6% *2013 adjusted to exclude 53 rd trading week ** 2017 calculated on average net assets to reflect significant acquisition activity during the second half year *** Creditors comprise trade and other payables, other non-current liabilities and provisions for other liabilities and charges
33
Preliminary Results 2018
 Preliminary Results 2018 Ralph Findlay, Chief Executive Officer Andrew Andrea, Chief Financial Officer Fisherman s Cot, Tiverton Marston s PLC Preliminary results 2018 2 INTRODUCTION 1. Record revenue
Preliminary Results 2014
 Preliminary Results 2014 Ralph Findlay Chief Executive Officer Andrew Andrea Chief Financial Officer 1 Ralph Findlay Chief Executive Officer Highlights 1. Solid Trading Performance Core PBT growth of 12%
Interim Results 2014
 Interim Results 2014 Ralph Findlay Chief Executive Officer Highlights 1. Good trading performance, in line with our expectations Growth in core profits in each trading segment Earnings per share up 10.8%
Preliminary Results 2012
 Preliminary Results 2012 Highlights Resilient performance with growth in all segments Strategy appropriate for continuing economic uncertainty High quality pubs underlined by estate valuation New-build
Interim Results 2010
 Interim Results 2010 David Thompson Chairman Highlights 1. H1 performance in line with targets Revenue growth, margins broadly level 2. Good progress in strategy development New-build programme on track
MARSTON S PLC INTERIM RESULTS FOR THE 26 WEEKS ENDED 31 MARCH 2018
 16 May MARSTON S PLC INTERIM RESULTS FOR THE 26 WEEKS ENDED 31 MARCH Strong revenue and underlying PBT growth, dividend maintained, asset value underpinned Revenue and underlying PBT growth with underlying
30 November 2017 MARSTON S PLC PRELIMINARY RESULTS FOR THE 52 WEEKS ENDED 30 SEPTEMBER 2017
 30 November 2017 MARSTON S PLC PRELIMINARY RESULTS FOR THE 52 WEEKS ENDED 30 SEPTEMBER 2017 A high quality pub and beer business continuing to deliver growth Revenue and earnings growth Underlying Statutory
MARSTON S PLC INTERIM RESULTS FOR THE 26 WEEKS ENDED 2 APRIL 2011
 MARSTON S PLC 19 May 2011 INTERIM RESULTS FOR THE 26 WEEKS ENDED 2 APRIL 2011 FINANCIAL HIGHLIGHTS Group revenue up 2.8% to 317.9 million (2010: 309.2 million) Underlying profit before tax up 5.0% to 29.2
MARSTON S PLC INTERIM RESULTS FOR 26 WEEKS ENDED 1 APRIL A high quality pub and beer business continuing to deliver growth
 18 May MARSTON S PLC INTERIM RESULTS FOR 26 WEEKS ENDED 1 APRIL A high quality pub and beer business continuing to deliver growth Revenue and earnings growth despite late Easter Underlying Statutory Revenue
Increased interim dividend reflects full year confidence
 MARSTON S PLC 16 May 2013 INTERIM RESULTS FOR THE 26 WEEKS ENDED 30 MARCH 2013 Increased interim dividend reflects full year confidence FINANCIAL HIGHLIGHTS Group revenue - 358.1 million (: 342.1 million).
26 November 2015 MARSTON S PLC PRELIMINARY RESULTS FOR THE 52 WEEKS ENDED 3 OCTOBER 2015
 26 November 2015 MARSTON S PLC PRELIMINARY RESULTS FOR THE 52 WEEKS ENDED 3 OCTOBER 2015 A high quality pub and beer business delivering strong profit and returns growth Strong trading performance: - Underlying
MARSTON S PLC INTERIM RESULTS FOR THE 26 WEEKS ENDED 2 APRIL Profit and cash flow growth from high quality pub and beer business
 MARSTON S PLC INTERIM RESULTS FOR THE 26 WEEKS ENDED 2 APRIL 18 May Profit and cash flow growth from high quality pub and beer business Strong trading performance: - Underlying Group revenue up 11.5% to
REVENUE AND EARNINGS GROWTH SUPPORT INCREASE IN DIVIDEND
 MARSTON S PLC 14 th May INTERIM RESULTS FOR THE 26 WEEKS ENDED 4 APRIL REVENUE AND EARNINGS GROWTH SUPPORT INCREASE IN DIVIDEND FINANCIAL HIGHLIGHTS Underlying Group revenue up 3% to 384.5 million Underlying
Roger Carr. Chairman. March
 Roger Carr Chairman March 2003 1 Agenda Introduction Roger Carr (Chairman) Financial Results Karim Naffah (FD) Actions and Priorities Tim Clarke (CEO) Q&A 2 Business Highlights Independent future with
Fuller, Smith and Turner PLC Preliminary Results for the 52 weeks ended 29 March 2008
 Fuller, Smith and Turner PLC Preliminary Results for the 52 weeks ended 29 March 2008 Agenda Strategy Corporate Progress Key Financials Fuller s Inns The Fuller s Beer Company Prospects Consistent Strategy
GROWTH IN REVENUE AND EARNINGS SUPPORTS INCREASE IN DIVIDEND
 MARSTON S PLC 15 th May 2014 INTERIM RESULTS FOR THE 26 WEEKS ENDED 5 APRIL 2014 GROWTH IN REVENUE AND EARNINGS SUPPORTS INCREASE IN DIVIDEND FINANCIAL HIGHLIGHTS Underlying Group revenue up 4.5% to 374.3
Roger Carr. Chairman. 19 May 2004
 Roger Carr Chairman 19 May 2004 Karim Naffah Finance Director 19 May 2004 Financial Highlights Turnover 823m up 4% EBITDA 197m up 3% Operating profit 140m up 2% Profit before tax 88m down 5% Adjusted EPS*
On-premise establishments: how the economic backdrop and new economic policies are affecting the trade of local premises.
 On-premise establishments: how the economic backdrop and new economic policies are affecting the trade of local premises. The UK pub sector: Survival of the Fittest David Thompson Chairman Marston s PLC
RESULTS For the year ended 30 September 2011
 RESULTS For the year ended 30 September 2011 AGENDA Highlights Patrick Coveney, CEO Financial Review Alan Williams, CFO Operating Review & Strategy Patrick Coveney, CEO Outlook Patrick Coveney, CEO Q &
Full Year Results 2016
 Full Year Results 2016 1 Financial Review 2016 Tim Jones Finance Director 2 Income statement (Pre adjusted items) FY 2016 m FY 2015 m Revenue 2,086 2,101 (0.7%) Operating costs (1,768) (1,773) Operating
Marston's PLC INTERIM RESULTS FOR THE 26 WEEKS ENDED 29 MARCH 2008
 Marston s PLC 23 May 2008 INTERIM RESULTS FOR THE 26 WEEKS ENDED 29 MARCH 2008 Underlying* earnings per share unchanged at 10.0p (2007: 10.0p) basic earnings per share of 8.9p (2007: 9.3p) Interim dividend
Full Year Results Bob Ivell Chairman
 Full Year Results 2015 Bob Ivell Chairman Financial Review 2015 Tim Jones Finance Director Income statement (Pre-exceptional items) FY 2015 m FY 2014 m Revenue 2,101 1,970 +6.6% Operating costs (1,773)
JD WETHERSPOON PLC. Preliminary Results September 2009
 JD WETHERSPOON PLC Preliminary Results 2009 11 September 2009 Highlights Year to 26 July 2009 Revenue 955.1m (2008: 907.5m) +5.2% Like-for-like sales +1.2% Operating profit before exceptional items 97.0m
JD WETHERSPOON PLC. Preliminary Results September 2008
 JD WETHERSPOON PLC Preliminary Results 2008 5 September 2008 Highlights Year to 27 July 2008 Revenue up 2.1% to 907.5m (LFL -1.1%) Operating profit down 4.3% to 87.2m Operating margin down 0.6% pts to
PRELIMINARY RESULTS PRESENTATION YEAR ENDED 31 DECEMBER 2017
 PRELIMINARY RESULTS PRESENTATION YEAR ENDED 31 DECEMBER 2017 DISCLAIMER The information contained in this presentation has not been independently verified and this presentation contains various forward-looking
INTERIM RESULTS FOR THE 26 WEEKS ENDED 3 APRIL Revenue and profit growth in a challenging market; progress in all three divisions
 MARSTON S PLC 20 May 2010 INTERIM RESULTS FOR THE 26 WEEKS ENDED 3 APRIL 2010 Revenue and profit growth in a challenging market; progress in all three divisions Group revenue up 0.6% to 309.2 million (2009:
Preliminary Results. 18 October 2016
 Preliminary Results 18 October 2016 Highlights Mark Cashmore Group Chief Executive Highlights Solid Group performance in line with expectations Total revenue 1,907m +1.7% Adjusted PBT 60.7m +7.4% Adjusted
INTERIM RESULTS PRESENTATION SIX MONTHS TO 30 JUNE 2018
 INTERIM RESULTS PRESENTATION SIX MONTHS TO 30 JUNE 2018 DISCLAIMER The information contained in this presentation has not been independently verified and this presentation contains various forward-looking
Interim Results FY18 28 th November 2017
 Interim Results FY18 28 th November 2017 Forward looking statements Forward-Looking Statements INCLUDED IN THIS PRESENTATION ARE FORWARD-LOOKING MANAGEMENT COMMENTS AND OTHER STATEMENTS THAT REFLECT MANAGEMENT
Investor Presentation November 2011
 Investor Presentation November 2011 For further information contact: aston.swift@intertek.com +44 (0)20 7396 3400 1 Cautionary statement regarding forward-looking statements This presentation contains
Interim Results. 31 March VISIT OUR WEBSITE
 Interim Results 31 March 2007 VISIT OUR WEBSITE www.enterpriseinns.com Financial highlights 6 months to 31 March 2007 Like for like EBITDA up 4.1% to 256m Adjusted earning per share up 15.7% to 18.4 pence
JD WETHERSPOON PLC. Preliminary Results September 2007
 JD WETHERSPOON PLC Preliminary Results 2007 7 September 2007 Highlights Year to 29 July 2007 Reported Excluding 53 Results week last year* Turnover 888.5m +5% +7% Operating profit 91.1m +9% +12% Profit
0 Preliminary Results December Preliminary Results December March 2011
 0 Preliminary Results December 2010 Preliminary Results December 2010 23 March 2011 Agenda Introduction 2010 Results International business Acquisition of Atomic PR Citigate Grayling Red Huntsworth Health
Investor Presentation September 2011
 Investor Presentation September 2011 For further information contact: 1 aston.swift@intertek.com sarah.ogilvie@intertek.com +44 (0)20 7396 3400 Cautionary statement regarding forward-looking statements
SIG plc 2015 Half Year results. 11 August 2015
 SIG plc 2015 Half Year results 11 August 2015 Highlights Group sales +3.1% in constant currency; +0.6% on LFL basis Improving trend in Mainland Europe; LFLs turned positive Q2 2015 UK & Ireland LFL sales
Interim Results March 2007
 Interim Results 2007 2 March 2007 Highlights Six Months to 28 January 2007 Turnover up 8% to 438.4m Operating profit up 17% to 46.3m Profit before tax up 20% to 32.9m Earnings per share up 37% to 14.5p
Lavendon Group plc European and Middle Eastern Market Leader for Powered Access Rental
 Lavendon Group plc European and Middle Eastern Market Leader for Powered Access Rental 2015 Full Year Results Presentation 25 February 2016 25 February 2016 2015 Full Year Results Agenda Overview Financial
Acquisition of Whitbread Pub Restaurants. July 2006
 Acquisition of Whitbread Pub Restaurants July 2006 Agenda Key features of transaction Financial and strategic rationale Assets acquired Brand conversion plans and profits uplifts Management integration
Carlsberg A/S. H interim results
 Carlsberg A/S H1 2016 interim results Agenda H1 highlights Financial results Region performance Appendix Good H1 performance +140bp Organic GPaL margin improvement -1% +8% Organic decline in pro rata volumes
2018 Full Year Results 20 November 2018
 2018 Full Year Results 20 November 2018 Disclaimer Certain information included in the following presentation is forward looking and involves risks, assumptions and uncertainties that could cause actual
Financial Review H Tim Jones Finance Director
 Half Year Results 2018 1 Financial Review H1 2018 Tim Jones Finance Director 2 Key messages Continued improvement and outperformance on sales Cost headwinds unchanged, with progress on mitigation Stabilisation
Interim Results: 31 March
 Interim Results: 31 March 2018 www.eigroupplc.com Introduction Robert Walker Chairman Overview Simon Townsend Chief Executive Officer Highlights Trading performance Pubs Average annualised net income per
Britvic plc Interim Results 2018
 Britvic plc Interim Results 2018 CEO SIMON LITHERLAND DELIVERING ON OUR STRATEGIC PRIORITIES AND VISION 2 OUR STRATEGY IS DELIVERING CONSISTENT RETURNS FOR SHAREHOLDERS GENERATE PROFITABLE GROWTH IN OUR
Continued Strong Momentum. Full year results June 2017
 Continued Strong Momentum Full year results 2017 14 June 2017 Agenda 1 Introduction & Overview: Ian Wakelin, CEO 2 Operating & Financial Review: Michael Topham, CFO 3 Strategy Execution & Conclusions:
Financial Results Presentation. For the 39 weeks ended 26 September 2018
 Financial Results Presentation For the 39 weeks ended 26 September 2018 Release: 20 November 2018 Disclaimer You must read the following before continuing This presentation has been prepared by Thame and
Preliminary Results FY17
 Preliminary Results FY17 25 th May 2017 Forward looking statements Forward-Looking Statements INCLUDED IN THIS PRESENTATION ARE FORWARD-LOOKING MANAGEMENT COMMENTS AND OTHER STATEMENTS THAT REFLECT MANAGEMENT
Acquisition of Whitbread Pub Restaurants. July 2006
 Acquisition of Whitbread Pub Restaurants July 2006 Roger Carr Chairman Tim Clarke Chief Executive Agenda Key features of transaction Financial and strategic rationale Assets acquired Brand conversion plans
Chief Financial Officer s Report Jonny Mason
 Chief Financial Officer s Report Jonny Mason Financial Resources Generating returns for our stakeholders through effective management of our financial resources. Group revenue in, at 1,135.1m, was up 3.7%
9 May Half Year Results
 9 May 2018 2018 Half Year Results Disclaimer Certain information included in the following presentation is forward looking and involves risks, assumptions and uncertainties that could cause actual results
2017 Full Year Results Strong financial performance Investing for the future. 26 January 2018
 Strong financial performance Investing for the future 26 January 2018 Gilles Andrier Chief Executive Officer 26 January 2018 2 Performance highlights Sales of CHF 5.1 billion, up 4.9% on a like-for-like*
RESULTS UNDERPINNED BY TIGHT COST MANAGEMENT
 Financial review RESULTS UNDERPINNED BY TIGHT COST MANAGEMENT SEGMENTAL PERFORMANCE The financial statements for the period ended included 53 weeks. In the notes that follow, all comparative income statement
Wincanton plc. Results for the Half Year to 30 September 2013
 Wincanton plc Results for the Half Year to 30 September 2013 Certain statements in this presentation are forward-looking statements. Such statements are based on current expectations and by their nature
Domino s Pizza UK & IRL plc. Interim Results for the 26 weeks ended 28 June 2009
 Domino s Pizza UK & IRL plc Interim Results for the 26 weeks ended 28 June 2009 m System sales momentum 210 System sales have doubled since 2005 196.4 190 170.2 170 150 130 110 97.1 114.8 142.5 +24.1%
JD WETHERSPOON PLC. Preliminary Results September 2012 Kirk Davis FD John Hutson - CEO
 JD WETHERSPOON PLC Preliminary Results 2012 14 September 2012 Kirk Davis FD John Hutson - CEO Highlights Year to 29 July 2012 Excluding Week 53 Revenue 1,197.1m (2011: 1,072.0m) + 11.7% +9.3% Like-for-like
Mitie Group plc. The UK s leading Facilities Management business. Analyst Presentation H1 18/19 22 November 2018
 Mitie Group plc The UK s leading Facilities Management business Analyst Presentation H1 18/19 22 November 2018 Disclaimer This presentation may contain certain forward-looking statements, beliefs or opinions,
2014 Preliminary Results
 2014 Preliminary Results John Hutson CEO Kirk Davis FD The Port Jackson, Bishop s Stortford Kirk Davis FD 12 September 2014 The Admiral Collingwood, Ilfracombe Financial Summary 52 weeks to 27/07 2014
Comprehensive Plan to Enhance Shareholder Value. December 19, 2013
 Comprehensive Plan to Enhance Shareholder Value December 19, 2013 Forward-Looking Statements During the course of this presentation, Darden Restaurants officers and employees may make forward-looking statements
MITCHELLS & BUTLERS PLC LEI no JHYNDNB1NS2W10 FULL YEAR RESULTS. (For the 53 weeks ended 30 September 2017)
") MITCHELLS & BUTLERS PLC LEI no. 213800JHYNDNB1NS2W10 23 November 2017 FULL YEAR RESULTS (For the 53 weeks ended 30 September 2017) - Like-for-like sales growth maintained - Consistent sales outperformance
MITCHELLS & BUTLERS PLC LEI no. 213800JHYNDNB1NS2W10 23 November 2017 FULL YEAR RESULTS (For the 53 weeks ended 30 September 2017) - Like-for-like sales growth maintained - Consistent sales outperformance
2017 Full Year Results. Tuesday 21 November 2017
 2017 Full Year Results Tuesday 21 November 2017 Disclaimer Certain information included in the following presentation is forward looking and involves risks, assumptions and uncertainties that could cause
Annual Results 52 weeks ended 30 June 2018
 Contents 2 Headlines CEO Review FY18 Review FY19 Outlook Summary Headlines 3 First half finished strongly due to Christmas trading 18 consecutive quarters of like-for-like sales growth came to an end in
Financial results & business update. Quarter and year ended 31 December February 2016
 Financial results & business update Quarter and year ended 31 December 2015 11 February 2016 Disclaimer 3 Any remarks that we may make about future expectations, plans and prospects for the company constitute
Interim Results. 23 April 2014
 Interim Results 23 April 2014 The leading supply chain, trading and distribution partner in our chosen supply markets - delivering consistently strong returns to shareholders 2 Evolution of Smiths News
Britvic plc. Preliminary Results 2011
 Britvic plc Preliminary Results 2011 Gerald Corbett Chairman John Gibney Group Finance Director Agenda Financial performance John Gibney Britvic and the market review Paul Moody Group performance +14.6%
EABL F14 Full Year Results Media Briefing. 7 th August 2014
 EABL F14 Full Year Results Media Briefing 7 th August 2014 Outline of the Full Year Results Briefing F14 Full Year Review Charles Ireland Financial Performance Tracey Barnes Summary and Outlook Charles
Interim Results For 6 months ended 31 Dec February 2018
 Interim Results For 6 months ended 31 Dec 2017 February 2018 Financial highlights 62.5m 55.7m 71.7m 13.7m 10.8m 15.8m 8.8m 11.2m 12.9m 16 17 18 16 17 18 16 17 18 REVENUE 71.7m (H1 FY17: 62.5m) +14.7% YEAR-ON-YEAR
Vita Group (VTG)! Results Presentation!
! Results Presentation!") Vita Group (VTG) Results Presentation First half FY14 Group highlights Sustained trend of strong profit, dividend growth Underlying EBITDA 1 +18%, underlying NPAT 2 +56%, dividend +66% Areas of strategic
Vita Group (VTG) Results Presentation First half FY14 Group highlights Sustained trend of strong profit, dividend growth Underlying EBITDA 1 +18%, underlying NPAT 2 +56%, dividend +66% Areas of strategic
Group results 2014/15 (on a continuing operations basis) On a continuing operations basis 2014/15
 On a continuing operations basis 2014/15") Financial review The reported year has been both an extremely challenging year for Tesco and a year in which we began a process of considerable change. Against this backdrop we delivered sales of 70bn
Financial review The reported year has been both an extremely challenging year for Tesco and a year in which we began a process of considerable change. Against this backdrop we delivered sales of 70bn
THE WOLVERHAMPTON & DUDLEY BREWERIES, PLC PRELIMINARY RESULTS FOR THE 52 WEEKS ENDED 27 SEPTEMBER 2003
 3 December 2003 THE WOLVERHAMPTON & DUDLEY BREWERIES, PLC PRELIMINARY RESULTS FOR THE 52 WEEKS ENDED 27 SEPTEMBER 2003 Record underlying* earnings per share of 68.9p, up 10.1% (basic eps 53.0p, up 5.6%)
MAKING MARSTON S THE PLACE TO BE
 MAKING MARSTON S THE PLACE TO BE Marston s PLC Annual Report and Accounts A Snapshot of Revenue and earnings growth; proft growth in all trading segments. Proft before tax on a statutory basis 100.3 million.
FY2018 Half-Year Results. 26 October, 2017
 FY2018 Half-Year Results 26 October, 2017 Disclaimer This presentation has been prepared solely in connection with the financial results of C&C Group plc (the "Company") for the period ended 31 August,
Shaping our future. René Hooft Graafland. Member of the Executive Board/ CFO
 New York 6 March 2012 Disclaimer This presentation contains forward-looking statements with regard to the financial position and results of HEINEKEN s activities. These forward-looking statements are subject
Financial Results Presentation. For the period ended 28 June 2017
 Financial Results Presentation For the period ended 28 June 2017 Release: 22 August 2017 Disclaimer You must read the following before continuing This presentation has been prepared by Thame and London
2017 Preliminary Results: For the 52 weeks ended 30 December 2017
 2017 Preliminary Results: For the 52 weeks ended 30 December 2017 1 Agenda Highlights Financial performance Strategic progress Current trading & outlook 2 2017: good growth and further strategic progress
Interim Results. The White House, Leicester
 Interim Results The White House, Leicester 2013 Kirk Davis FD 15 March 2013 The Six Bells, Lymington Financial Summary 26 weeks to 27/01 H1 2013 H1 2012 Change Revenue 626.4m 569.4m +10.0% Like-for-like
A S X A N N O U N C E M E N T
 A S X A N N O U N C E M E N T DATE: 24 February 2016 Attached is the Presentation regarding Pact s Half year Financial Results for the half year ended 31 December 2015. The Presentation will occur at 10am
Full Year Results Presentation for the year ended 31 December February 2018
 Full Year Results Presentation for the year ended 31 December 2017 28 February 2018 Disclaimer This presentation is not intended to, and does not constitute or form part of, any offer, invitation or the
2018 Interim Results. 1 August BAE Systems 2018
 2018 Interim Results 1 August 2018 All statements other than statements of historical fact included in this document, including, without limitation, those regarding the financial condition, results, operations
Halfords Group plc. J.P. Morgan London Small/Mid Cap Conference 2017
 Halfords Group plc J.P. Morgan London Small/Mid Cap Conference 2017 Highlights Introduction to Halfords and key markets Page 3 Moving Up A Gear strategy Page 12 Financial Guidance Page 25 FY17 Financial
TVL FINANCE PLC PERIOD ENDED 28 MARCH 2018 REPORT TO NOTEHOLDERS 232,000, % SENIOR SECURED NOTES DUE 2023
 TVL FINANCE PLC PERIOD ENDED 28 MARCH 2018 REPORT TO NOTEHOLDERS 232,000,000 8.5% SENIOR SECURED NOTES DUE 2023 195,000,000 SENIOR SECURED FLOATING RATE NOTES DUE 2023 (the Notes ) CONTENTS Highlights
Responsible investment in growth
 Responsible investment in growth Issued: 1 March 2016 Legal notice This presentation has been prepared to inform investors and prospective investors in the secondary markets about the Group and does not
2013 Half-Year Results. 30 July 2013
 2013 Half-Year Results Peter Rigby: Adam Walker: Chief Executive Finance Director 30 July 2013 Introduction Peter Rigby H1 2013 Overview Underlying growth in continuing operations Disposal of non-core
Agenda. FY2018 highlights Evolution of key drivers Summary and outlook. Financial performance Property update
 Agenda FY2018 highlights Evolution of key drivers Summary and outlook Financial performance Property update 1 Continued delivery of our growth strategy in fy2018 High quality profitable estate Affordable
Philips Lighting reports 0.5% full year comparable sales growth, 10% operational profitability and EUR 403 million free cash flow
 Philips Lighting reports 0.5% full year comparable sales growth, 10% operational profitability and EUR 403 million free cash flow Q4 & Full Year 2017 presentation February 2, 2018 Important information
ANALYST & INVESTOR PRESENTATION
 ANALYST & INVESTOR PRESENTATION Interim results for the 6 months ended 31 August 2017 11 October 2017 Strong results in challenging market Financial highlights Revenues of 1.45bn (2016 : 1.45bn) Group
Unilever Investor Event Graeme Pitkethly, CFO Singapore, 2 nd December 2015
 Unilever Investor Event Graeme Pitkethly, CFO Singapore, 2 nd December 2015 Agenda 1 First principles of our business model 2 Creating value through our portfolio 3 Getting to the next level on costs 4
RESULTS FOR THE YEAR ENDED 31 MARCH Copyright Tate & Lyle PLC 2017
 RESULTS FOR THE YEAR ENDED 31 MARCH 2017 Copyright Tate & Lyle PLC 2017 Cautionary Statement This presentation for the Full Year Results for the year ended 31 March 2017 contains certain forward-looking
Second Quarter 2018 Earnings. August 7, 2018
 Second Quarter 2018 Earnings August 7, 2018 1 Forward Looking Statements Some of the statements made in this presentation are forward-looking and are made pursuant to the safe harbor provision of the Private
- On completion, 500m will have been realised from recent non-core disposals.
 20 August 2010 Mitchells & Butlers plc Disposal of 333 Non-Core Pubs for 373m Mitchells & Butlers announces the proposed disposal of 333 Non-Core Pubs for a cash consideration of 373m to Stonegate Pub
TVL FINANCE PLC FY 2017 PERIOD ENDED 28 JUNE 2017 REPORT TO NOTEHOLDERS 261,000, % SENIOR SECURED NOTES DUE 2023
 TVL FINANCE PLC FY 2017 PERIOD ENDED 28 JUNE 2017 REPORT TO NOTEHOLDERS 261,000,000 8.5% SENIOR SECURED NOTES DUE 2023 165,000,000 SENIOR SECURED FLOATING RATE NOTES DUE 2023 (the Notes ) CONTENTS Highlights
2017 Quarter 1 Financial Results. For the quarter ended 29 March 2017
 2017 Quarter 1 Financial Results For the quarter ended 29 March 2017 Release: 25 May 2017 Disclaimer You must read the following before continuing This presentation has been prepared by Thame and London
Electrocomponents plc ANNOUNCEMENT OF INTERIM RESULTS
 Electrocomponents plc ANNOUNCEMENT OF INTERIM RESULTS HALF YEAR ENDED 30 SEPTEMBER 2010 12 NOVEMBER 2010 DELIVERING FOR OUR CUSTOMERS Agenda Overview and current trading Ian Mason Financial performance
For personal use only
 Financial Results Half year ended 31 December 2016 15 February 2017 Agenda Results Overview Galdino Claro, Group CEO Financial Results Fred Knechtel, Group CFO Strategic Progress & Outlook Galdino Claro,
2017 Full Year. Results Presentation. 21 February 2018
 2017 Full Year Results Presentation 21 February 2018 CAUTIONARY STATEMENT 2017 Full Year Results Slide 2 Full Year Highlights 2017 Full Year Results Presentation 8TH YEAR OF DOUBLE-DIGIT GROWTH 2017 FINANCIAL
WHITBREAD PLC RESULTS FOR THE SIX MONTHS ENDED 29 TH AUGUST 2013 WHITBREAD DELIVERS DOUBLE DIGIT SALES, PROFIT AND DIVIDEND GROWTH
 WHITBREAD PLC RESULTS FOR THE SIX MONTHS ENDED 29 TH AUGUST 2013 WHITBREAD DELIVERS DOUBLE DIGIT SALES, PROFIT AND DIVIDEND GROWTH Financial Highlights Total revenue up 12.4% to 1,144.7 million (2012/13:
INVESTOR PRESENTATION. For the 26 week period ended 30 June 2017
 INVESTOR PRESENTATION For the 26 week period ended 30 June 2017 Financial highlights 26 week period ended 30 June 2017 26 week period ended 24 June 2016 Increase/ (decrease) per cent Revenue ( million)
FirstGroup plc Full year results
 FirstGroup plc Full year results For the twelve months to 31 March 2017 Thursday 1 June 2017 Tim O'Toole Chief Executive 2 Overview Significant improvement in operating results and substantial cash generation
Today s agenda. Introduction..Stephen Goodyear. Financial Review... Peter Whitehead. Managed Houses Young s. Patrick Dardis
 Interim Review Today s agenda Introduction..Stephen Goodyear Financial Review.... Peter Whitehead Managed Houses Young s. Patrick Dardis Managed Houses Geronimo.. Rupert Clevely Tenancies... Stephen Goodyear
PRESS RELEASE. Sales came to million in 2009, down 0.5% compared with 2008, or down 0.3% at constant exchange rates.
 2009: A ROBUST PERFORMANCE IN A PARTICULARLY CHALLENGING ENVIRONMENT Current operating margin1 maintained at 25.7% of sales 2009 dividend: 3.80 euros per share Full-year sales virtually unchanged: -0.3%
Half Year Results. for the six months ended 30 November January Chairman Chris Stone CEO Adam Palser CFO Brian Tenner
 Half Year Results for the six months ended 30 November 2017 16 January 2018 Chairman Chris Stone CEO Adam Palser CFO Brian Tenner Agenda Overview and strategy update Financial highlights Financial performance
Financial results. Full year ended 31 December 2012
 Financial results Full year ended 31 December 2012 Agenda Operational performance Financial results Outlook 2013 Appendix Full year result ended 31 December 2012 2 Strong market share performance across