Financial Results for FY2017 and Strategy
|
|
|
- Evan Sutton
- 5 years ago
- Views:
Transcription

1 Financial Results for FY2017 and Strategy Recruit Holdings Co., Ltd. Masumi Minegishi President, CEO, and Representative Director Keiichi Sagawa CFO and Senior Managing Corporate Executive Officer May 15, 2018 Recruit Holdings Co., Ltd. All rights reserved.
2 Disclaimer In preparing these materials, Recruit Holdings Co., Ltd. relies upon and assumes the accuracy and completeness of all available information. However, we make no representations or warranties of any kind, express or implied, about the completeness and accuracy. This presentation also contains forward- looking statements. Actual results, performance and achievements are subject to various risks and uncertainties. Accordingly, actual results may differ significantly from those expressed or implied by forward- looking statements. Readers are cautioned against placing undue reliance on forward- looking statements. Third parties are not permitted to use and/or disclose this document and the contents herein for any other purpose without the prior written consent of Recruit Holdings Co., Ltd. Recruit Holdings Co., Ltd. All rights reserved. 2
3 Contents 1. FY2017 Financial Results Highlights 2. Mid-term Strategy 3. New Management Structure 4. FY2018 Full-Year Forecasts Highlights 5. Financial Policy & Shareholder Returns 6. FY2017 Q4 Financial Results 7. FY2018 Full-Year Forecasts Recruit Holdings Co., Ltd. All rights reserved. 3
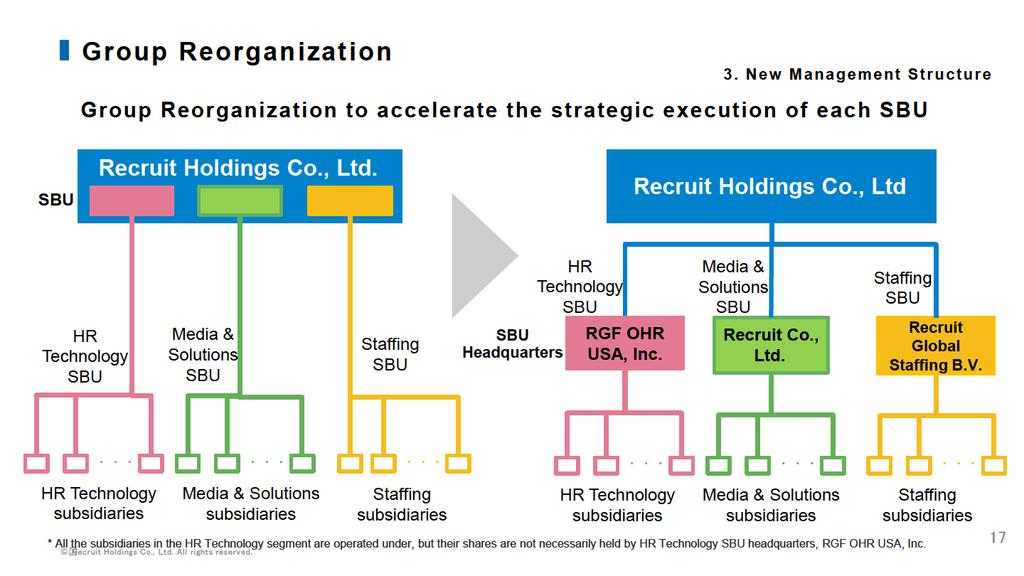
4 FY2017 Financial Results Highlights 1. FY2017 Financial Results Highlights Revenue, EBITDA and Adjusted EPS: Record-high results Strong revenue growth continued in HR Technology with +60.7% increase in US dollar terms (1) Overseas revenue increased to 46% in FY2017, from 43% in FY2016, of total revenue Group Reorganization to accelerate the strategic execution of each SBU (1) This is the financial results of Indeed, which differ from the IFRS-based consolidated financial results of Recruit Holdings Co., Ltd. due to differences in consolidation methodologies. Recruit Holdings Co., Ltd. All rights reserved. 4
5 FY2017 Consolidated Financial Results 1. FY2017 Financial Results Highlights (JPY Bn, unless otherwise stated) FY2016 Full-year Full-year Forecasts (1) FY2017 Full-year Results YoY Change Revenue 1, , , % EBITDA % EBITDA margin 12.0% 11.9% 11.9% -0.1pt Adjusted profit % Adjusted EPS (JPY) (2) % Dividend per share (JPY) (2) (1) Announced on February 14, 2018 (2) Assuming a three-for-one stock split of its common stock on July 1, 2017 was implemented at the beginning of FY2016. Recruit Holdings Co., Ltd. All rights reserved. 5
6
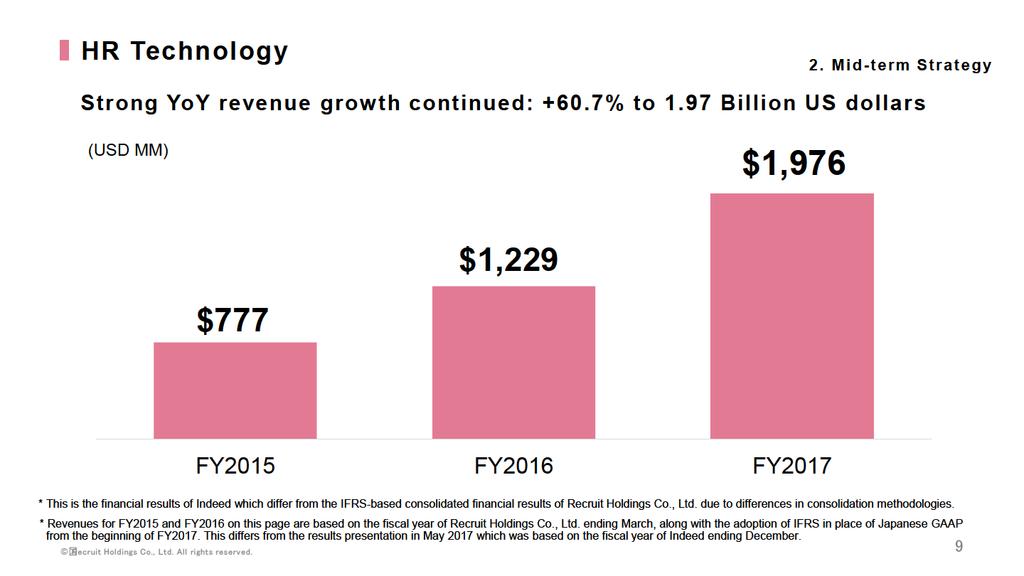
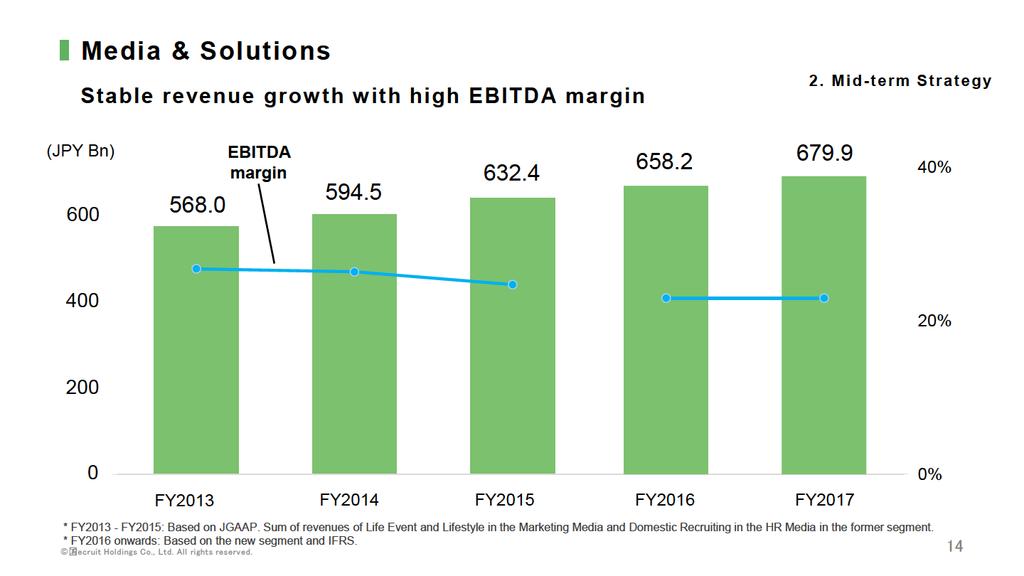
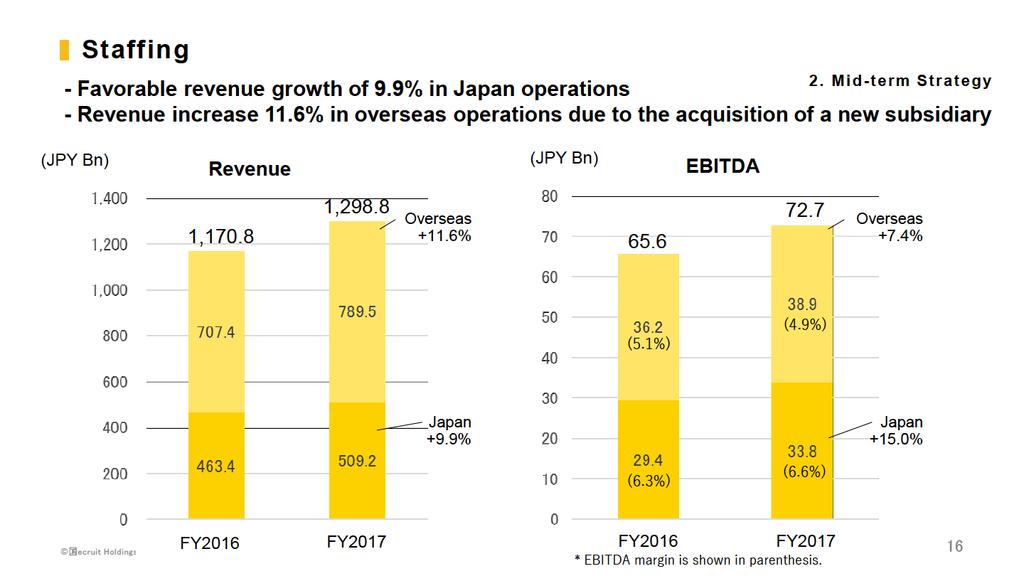
7 FY2017 Financial Results Highlights by Segment HR Technology 2. Mid-term Strategy - Strong YoY revenue growth continued: +60.7% to 1.97 Billion US dollars (1) Media & Solutions YoY growth in total : Revenue +3.3%, EBITDA +3.1% - Marketing Solutions : Revenue +2.4% driven by a strong trend in Beauty business - HR Solutions : Revenue +4.4% supported by a favorable market environment Staffing YoY growth in total : Revenue +10.9%, EBITDA +10.8% - Japan operations : Revenue +9.9%, demonstrating strong growth - Overseas operations : Revenue +11.6%, due to the acquisition of a new subsidiary (1) This is the financial results of Indeed, which differ from the IFRS-based consolidated financial results of Recruit Holdings Co., Ltd. due to differences in consolidation methodologies. Recruit Holdings Co., Ltd. All rights reserved. 7
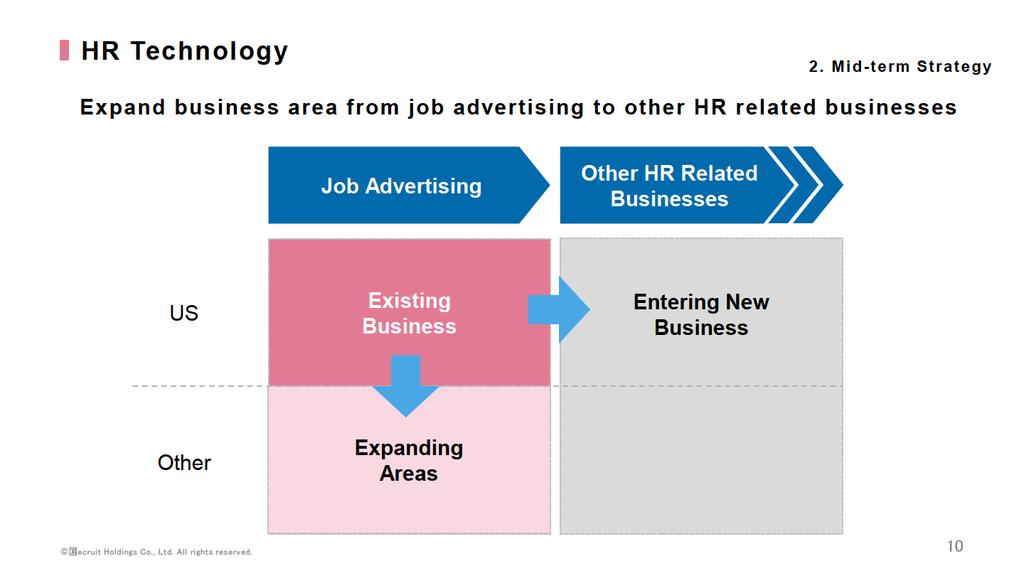
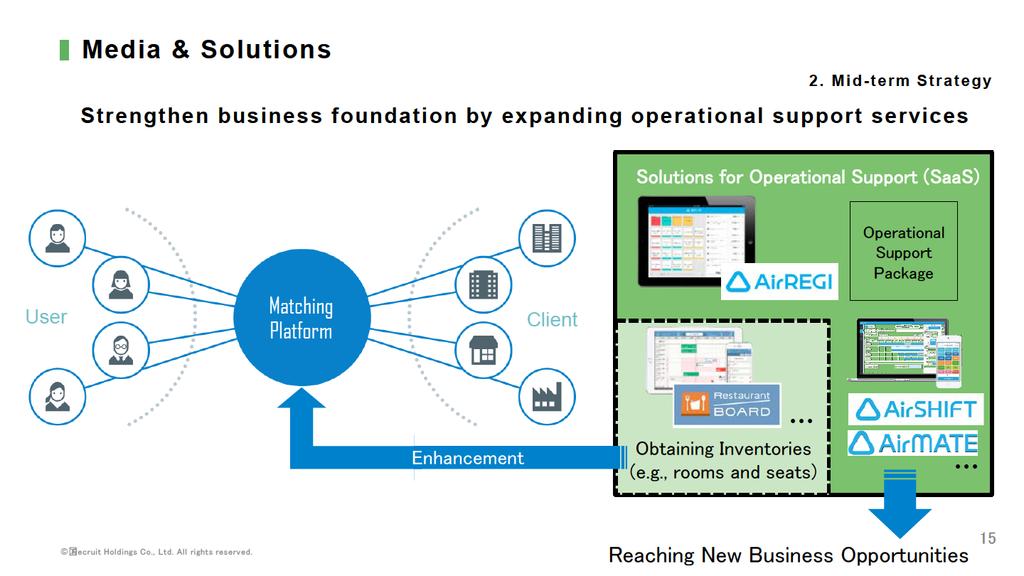
8 Mid-term Strategy by Segment 2. Mid-term Strategy HR Technology - Expanding from job advertising into other HR related businesses - Aim for high growth rate by contributing to efficiency of overall HR processes Media & Solutions - Strengthen business foundation further by expanding operational support services - Stable revenue growth with high EBITDA margin Staffing - Promote Unit Management leveraging a solid global economic environment - Continue stable EBITDA growth on a global scale Recruit Holdings Co., Ltd. All rights reserved. 8
9
10
11
12
13
14
15
16
17
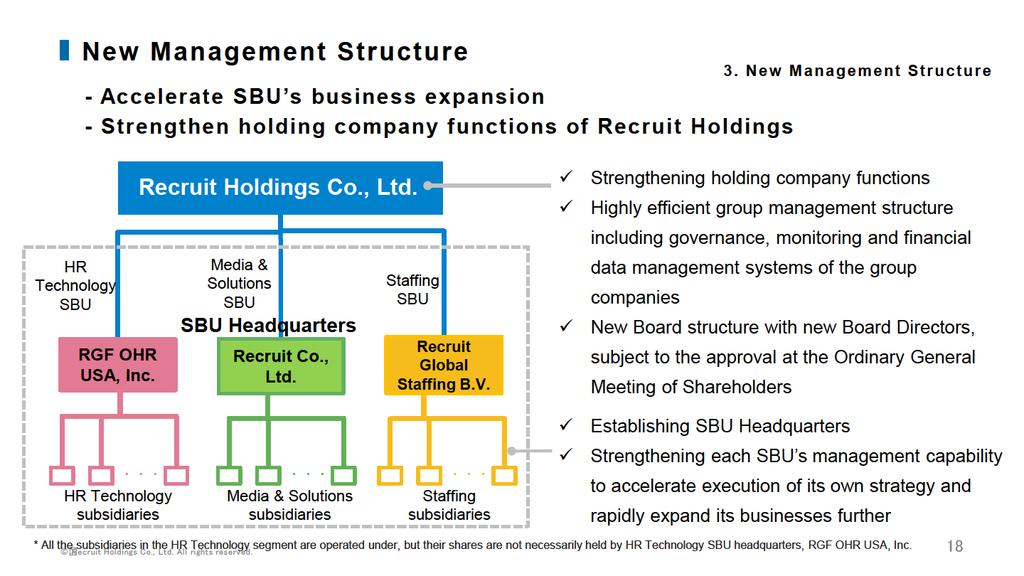
18
19 FY2018 Full-Year Forecasts Highlights 4. FY2018 Full-Year Forecasts Highlights FY2017 FY2018 (JPY Bn, unless otherwise stated) Full-year Full-year Forecasts YoY Change Revenue 2, , % EBITDA % EBITDA margin (%) 11.9% 12.4% +0.5pt Adjusted profit % Adjusted EPS (JPY) % * Assumed foreign exchange rates for FY2018: JPY 106 per US dollar, JPY 131 per Euro, JPY 84 per Australian dollar. Recruit Holdings Co., Ltd. All rights reserved. 19
20 Financial Policy & Shareholder Returns 5. Financial Policy & Shareholder Returns Key Management Target Adjusted EPS:3 years CAGR of high single digits (FY ) The target is expected to be achieved with 3 years CAGR forecast of 13.5% Capital Efficiency Basic policy is to maintain ROE of approximately 15% ROE of 19.3% in FY2017 Shareholder Returns Annual dividends - FY2017 : JPY 23 (interim: JPN 11, year-end: JPY 12) - FY2018 (forecast) : JPY 27 (interim: JPN 13.5, year-end: JPY 13.5) Recruit Holdings Co., Ltd. All rights reserved. 20
21 Contents 1. FY2017 Financial Results Highlights 2. Mid-term Strategy 3. New Management Structure 4. FY2018 Full-Year Forecasts Highlights 5. Financial Policy & Shareholder Returns 6. FY2017 Q4 Financial Results 7. FY2018 Full-Year Forecasts Recruit Holdings Co., Ltd. All rights reserved. 21
22 FY2017 Q4 Financial Results 6. FY2017 Q4 Financial Results (JPY Bn, unless otherwise stated) FY2016 Q4 (Jan.- Mar.) Q4 (Jan.- Mar.) YoY Change FY2017 Full-year YoY Change Revenue % 2, % EBITDA % % EBITDA margin 8.2% 7.7% -0.5pt 11.9% -0.1% Operating income % % Adjusted operating income (1) % % Profit attributable to owners of the parent % % Adjusted profit % % Adjusted EPS (JPY) (2) % % (1) Excluding proceeds and losses from sale of subsidiaries. (2) Assuming a three-for-one stock split of its common stock on July 1, 2017 was implemented at the beginning of FY2016. Recruit Holdings Co., Ltd. All rights reserved. 22
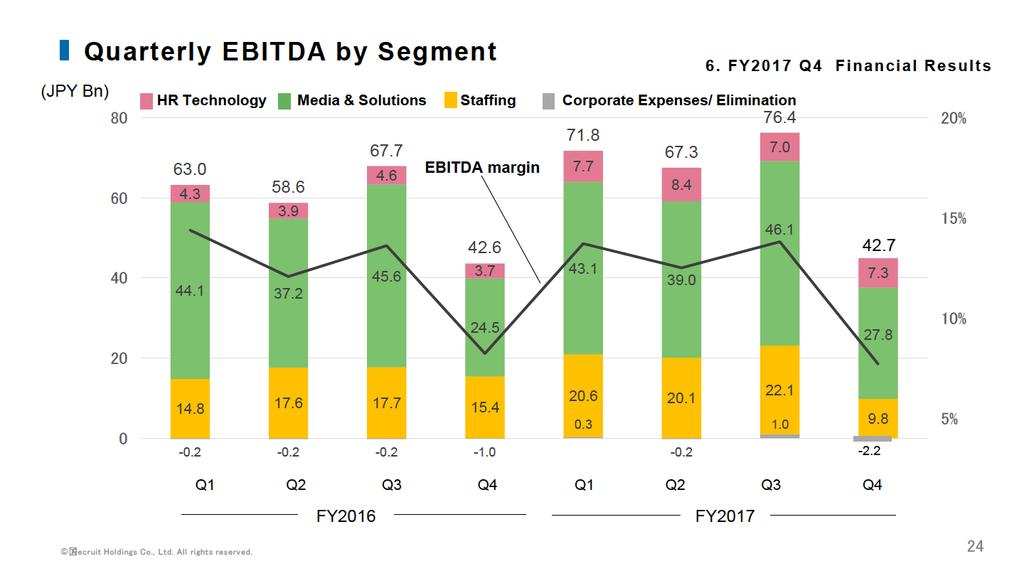
23 FY2017 Q4 Financial Results by Segment 6. FY2017 Q4 Financial Results (JPY Bn) Revenue FY2016 Q4 (Jan.- Mar.) Q4 (Jan.- Mar.) YoY Change FY2017 Full-year YoY Change Consolidated results % 2, % HR Technology % % Media & Solutions % % Staffing % 1, % Corporate Expenses/ Elimination EBITDA Consolidated results % % HR Technology % % Media & Solutions % % Staffing % % Corporate Expenses/ Elimination Recruit Holdings Co., Ltd. All rights reserved. 23
24
25 HR Technology 6. FY2017 Q4 Financial Results (JPY Bn, USD MM) FY2016 FY2017 Revenue Q4 (Jan.- Mar.) Q4 (Jan.- Mar.) YoY Change Full-year YoY Change HR Technology % % Reference: (1) Revenue in US Dollars % 1, % EBITDA HR Technology % % (1) This is the financial results of Indeed, which differ from the IFRS-based consolidated financial results of Recruit Holdings Co., Ltd. due to differences in consolidation methodologies. Recruit Holdings Co., Ltd. All rights reserved. 25
26 Media & Solutions 6. FY2017 Q4 Financial Results (JPY Bn) Revenue EBITDA Media & Solutions % % Marketing Solutions % % HR Solutions % % Corporate Expenses/ Eliminations Recruit Holdings Co., Ltd. All rights reserved. FY2016 Q4 (Jan.- Mar.) Q4 (Jan.- Mar.) YoY Change FY2017 Full-year YoY Change Media & Solutions % % Marketing Solutions % % Housing and Real Estate % % Bridal % % Travel % % Dining % % Beauty % % Others % % HR Solutions % % Domestic Recruiting % % Others % % Corporate Expenses/ Eliminations % %
27 Staffing 6. FY2017 Q4 Financial Results (JPY Bn) Revenue FY2016 Q4 (Jan.- Mar.) Q4 (Jan.- Mar.) FY2017 YoY Change Full-year YoY Change Staffing % 1, % Japan % % Overseas % % EBITDA Staffing % % Japan % % Overseas % % Recruit Holdings Co., Ltd. All rights reserved. 27
28 FY2018 Full-Year Forecasts 7. FY2018 Full-Year Forecasts (JPY Bn, unless otherwise stated) FY2017 Full-year (1) Full-year Forecasts* FY2018 YoY Change Revenue 2, , % EBITDA % Operating income % Profit attributable to owners of the parent % Adjusted profit % Adjusted EPS (JPY) % Profit used as basis for dividend calculation % Dividend per share (JPY) * Assumed foreign exchange rates for FY2018: JPY 106 per US dollar, JPY 131 per Euro, JPY 84 per Australian dollar. Recruit Holdings Co., Ltd. All rights reserved. 28
29 Recruit Holdings Co., Ltd. All rights reserved. Appendix

30 Candidate for Board Director Rony Kahan Aug Nov Sep Oct Co-Founder, jobsinthemoney.com, Inc. Co-Founder, President & Chairman, Indeed, Inc. CEO, Indeed, Inc. Chairman, Indeed, Inc. * Appointed to be a Board Director of Recruit Holdings Co., Ltd., subject to the approval at the Ordinary General Meeting of Shareholders scheduled in June Recruit Holdings Co., Ltd. All rights reserved. 30
31 EBITDA and Adjusted Profit under IFRS (JPY Bn) FY2017 (JPY Bn) FY2017 EBITDA Q4 (Jan.- Mar.) Full-year Adjusted profit Q4 (Jan.- Mar.) Full-year Operating income Other operating income Other operating expenses Depreciation and amortization EBITDA Recruit Holdings Co., Ltd. All rights reserved. Profit (loss) attributable to owners of the parent Amortization of intangible assets arising due to business combinations One-off income One-off losses Tax reconciliation regarding the adjustment items Adjusted profit
32 Other Data FY2016 FY2017 Q1e Q2e Q3e Q4e Q1e Q2e Q3e Q4e Hot Pepper Gourmet # of seats reserved online * (million) Hot Pepper Beauty # of online reservations * (million) Air REGI # of accounts (thousand) Study Sapuri high school student course #of paying subscribers (thousand) *Based on number of reservations, and cancels are not counted. Recruit Holdings Co., Ltd. All rights reserved. 32
33
34
35
36 Notes EBITDA = operating income + depreciation and amortization ± other operating income/expenses Adjusted profit: Profit (loss) attributable to owners of the parent ± adjustment items* (excluding non-controlling interests) ± tax reconciliation regarding the adjustment items *amortization of intangible assets arising due to business combinations ± one-off income/losses Adjusted EPS: adjusted profit / (number of shares issued at the end of the period -number of treasury stock at the end of the period) Profit used as basis of dividend calculation= Profit (loss) attributable to owners of the parent excluding one-off income/losses etc. Recruit Holdings Co., Ltd. All rights reserved. 36
Summary of Financial Results for FY2016
 Summary of Financial Results for FY2016 Recruit Holdings Co., Ltd. Results for FY2016 Consolidated Earnings Summary Consolidated net sales increased by 15.8% year-on-year to 1,839.9 billion yen. EBITDA
Recruit Holdings Co., Ltd. (TSE 6098) Consolidated Financial Results for the Year Ended March 31, 2018 (IFRS, Unaudited)
 Consolidated Financial Results for the Year Ended March 31, 2018 (IFRS, Unaudited)") May 15, 2018 Recruit Holdings Co., Ltd. (TSE 6098) Consolidated Financial Results for the Year Ended March 31, 2018 (IFRS, Unaudited) Tokyo, May 15, 2018 Recruit Holdings Co., Ltd. ("Recruit Holdings"
May 15, 2018 Recruit Holdings Co., Ltd. (TSE 6098) Consolidated Financial Results for the Year Ended March 31, 2018 (IFRS, Unaudited) Tokyo, May 15, 2018 Recruit Holdings Co., Ltd. ("Recruit Holdings"
Recruit Holdings Co., Ltd. (TSE 6098) Consolidated Financial Results for the Nine Months Ended December 31, 2018 (IFRS, Unaudited)
 Consolidated Financial Results for the Nine Months Ended December 31, 2018 (IFRS, Unaudited)") February 13, 2019 Consolidated Financial Results for the Nine Months Ended December 31, 2018 (IFRS, Unaudited) Tokyo, February 13, 2019 Recruit Holdings Co., Ltd. ("Recruit Holdings" or the Company ) announced
February 13, 2019 Consolidated Financial Results for the Nine Months Ended December 31, 2018 (IFRS, Unaudited) Tokyo, February 13, 2019 Recruit Holdings Co., Ltd. ("Recruit Holdings" or the Company ) announced
Recruit Holdings Co., Ltd. (TSE 6098) Consolidated Financial Results for the Six Months Ended September 30, 2018 (IFRS, Unaudited)
 Consolidated Financial Results for the Six Months Ended September 30, 2018 (IFRS, Unaudited)") November 13, 2018 Consolidated Financial Results for the Six Months Ended September 30, 2018 (IFRS, Unaudited) Tokyo, November 13, 2018 Recruit Holdings Co., Ltd. ("Recruit Holdings" or the Company ) announced
November 13, 2018 Consolidated Financial Results for the Six Months Ended September 30, 2018 (IFRS, Unaudited) Tokyo, November 13, 2018 Recruit Holdings Co., Ltd. ("Recruit Holdings" or the Company ) announced
Recruit Holdings Media & Solutions Business
 Recruit Holdings Media & Solutions Business Yoshihiro Kitamura Managing Corporate Executive Officer Head of Media and Solutions Strategic Business Unit Recruit Holdings Co., Ltd. November 15, 2017 Yoshihiro
Acquisition of a staffing company in the Netherlands: USG People
 Acquisition of a staffing company in the Netherlands: USG People December 22, 2015 Recruit Holdings Co., Ltd. Disclaimer In preparing these materials, Recruit Holdings Co., Ltd. relies upon and assumes
Acquisition of Hotspring
 Acquisition of Hotspring - Online Beauty Reservation Service Provider in Europe - May 1, 2015 Recruit Holdings Co., Ltd. Disclaimer In preparing these materials, Recruit Holdings Co., Ltd. relies upon
FY2016 Third Quarter Results
 FY Third Quarter Results November 14, Revised on February 14, 2017. * Please be reminded that the figures shown in this presentation may be different from those shown in the financial statements as this
[Insert Subheading] Click to edit Master text styles. Shop Direct Limited. Q1 FY18 Results. Three months ended 30 September 2017.
![[Insert Subheading] Click to edit Master text styles. Shop Direct Limited. Q1 FY18 Results. Three months ended 30 September 2017.](/thumbs/75/71763350.jpg "[Insert Subheading] Click to edit Master text styles. Shop Direct Limited. Q1 FY18 Results. Three months ended 30 September 2017.") [Insert Subheading] Click to edit Master text styles Shop Direct Limited Q1 FY18 Results Three months ended 30 September 2017 7 December 2017 1 Disclaimer This presentation (the Presentation ) has been
[Insert Subheading] Click to edit Master text styles Shop Direct Limited Q1 FY18 Results Three months ended 30 September 2017 7 December 2017 1 Disclaimer This presentation (the Presentation ) has been
2013 The Third Quarter s Results
 The Third Quarter s Results Please be reminded that the figures shown in this presentation may be different from those shown in the financial statements as this presentation has been prepared for investors
FY2018 First Quarter Results
 FY First Quarter Results May 15, * Please be reminded that the figures shown in this presentation may be different from those shown in the financial statements as this presentation has been prepared for
FY2017 Earnings Presentation. February 15, 2018 DENTSU INC.
 FY Earnings Presentation February 15, 2018 DENTSU INC. FY Annual Results Yushin Soga Director and Executive Officer February 13, 2018 * Please be reminded that the figures shown in this presentation may
FY2018 Third Quarter Results
 FY Third Quarter Results Yushin Soga Director and Executive Officer November 14, * Please be reminded that the figures shown in this presentation may be different from those shown in the financial statements
Entry into Scheme Implementation Deed to Acquire 100% Ownership of TOWER Australia
 December 28, 2010 Koichiro Watanabe President and Representative Director The Dai-ichi Life Insurance Company, Limited Code: 8750 (TSE First section) Entry into Scheme Implementation Deed to Acquire 100%
DATATEC GROUP UNAUDITED INTERIM RESULTS FOR THE 6 MONTHS ENDED 31 AUGUST 2016
 Technology Distribution Integration & Managed Services Consulting & Research UNAUDITED INTERIM RESULTS FOR THE 6 MONTHS ENDED 31 AUGUST 2016 AGENDA Results summary, market conditions & operational strategy
3rd quarter 2008 November 13, 2008
 3rd quarter 2008 November 13, 2008 1 Overview > Q3 2008 results > Update on full year 2008 guidance > Immediate priorities and business update 2 Results in EUR m Q3 08 Q3 07 Change Sep 08 Sep 07 Change
FY2014 First Half Results
 は FY2014 First Half s October 31, 2014 Norio Tadakawa Corporate Officer, CFO Shiseido Co., Ltd. In this document, statements other than historical facts are forward-looking statements that reflect our
Financial Highlights (1)
") Disclaimer The information in this document has not been independently verified and no representation or warranty, expressed or implied, is made as to, and no reliance should be placed on, the fairness,
Disclaimer The information in this document has not been independently verified and no representation or warranty, expressed or implied, is made as to, and no reliance should be placed on, the fairness,
1H/FY2016 Earnings Presentation. August 15, 2016 DENTSU INC.
 1H/FY Earnings Presentation August 15, DENTSU INC. Summary of the First Half of FY and Management Topics Tadashi Ishii President & CEO This presentation material contains forecasts based on assumptions,
Notification of Introduction of the Performance-based Stock Incentive Plan for Board Directors
 To whom it may concern: May 13, 2016 Company name: Representative: Contact: Recruit Holdings Co., Ltd. Masumi Minegishi, President, CEO and Representative Director (Securities code: 6098, TSE First Section)
Q RESULTS. 19 July 2017 HAROLD GODDIJN CEO TACO TITULAER CFO
 Q2 2017 RESULTS 19 July 2017 HAROLD GODDIJN CEO TACO TITULAER CFO Our strategy is to build on our leading position in navigation technologies and to provide location content, software, and services to
For personal use only
 2016 Annual General Meeting 18 NOVEMBER 2016 YOUR BOARD Greg Ridder Ruslan Kogan David Shafer Harry Debney Independent, Non-Executive Chairman Founder & CEO CFO & COO Independent, Non-Executive Director
Q Financial Results Conference Call August 7, NASDAQ: MTLS
 Q2 2018 Financial Results Conference Call August 7, 2018 www.materialise.com NASDAQ: MTLS Safe Harbor Summary This presentation contains forward-looking statements within the meaning of Section 27A of
Fourth Quarter 2015 Performance Summary
 Fourth Quarter 2015 Performance Summary Operational and Financial Highlights - 2015 Grifols revenues grow by 17.3% to Euros 3,935 million, and net profit grows by 13.2% reaching Euros 532 million of the
Gary Winterhalter, President and CEO May 10, 2011 SALLYBEAUTY HOLDINGS, INC. 1
 Gary Winterhalter, President and CEO May 10, 2011 HOLDINGS, INC. 1 Cautionary Notice Regarding Forward-Looking Statements Cautionary Notice Regarding Forward-Looking Statements Statements in this presentation
Management Policies (Fiscal 2014)
") Management Policies (Fiscal 2014) Hiroyuki Sasa President and Representative Director Olympus Corporation May 9, 2014 2 II. Challenges and Responses 3 4 5 6 I. Successes during 2 Years under New Management
Management Policies (Fiscal 2014) Hiroyuki Sasa President and Representative Director Olympus Corporation May 9, 2014 2 II. Challenges and Responses 3 4 5 6 I. Successes during 2 Years under New Management
Flash Report for the Fiscal Year ended December 31, 2013 [Japan GAAP] (on a consolidated basis)
![Flash Report for the Fiscal Year ended December 31, 2013 [Japan GAAP] (on a consolidated basis)](/thumbs/91/106826542.jpg "Flash Report for the Fiscal Year ended December 31, 2013 [Japan GAAP] (on a consolidated basis)") Flash Report for the Fiscal Year ended December 31, [Japan GAAP] (on a consolidated basis) January 31, 2014 Company Name: OPT, Inc. Stock exchange listing: Tokyo Stock Code: 2389 URL http://www.opt.ne.jp/
Flash Report for the Fiscal Year ended December 31, [Japan GAAP] (on a consolidated basis) January 31, 2014 Company Name: OPT, Inc. Stock exchange listing: Tokyo Stock Code: 2389 URL http://www.opt.ne.jp/
Overview of Earnings for 1Q FY2016
 Overview of Earnings for 1Q FY2016 Japan Exchange Group, Inc. July 28, 2016 I. Overview of Earnings for 1Q FY2016 IFRS (April 1, 2016 June 30, 2016) * This document is not subject to the audit procedures
Annual General Meeting of Shareholders
 Annual General Meeting of Shareholders April 23, 2013 Certain Slides Updated July, 2013 Alan Horn Chairman of the Board of Directors Agenda Opening Remarks Alan Horn, Chairman Business of the Meeting Alan
Financial Industry Solutions. Second Quarter Financial Results AUGUST 9, 2018
 Financial Industry Solutions Second Quarter Financial Results AUGUST 9, Disclaimer Certain information in this presentation is forward-looking and related to anticipated financial performance, events and
Q4 and Full Year 2018 Earnings Report
 Q4 and Full Year 2018 Earnings Report February 12, 2019 2019 Sabre GLBL Inc. All rights reserved. 1 Forward-looking statements Forward-looking Statements Certain statements herein are forward-looking statements
INTERIM PRESENTATION Q October 2018
 INTERIM PRESENTATION 25 October JUAN VARGUES, PRESIDENT & CEO HIGHLIGTHS Organic growth Good organic growth in EMEA Flat organic growth in Americas despite -7% RV OEM APAC down due to softer market in
Investor Presentation December 2014
 Investor Presentation December 2014 Disclaimer FORWARD LOOKING STATEMENTS The statements contained in this presentation include statements concerning our expectations, beliefs, plans, objectives, goals,
Q2 18 Earnings Report
 Q2 18 Earnings Report July 31, 2018 2018 Sabre GLBL Inc. All rights reserved. 1 Forward-looking statements Forward-looking Statements Certain statements herein are forward-looking statements about trends,
Investor Presentation
 Investor Presentation (NASDAQ: TRIP) Q3 2012 Safe Harbor Statement Forward-Looking Statements. Our presentation today, including the slides contained herein, contains "forward-looking statements" within
Q Earnings Report. Sabre Corporation August 4, 2015
 Q2 2015 Earnings Report Sabre Corporation August 4, 2015 1 Forward-looking Statements Forward Looking Statements Certain statements herein are forward-looking statements about trends, future events, uncertainties
1H18 Results Presentation Sid Takla Interim Chief Executive Officer Lyndal York Chief Financial Officer
 1H18 Results Presentation Sid Takla Interim Chief Executive Officer Lyndal York Chief Financial Officer 21 August 2018 Important Notice and Disclaimer This presentation has been prepared by Asaleo Care
Consolidated Financial Results FY2013/03 for the year Ended March 31, 2013
 May 14, 2013 Consolidated Financial Results FY2013/03 for the year Ended March 31, 2013 0 Disclaimer This presentation contains current plans, expectations and strategies, which include forward-looking
27 July 2018 Interim Results
 27 July 2018 Interim Results for the half year ended 30 June 2018 Disclaimer This presentation may contain forward-looking statements, including forward-looking statements within the meaning of the United
rhipe Limited (ASX code RHP) FY16 Full Year Results Presentation & FY 2017 Outlook
 FY16 Full Year Results Presentation & FY 2017 Outlook") rhipe Limited (ASX code RHP) FY16 Full Year Results Presentation & FY 2017 Outlook Dominic O Hanlon, CEO & Managing Director Mike Hill, Executive Chairman 1 This presentation has been prepared by rhipe
rhipe Limited (ASX code RHP) FY16 Full Year Results Presentation & FY 2017 Outlook Dominic O Hanlon, CEO & Managing Director Mike Hill, Executive Chairman 1 This presentation has been prepared by rhipe
Results Presentation for the 2 nd Quarter ended June 30, 2018 EBARA (6361) August 9, 2018
 August 9, 2018") Presentation for the 2 nd Quarter ended June 30, 2018 EBARA (6361) August 9, 2018 Contents 1. Summary of Executive Officer, Responsible for Finance & Accounting Akihiko Nagamine 2. Projection and Management
Presentation for the 2 nd Quarter ended June 30, 2018 EBARA (6361) August 9, 2018 Contents 1. Summary of Executive Officer, Responsible for Finance & Accounting Akihiko Nagamine 2. Projection and Management
Financial Data Report LOTTOTECH LIMITED. for the period ending 30.Jun.2018
 Financial Data Report LOTTOTECH LIMITED for the period ending 30.Jun.2018 Equity Statistics Particulars Units 29-Jun-18 Current Market Price MUR 9.72 52 week H/L* MUR 9.88 / 5.66 Market Capitalisation
Caution concerning Forward-Looking Statements Purpose of This Material and Cautionary Notes This material is prepared for the purpose of understanding
 (Reference Material) Voluntary Adoption of International Financial Reporting Standards(IFRS)from the fiscal year ended March 31,2012 Japan Tobacco Inc. Caution concerning Forward-Looking Statements Forward-Looking
Financial Data Report LOTTOTECH LIMITED. for the period ending 30.Jun.2017
 Financial Data Report LOTTOTECH LIMITED for the period ending 30.Jun.2017 Equity Statistics Particulars Units 31-Jul-17 Current Market Price MUR 5.90 52 week H/L* MUR 6.50 / 4.02 Market Capitalisation
Fourth Quarter 2016 Performance Summary
 Fourth Quarter 2016 Performance Summary Operational and Financial Highlights - 2016 Net profit rises by +2.5% to Euros 545.5 million Recurring sales (excluding Raw Materials and Others) rise by +4.5% (+4.6%
Consolidated Financial Highlights
 Disclaimer Regarding Forward-looking Statements Any statements in this document, other than those of historical fact, are forward-looking statements about the future performance of EIZO and its group companies,
Atento. Fiscal 2016 Fourth Quarter and Full Year Results. March 21, 2017
 Atento Fiscal 2016 Fourth Quarter and Full Year Results March 21, 2017 Lynn Antipas Tyson Vice President Investor Relations +1-914-485-1150 lynn.tyson@atento.com 1 Disclaimer This presentation has been
Q Results Investor Presentation. PLAY Communications 12 November 2018
 Q3 2018 Results Investor Presentation PLAY Communications 12 November 2018 Disclaimer This presentation has been prepared by Play Communications S.A. s and its subsidiaries (together the PLAY Group ).
Renesas Electronics Reports Full Year 2017 Financial Results
 Renesas Electronics Reports Full Year 2017 Financial Results Significant Increase in Full Year Sales Year-On-Year Driven by Growth Mainly in Automotive and Industrial Businesses and Integration of Intersil.
Investor Presentation
 Investor Presentation (NASDAQ: TRIP) Q4 2012 Safe Harbor Statement Forward-Looking Statements. Our presentation today, including the slides contained herein, contains "forward-looking statements" within
Investor Presentation
 Investor Presentation (NASDAQ: TRIP) Q2 2013 Safe Harbor Statement Forward-Looking Statements. Our presentation today, including the slides contained herein, contains "forward-looking statements" within
September Quarter 2017 Results
 September Quarter 2017 Results November 2, 2017 Disclaimer This presentation contains forward-looking statements. These statements are made under the safe harbor provisions of the U.S. Private Securities
H1 16 interim results. 22 September 2015
 H1 16 interim results 22 September 2015 Important notice 2 This presentation may include certain forward-looking statements, beliefs or opinions, including statements with respect to the Company s business,
Vita Group (VTG)! Results Presentation!
! Results Presentation!") Vita Group (VTG) Results Presentation First half FY14 Group highlights Sustained trend of strong profit, dividend growth Underlying EBITDA 1 +18%, underlying NPAT 2 +56%, dividend +66% Areas of strategic
Vita Group (VTG) Results Presentation First half FY14 Group highlights Sustained trend of strong profit, dividend growth Underlying EBITDA 1 +18%, underlying NPAT 2 +56%, dividend +66% Areas of strategic
Disclaimer. kabu.com Securities Co., Ltd.
 Disclaimer This document is an Englishlanguage translation of the nonconsolidated financial summary of the financial results for the third quater of the fiscal year ending March 31, 2013(from April 2012
Overview of Earnings for Q3 FY2017
 Overview of Earnings for Q3 FY217 Japan Exchange Group, Inc. January 31, 218 I. Business Developments * This document is not subject to the audit procedures required under the Financial Instruments and
Sabre reports first quarter 2017 results
 Sabre reports first quarter 2017 results First quarter revenue increased 6.5% Airline and Hospitality Solutions revenue grew 8.2% Travel Network revenue rose 6.1%, with bookings growth of 5.8% Net income
Q Results. November 2018
 Q3 2018 Results November 2018 Forward-Looking Statements. Our presentation today, including the slides contained herein, contains "forward-looking statements" within the meaning of the Private Securities
FY09/3 Q2 Financial Results
 FY09/3 Q2 Financial Results Toshio Nakajima President and CEO October 29, 2008 NEC Electronics Corporation http://www.necel.com/ir/en/ 1 Executive Summary Despite the effects of considerable yen depreciation,
Financial Data Report ROGERS AND COMPANY LIMITED (THE GROUP) for the period ending 31.Dec.2017
 for the period ending 31.Dec.2017") Financial Data Report ROGERS AND COMPANY LIMITED (THE GROUP) for the period ending 31.Dec.2017 Equity Statistics Particulars Units 29-Dec-17 Current Market Price MUR 31.30 52 week H/L* MUR 33.00 / 27.00
Financial Data Report ROGERS AND COMPANY LIMITED (THE GROUP) for the period ending 31.Dec.2017 Equity Statistics Particulars Units 29-Dec-17 Current Market Price MUR 31.30 52 week H/L* MUR 33.00 / 27.00
TripAdvisor Investor Presentation. February 2019
 TripAdvisor Investor Presentation February 2019 1 Forward-Looking Statements. Our presentation today, including the slides contained herein, contains "forward-looking statements" within the meaning of
Cushman & Wakefield. Q2 Earnings Presentation September 5, 2018
 Cushman & Wakefield Q2 Earnings Presentation September 5, 2018 Cautionary Note on Forward-Looking Statements All statements in this presentation (and oral statements made regarding the subjects of this
Highlights of Consolidated Results for Fiscal Year ended March 31, 2016
 May 9, 2016 Highlights of Consolidated Results for Fiscal Year ended March 31, 2016 (except for per share amounts) Year ended Year ended March 31, March 31, 2016 2015 Change Y 745,888 Y 707,237 5.5 Operating
2017 half year results investor presentation
 2017 half year results investor presentation 27 February 2017 contents section presenting slide CEO presentation Julian Ogrin 3 broadband 10 CFO presentation Leanne Wolski 14 summary Julian Ogrin 21 appendix
Q Results. May 2018
 Q1 2018 Results May 2018 Forward-Looking Statements. Our presentation today, including the slides contained herein, contains "forward-looking statements" within the meaning of the Private Securities Litigation
Fourth Quarter Earnings Presentation. March 29, 2016
 Fourth Quarter Earnings Presentation March 29, 2016 Safe Harbor Agreement This presentation contains forward looking statements within the meaning of the Private Securities Litigation Reform Act of 1995
Cushman & Wakefield. Q3 Earnings Presentation November 13, 2018
 Cushman & Wakefield Q3 Earnings Presentation November 13, 2018 Cautionary Note on Forward-Looking Statements All statements in this presentation (and oral statements made regarding the subjects of this
Overview of Earnings for 1Q FY2014
 Overview of Earnings for 1Q FY2014 Japan Exchange Group, Inc. July 25, 2014 I. Overview of Earnings for 1Q FY2014 (April 1 June 30, 2014) Highlights and FY2014 Forecast During 1Q FY2014, light trading
Consolidated Financial Highlights. Fiscal Year Ended Mar 31, 2006
 Consolidated Financial Highlights Fiscal Year Ended Mar 31, 2006 Table of Contents 1. Consolidated Statements of Income 2. Consolidated Balance Sheets 3. Selling, general and administrative expenses 4.
PT Ultrajaya Milk Industry & Trading Company Tbk. FY 2013 results update
 PT Ultrajaya Milk Industry & Trading Company Tbk. FY 2013 results update April 2014 0 Disclaimer These materials are not intended to be a public offering document under Law of the Republic of Indonesia
Q3 FY03. Consolidated Results
 Q3 FY2003 Consolidated Results (Third Quarter Ended December 31, 2003) Statements made in this presentation with respect to Sony s current plans, estimates, strategies and beliefs and other statements
Financial Data Report ROGERS AND COMPANY LIMITED (THE GROUP) for the period ending 31.Dec.2015
 for the period ending 31.Dec.2015") Financial Data Report (THE GROUP) for the period ending 31.Dec.2015 INVESTMENT Equity Statistics Particulars Units 31-Mar-16 Current Market Price MUR 27.75 52 week H/L* MUR 32.50 / 26.90 Market Capitalisation
Financial Data Report (THE GROUP) for the period ending 31.Dec.2015 INVESTMENT Equity Statistics Particulars Units 31-Mar-16 Current Market Price MUR 27.75 52 week H/L* MUR 32.50 / 26.90 Market Capitalisation
Financial Highlights under Japanese GAAP for 2nd Quarter of Fiscal Year Ending March 31, 2019
 Financial Highlights under Japanese GAAP for 2nd Quarter of Fiscal Year Ending March 31, 2019 November 13, 2018 Mitsubishi UFJ Financial Group, Inc. FY2018 H1 financial results summary for Fiscal Year
Second Quarter 2013 Earnings Presentation. August 2, 2013
 Second Quarter 2013 Earnings Presentation August 2, 2013 Agenda Strategic Review Financial Review Questions and Answers Edward Tilly Chief Executive Officer Alan Dean Executive Vice President, CFO and
Safe Harbor and Non-GAAP Measures
 Safe Harbor and Non-GAAP Measures Forward-Looking Statements This presentation contains statements about future events and expectations that constitute forward-looking statements. Forward-looking statements
2018 First Quarter Earnings Call. February 8, 2018
 2018 First Quarter Earnings Call February 8, 2018 Forward Looking Statements / Non-GAAP Measures This presentation contains information about management's view of the Company's future expectations, plans
For personal use only. Investor Update. January
 1 Investor Update January 2019 www.aspermont.com The leading media services provider to the global resources industry 2 Aspermont is ASX listed with offices in Australia, UK, Brazil, North America and
11-Year Consolidated Financial Highlights
 11-Year Consolidated Financial Highlights As of March 31, 2017 2007.3 2008.3 2009.3 2010.3 Net Sales ( million) 1,376,958 1,487,496 1,660,162 1,415,718 Operating Profit ( million) 162,315 70,048 65,204
FY2015 Annual Results August Brett McKeon - CEO David Bailey - CFO
 FY2015 Annual Results August 27 2015 Brett McKeon - CEO David Bailey - CFO FY2015 Financial Results Highlights Delivery on FY15 Prospectus forecasts Pro forma NPAT $19.3 million up 8.4% against IPO forecast
Overview of Earnings for Q2 FY2017
 Overview of Earnings for Q2 FY217 Your Exchange of Choice October 31, 217 I. Business Developments * This document is not subject to the audit procedures required under the Financial Instruments and Exchange
FINANCIAL RESULTS AND COMPANY OVERVIEW Second-Quarter Performance
 FINANCIAL RESULTS AND COMPANY OVERVIEW 08 Second-Quarter Performance September 5 th, 08 Disclaimer Forward-Looking Statements and Preliminary Results This presentation includes forward-looking statements
Q Results. May 2015
 Q1 2015 Results May 2015 Safe Harbor Forward-Looking Statements. Our presentation today, including the slides contained herein, contains "forwardlooking statements" within the meaning of the Private Securities
EARNINGS CALL. FISCAL 2018: Q1 RESULTS September 26, 2017
 EARNINGS CALL FISCAL 2018: Q1 RESULTS September 26, 2017 Disclaimer/Non-GAAP Information IMPORTANT NOTICE The following slides are part of a presentation by Darden Restaurants, Inc. (the "Company") and
BOARD OF DIRECTORS. James Flude Chief Financial Officer. Peter Cheung Executive Chairman. Steve Crossley Chief Executive Officer
 ANNUAL GENERAL MEETING YEAR ENDED 30 APRIL 2016 SEPTEMBER 2016 BOARD OF DIRECTORS Peter Cheung Executive Chairman Steve Crossley Chief Executive Officer James Flude Chief Financial Officer Joanne Lake
Highlights of Consolidated Results for the First Half and the Second Quarter of Fiscal Year ending March 31, 2016
 Highlights of Consolidated Results for the First Half and the Second Quarter of Fiscal Year ending March 31, 2016 (except for per share amounts) November 2, Six months ended Six months ended September
Financial Data Report CIEL LTD (THE GROUP) for the period ending 31.Dec.2017
 for the period ending 31.Dec.2017") Financial Data Report CIEL LTD (THE GROUP) for the period ending 31.Dec.2017 Equity Statistics Particulars Units 29-Dec-17 Current Market Price MUR 7.14 52 week H/L* MUR 7.94 / 6.26 Market Capitalisation
Financial Data Report CIEL LTD (THE GROUP) for the period ending 31.Dec.2017 Equity Statistics Particulars Units 29-Dec-17 Current Market Price MUR 7.14 52 week H/L* MUR 7.94 / 6.26 Market Capitalisation
[Insert Subheading] Click to edit Master text styles. Shop Direct Limited. Q1 FY19 Results. Three months ended 30 September 2018.
![[Insert Subheading] Click to edit Master text styles. Shop Direct Limited. Q1 FY19 Results. Three months ended 30 September 2018.](/thumbs/88/117149975.jpg "[Insert Subheading] Click to edit Master text styles. Shop Direct Limited. Q1 FY19 Results. Three months ended 30 September 2018.") [Insert Subheading] Click to edit Master text styles Shop Direct Limited Q1 FY19 Results Three months ended 30 September 2018 22 November 2018 1 Disclaimer This presentation (the Presentation ) has been
[Insert Subheading] Click to edit Master text styles Shop Direct Limited Q1 FY19 Results Three months ended 30 September 2018 22 November 2018 1 Disclaimer This presentation (the Presentation ) has been
Financial Data Report LOTTOTECH LIMITED. for the period ending 31.Dec.2017
 Financial Data Report LOTTOTECH LIMITED for the period ending 31.Dec.2017 Equity Statistics Particulars Units 29-Dec-17 Current Market Price MUR 7.30 52 week H/L* MUR 9.12 / 5.28 Market Capitalisation
FACT SHEET Q1 2018/19
 FACT SHEET Q 208/9 Sales adjusted for currency effects and portfolio changes grew by +2.8%; reported sales increased by +.7% to 6,879 m (+2.4% on a like-for-like basis); sound sales momentum with market
Overview of Earnings for Q2 FY2018
 Overview of Earnings for Q2 FY218 Your Exchange of Choice Japan Exchange Group, Inc. October 3, 218 Contents 1 Business Developments 2 Overview of Earnings for Q2 FY218 IFRS 3 Reference Materials I. Business
4th quarter 2016 results
 4th quarter 2016 results Improving momentum in Europe Jacques van den Broek, CEO Robert Jan van de Kraats, CFO Randstad Holding nv February 14, 2017 disclaimer & definitions Certain statements in this
UBS Global Financial Services Conference May 14, Joseph Saunders, Chief Executive Officer. Byron Pollitt, Chief Financial Officer
 UBS Global Financial Services Conference May 14, 2008 Joseph Saunders, Chief Executive Officer Byron Pollitt, Chief Financial Officer Safe Harbor Reminder The following materials and management s discussion
Forward-Looking Statement and Legends
 Forward-Looking Statement and Legends CAUTIONARY STATEMENT REGARDING FORWARD LOOKING STATEMENTS This presentation may contain forward-looking statements made pursuant to the safe harbor provisions of the
First Quarter 2015 Earnings Presentation. May 1, 2015
 First Quarter 2015 Earnings Presentation May 1, 2015 Agenda Strategic Review Financial Review Questions and Answers Edward Tilly Chief Executive Officer Alan Dean Executive Vice President, CFO and Treasurer
Materials for FY2014 2Q Results Briefing - Conference Call
 Materials for 2Q Results Briefing - Conference Call Nov. 19, 2014 (Wed) Contents Summary of FY 2014 2Q Results Consolidated Earnings for FY 2014 2Q Page 1-3 Domestic Non-life Insurance Companies Page 4-8
Financial Data Report SUN LIMITED (THE GROUP) for the period ending 31.Mar.2017
 for the period ending 31.Mar.2017") Financial Data Report SUN LIMITED (THE GROUP) for the period ending 31.Mar.2017 Equity Statistics Particulars Units 31-Mar-17 Current Market Price MUR 40.00 52 week H/L* MUR 40.00 / 32.80 Market Capitalisation
Financial Data Report SUN LIMITED (THE GROUP) for the period ending 31.Mar.2017 Equity Statistics Particulars Units 31-Mar-17 Current Market Price MUR 40.00 52 week H/L* MUR 40.00 / 32.80 Market Capitalisation
Financial & Business Highlights For the Year Ended June 30, 2017
 Financial & Business Highlights For the Year Ended June, 17 17 16 15 14 13 12 Profit and Loss Account Operating Revenue 858 590 648 415 172 174 Investment gains net 5 162 909 825 322 516 Other 262 146
2016 Fourth-Quarter and Fiscal Year Performance
 206 Fourth-Quarter and Fiscal Year Performance Financial Results and Company Highlights March 4, 207 Disclaimers Forward-Looking Statements and Preliminary Results This presentation includes forward-looking
For personal use only
 2018 Annual General Meeting of Helloworld Travel Limited 15 November 2018 1 Disclaimer The information contained in these materials or discussed at the presentation is not intended to be an offer for subscription,
Amadeus Jan - Sep 2014 Results
 Amadeus Jan - Sep 2014 Results November 6, 2014 Disclaimer This presentation may contain certain statements which are not purely historical facts, including statements about anticipated or expected future