Consumer Analyst Group of New York Michael B. Polk President and Chief Executive Officer
|
|
|
- Allison Lucas
- 6 years ago
- Views:
Transcription


1 February 21, 2014 Consumer Analyst Group of New York Michael B. Polk President and Chief Executive Officer
2 Forward looking statements Statements in this press release that are not historical in nature constitute forward-looking statements. These forward-looking statements relate to information or assumptions about the effects of sales, income/(loss), earnings per share, operating income, operating margin or gross margin improvements or declines, Project Renewal, capital and other expenditures, cash flow, dividends, restructuring and restructuring-related costs, costs and cost savings, inflation or deflation, particularly with respect to commodities such as oil and resin, debt ratings, and management's plans, projections and objectives for future operations and performance. These statements are accompanied by words such as "anticipate," "expect," "project," "will," "believe," "estimate" and similar expressions. Actual results could differ materially from those expressed or implied in the forward-looking statements. Important factors that could cause actual results to differ materially from those suggested by the forward-looking statements include, but are not limited to, our dependence on the strength of retail, commercial and industrial sectors of the economy in light of the continuation or escalation of the global economic slowdown or regional sovereign debt issues; currency fluctuations; competition with other manufacturers and distributors of consumer products; major retailers' strong bargaining power; changes in the prices of raw materials and sourced products and our ability to obtain raw materials and sourced products in a timely manner from suppliers; our ability to develop innovative new products and to develop, maintain and strengthen our end-user brands; product liability or regulatory actions; our ability to expeditiously close facilities and move operations while managing foreign regulations and other impediments; a failure of one of our key information technology systems or related controls; the potential inability to attract, retain and motivate key employees; future events that could adversely affect the value of our assets and require impairment charges; our ability to improve productivity and streamline operations; changes to our credit ratings; significant increases in the funding obligations related to our pension plans due to declining asset values, declining interest rates or otherwise; the imposition of tax liabilities greater than our provisions for such matters; the risks inherent in our foreign operations; our ability to consummate the transactions contemplated by the Accelerated Share Repurchase Plan; and those factors listed in the company s most recently filed Quarterly Report on Form 10-Q and Exhibit 99.1 thereto, filed with the Securities and Exchange Commission. Changes in such assumptions or factors could produce significantly different results. The information contained in this news release is as of the date indicated. The company assumes no obligation to update any forward-looking statements contained in this news release as a result of new information or future events or developments. This presentation contains non-gaap financial measures within the meaning of Regulation G promulgated by the Securities and Exchange Commission and includes a reconciliation of these non-gaap financial measures to the most directly comparable financial measures calculated in accordance with GAAP. The company uses certain financial measures that are included in this press release and the additional financial information both in explaining its results to stockholders and the investment community and in its internal evaluation and management of its businesses. The company s management believes that these measures - including those that are non-gaap financial measures - and the information they provide are useful to investors since these measures (a) permit investors to view the company s performance using the same tools that management uses to evaluate the company s past performance, reportable business segments and prospects for future performance and (b) determine certain elements of management s incentive compensation. The company s management believes that core sales, as reflected in the Currency Analysis, is useful to investors because it demonstrates the effect of foreign currency on reported sales. The effect of foreign currency on reported sales is determined by applying a fixed exchange rate, calculated as the 12-month average in 2012, to the current and prior year local currency sales amounts, with the difference in these two amounts being the change in core sales and the difference between the change in as reported sales and the change in core sales reported as the currency impact. The company s management believes that normalized gross margin, normalized SG&A expense, normalized operating income and normalized tax rates are useful because they provide investors with a meaningful perspective on the current underlying performance of the company s core ongoing operations. The company s management believes that normalized earnings per share, which excludes restructuring and restructuringrelated charges and one-time events such as losses related to the extinguishments of debt, tax benefits and charges, impairment charges, discontinued operations and certain other items, is useful to investors because it permits investors to better understand year-over-year changes in underlying operating performance. The company also uses both core sales and normalized earnings per share as two of the three performance criteria in its management cash bonus plan. The company determines the tax effect of the items excluded from normalized diluted earnings per share by applying the estimated effective rate for the applicable jurisdiction in which the pre-tax items were incurred, and for which realization of the resulting tax benefit, if any, is expected. While the company believes that these non-gaap financial measures are useful in evaluating the company s performance, this information should be considered as supplemental in nature and not as a substitute for or superior to the related financial information prepared in accordance with GAAP. Additionally, these non-gaap financial measures may differ from similar measures presented by other companies. INVESTOR RELATIONS CONTACTS: Nancy O Donnell VP, Investor Relations (770) nancy.odonnell@newellco.com Alisha Dubique Sr. Manager, Investor Relations (770) alisha.dubique@newellco.com 2


3 Nearly $6bn business of leading brands 3

4 Clear corporate strategy 4


5 Three phase transformation well underway WE ARE HERE DELIVERY STRATEGIC ACCELERATION consistently do what we say shape the future accelerate performance Core Sales +2-3% EPS* +3-6% * Normalized EPS Core Sales +3-4% EPS* +5-8% Core Sales >4% EPS* +6-9% 5


6 Changing from holding company to operating company 26 Global Business Units 13 Global Business Units 5 Global Operating Segments 6


7 New operating model deployed 1 2 Pillars supported by Development Delivery Finance / IT 3 Functions and 4 Winning Capabilities driving accelerated performance in 5 Operating Segments R&D Design Marketing Customer Development Supply Chain Legal HR Writing Commercial Tools Home Solutions Baby 7

8 Project Renewal enabling reinvestment $ Millions Actual through 2013 Phase I Phase II Total Renewal Costs $215 $90 - $100 $250 - $275 $340 - $375 Savings On Plan ~$200M to date $90 - $100 $180 - $225 $270 - $325 payback ~1.5 years 8

9 Consistently delivering while simultaneously changing +2.6%* %* % 2013 *Restated to reflect the reclassification of divested businesses to discontinued operations 9
10 Earnings performance strengthening Normalized EPS $1.83 $1.42 $1.56 $1.67 Record Newell Rubbermaid Normalized EPS $ See reconciliation of reported EPS to normalized EPS in the appendix 10


11 Creating value for shareholders Strong Share Price Appreciation Significant Dividend Increase $0.20 Dividend $0.60 Dividend Source: Bigcharts.com (July 1, 2011 to February 14, 2014) 11
12 Cash provides options on the future 2014 to 2018 Operating cash flow $4.0B Operating cash flow $3.5B Dividends $1.2B Share repurchase $0.3B Capex $0.8B $1.7B Uncommitted Cash Flow Uncommitted cash flow provides flexibility to: Increase dividend beyond 35% payout ratio Increase share repurchases beyond existing authorizations M&A Plus, nearly $2B borrowing capacity at current credit ratings 12
13 Investment thesis strong Growth Game Plan is clear strategic blueprint Cost savings give visibility to investment and earnings Sharper portfolio choices, strengthened capabilities, and increased investment accelerates growth Strong, growing free cash flow enables returns to shareholders and external development 13


14 Three sources of value Strengthening portfolio for growth Strengthening margins for investment Strong cash flow enhances TSR 14
15 Brands compete in unconsolidated global markets HOME MARKET* POSITION TOP 2 BRANDS GLOBAL SHARE # 1 <20% # 1 <35% # 2 <20% # 1 <30% # 1 <25% * Home Market USA for all businesses except Baby with two home markets (Japan; USA); Lenox share of band saw blades; Irwin share of hand tools 15

16 Markets with room to grow 16

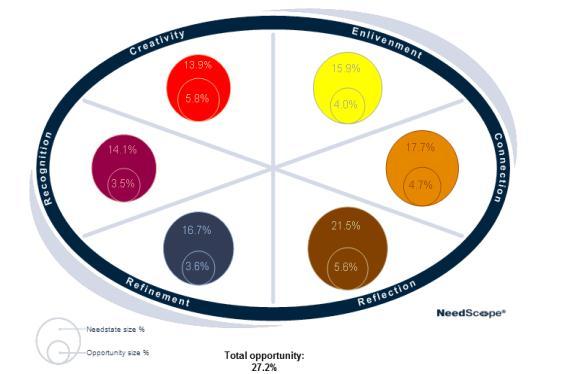
17 Growth Game Plan sources of growth 30% 25% 45% 17
18 Investment governed by clear portfolio choices grow aggressively grow profitably Writing Commercial Tools Home Solutions Baby strengthen brands, innovation and support self fund innovation and support 18

19 Baby demonstrates model at work Baby Segment +9.8% 2012 core growth +10.2% 2013 core growth Normalized Operating Income $M $53 $ $ $92 19


20 Confident impact can be applied more broadly US Paper Mate InkJoy POS during media period (blue bar) YOY, 2013 vs 2012 TV GRPS **Food, Drug, Mass channels 20

21 More than double the number of campaigns in


22 Stronger 2014 innovation and marketing Clear Point Mix n Match 22


23 Stronger 2014 innovation and marketing 23


24 Stronger 2014 innovation and marketing Next Generation Stick Stroller Next Generation Sticks New Swing System 24


25 Stronger 2014 innovation and marketing 25


26 Stronger 2014 innovation and marketing 26


27 Geographic expansion requires a reset of our margins operating income margin % full portfolio, local needs and local price points DEVELOPED EMERGING investment in sales and marketing enabled by reducing high cost in developed world 27


28 Underway in Latin America... LATAM Core Sales Growth* % +14.9% +14.6% +26.6% *2010 and 2011 do not reflect impact of discontinued operations (impact not material) 28


29 Stronger 2013/14 innovation driving deployment Wave 1 Brazil Wave 2 Brazil 29


30 Asia next... insights form the foundation Teens Mothers Teachers Retailers Products Mapping Market 30
31 Four winning capabilities will fuel momentum 31
32 New marketing and insights function Diverse, global leadership One creative and one media buying agency 3 global marketing centers Increased advertising investment in 2013 Ten big campaigns in 2014 Greater than 50% more people and 100% more investment in insights 32

33 Yielding strong product concept test results Concept Test Results 33
34 Strengthening innovation funnel quantity and quality 34
35 Purpose built design facility coming on line Opens Q /40 blend of inside and outside talent All industrial and graphic design resources in one community New Advanced Technology team in place New ideation process in place across all businesses yielding over 3000 idea fragments feeding concept development 35
36 Five focused supply chain disciplines Plan Source Make Deliver Serve 36
37 Supply Chain unlocking costs for future reinvestment Strengthened 2015/16 innovation funnel will require new brand investment beyond Project Renewal New global sourcing organization (FG, Commodity, Indirect) Four sources of savings: Productivity (product and process) Sourcing Distribution network optimization (EMEA, NA) Continued manufacturing network optimization New value engineering funnel process established 37
38 Customer Development Organization scales impact Strong US growth trends validates CDO model Big new distribution wins New Customer Collaboration capabilities in category management, shopper insight, and joint business planning New in store visibility catalog and merchandising drive periods New simplified US terms of sales program and returns policy CDO model extended to Canada and Australia/New Zealand 38

39 Rapid development of our ecommerce capability 39
40 Reaffirm full year guidance FY 2014 Outlook* Core Sales 3% to 4% Currency ~ -1.0% Net Sales Growth 2% to 3% Normalized Operating Margin Up to +40 basis points Normalized EPS** $1.94 to $2.00 Cash Flow from Operations $600 to $650 million Capital Expenditures $150 to $175 million * Reflects outlook communicated in the January 31, 2014 Q Earnings Release and Earnings Call ** See reconciliation included in the Appendix 40
41 Growth Game Plan is our blueprint 41
42 Building large, profitable anchor categories Writing Tools Commercial Products Baby Home Solutions 42
43 Cash generative business provides options on that future 2014 to 2018 Operating cash flow $4.0B Operating cash flow $3.5B Dividends $1.2B Share repurchase $0.3B Capex $0.8B $1.7B Uncommitted Cash Flow Uncommitted cash flow provides flexibility to: Increase dividend beyond 35% payout ratio Increase share repurchases beyond existing authorizations M&A Plus, nearly $2B borrowing capacity at current credit ratings 43
44 Our confidence has strengthened Clear strategy Strong, seasoned leadership team Major increase in funds for investment or earnings Disciplined, strategic approach to resource allocation Organization consistently delivers while driving change 44
45 February 21, 2014 Consumer Analyst Group of New York Michael B. Polk President and Chief Executive Officer
46 Appendix: Non-GAAP reconciliations 46
47 Reconciliation: Normalized earnings per share Diluted earnings per share, as reported $ 1.63 $ 1.37 $ 0.42 $ 0.96 $ 0.97 Impairment charges Restructuring and restructuring-related charges Currency impacts - Venezuela (0.01) 0.01 Discontinued operations (0.19) (0.03) 0.21 (0.09) (0.11) CEO transition costs Convertible notes dilution Losses on extinguishments of debt* Income tax items (0.03) 0.08 (0.17) (0.21) 0.01 Diluted earnings per share, normalized $ 1.83 $ 1.67 $ 1.56 $ 1.42 $ 1.21 Normalized EPS growth 10% 7% 10% 17% * For 2010, includes certain share impacts of the Capital Structure Optimization Plan. Totals may not add due to rounding. 47
48 Reconciliation: Total company core sales As Reported Core Sales (1) Year-Over-Year Increase (Decrease) 2013 Sales 2012 Sales 2011 Sales Currency Excluding Including Currency Change Change Impact Currency Currency Impact $ $ $ $ $ $ 5, , , , $ (66.4) 3.2% 2.0% (1.2)% Currency Excluding Including Currency Change Change Impact Currency Currency Impact $ $ $ $ $ $ 5, , , , $ (91.0) 2.9% 1.2% (1.7)% Currency Excluding Including Currency Change Change Impact Currency Currency Impact $ $ $ $ $ $ 5, , , , $ % 4.6% 2.0% (1) "Core Sales" is determined by applying a fixed exchange rate, calculated as the 12-month average in the prior year, to the current and prior year local currency sales amounts, with the difference between the change in "As Reported" sales and the change in "Core Sales" reported in the table as "Currency Impact". 48
49 Reconciliation: Baby segment core sales As Reported Core Sales (1) Year-Over-Year Increase (Decrease) Currency Excluding Including Currency Change Change Impact Currency Currency Impact 2013 Sales $ $ $ 53.2 $ $ $ 74.9 $ (21.7) 10.2% 7.2% (3.0)% Currency Excluding Including Currency Change Change Impact Currency Currency Impact 2012 Sales $ $ $ 55.7 $ $ $ 66.9 $ (11.2) 9.8% 8.2% (1.6)% (1) "Core Sales" is determined by applying a fixed exchange rate, calculated as the 12-month average in the prior year, to the current and prior year local currency sales amounts, with the difference between the change in "As Reported" sales and the change in "Core Sales" reported in the table as "Currency Impact". 49
50 Reconciliation: Baby segment operating income 2013 Operating income, normalized $ 92.0 Restructuring-related charges (1) (0.8) Operating income, as reported $ 91.2 (1) Restructuring-related charges incurred during the year ended December 31, 2013 relate to Project Renewal. 50
51 Reconciliation: Latin America core sales As Reported Core Sales (1) Year-Over-Year Increase (Decrease) Currency Excluding Including Currency Change Change Impact Currency Currency Impact 2013 Sales $ $ $ 57.1 $ $ $ 89.7 $ (32.6) 26.6% 17.0% (9.6)% Currency Excluding Including Currency Change Change Impact Currency Currency Impact 2012 Sales* $ $ $ 20.3 $ $ $ 46.5 $ (26.2) 14.6% 6.4% (8.2)% Currency Excluding Including Currency Change Change Impact Currency Currency Impact 2011 Sales* $ $ $ 51.6 $ $ $ 39.9 $ % 19.3% 4.4% Currency Excluding Including Currency Change Change Impact Currency Currency Impact 2010 Sales* $ $ $ 6.9 $ $ $ 36.8 $ (29.9) 14.0% 2.6% (11.4)% (1) "Core Sales" is determined by applying the prior year exchange rate to the current and prior year local currency sales amounts, with the difference between the change in "As Reported" sales and the change in "Core Sales" reported in the table as "Currency Impact". * sales amounts have not been adjusted for the hand torch and solder, Hardware and Teach businesses which have been reclassified to discontinued operations. 51
Morgan Stanley Global Consumer & Retail Conference Michael B. Polk President & Chief Executive Officer
 November 17, 2015 Morgan Stanley Global Consumer & Retail Conference Michael B. Polk President & Chief Executive Officer Forward-looking Statements Statements in this presentation that are not historical
Consumer Analyst Group of New York Michael B. Polk President & Chief Executive Officer
 Consumer Analyst Group of New York Michael B. Polk President & Chief Executive Officer February 17, 2015 Forward-looking Statements Statements in this presentation that are not historical in nature constitute
Q Earnings Call Presentation
 Q4 2014 Earnings Call Presentation January 30, 2015 Forward-looking Statements Statements in this presentation that are not historical in nature constitute forward-looking statements. These forward-looking
Q Earnings Call Presentation
 Q2 2014 Earnings Call Presentation July 31, 2014 Forward-looking Statements Statements in this presentation that are not historical in nature constitute forward-looking statements. These forward-looking
Newell Rubbermaid Raises Full Year Guidance on Strong Second Quarter Results
 Newell Rubbermaid Raises Full Year Guidance on Strong Second Quarter Results Jul 31, 2015 Second Quarter Executive Summary 5.1% Core Sales Growth and Normalized EPS of $0.64 3.9% Net Sales Growth and Reported
Newell Rubbermaid Announces First Quarter Results
 Newell Rubbermaid Announces First Quarter Results» Reaffirms Full Year Guidance» Increases Quarterly Dividend 13 percent to $0.17 per share ATLANTA, May 2, 2014 Newell Rubbermaid (NYSE: NWL) today announced
Raymond James Institutional Investors Conference John K. Stipancich Executive Vice President, Chief Financial Officer
 March 4, 2015 Raymond James Institutional Investors Conference John K. Stipancich Executive Vice President, Chief Financial Officer Forward-looking Statements Statements in this presentation that are not
Newell Rubbermaid Announces Solid Third Quarter Results
 Newell Rubbermaid Announces Solid Third Quarter Results» 2014 and 2015 Full Year Guidance reaffirmed» Next phase of Project Renewal restructuring approved» Intention to sell Endicia online postage business
Newell Rubbermaid Reports Strong Fourth Quarter Results
 Newell Rubbermaid Reports Strong Fourth Quarter Results - 6.2% Core Sales Growth; 4.4% Core Sales Growth excluding Venezuela - Normalized EPS $0.56, a 14.3% Increase versus Prior Year - Net Sales Growth
Newell Rubbermaid Announces Strong First Quarter Results
 Newell Rubbermaid Announces Strong First Quarter Results» 4.7% Core Sales Growth and Normalized EPS of $0.36» 4.1% Net Sales Growth and Reported EPS of $0.20» Affirms 2015 Full Year Guidance» Expands Project
Newell Rubbermaid Reports Third Quarter 2011 Results and Reaffirms Full Year 2011 Guidance
 Newell Rubbermaid Reports Third Quarter 2011 Results and Reaffirms Full Year 2011 Guidance» Net Sales Growth of 5.8%; Core Sales Growth of 3.3%» Normalized EPS of $0.45» Announces Project Renewal: A Plan
Newell Brands Announces Strong Second Quarter Results
 News Release Newell Brands Announces Strong Second Quarter Results Net Sales Growth of 147.2% Core Sales Growth of 5.0% Deleveraging on Track Reaffirms 2016 Guidance Second Quarter 2016 Executive Summary
Newell Brands Announces Strong Fourth Quarter and Full Year Results
 News Release Newell Brands Announces Strong Fourth Quarter and Full Year Results 2016 Full Year Growth 124.2 Percent 2016 Full Year Core Sales Growth 3.7 Percent 2016 Full Year Reported EPS $1.25 and Normalized
Morgan Stanley Global Consumer and Retail Conference
 Morgan Stanley Global Consumer and Retail Conference November 15, 2016 Michael B. Polk - Chief Executive Officer live. learn. work. play. 1 Forward-looking statements Statements in this presentation that
Newell Brands Announces Third Quarter Results
 News Release Newell Brands Announces Third Quarter Results Growth of 158.5%; Core Sales Growth of 3.0% New Strategic Plan Transformation into Action Raises 2016 Guidance to Top Half of Range Provides 2017
Consumer Analyst Group of New York Michael B. Polk, President & Chief Executive Officer. 19 February, 2016
 Consumer Analyst Group of New York Michael B. Polk, President & Chief Executive Officer 19 February, 2016 Forward-looking Statements Statements in this presentation that are not historical in nature constitute
Newell Brands Announces Strong First Quarter Results
 Newell Brands Announces Strong First Quarter Results Net Sales Growth 148.4 Percent; Core Sales Growth 2.5 Percent Reported EPS $1.31; Normalized EPS $0.34 Raised 2017 Normalized EPS Guidance Range Increased
Newell Brands Announces Third Quarter 2018 Results
 News Release Newell Brands Announces Third Quarter 2018 Results Delivers Sequential Improvement in All Segments and Regions Reaffirms Full Year and Operating Cash Flow Guidance Increases Full Year Normalized
Deutsche Bank Global Consumer Conference
 Deutsche Bank Global Consumer Conference Michael B. Polk - Chief Executive Officer June 15, 2017 live. learn. work. play. 1 Forward-looking Statements Forward-looking statements in this presentation are
Newell Brands Announces Fourth Quarter and Full Year 2018 Results
 News Release Newell Brands Announces Fourth Quarter and Full Year 2018 Results Delivered Sequential Improvement in All Segments Completed Divestitures of Jostens and Pure Fishing Repaid $2.6 Billion of
Q Earnings Presentation
 Q1 2017 Earnings Presentation May 8, 2017 live. learn. work. play. 1 Forward-looking Statements Forward-looking statements in this presentation are made in reliance upon the safe harbor provisions of the
NEWELL BRANDS INC. (Exact name of registrant as specified in its charter)
") UNITED STATES SECURITIES AND EXCHANGE COMMISSION Washington, D.C. 20549 FORM 8-K Current Report Pursuant to Section 13 or 15(d) of the Securities Exchange Act of 1934 Date of report (Date of earliest event
UNITED STATES SECURITIES AND EXCHANGE COMMISSION Washington, D.C. 20549 FORM 8-K Current Report Pursuant to Section 13 or 15(d) of the Securities Exchange Act of 1934 Date of report (Date of earliest event
Newell Brands Announces Fourth Quarter and Full Year 2017 Results
 Newell Brands Announces Fourth Quarter and Full Year 2017 Results Strong Operating Cash Flow of $990 Million Reported EPS $3.38; Normalized EPS $0.68 Repaid $1.4 Billion in Debt and Returned $581 Million
Newell Brands Announces Second Quarter 2018 Results
 News Release Newell Brands Announces Second Quarter 2018 Results Drives Accelerated Transformation Plan Into Action Adjusts Guidance for Divestitures of Waddington and Rawlings Announces New Reporting
NEWELL BRANDS INC. (Exact name of registrant as specified in its charter)
") UNITED STATES SECURITIES AND EXCHANGE COMMISSION Washington, D.C. 20549 FORM 8-K Current Report Pursuant to Section 13 or 15(d) of the Securities Exchange Act of 1934 Date of report (Date of earliest event
UNITED STATES SECURITIES AND EXCHANGE COMMISSION Washington, D.C. 20549 FORM 8-K Current Report Pursuant to Section 13 or 15(d) of the Securities Exchange Act of 1934 Date of report (Date of earliest event
Q Earnings Call Presentation. April 29, 2011
 Q1 2011 Earnings Call Presentation April 29, 2011 Forward-Looking Statement Statements in this presentation that are not historical in nature constitute forward-looking statements. These forward-looking
Q2 FISCAL 2019 EARNINGS PRESENTATION. October 19, 2018
 Q2 FISCAL 2019 EARNINGS PRESENTATION October 19, 2018 SAFE HARBOR STATEMENT Certain statements included in this presentation are "forward-looking statements" within the meaning of the federal securities
Healthcare is changing We re changing healthcare. George S. Barrett Chairman and Chief Executive Officer
 Healthcare is changing We re changing healthcare. George S. Barrett Chairman and Chief Executive Officer 25th Annual Credit Suisse Healthcare Conference Tuesday, November 8th Copyright 2016, Cardinal Health,
Waste Management Announces Fourth Quarter and Full-Year 2013 Earnings
 Waste Management Announces Fourth Quarter and Full-Year 2013 Earnings February 18, 2014 Company sees strong cash generation in 2013 and expects continued strength in 2014 HOUSTON--(BUSINESS WIRE)--Feb.
Best Buy Reports Fourth Quarter and Fiscal Year Results
 Best Buy Reports Fourth Quarter and Fiscal Year Results 0.9% Fourth Quarter Domestic Comparable Store Sales Increase $965 Million Adjusted Annual Free Cash Flow $150 Million in Phase One Renew Blue Cost
2016 Fourth Quarter February 22, 2017
 2016 Fourth Quarter February 22, 2017 Safe Harbor Disclaimer Cautionary Statement Regarding Forward-Looking Statements We have made statements in this document that are forward-looking statements within
Q2 Fiscal 2017 Earnings Commentary
 Q2 Fiscal 2017 Earnings Commentary August 31, 2017 The financial measures discussed below include both GAAP and adjusted non-gaap financial measures. In connection with the restructuring of its ivivva
A Winning Combination: Creating a Consumer Goods Powerhouse
 A Winning Combination: Creating a Consumer Goods Powerhouse December 14, 2015 Forward-Looking Statements Statements in this presentation that are not historical in nature constitute forward looking statements.
Third Quarter 2018 Earnings. (Unaudited Results) October 25, 2018
 October 25, 2018") Third Quarter 2018 Earnings (Unaudited Results) October 25, 2018 Forward-Looking Statements This presentation contains a number of forward-looking statements within the meaning of the Private Securities
Third Quarter 2018 Earnings (Unaudited Results) October 25, 2018 Forward-Looking Statements This presentation contains a number of forward-looking statements within the meaning of the Private Securities
McCormick & Company, Inc. 4 th Quarter 2015 Financial Results and Business Outlook January 28, 2016
 McCormick & Company, Inc 4 th Quarter 2015 Financial Results and Business Outlook January 28, 2016 The following slides accompany a January 28, 2016 presentation to investment analysts This information
2018 Financial Outlook
 2018 Financial Outlook Nick Gangestad Senior Vice President and Chief Financial Officer December 12, 2017 1 Agenda Executing on our 2016 2020 plan Tracking to the top-half of 2017 full-year organic growth
Q Supplemental Information. November 2, 2018
 Q3 2018 Supplemental Information November 2, 2018 1 Forward-Looking Statements Some of the statements in this presentation, particularly those anticipating future financial performance, business prospects,
Avery Dennison Jefferies Industrials Conference
 Avery Dennison Jefferies Industrials Conference August 9, 2016 Anne Bramman SVP and Chief Financial Officer 1 Avery Dennison Investor Presentation Forward-Looking Statements Certain statements contained
Our Transformation Continues. March 21, 2018
 Our Transformation Continues March 21, 2018 Disclosure Regarding Forward-Looking Statements Forward-Looking Statements and Factors That May Affect Future Results: Throughout this presentation, we make
Healthcare is changing We re changing healthcare. George S. Barrett Chairman and Chief Executive Officer
 Healthcare is changing We re changing healthcare. George S. Barrett Chairman and Chief Executive Officer 35th Annual J.P. Morgan Healthcare Conference Monday, January 9, 2017 Copyright 2017, Cardinal Health,
Best Buy Reports Better-than-Expected Fourth Quarter Earnings
 Best Buy Reports Better-than-Expected Fourth Quarter Earnings GAAP Diluted EPS Increased 37% to $1.91 Non-GAAP Diluted EPS Increased 27% to $1.95 Full Year GAAP and Non-GAAP Diluted EPS Increased 63% and
Waste Management Announces First Quarter Earnings
 Waste Management Announces First Quarter Earnings April 29, 2015 Disciplined Core Price Growth and Continued Cost Control Focus Contributed to Solid Quarter Company Reaffirms Full-Year Guidance HOUSTON--(BUSINESS
2017 First Quarter May 3, 2017
 2017 First Quarter May 3, 2017 Safe Harbor Disclaimer Cautionary Statement Regarding Forward-Looking Statements We have made statements in this document that are forward-looking statements within the meaning
FISCAL 4Q 2017 RESULTS
 FISCAL 4Q 2017 RESULTS AUGUST 3 rd, 2017 http://ir.supermicro.com SAFE HARBOR STATEMENT This presentation contains forward-looking statements within the meaning of Section 27A of the Securities Act of
Q UPDATE. November 1, 2018
 Q3 2018 UPDATE November 1, 2018 SAFE HARBOR STATEMENT This webcast presentation contains a number of forward-looking statements. Words such as "enhance, "encouraged," "believe," confident, feel, "position,"
Our Transformation Continues Sidoti NDR May 29-30, 2018
 Our Transformation Continues Sidoti NDR May 29-30, 2018 Disclosure Regarding Forward-Looking Statements Forward-Looking Statements and Factors That May Affect Future Results: Throughout this presentation,
Quad/Graphics, Inc. Call to Review Definitive Agreement to Acquire LSC Communications, Inc. and 3 rd Quarter 2018 Results.
 Quad/Graphics, Inc. Call to Review Definitive Agreement to Acquire LSC Communications, Inc. and 3 rd Quarter 2018 Results October 31, 2018 Call Participants Joel Quadracci Chairman, President & Chief Executive
Investor Contact: Will Gabrielski Vice President, Investor Relations
 Press Release Investor Contact: Will Gabrielski Vice President, Investor Relations 213.593.8208 William.Gabrielski@aecom.com Media Contact: Brendan Ranson-Walsh Vice President, Global Communications &
First-Quarter 2018 Earnings
 First-Quarter 208 Earnings Baxter International Inc. April 26, 208 Safe Harbor Statement This presentation includes forward-looking statements concerning Baxter s financial results, business development
4 th Quarter 2018 Earnings Call. February 20, 2019
 4 th Quarter 2018 Earnings Call February 20, 2019 Call Participants & Forward-Looking Statements Joel Quadracci Chairman, President & Chief Executive Officer Dave Honan Executive Vice President & Chief
Q EARNINGS CALL 2018 ANALYST AND INVESTOR CONFERENCE RECONCILIATION OF NON-GAAP MEASURES
 Q1 2017 EARNINGS CALL 2018 ANALYST AND INVESTOR CONFERENCE NON-GAAP MEASURES Management uses non-gaap financial measures, as further outlined in the following slides, because it considers them to be important
Earnings Conference Call Third Quarter 2016 October 28, :00 am ET
 Earnings Conference Call Third Quarter 2016 October 28, 2016 9:00 am ET Today s Presenters Kim Ann Mink, Ph.D. Chief Executive Officer and President Han Kieftenbeld SVP and Chief Financial Officer 2 Safe
McCormick & Company, Inc. 4th Quarter 2016 Financial Results and Outlook January 25, 2017
 McCormick & Company, Inc. 4th Quarter 2016 Financial Results and Outlook January 25, 2017 The following slides accompany a January 25, 2017 presentation to investment analysts. This information should
Fourth Quarter and Fiscal 2016 Results. 20 October 2016
 Fourth Quarter and Fiscal 2016 Results 20 October 2016 Safe harbor and non-gaap Cautionary Note Regarding Forward-Looking Statements: All statements in these materials and the related presentation that
2017 Third Quarter Business Review
 2017 Third Quarter Business Review (Unaudited) October 24, 2017 1 Earnings Conference Calls Q4: January 25, 2018 2018 Outlook Meeting December 12, 2017 8:00 a.m. - 12:00 p.m. EST 2 Forward looking statement
NCR Announces Fourth Quarter and Full Year 2018 Results
 NCR Corporation Logo NCR Announces Fourth Quarter and Full Year 2018 Results February 7, 2019 ATLANTA--(BUSINESS WIRE)--Feb. 7, 2019-- NCR Corporation (NYSE: NCR) reported financial results today for the
GENERAL MILLS. Fiscal 2018 Third Quarter Results. March 21, 2018
 GENERAL MILLS Fiscal 2018 Third Quarter Results March 21, 2018 A Reminder on Forward-looking Statements This presentation contains forward-looking statements within the meaning of the Private Securities
Sealed Air Reports Fourth Quarter and Full Year 2018 Results
 Exhibit 99.1 Sealed Air Corporation 2415 Cascade Pointe Blvd. Charlotte, NC 28208 For release: February 7, 2019 Sealed Air Reports Fourth Quarter and Full Year 2018 Results Solid year-over-year sales and
Q Investor Highlights. May 8, 2018
 Q1 2018 Investor Highlights May 8, 2018 Forward Looking Statements This document contains, and our other public communications may contain, forward-looking statements, that is, information related to future,
GAAP and Non-GAAP net revenues of $474 million, up 4% sequentially
 June 8, 2017 10:57 UTC Verifone Reports Financial Results for Second Quarter of Fiscal 2017 SAN JOSE, Calif.--(BUSINESS WIRE)-- Verifone (NYSE: PAY), a world leader in payments and commerce solutions,
McCormick & Company, Inc. 3rd Quarter 2017 Financial Results and Outlook September 28, 2017
 McCormick & Company, Inc. 3rd Quarter 2017 Financial Results and Outlook September 28, 2017 1 The following slides accompany a September 28, 2017 earnings release conference call. This information should
Korn Ferry Announces Second Quarter Fiscal 2019 Results of Operations
 FOR IMMEDIATE RELEASE Contacts: Investor Relations: Gregg Kvochak, (310) 556-8550 Media: Dan Gugler, (310) 226-2645 Korn Ferry Announces Second Quarter Fiscal 2019 Results of Operations Highlights Korn
Second Quarter 2018 Earnings (Unaudited Results) July 25, Mattel, Inc. All Rights Reserved.
 July 25, Mattel, Inc. All Rights Reserved.") Second Quarter 2018 Earnings (Unaudited Results) July 25, 2018 FORWARD-LOOKING STATEMENTS: This presentation contains a number of forward-looking statements within the meaning of the Private Securities
Second Quarter 2018 Earnings (Unaudited Results) July 25, 2018 FORWARD-LOOKING STATEMENTS: This presentation contains a number of forward-looking statements within the meaning of the Private Securities
THE GLOBAL HOUSE OF PRESTIGE BEAUTY FABRIZIO FREDA NOVEMBER 13, 2018 PRESIDENT AND CHIEF EXECUTIVE OFFICER
 THE GLOBAL HOUSE OF PRESTIGE BEAUTY NOVEMBER 13, 2018 FABRIZIO FREDA PRESIDENT AND CHIEF EXECUTIVE OFFICER FORWARD-LOOKING INFORMATION Statements in this presentation may constitute forward-looking statements
Waste Management Announces First Quarter Earnings
 FOR IMMEDIATE RELEASE Waste Management Announces First Quarter Earnings Revenue Grows 8.3%, Producing Strong Net Income and Cash Flow Earnings Per Diluted Share Grows More Than 15% HOUSTON April 26, 2017
Key results. "We have good momentum in the business with solid sales growth across Walmart U.S., Sam's Club and
 Walmart U.S. Q4 comps grew 2.6% and Walmart U.S. ecommerce sales grew 23%, Walmart U.S. full year comps grew 2.% and Walmart U.S. ecommerce sales grew 44%, Fiscal year GAAP EPS of 3.28; Adjusted EPS2 of
Q3 FISCAL 2019 EARNINGS PRESENTATION. January 18, 2019
 Q3 FISCAL 2019 EARNINGS PRESENTATION January 18, 2019 SAFE HARBOR STATEMENT Certain statements included in this presentation are "forward-looking statements" within the meaning of the federal securities
MATTEL REPORTS THIRD QUARTER 2017 FINANCIAL RESULTS
 MATTEL REPORTS THIRD QUARTER 2017 FINANCIAL RESULTS Third Quarter Highlights 1 Worldwide net sales down 13% as reported, and down 14% in constant currency; worldwide gross sales down 13% as reported, and
Rohm and Haas Company. Jacques M. Croisetière Executive Vice President and CFO Morgan Stanley Basic Materials Conference
 Rohm and Haas Company Jacques M. Croisetière Executive Vice President and CFO Morgan Stanley Basic Materials Conference 1 Forward Looking Statement The presentation today may include forward-looking statements
Credit Suisse 6 th Annual Industrials Conference November 2018
 Credit Suisse 6 th Annual Industrials Conference November 2018 Safe Harbor This presentation includes forward-looking statements which are statements that are not historical facts, including statements
Investor Deck December 2018
 Investor Deck December 2018 Safe Harbor This presentation includes forward-looking statements which are statements that are not historical facts, including statements that relate to the mix of and demand
Investor Presentation
 Investor Presentation Cautionary Note Regarding Forward-Looking Statements This presentation contains forward-looking information, including the Company s statements regarding its future outlook. In addition,
2017 First Quarter Business Review
 2017 First Quarter Business Review (Unaudited) April 25, 2017 1 Earnings Conference Calls Q2: July 25, 2017 Q3: October 24, 2017 2018 Outlook Meeting December 12, 2017 2 Upcoming 2017 investor events European
INSIGHT ENTERPRISES, INC. REPORTS RECORD THIRD QUARTER 2017 RESULTS AND CONFIRMS 2017 GUIDANCE
 FOR IMMEDIATE RELEASE NASDAQ: NSIT INSIGHT ENTERPRISES, INC. REPORTS RECORD THIRD QUARTER 2017 RESULTS AND CONFIRMS 2017 GUIDANCE TEMPE, AZ November 7, 2017 Insight Enterprises, Inc. (NASDAQ: NSIT) (the
Second Quarter 2018 Earnings
 Second Quarter 2018 Earnings John Visentin, CEO Bill Osbourn, CFO July 26, 2018 http://www.xerox.com/investor Forward-Looking Statements This presentation, and other written or oral statements made from
4th Quarter 2018 Earnings. Investor Presentation February 27, 2019
 4th Quarter 2018 Earnings Investor Presentation February 27, 2019 DISCLAIMER Forward Looking Statements This investor presentation contains statements reflecting our views about the future performance
Q4 AND FULL YEAR 2017 UPDATE FEBRUARY 16, 2018
 Q4 AND FULL YEAR 2017 UPDATE FEBRUARY 16, 2018 SAFE HARBOR STATEMENT Forward-looking Statements This webcast presentation contains a number of forward-looking statements. Words such as gain, drive, invest,
McCormick & Company, Inc. 2nd Quarter 2017 Financial Results and Outlook June 29, 2017
 McCormick & Company, Inc. 2nd Quarter 2017 Financial Results and Outlook June 29, 2017 1 The following slides accompany a June 29, 2017 presentation to investment analysts. This information should be read
Fiscal 2018 Third Quarter Results. 28 June 2018
 Fiscal 2018 Third Quarter Results 28 June 2018 Safe harbor and non-gaap Cautionary Note Regarding Forward-Looking Statements: All statements in these materials and the related presentation that are not
INVESTOR PRESENTATION Worldpay, Inc. All rights reserved.
 INVESTOR PRESENTATION 1 DISCLAIMER No Offer or Solicitation This presentation is provided for informational purposes only and is not intended to and shall not constitute an offer to sell or the solicitation
2017 Investment Community Meeting. Moving With Speed
 2017 Investment Community Meeting Moving With Speed Brett Biggs Walmart Finance Walmart uniquely positioned to win Win with customers Win with shareholders Update on expectations Financial strength Financial
GENERAL MILLS REPORTS FOURTH-QUARTER AND FULL-YEAR FISCAL 2018 RESULTS; PROVIDES 2019 OUTLOOK
 News/Information Investor Relations P. O. Box 1113 Minneapolis, MN 55440 FOR IMMEDIATE RELEASE June 27, 2018 Contact: (analysts) Jeff Siemon: 763-764-2301 (media) Bridget Christenson: 763-764-6364 GENERAL
Q3 Fiscal Year 2016 Financial Results January 20, 2016
 Q3 Fiscal Year 2016 Financial Results January 20, 2016 FORWARD-LOOKING STATEMENTS This presentation contains forward-looking statements within the meaning of the federal securities laws, including, without
2018 First Quarter Financial Results
 2018 First Quarter Financial Results April 30, 2018 2016 First Data Corporation. All Rights Reserved. Safe Harbor Statements in this presentation regarding First Data Corporation s business which are not
The J.M. Smucker Company
 The J.M. Smucker Company CONSUMER ANALYST GROUP OF NEW YORK CONFERENCE February 21, 2018 Strategy and Business Update Mark Smucker President and Chief Executive Officer Financial Update Mark Belgya Vice
Best Buy Reports Better-than-Expected Fourth Quarter Results
 Best Buy Reports Better-than-Expected Fourth Quarter Results Enterprise Comparable Sales Increased 9.0% GAAP Diluted EPS of $1.23 Non-GAAP Diluted EPS of $2.42 Announces FY19 Non-GAAP Diluted EPS Guidance
Q4 FY18 CARDINAL HEALTH, INC. EARNINGS CALL AUGUST 6, 2018
 Q4 FY18 CARDINAL HEALTH, INC. EARNINGS CALL AUGUST 6, 2018 1 Forward-looking statements and GAAP reconciliation Cautions Concerning Forward-Looking Statements This presentation contains forward-looking
Thank you and good morning everyone. Welcome to our second quarter 2018 business review.
 Q2 2018 Earnings Call Transcript Inge Thulin, Michael Roman & Nicholas Gangestad July 24, 2018 Slide 1, Cover Page Slide 2, Upcoming Investor Events Bruce Jermeland, Director of Investor Relations Thank
FORWARD-LOOKING STATEMENTS
 WWE INVESTOR PRESENTATION DECEMBER 2018 FORWARD-LOOKING STATEMENTS This presentation contains forward-looking statements pursuant to the safe harbor provisions of the Securities Litigation Reform Act of
Cardinal Health Annual Meeting of Shareholders. George S. Barrett Chairman and Chief Executive Officer November 8, 2017
 Cardinal Health Annual Meeting of Shareholders George S. Barrett Chairman and Chief Executive Officer November 8, 2017 Forward-looking statements and GAAP reconciliation This presentation contains forward-looking
IQVIA Reports Second-Quarter 2018 Results and Raises Full-Year 2018 Revenue and Profit Guidance
 News Release Contacts: Andrew Markwick, IQVIA Investor Relations (andrew.markwick@iqvia.com) +1.973.257.7144 Tor Constantino, IQVIA Media Relations (tor.constantino@iqvia.com) +1.484.567.6732 IQVIA Reports
Investor Presentation
 Investor Presentation Financial Information as of December 31, 2017 www.kimberly-clark.com Leading the world in essentials for a better life Highlights $18 billion global company founded in 1872 Products
Best Buy Reports Second Quarter Results
 Best Buy Reports Second Quarter Results Domestic Segment Revenue Increased 3.9% Non-GAAP Diluted EPS from Continuing Operations Increased 17% to $0.49 GAAP Diluted EPS from Continuing Operations Increased
AVNET, INC. (Exact name of registrant as specified in its charter)
") UNITED STATES SECURITIES AND EXCHANGE COMMISSION WASHINGTON, D.C. 20549 FORM 8-K CURRENT REPORT PURSUANT TO SECTION 13 OR 15(d) OF THE SECURITIES EXCHANGE ACT OF 1934 Date of Report (Date of earliest event
UNITED STATES SECURITIES AND EXCHANGE COMMISSION WASHINGTON, D.C. 20549 FORM 8-K CURRENT REPORT PURSUANT TO SECTION 13 OR 15(d) OF THE SECURITIES EXCHANGE ACT OF 1934 Date of Report (Date of earliest event
Strategy and Performance Overview. Please refer to for a reconciliation of non-gaap financial measures.
 Strategy and Performance Overview Please refer to www.lowes.com/investor for a reconciliation of non-gaap financial measures. EXECUTIVE SUMMARY Attractive Market Broad Customer Base Diverse Product Offering
Dave Carlucci Chairman and CEO IMS Health
 Dave Carlucci Chairman and CEO IMS Health 1 March 11, 2009 Safe Harbor Certain statements we make today are forward-looking within the meaning of the US federal securities laws. These statements include,
October 27, 2015 Media Contact: Dan Turner WILMINGTON, Del Investor Contact:
 October 27, 2015 Media Contact: Dan Turner WILMINGTON, Del. 302-996-8372 daniel.a.turner@dupont.com Investor Contact: 302-774-4994 DuPont Reports 3Q Operating EPS of $0.13; YTD Operating EPS of $2.49 Cost
UNITED STATES SECURITIES AND EXCHANGE COMMISSION Washington, D.C FORM 8-K
 UNITED STATES SECURITIES AND EXCHANGE COMMISSION Washington, D.C. 20549 FORM 8-K CURRENT REPORT Pursuant to Section 13 or 15(d) of the Securities Exchange Act of 1934 Date of Report (Date of earliest event
Q1 FISCAL 2019 EARNINGS PRESENTATION JULY 20, 2018
 Q1 FISCAL 2019 EARNINGS PRESENTATION JULY 20, 2018 SAFE HARBOR STATEMENT Certain statements included in this presentation are "forward-looking statements" within the meaning of the federal securities laws.
Successful Execution of Business Transformation Driving Sustainable Growth
 Successful Execution of Business Transformation Driving Sustainable Growth Fourth Quarter and Full-Year Fiscal 2017 Conference Call November 16, 2017 Preliminary Statements Forward Looking Statements This