Presented by: Mark P. Cantaluppi, CFO Reis, Inc. Canaccord Genuity 37 th Annual Growth Conference Boston, MA August 9, 2017
|
|
|
- Damian Gibbs
- 5 years ago
- Views:
Transcription

1 Presented by: Mark P. Cantaluppi, CFO Reis, Inc. Canaccord Genuity 37 th Annual Growth Conference Boston, MA August 9, 2017
2 DRAFT Disclaimer This presentation may include forward-looking statements which involve a number of risks and uncertainties that could cause actual results to differ materially from those described or implied in those forward-looking statements. These statements are based on currently available information and current management outlook or expectations. In addition, we do not plan to update any forward-looking statements to reflect subsequent events or circumstances or if our expectations change. For more information relating to the risks and uncertainties involved in our forward-looking statements and Reis generally, please see the Risk Factors and Cautionary Statement Regarding Forward-Looking Statements sections of our recent filings with the SEC, including our 2016 Annual Report on Form 10-K filed on March 9, 2017 and our June 30, 2017 Quarterly Report on Form 10-Q filed on August 1,


3 DRAFT Executive Summary Reis is a leading provider of U.S. commercial real estate ( CRE ) market and transaction-support information. Unique Proprietary Databases Diversified Customer Base Significant Growth Opportunities Subscription Business Model Attractive Financial Profile Compelling Industry Dynamics Strong Platform to Execute Growth Strategy 3
4 4 4
5 5

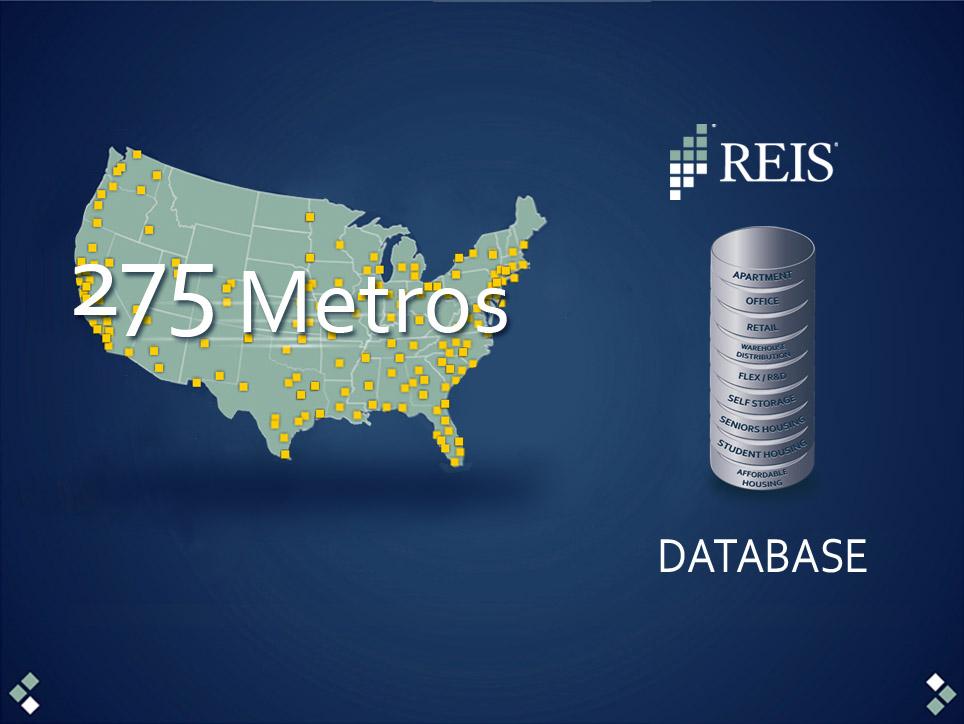
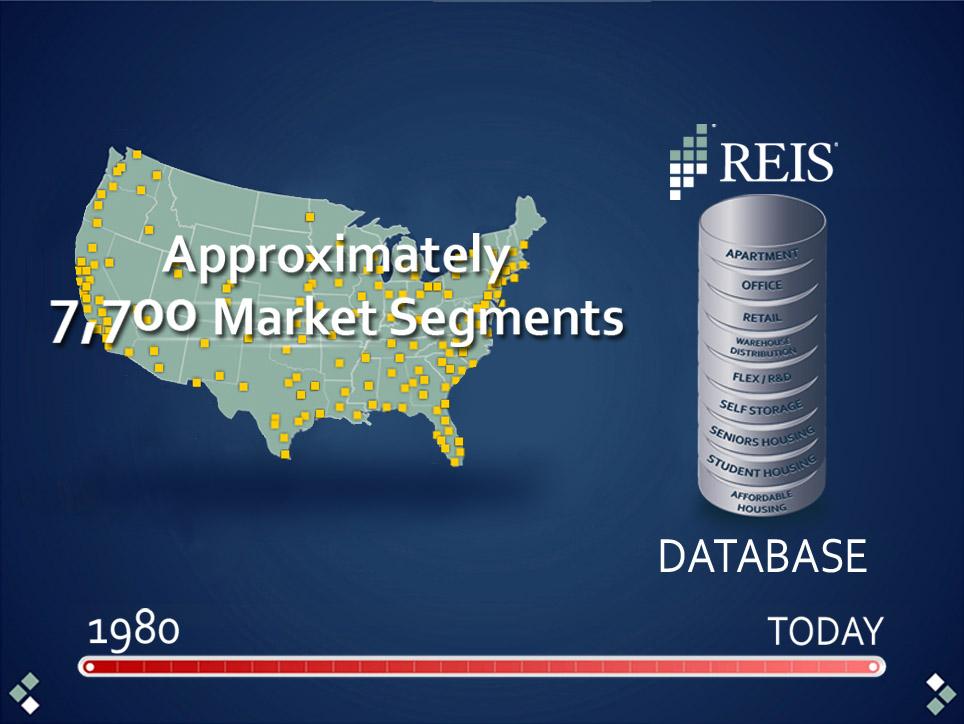
6 DRAFT Executive Summary Subscription-based business model with high revenue visibility, significant cash generation and substantial growth potential. Delivers proprietary CRE market information and analytics. Unrivaled depth of proprietary data on approximately 7,700 market areas and segments. 37 year history of data collection and aggregation; difficult to replicate. Blue-chip client base across wide spectrum of CRE and financial sectors. Outstanding platform to capture logically adjacent opportunities (space leasing and marketplace sectors). 6

7 Products Reis Portfolio CRE DESCRIPTION Primary delivery platform Data on rents, vacancy rates, absorption, lease terms, property sales and new construction activity Market-based trends, comparable properties, valuation and credit analysis Repurposes Reis SE market data to prosumers and smaller businesses Provides subset of information available to Reis SE subscribers Property and loan-level analyses of cash flows, collateral values and default risk Property valuation, credit analysis, recurring stress testing and benchmarking Custom data deliverables Other advisory services CUSTOMERS Property owners, developers, managers, banks and nonbank lenders, equity investors and service providers Smaller enterprises and individuals, professional investors, brokers, appraisers and other service providers Available to new and existing customers as an add-on to Reis SE Banks and lending institutions seeking CRE risk Management tools CMBS and equity investors PRICING / CONTRACT Annual and multi-year subscriptions ($1,000 $1 million+) averaging in the mid- $40,000s Prices of individual reports typically range up to $999 Monthly subscriptions in the low hundreds of dollars Annual subscriptions are also available Varies by client and usage Annual and multi-year subscriptions Low tens of thousands of dollars into the hundreds of thousand of dollars per year 7


8 Key Databases Property Type Markets Apartment 275 Office 190 Retail 190 Warehouse/Distribution 47 Flex/R&D 47 Self Storage 50 Seniors Housing 110 Student Housing 200 Affordable Housing 110 Totals 1,219 8

9 Curated Databases Curated databases for CRE professionals Reis s databases are carefully constructed and maintained. Competitive inventories are coded and sub-property types are defined. Historical property-level performance data is archived at the record level. Consistent samples ensure disciplined market trends. Not repositories of land use records of low value to CRE professionals. Only precisely designed and populated databases will succeed in the emerging analytics marketplace... 9
 List processing of brokerage feeds Websites and internet")
10 Data Collection Thousands of sources are accessed on an ongoing basis. Primary Research Methodologies Proprietary lists of brokers, managers and owners Individual telephonic surveys (1M+ calls placed annually) List processing of brokerage feeds Websites and internet searches Extensive database of market sources must be maintained Other Research Sources Utilized Planning and Zoning Boards Public Records (Deed recorders and Tax assessors) Building Directories Business and Trade Press Visiting selected markets 10


11 Premier Brand Name Reis is a trusted source for many of the nation s most well respected news organizations. 11

12 12

13 Client Composition 56% Debt Banks Non-Bank Lenders Investment Banks and Conduits Insurance Companies Government 83% Capital Providers 27% Equity Developers Real Estate Investment Trusts Investment Managers Opportunity Funds Pension Funds Private Investors 17% Service Providers Service Providers Appraisers Brokers Accountants Consultants Academia Government Note: Percentages in chart based on an analysis of Reis customers at December 31,


 Software providers: Property Mgmt.")
14 Growth Opportunities Content Expansion Greater property granularity Most recently: Sales Transactions Expansion - Land Affordable Housing Expanded Industrial Coverage Warehouse/Distribution Flex/R&D Self Storage Potential additions: Medical Office Data Centers International markets Analytical Tools APIs Q Market Analytics Q CRE Portfolio monitoring CCAR DFAST CECL CRE-backed Securities: REITs CMBS Custom data Acquisitions Regional data vendors (roll-up strategy) Software providers: Property Mgmt. Cash flow Budgeting Valuation Appraisers 14
15 Application Programming Interface (API) Proprietary Reis Database Property Level Data Market & Submarket Forecasts Analytics Apartment Self Storage Office Retail Student Housing Seniors Housing Affordable Housing Flex/R&D Warehouse/Dist. Industrial Application Programming Interface API System to system interaction instead of users accessing Customer makes data request to Reis API After validation and authorization, API returns data to customer Customer can tailor requests to meet needs of its business and users Customer seamlessly distributes data directly within organization, or automatically populates forms and documentation Customer Customer Network 15
16 Financial Performance 16

17 Historical Reis Services Performance Fiscal Years 2007 to 2016 (in millions) $55 $50 $45 $40 $35 $30 $25 $20 $15 $10 $5 $ % 40.8% 44.6% 44.9% % 39.3% 39.9% 40.9% 41.2% 35.9% % 90% 80% 70% 60% 50% 40% 30% 20% 10% 0% Reis Services EBITDA Total Revenue Margin Note: Results relate to the Reis Services segment. Please see Reis s SEC filings for information relating to Reis s consolidated results. 17
18 Financial Performance Metrics Revenue ($ in thousands) (Unaudited) Revenue (1): For the Three Months Ended June 30, For the Six Months Ended June 30, Increase Increase / (Decrease) Subscription Revenue $ 11,429 $ 11,369 $ % $ 23,008 $ 22,797 $ % Other Revenue % 827 1,641 (814) (49.6)% Total Revenue $ 11,709 $ 11,614 $ % $ 23,835 $ 24,438 $ (603) (2.5)% (1) In order to provide insight into relative performance, we have disaggregated total revenue into two components: Subscription and Other. Other revenue specifically includes revenue related to contracts for one-time custom data deliverables and one-time fees for settlements of previous unauthorized usage of Reis data. Please see Item 2 of our June 30, 2017 Quarterly Report on Form 10-Q filed with the SEC on August 1, 2017 for more information on revenue. 18
19 Financial Performance Metrics Reis Services EBITDA / Consolidated Adjusted EBITDA ($ in thousands) (Unaudited) For the Three Months Ended June 30, For the Six Months Ended June 30, (Decrease) (Decrease) Reis Services EBITDA $ 3,501 $ 4,127 $ (626) (15.2)% $ 6,790 $ 9,509 $ (2,719) (28.6)% Reis Services EBITDA Margin 29.9% 35.5% 28.5% 38.9% Consolidated Adjusted EBITDA $ 3,091 $ 3,651 $ (560) (15.3)% $ 5,679 $ 8,280 $ (2,601) (31.4)% Consolidated Adjusted EBITDA Margin 26.4% 31.4% 23.8% 33.9% Note: EBITDA and Adjusted EBITDA are non-gaap measures that senior management of Reis uses to measure operational and management performance, and may be appropriate for investors to use as a supplement to reported GAAP basis financial information for the Reis Services segment and on a consolidated basis. Please see our June 30, 2017 Quarterly Report on Form 10-Q filed with the SEC on August 1, 2017 for cautionary language about the use of EBITDA and Adjusted EBITDA and reconciliations of income from continuing operations to EBITDA and Adjusted EBITDA for the Reis Services segment and on a consolidated basis. 19
20 Consolidated Balance Sheets Condensed Balance Sheet Data June 30, 2017 December 31, 2016 Assets Cash $ 18,883 $ 21,491 Accounts Receivable, Net 9,309 10,744 Prepaid and Other Current and Non-Current Assets 6,371 6,347 Goodwill and Intangible Assets 73,907 72,747 Deferred Tax Assets, Net 17,965 16,815 Total Assets $ 126,435 $ 128,144 Liabilities and Stockholders Equity Debt (A) $ $ Deferred Revenue (B) 24,183 25,031 Other Liabilities 5,928 5,933 Total Liabilities 30,111 30,964 Stockholders Equity 96,324 97,180 Total Liabilities and Stockholder s Equity $ 126,435 $ 128,144 Common Shares Outstanding 11,512 11,272 (A) (B) (In thousands) The Company previously had a $10 million credit revolving facility with an interest at a rate of LIBOR % per annum, which was set to expire on October 16, 2015; however, the expiration dates were extended to January 31, On January 28, 2016, the Company entered into a new three-year agreement to renew and expand the revolving credit facility to $20 million, with terms substantially similar to the previous agreement and with an expiration date on January 28, Aggregate Revenue Under Contract (which is the sum of deferred revenue and future revenue under non-cancellable contracts for which we do not have the contractual right to bill) aggregated $48,346 and $50,959 at June 30, 2017 and December 31, 2016, respectively. At June 30, 2017, $33,136 relates to amounts under contract that will turn into revenue in the forward twelve month period through June 30, Please see our June 30, 2017 Quarterly Report on Form 10-Q, filed with the SEC on August 1, 2017, and our December 31, 2016 Annual Report on Form 10-K, filed with the SEC on March 9, 2017, for reconciliations to the most comparable GAAP financial measure. 20
21 DRAFT Investor Highlights Executive Summary Unique Proprietary Databases: Continuing development of three curated databases with a 37 year history of data. Growth Opportunities: The addition of new property types (affordable housing), the expansion of our sales transactions database (including the addition of land transactions), and the availability of the new API delivery platform will drive growth in 2017 and beyond. Excellent Revenue Visibility: Recurring revenue, digital delivery, subscription model (not ad-based). Strong Business Fundamentals: Our high renewal rates, strong margins and cost structure fuel significant cash flow creation. Predictable Dividend: Commenced a quarterly dividend program in May Current quarterly pay rate is $0.17 per common share or approximately a 3.5% yield. Significant Management Focus: Management and board members own approximately 22% of the Company. 21
22 Reis, Inc Avenue of the Americas 30 th Floor New York, NY (212) Lloyd Lynford, CEO Mark P. Cantaluppi, CFO
23 SUPPLEMENTAL INFORMATION
24 Reconciliations of Net Income to EBITDA and Adjusted EBITDA We define EBITDA as earnings (net income) before interest, taxes, depreciation and amortization. We define Adjusted EBITDA as earnings before interest, taxes, depreciation, amortization and stock based compensation. Although EBITDA and Adjusted EBITDA are not measures of performance calculated in accordance with GAAP, senior management uses EBITDA and Adjusted EBITDA to measure operational and management performance. Management believes that EBITDA and Adjusted EBITDA are appropriate supplemental financial measures to be considered in addition to the reported GAAP basis financial information which may assist investors in evaluating and understanding: (1) the performance of the Reis Services segment, the primary business of the Company and (2) the Company s consolidated results, from year to year or period to period, as applicable. Further, these measures provide the reader with the ability to understand our operational performance while isolating non-cash charges, such as depreciation and amortization expenses, as well as other non-operating items, such as interest income, interest expense and income taxes and, in the case of Adjusted EBITDA, isolates non-cash charges for stock based compensation. Management also believes that disclosing EBITDA and Adjusted EBITDA will provide better comparability to other companies in the information services sector. However, because EBITDA and Adjusted EBITDA are not calculated in accordance with GAAP, they may not necessarily be comparable to similarly titled measures employed by other companies. EBITDA and Adjusted EBITDA are presented both for the Reis Services segment and on a consolidated basis. We believe that these metrics, for Reis Services, provide the reader with valuable information for evaluating the financial performance of the core Reis Services business, excluding public company costs, and for making assessments about the intrinsic value of that standalone business to a potential acquirer. Management primarily monitors and measures its performance, and is compensated, based on the results of the Reis Services segment. EBITDA and Adjusted EBITDA, on a consolidated basis, allow the reader to make assessments about the current trading value of the Company s common stock, including expenses related to operating as a public company. However, investors should not consider these measures in isolation or as substitutes for net income (loss), operating income, or any other measure for determining operating performance that is calculated in accordance with GAAP. Reconciliations of EBITDA and Adjusted EBITDA to the most comparable GAAP financial measure, net income, follow for each identified period on a segment basis (including the Reis Services segment), as well as on a consolidated basis: (amounts in thousands) Reconciliation of Net Income to EBITDA and Adjusted EBITDA for the Three Months Ended June 30, 2017 By Segment Reis Services Other (A) Consolidated Net income... $ 397 Income tax expense Income (loss) before income taxes... $ 1,522 $ (984) 538 Add back: Depreciation and amortization expense... 1,947 1,947 Interest expense (income), net (1) 31 EBITDA... 3,501 (985) 2,516 Add back: Stock based compensation expense, net Adjusted EBITDA... $ 3,501 $ (410) $ 3,091 Reconciliation of Net Income to EBITDA and Adjusted EBITDA for the Three Months Ended June 30, 2016 By Segment Reis Services Other (A) Consolidated Net income... $ 941 Income tax expense Income (loss) before income taxes... $ 2,522 $ (1,001) 1,521 Add back: Depreciation and amortization expense... 1, ,586 Interest expense, net EBITDA... 4,127 (998) 3,129 Add back: Stock based compensation expense, net Adjusted EBITDA... $ 4,127 $ (476) $ 3,651 See footnotes on next page. i
25 (amounts in thousands) Reconciliation of Net Income to EBITDA and Adjusted EBITDA for the Six Months Ended June 30, 2017 By Segment Reis Services Other (A) Consolidated Net income... $ 932 Income tax (benefit)... (281) Income (loss) before income taxes... $ 2,871 $ (2,220) 651 Add back: Depreciation and amortization expense... 3,855 3,855 Interest expense (income), net (1) 63 EBITDA... 6,790 (2,221) 4,569 Add back: Stock based compensation expense, net... 1,110 1,110 Adjusted EBITDA... $ 6,790 $ (1,111) $ 5,679 Reconciliation of Net Income to EBITDA and Adjusted EBITDA for the Six Months Ended June 30, 2016 By Segment Reis Services Other (A) Consolidated Net income... $ 2,545 Income tax expense... 1,567 Income (loss) before income taxes... $ 6,402 $ (2,290) 4,112 Add back: Depreciation and amortization expense... 3, ,077 Interest expense, net EBITDA... 9,509 (2,285) 7,224 Add back: Stock based compensation expense, net... 1,056 1,056 Adjusted EBITDA... $ 9,509 $ (1,229) $ 8,280 (A) Includes interest and other income, depreciation expense and general and administrative expenses (including public company related costs) that are not associated with the Reis Services segment. Deferred Revenue and Aggregate Revenue Under Contract Two balance-sheet based metrics management utilizes are deferred revenue and Aggregate Revenue Under Contract. Analyzing these amounts can provide additional insight into Reis Services s future financial performance. Deferred revenue, which is a GAAP basis accounting concept and is reported by the Company on the consolidated balance sheet, represents revenue from annual or longer term contracts for which we have billed and/or received payments from our subscribers related to services we will be providing over the remaining contract period. Aggregate Revenue Under Contract is the sum of deferred revenue and future revenue under non-cancellable contracts for which we do not yet have the contractual right to bill and excludes any future revenues expected to be derived from subscribers currently being billed on a monthly basis. The following table reconciles deferred revenue to Aggregate Revenue Under Contract at June 30, 2017 and December 31, 2016, respectively. June 30, 2017 December 31, 2016 Deferred revenue (GAAP basis)... $ 24,183,000 $ 25,031,000 Amounts under non-cancellable contracts for which the Company does not yet have the contractual right to bill at the period end (A)... 24,163,000 25,928,000 Aggregate Revenue Under Contract... $ 48,346,000 $ 50,959,000 (A) Amounts are billable subsequent to June 30, 2017 and December 31, 2016, respectively, and represent (i) noncancellable contracts for subscribers with multi-year subscriptions where the future years are not yet billable, or (ii) subscribers with non-cancellable annual subscriptions with interim billing terms. ii
Presented at: B. Riley & Co. s 17 th Annual Investor Conference Los Angeles, California May 25, 2016
 Presented by: Lloyd Lynford, CEO Mark P. Cantaluppi, CFO Reis, Inc. Presented at: B. Riley & Co. s 17 th Annual Investor Conference Los Angeles, California May 25, 2016 DRAFT Disclaimer This presentation
Presented by: Presented at: Lloyd Lynford CEO Reis, Inc. Canaccord Genuity Growth Conference 2015 Boston, MA August 12, 2015
 Presented by: Lloyd Lynford CEO Reis, Inc. Presented at: Canaccord Genuity Growth Conference 2015 Boston, MA August 12, 2015 DRAFT Disclaimer This presentation may include forward looking statements which
Lloyd Lynford CEO Reis, Inc.
 Presented by: Lloyd Lynford CEO Reis, Inc. Presented at: 28 TH Annual ROTH Conference Dana Point, CA March 15, 2016 DRAFT Disclaimer This presentation may include forward looking statements which involve
Presented by: Lloyd Lynford CEO Reis, Inc. Presented at: B. Riley & Co. 15 th Annual Investor Conference Santa Monica, CA May 20, 2014
 Presented by: Lloyd Lynford CEO Reis, Inc. Presented at: B. Riley & Co. 15 th Annual Investor Conference Santa Monica, CA May 20, 2014 DRAFT Disclaimer This presentation may include forward-looking statements
ServiceNow, Inc. Condensed Consolidated Statements of Operations (in thousands, except share and per share data)
") Condensed Consolidated Statements of Operations (in thousands, except share and per share data) December 31, 2015 December 31, 2014 December 31, 2015 December 31, 2014 Revenues: Subscription $ 244,702
Condensed Consolidated Statements of Operations (in thousands, except share and per share data) December 31, 2015 December 31, 2014 December 31, 2015 December 31, 2014 Revenues: Subscription $ 244,702
ServiceNow, Inc. Condensed Consolidated Statements of Operations (in thousands, except share and per share data) (unaudited)
 (unaudited)") Condensed Consolidated Statements of Operations (in thousands, except share and per share data) Revenues: Subscription $ 166,751 $ 104,878 $ 567,217 $ 349,804 Professional services and other 31,253 20,352
Condensed Consolidated Statements of Operations (in thousands, except share and per share data) Revenues: Subscription $ 166,751 $ 104,878 $ 567,217 $ 349,804 Professional services and other 31,253 20,352
ServiceNow, Inc. Condensed Consolidated Statements of Operations (in thousands, except share and per share data) (Unaudited)
 (Unaudited)") Condensed Consolidated Statements of Operations (in thousands, except share and per share data) Revenues: Subscription $ 179,907 $ 117,375 Professional services and other 32,057 21,715 Total revenues 211,964
Condensed Consolidated Statements of Operations (in thousands, except share and per share data) Revenues: Subscription $ 179,907 $ 117,375 Professional services and other 32,057 21,715 Total revenues 211,964
FAIR ISAAC CORPORATION CONDENSED CONSOLIDATED BALANCE SHEETS (In thousands) (Unaudited)
 (Unaudited)") CONDENSED CONSOLIDATED BALANCE SHEETS (In thousands) 2018 2017 ASSETS: Current assets: Cash and cash equivalents $ 90,023 $ 105,618 Accounts receivable, net 208,865 168,586 Prepaid expenses and other current
CONDENSED CONSOLIDATED BALANCE SHEETS (In thousands) 2018 2017 ASSETS: Current assets: Cash and cash equivalents $ 90,023 $ 105,618 Accounts receivable, net 208,865 168,586 Prepaid expenses and other current
FAIR ISAAC CORPORATION CONDENSED CONSOLIDATED BALANCE SHEETS (In thousands) (Unaudited)
 (Unaudited)") CONDENSED CONSOLIDATED BALANCE SHEETS (In thousands) June 30, September 30, 2018 2017 ASSETS: Current assets: Cash and cash equivalents $ 119,929 $ 105,618 Accounts receivable, net 182,419 168,586 Prepaid
CONDENSED CONSOLIDATED BALANCE SHEETS (In thousands) June 30, September 30, 2018 2017 ASSETS: Current assets: Cash and cash equivalents $ 119,929 $ 105,618 Accounts receivable, net 182,419 168,586 Prepaid
ServiceNow, Inc. Condensed Consolidated Statements of Operations (in thousands, except share and per share data) (Unaudited)
 (Unaudited)") Condensed Consolidated Statements of Operations (in thousands, except share and per share data) September 30, 2016 September 30, 2015 September 30, 2016 September 30, 2015 Revenues: Subscription $ 318,934
Condensed Consolidated Statements of Operations (in thousands, except share and per share data) September 30, 2016 September 30, 2015 September 30, 2016 September 30, 2015 Revenues: Subscription $ 318,934
FAIR ISAAC CORPORATION CONDENSED CONSOLIDATED BALANCE SHEETS (In thousands) (Unaudited)
 (Unaudited)") CONDENSED CONSOLIDATED BALANCE SHEETS (In thousands) March 31, September 30, 2016 2015 ASSETS: Current assets: Cash and cash equivalents $ 85,374 $ 86,120 Accounts receivable, net 155,207 158,773 Prepaid
CONDENSED CONSOLIDATED BALANCE SHEETS (In thousands) March 31, September 30, 2016 2015 ASSETS: Current assets: Cash and cash equivalents $ 85,374 $ 86,120 Accounts receivable, net 155,207 158,773 Prepaid
FAIR ISAAC CORPORATION CONDENSED CONSOLIDATED BALANCE SHEETS (In thousands) (Unaudited)
 (Unaudited)") CONDENSED CONSOLIDATED BALANCE SHEETS (In thousands) June 30, September 30, 2016 2015 ASSETS: Current assets: Cash and cash equivalents $ 118,155 $ 86,120 Accounts receivable, net 155,196 158,773 Prepaid
CONDENSED CONSOLIDATED BALANCE SHEETS (In thousands) June 30, September 30, 2016 2015 ASSETS: Current assets: Cash and cash equivalents $ 118,155 $ 86,120 Accounts receivable, net 155,196 158,773 Prepaid
SS&C Technologies Holdings, Inc. and Subsidiaries Condensed Consolidated Statements of Operations (in thousands, except per share data) (unaudited)
 (unaudited)") SS&C Technologies Holdings, Inc. and Subsidiaries Condensed Consolidated Statements of Operations (in thousands, except per share data) (unaudited) 2018 2017 Revenues: Software-enabled services $ 294,803
SS&C Technologies Holdings, Inc. and Subsidiaries Condensed Consolidated Statements of Operations (in thousands, except per share data) (unaudited) 2018 2017 Revenues: Software-enabled services $ 294,803
Digital River, Inc. Second Quarter Results (Unaudited, in thousands) Subject to reclassification
 Subject to reclassification") (Unaudited, in thousands) Condensed Consolidated Balance Sheets As of December 31, 2008 2007 Assets: Current assets Cash and cash equivalents $ 276,927 $ 381,788 Short-term investments 201,297 315,636
(Unaudited, in thousands) Condensed Consolidated Balance Sheets As of December 31, 2008 2007 Assets: Current assets Cash and cash equivalents $ 276,927 $ 381,788 Short-term investments 201,297 315,636
Important Information for Investors and Stockholders
 March 1, 2010 Important Information for Investors and Stockholders This presentation does not constitute an offer to sell or the solicitation of an offer to buy any securities or a solicitation of any
MINDBODY Reports Third Quarter 2015 Financial Results. Company Delivers Revenue Growth of 48% Year over Year. Adds Record Number of Subscribers
 Contact: Investor Relations: The Blueshirt Group Nicole Gunderson IR@mindbodyonline.com 888-782-7155 Media Contact: Georgia Suter georgia.suter@mindbodyonline.com 805-419-2856 MINDBODY Reports Third Quarter
Snap Interactive Reports Results for the Quarter Ended June 30, 2015
 August 13, 2015 Snap Interactive Reports Results for the Quarter Ended June 30, 2015 NEW YORK, NY--(Marketwired - Aug 13, 2015) - Snap Interactive, Inc. ("SNAP," the "Company," "we," "our" or "us") (OTCQB:
Where Food Comes From, Inc. Reports 2018 Fourth Quarter and Full Year Financial Results
 Where Food Comes From, Inc. Reports 2018 Fourth Quarter and Full Year Financial Results Full Year Highlights 2018 vs. 2017 Revenue up 15% to $17.8 million from $15.4 million Net income attributable to
UNITED STATES SECURITIES AND EXCHANGE COMMISSION Washington, D.C FORM 8-K CURRENT REPORT
 UNITED STATES SECURITIES AND EXCHANGE COMMISSION Washington, D.C. 20549 FORM 8-K CURRENT REPORT Pursuant to Section 13 OR 15(d) of the Securities Exchange Act of 1934 Date of Report (Date of earliest event
QUARTERLY REPORT FOR THE THREE MONTHS ENDED June 30, 2011 LIVEWORLD, INC. (Exact Name of issuer as specified in its charter) Delaware
 Delaware") QUARTERLY REPORT FOR THE THREE MONTHS ENDED June 30, 2011 LIVEWORLD, INC. (Exact Name of issuer as specified in its charter) Delaware 77-0426524 (State of Incorporation) (IRS Employer Identification No.)
QUARTERLY REPORT FOR THE THREE MONTHS ENDED June 30, 2011 LIVEWORLD, INC. (Exact Name of issuer as specified in its charter) Delaware 77-0426524 (State of Incorporation) (IRS Employer Identification No.)
CPI Card Group Inc. Reports Fourth Quarter and Full Year 2016 Results
 NEWS RELEASE CPI Card Group Inc. Reports Fourth Quarter and Full Year 2016 Results 3/1/2017 Q4 Net Sales of $67.4 million, Full Year 2016 Net Sales of $308.7 million Full Year Net Income from Continuing
SS&C Technologies Holdings, Inc. and Subsidiaries Condensed Consolidated Statements of Operations (in thousands, except per share data) (unaudited)
 (unaudited)") SS&C Technologies Holdings, Inc. and Subsidiaries Condensed Consolidated Statements of Operations (in thousands, except per share data) (unaudited) 2017 2016 2017 2016 Revenues: Software-enabled services
SS&C Technologies Holdings, Inc. and Subsidiaries Condensed Consolidated Statements of Operations (in thousands, except per share data) (unaudited) 2017 2016 2017 2016 Revenues: Software-enabled services
Carbonite Announces Second Quarter 2017 Financial Results
 August 3, 2017 Carbonite Announces Second Quarter 2017 Financial Results Bookings Growth and Operational Efficiencies Driving Profitability BOSTON, Aug. 03, 2017 (GLOBE NEWSWIRE) -- Carbonite, Inc. (NASDAQ:CARB),
Commercial Real Estate Services
 GROUP, GROUP, INC. INC. Global Global Market Market Leader Leader in in Integrated Integrated Commercial Real Estate Services JUNE 2016 NOVEMBER 2016 FORWARD-LOOKING STATEMENTS This presentation contains
ANNUAL REPORT FOR THE YEAR ENDED December 31, 2011 LIVEWORLD, INC. (Exact Name of issuer as specified in its charter) Delaware
 Delaware") ANNUAL REPORT FOR THE YEAR ENDED 2011 LIVEWORLD, INC. (Exact Name of issuer as specified in its charter) Delaware 77-0426524 (State of Incorporation) (IRS Employer Identification No.) 4340 Stevens Creek
ANNUAL REPORT FOR THE YEAR ENDED 2011 LIVEWORLD, INC. (Exact Name of issuer as specified in its charter) Delaware 77-0426524 (State of Incorporation) (IRS Employer Identification No.) 4340 Stevens Creek
ServiceNow, Inc. Condensed Consolidated Statements of Operations (in thousands, except share and per share data) (unaudited)
 (unaudited)") Condensed Consolidated Statements of Operations (in thousands, except share and per share data) December 31, 2017 December 31, 2016 December 31, 2017 December 31, 2016 Revenues: Subscription $ 497,232
Condensed Consolidated Statements of Operations (in thousands, except share and per share data) December 31, 2017 December 31, 2016 December 31, 2017 December 31, 2016 Revenues: Subscription $ 497,232
Web.com Reports Fourth Quarter and Full Year 2017 Financial Results
 Web.com Reports Fourth Quarter and Full Year 2017 Financial Results Strong financial and operating performance in the fourth quarter Significant progress on strategic priorities for the year Generated
Endurance International Group Reports 2017 Fourth Quarter and Full Year Results
 Endurance International Group Reports 2017 Fourth Quarter and Full Year Results Fiscal Year 2017 GAAP revenue of $1.177 billion Net loss of $99.8 million Adjusted EBITDA of $350.8 million Cash flow from
Paylocity Announces First Quarter Fiscal Year 2018 Financial Results
 November 2, 2017 Paylocity Announces First Quarter Fiscal Year 2018 Financial Results Q1 2018 Total Revenue of $81.5 million, up 25% year-over-year Q1 2018 Recurring Revenue of $78.9 million, up 26% year-over-year
Conduent Announces Fourth Quarter and Full-Year 2016 Results; Reaffirms Long-Term Outlook
 News from Conduent For Immediate Release Conduent Incorporated 100 Campus Drive Florham Park, NJ. 07932 www.conduent.com Conduent Announces Fourth Quarter and Full-Year 2016 Results; Reaffirms Long-Term
Web.com Reports Fourth Quarter and Full Year 2009 Financial Results
 Web.com Reports Fourth Quarter and Full Year 2009 Financial Results JACKSONVILLE, Fla., Feb. 9, 2010 (GLOBE NEWSWIRE) -- Web.com Group, Inc. (Nasdaq:WWWW), a leading provider of online marketing for small
Weakening foreign currencies accounted for a reduction in emerging markets revenue of 4.9%.
 , Exhibit 99.1 Contact Evan Goad TransUnion E-mail investor.relations@transunion.com Telephone 312 985 2860 TransUnion Reports Fourth Quarter & Full Year 2012 Results CHICAGO, Feb. 25, 2013 TransUnion
LPL Financial Announces Fourth Quarter and Full-Year 2010 Financial Results
 February 7, 2011 LPL Financial Announces Fourth Quarter and Full-Year Financial Results Record Levels of Advisory and Brokerage Assets Help Fuel Record Full Year Profitability Strong Net New Advisor Growth
Zscaler, Inc. Supplemental Financial Information Explanation of Non-GAAP Financial Measures and Other Key Metrics
 Supplemental Financial Information Explanation of Non-GAAP Financial Measures and Other Key Metrics In addition to our results determined in accordance with U.S. GAAP, we believe the following non-gaap
Reconciliation of Non-GAAP Financial Measures. Adjusted Operating Income Reconciliation
 Reconciliation of Non-GAAP Financial Measures Adjusted Operating Income Reconciliation Adjusted operating income is not a measure of financial performance under generally accepted accounting principles
Tableau Reports Second Quarter 2018 Financial Results
 Tableau Reports Second Quarter 2018 Financial Results SEATTLE, Wash. - August 2, 2018 - Tableau Software, Inc. (NYSE: DATA) today reported results for its second quarter ended June 30, 2018. "We saw strong
Sales $ 407,444 $ 396,064 $ 1,602,580 $ 1,515,608 Cost of sales (258,660) (242,460) (1,021,230) (952,221)
 (242,460) (1,021,230) (952,221)") CONSOLIDATED STATEMENTS OF INCOME (Unaudited) (Dollar amounts in thousands, except per share data) 2018 2017 2018 2017 Sales $ 407,444 $ 396,064 $ 1,602,580 $ 1,515,608 Cost of sales (258,660) (242,460)
CONSOLIDATED STATEMENTS OF INCOME (Unaudited) (Dollar amounts in thousands, except per share data) 2018 2017 2018 2017 Sales $ 407,444 $ 396,064 $ 1,602,580 $ 1,515,608 Cost of sales (258,660) (242,460)
CarGurus Announces Third Quarter 2018 Results
 CarGurus Announces Third Quarter 2018 Results November 7, 2018 Third Quarter Highlights: Total revenue of $119.0 million, an increase of 43% year-over-year operating income of $3.6 million; non- operating
ServiceNow, Inc. Condensed Consolidated Statements of Operations (in thousands, except share and per share data) (unaudited)
 (unaudited)") ServiceNow, Inc. Condensed Consolidated Statements of Operations (in thousands, except share and per share data) (unaudited) Revenues: Three Months Ended March 31, 2018 March 31, 2017 *As Adjusted Subscription
ServiceNow, Inc. Condensed Consolidated Statements of Operations (in thousands, except share and per share data) (unaudited) Revenues: Three Months Ended March 31, 2018 March 31, 2017 *As Adjusted Subscription
Endurance International Group Reports 2018 Second Quarter Results
 Endurance International Group Reports 2018 Second Quarter Results GAAP revenue of $287.8 million Net loss of $2.0 million Adjusted EBITDA of $85.0 million Cash flow from operations of $29.9 million Free
Bottomline Technologies Reports Second Quarter Results
 Bottomline Technologies Reports Second Quarter Results Strong Growth in Subscription and Transaction Revenue Highlights Second Quarter PORTSMOUTH, N.H. February 1, 2018 Bottomline Technologies (NASDAQ:EPAY),
AGILYSYS FISCAL 2016 FIRST QUARTER REVENUE INCREASES 16% TO $27.5 MILLION INCLUSIVE OF QUARTERLY RECORD $14.9 MILLION OF RECURRING REVENUE
 AGILYSYS FISCAL 2016 FIRST QUARTER REVENUE INCREASES 16% TO $27.5 MILLION INCLUSIVE OF QUARTERLY RECORD $14.9 MILLION OF RECURRING REVENUE Subscription Revenue Increases 23% Alpharetta, GA August 5, 2015
LPL Financial Announces Second Quarter 2018 Results
 Investor Relations - Chris Koegel, (617) 897-4574 For Immediate Release Media Relations - Jeff Mochal, (704) 733-3589 investor.lpl.com/contactus.cfm LPL Financial Announces Second Quarter 2018 Results
Wayfair Announces Second Quarter 2018 Results
 Wayfair Announces Second Quarter 2018 Results Q2 Direct Retail Net Revenue Growth of 49% Year over Year to $1.6 billion 12.8 million Active Customers, up 34% Year over Year BOSTON, MA August 2, 2018 Wayfair
Commercial Real Estate Services
 GROUP, GROUP, INC. INC. Global Global Market Market Leader Leader in in Integrated Integrated Commercial Real Estate Services JUNE 2016 JUNE 2016 FORWARD-LOOKING STATEMENTS This presentation contains statements
RADIANT LOGISTICS ANNOUNCES RESULTS FOR THE FOURTH FISCAL QUARTER AND YEAR ENDED JUNE 30, 2018
 RADIANT LOGISTICS ANNOUNCES RESULTS FOR THE FOURTH FISCAL QUARTER AND YEAR ENDED JUNE 30, 2018 Reports record quarterly results with revenues of $233.8 million, up $32.0 million or 15.9%; Net revenues
Media Contact: Jennifer Saxon Exhibit MINDBODY Reports First Quarter 2018 Financial Results
 Contact: Investor Relations: Nicole Gunderson IR@mindbodyonline.com 888-782-7155 Media Contact: Jennifer Saxon jennifer.saxon@mindbodyonline.com 805-419-2839 Exhibit 99.1 MINDBODY Reports First Quarter
FINANCIAL OVERVIEW. Jim Groch. Chief Financial Officer
 FINANCIAL OVERVIEW Jim Groch Chief Financial Officer FORWARD-LOOKING STATEMENTS This presentation contains statements that are forward looking within the meaning of the Private Securities Litigation Reform
ServiceNow, Inc. Condensed Consolidated Statements of Operations (in thousands, except share and per share data) (unaudited)
 (unaudited)") ServiceNow, Inc. Condensed Consolidated Statements of Operations (in thousands, except share and per share data) (unaudited) Revenues: Subscription $ 626,567 $ 449,506 $ 1,755,174 $ 1,239,762 Professional
ServiceNow, Inc. Condensed Consolidated Statements of Operations (in thousands, except share and per share data) (unaudited) Revenues: Subscription $ 626,567 $ 449,506 $ 1,755,174 $ 1,239,762 Professional
Transcat Reports Fiscal 2015 Second Quarter Record Revenue of $31.1 Million; Earnings per Diluted Share Up 20%
 Transcat, Inc. 35 Vantage Point Drive Rochester NY 14624 Phone: (585) 352-7777 IMMEDIATE RELEASE NEWS RELEASE Transcat Reports Fiscal 2015 Second Quarter Record Revenue of $31.1 Million; Earnings per Diluted
Social Reality Reports 1,014% Year-Over-Year Revenue Growth for Q3 2015
 marketwired.com http://www.marketwired.com/press-release/social-reality-reports-1014-year-over-year-revenue-growth-for-q3-2015-otcqb-scri- 2074098.htm Social Reality Reports 1,014% Year-Over-Year Revenue
Web.com Reports Fourth Quarter and Full Year 2016 Financial Results
 Web.com Group, Inc. 12808 Gran Bay Parkway West Jacksonville, FL 32258 T: (904) 680-6600 F: (904) 880-0350 NASDAQ: WEB Web.com Reports Fourth Quarter and Full Year 2016 Financial Results Solid progress
Company Highlights: Financial Highlights: Exhibit 99.1
 Exhibit 99.1 Track Group, Inc. Reports Q1 FY2016 Quarterly Results Revenue Increases 37% Adjusted EBITDA margin improves Cash burn from operations decreases 82% Reaffirms FY2016 2017 Outlook SALT LAKE
ITRON, INC. CONSOLIDATED STATEMENTS OF OPERATIONS
 , INC. CONSOLIDATED STATEMENTS OF OPERATIONS (Unaudited, in thousands, except per share data) Revenues $ 523,335 $ 642,477 $ 2,178,178 $ 2,434,124 Cost of revenues 359,835 449,944 1,463,031 1,687,666 Gross
CBRE GROUP, INC. Global Market Leader in Integrated Commercial Real Estate Services
 CBRE GROUP, INC. Global Market Leader in Integrated Commercial Real Estate Services March 2016 FORWARD-LOOKING STATEMENTS This presentation contains statements that are forward looking within the meaning
Virtu Announces Fourth Quarter and Full Year 2017 Results
 Virtu Announces Fourth Quarter and Full Year 2017 Results NEW YORK, NY, February 8, 2018 Virtu Financial, Inc. (NASDAQ: VIRT), a leading technology-enabled market maker and liquidity provider to the global
INTERACTIVE DATA REPORTS FIRST-QUARTER 2014 RESULTS
 Press Release INTERACTIVE DATA REPORTS FIRST-QUARTER 2014 RESULTS New York May 8, 2014 Interactive Data Corporation today reported its financial results for the first quarter ended 2014. Interactive Data
Dealertrack Technologies Reports Record Revenue for Fourth Quarter and Full Year 2014
 Dealertrack Technologies Reports Record Revenue for Fourth Quarter and Full Year 2014 Page 1 MEDIA CONTACT: Alison von Puschendorf (877) 327-8422 x7366 alison.vonpuschendorf@dealertrack.com INVESTOR CONTACT:
AGILYSYS REPORTS RECORD QUARTERLY REVENUE OF $33.9 MILLION FOR FISCAL 2018 FIRST QUARTER -SAAS REVENUE GROWS 58%-
 AGILYSYS REPORTS RECORD QUARTERLY REVENUE OF $33.9 MILLION FOR FISCAL 2018 FIRST QUARTER -SAAS REVENUE GROWS 58%- -REITERATES OUTLOOK FOR FY 2018 REVENUE GROWTH OF APPROXIMATELY 7% - 10% AND POSITIVE ADJUSTED
MERGE REPORTS THIRD QUARTER FINANCIAL RESULTS
 News Release Media Contact: Steven Tolle Chief Strategy Officer 312.946.2503 Steven.Tolle@merge.com MERGE REPORTS THIRD QUARTER FINANCIAL RESULTS Company delivers GAAP net income and doubles prior year
OneSpan Reports Results for Second Quarter and First Six Months of 2018
 OneSpan Reports Results for Second Quarter and First Six Months of 2018 Q2 Total revenue up 8% to $49.6 million Q2 Adjusted EBITDA of $5.3 million 1 Q2 GAAP loss per share of $0.03 Q2 non-gaap earnings
Endurance International Group Reports 2018 Third Quarter Results
 Endurance International Group Reports 2018 Third Quarter Results GAAP revenue of $283.8 million Net loss of $6.3 million Adjusted EBITDA of $87.5 million Cash flow from operations of $51.3 million Free
PANDORA REPORTS Q FINANCIAL RESULTS
 PANDORA REPORTS Q3 2017 FINANCIAL RESULTS Ad RPM Grows to All-Time High; Premium Paid Subscribers Surpass 1 Million in October 2017 Ad RPM hits an all-time high of $70.27 in Q3 2017 from $58.10 in Q3 2016,
Bottomline Technologies Reports Third Quarter Results
 Bottomline Technologies Reports Third Quarter Results 21% Growth in Subscription and Transaction Revenue Highlights Third Quarter PORTSMOUTH, N.H. May 3, 2018 Bottomline Technologies (NASDAQ:EPAY), a leading
81nidZpGqzkSDMpD. Supplemental Investor Call Materials
 81nidZpGqzkSDMpD Supplemental Investor Call Materials January 23, 2019 Disclaimer This presentation has been prepared by Cision Ltd. and its subsidiaries ( Cision or the "Company ). All statements other
AGILYSYS FISCAL 2019 SECOND QUARTER REVENUE RISES 14% TO RECORD $34.2 MILLION
 AGILYSYS FISCAL 2019 SECOND QUARTER REVENUE RISES 14% TO RECORD $34.2 MILLION Recurring Revenue Increases 10% to Record $18.9 Million, Inclusive of 27% Growth in SaaS Revenue Third Consecutive Quarter
LogMeIn Announces Second Quarter 2018 Results
 LogMeIn Announces Second Quarter 2018 Results Boston, July 26, 2018 LogMeIn, Inc. (NASDAQ: LOGM), a leading provider of cloud-based connectivity, today announced its results for the second quarter ended
ACXIOM ANNOUNCES FIRST QUARTER RESULTS. Total Revenue Grows 9% Year-over-Year. Enters Into Definitive Agreement to Sell Impact Business
 For more information, contact: Lauren Dillard Investor Relations (650) 372-2242 investor.relations@acxiom.com EACXM ACXIOM ANNOUNCES FIRST QUARTER RESULTS Total Revenue Grows 9% Year-over-Year Enters Into
Performance Food Group Company Reports Third-Quarter Fiscal 2016 Results: Provides Full-Year Fiscal 2016 Adjusted EBITDA Growth Outlook of 10% to 12%
 NEWS RELEASE For Immediate Release May 4, 2016 Investors: Michael D. Neese VP, Investor Relations (804) 287-8126 michael.neese@pfgc.com Media: Joe Vagi Manager, Corporate Communications (804) 484-7737
Record Revenues Drive 46% Net Income Growth During Strongest Third Quarter in Walker & Dunlop s History
 Record Revenues Drive 46% Net Income Growth During Strongest Third Quarter in Walker & Dunlop s History THIRD QUARTER 2016 HIGHLIGHTS Record total revenues of $154.8 million, up 28% from Q3 15 Net income
Appendix to Zendesk, Inc Analyst & Investor Day
 Appendix to Zendesk, Inc. 2017 Analyst & Investor Day Important Disclosures Regarding the Analyst and Investor Day Materials This presentation and the accompanying oral presentation include forward-looking
Groupon Announces First Quarter 2015 Results
 May 5, 2015 Groupon Announces First Quarter 2015 Results Gross billings of $1.6 billion Revenue of $750.4 million Adjusted EBITDA of $72.4 million GAAP loss per share of $0.02; non-gaap earnings per share
CoStar Group Grows Year-Over-Year Revenue 36% and EBITDA 49% Company Raises 2014 Guidance
 Brian J. Radecki Chief Financial Officer (202) 336-6920 bradecki@costargroup.com Richard Simonelli Senior Director Investor Relations (202) 346-6394 rsimonelli@costargroup.com CoStar Group Grows Year-Over-Year
Deutsche Bank 24 th Annual Media, Internet & Telcom Conference. March 8, 2016
 Deutsche Bank 24 th Annual Media, Internet & Telcom Conference March 8, 2016 Safe Harbor for Forward-Looking Statements Certain statements in this presentation are forward-looking statements within the
Lamar Advertising Company Announces Fourth Quarter and Year End 2016 Operating Results
 5321 Corporate Boulevard Baton Rouge, LA 70808 Lamar Advertising Company Announces Fourth Quarter and Year End 2016 Operating Results Three Month Results Net revenue increased 8.6% to $386.7 million Net
LPL Financial Announces Second Quarter 2017 Results
 Investor Relations - Chris Koegel, (617) 897-4574 For Immediate Release Media Relations - Jeff Mochal, (704) 733-3589 investor.lpl.com/contactus.cfm LPL Financial Announces Second Quarter 2017 Results
HD Supply Holdings, Inc. Announces 2017 Third-Quarter Results, Raises Full-Year Guidance
 Investor Contact: Charlotte McLaughlin HD Supply Investor Relations 770-852-9100 InvestorRelations@hdsupply.com Media Contact: Quiana Pinckney, APR HD Supply Public Relations 770-852-9057 Quiana.Pinckney@hdsupply.com
TD AMERITRADE HOLDING CORPORATION CONSOLIDATED STATEMENTS OF INCOME In thousands, except per share amounts (Unaudited)
") CONSOLIDATED STATEMENTS OF INCOME In thousands, except per share amounts Revenues: Transaction-based revenues: Commissions and transaction fees $ 301,272 $ 309,388 $ 265,442 $ 610,660 $ 552,555 Asset-based
CONSOLIDATED STATEMENTS OF INCOME In thousands, except per share amounts Revenues: Transaction-based revenues: Commissions and transaction fees $ 301,272 $ 309,388 $ 265,442 $ 610,660 $ 552,555 Asset-based
Dealertrack Technologies Reports Third Quarter 2014 Financial Results
 November 5, 2014 Dealertrack Technologies Reports Third Quarter 2014 Financial Results Reports 87% Year over Year Revenue Growth Updates 2014 Revenue Guidance Based on Solid Third Quarter Performance and
HD Supply Holdings, Inc. Announces 2017 Second-Quarter Results and Reaffirms Full-Year Guidance
 Investor Contact: Charlotte McLaughlin HD Supply Investor Relations 770-852-9100 InvestorRelations@hdsupply.com Media Contact: Quiana Pinckney HD Supply Public Relations 770-852-9057 Quiana.Pinckney@hdsupply.com
Wix.com Reports First Quarter 2016 Results
 Wix.com Reports First Quarter 2016 Results Exceeded High End of Q1 Guidance for Collections, Revenue and Adjusted EBITDA Results Highlighted by a Unique Combination of Record Registered User Growth and
UNITED STATES SECURITIES AND EXCHANGE COMMISSION Washington, D.C FORM 8-K
 UNITED STATES SECURITIES AND EXCHANGE COMMISSION Washington, D.C. 20549 FORM 8-K Current Report Pursuant to Section 13 or 15(d) of the Securities Exchange Act of 1934 Date of Report (date of earliest event
GAAP/Non-GAAP Reconciliation and Other Management Metrics. 3rd Quarter 2017
 GAAP/Non-GAAP Reconciliation and Other Management Metrics 3rd Quarter 2017 Use of Non-GAAP Financial Information Use of Non-GAAP Financial Information The Company occasionally utilizes financial measures
NEIMAN MARCUS GROUP LTD LLC REPORTS SECOND QUARTER RESULTS. DALLAS, Texas, March 9, 2018 Neiman Marcus Group LTD LLC today reported
 FOR IMMEDIATE RELEASE CONTACT: Mark Anderson Director Finance and Investor Relations (214) 757-2934 NEIMAN MARCUS GROUP LTD LLC REPORTS SECOND QUARTER RESULTS DALLAS, Texas, Neiman Marcus Group LTD LLC
j2 Global Reports Fourth Quarter and Year End 2016 Results and Provides 2017 Outlook
 February 9, 2017 j2 Global Reports Fourth Quarter and Year End 2016 Results and Provides 2017 Outlook Achieves Record Annual Revenues GAAP Diluted EPS Provides Fiscal 2017 Financial Estimates Announces
MERGE REPORTS THIRD QUARTER FINANCIAL RESULTS Merge generates record cash from business operations in quarter
 News Release Media Contact: Jennifer Jawor Director, Corporate Marketing 312.565.6825 jennifer.jawor@merge.com MERGE REPORTS THIRD QUARTER FINANCIAL RESULTS Merge generates record cash from business operations
SLM CORPORATION EARNINGS PRESENTATION THIRD QUARTER October 19, 2017
 SLM CORPORATION EARNINGS PRESENTATION THIRD QUARTER 2017 October 19, 2017 2 Forward-Looking Statements and Disclaimer Cautionary Note Regarding Forward-Looking Statements The following information is current
Colony NorthStar Credit Real Estate, Inc. Supplemental Financial Report First Quarter 2018 May 8, 2018
 Colony NorthStar Credit Real Estate, Inc. Supplemental Financial Report First Quarter 2018 May 8, 2018 Cautionary Statement Regarding Forward-Looking Statements This presentation may contain forward-looking
Earnings Presentation First Quarter 2018
 Earnings Presentation First Quarter 2018 1 DISCLAIMER 2 Notes Regarding Financial Tables and Metrics Excel files with the Company s quarterly financial results and metrics from the current period are accessible
Investor Update Call. April 12, 2018
 Investor Update Call April 12, 2018 1 Select preliminary financial information and forward-looking statements This presentation contains select preliminary Q1 2018 financial information. This information
NEIMAN MARCUS GROUP LTD LLC REPORTS FOURTH QUARTER AND FISCAL YEAR 2016 RESULTS
 FOR IMMEDIATE RELEASE CONTACT: Mark Anderson Director Finance and Investor Relations (214) 757-2934 REPORTS FOURTH QUARTER AND FISCAL YEAR RESULTS DALLAS, Texas, Neiman Marcus Group LTD LLC today reported
Wix Reports Strong Third Quarter 2016 Results, Exceeding Expectations Leading to Significant Increase in Full Year Outlook
 Wix Reports Strong Third Quarter 2016 Results, Exceeding Expectations Leading to Significant Increase in Full Year Outlook Exceeded High End of Guidance Range with Strong Top-Line Growth and Record Adjusted
Paylocity Announces Fourth Quarter and Fiscal Year 2018 Financial Results
 Paylocity Announces Fourth Quarter and Fiscal Year 2018 Financial Results August 9, 2018 Q4 2018 Total Revenue of $96.6 million, up 27% year-over-year FY 2018 Total Revenue of $377.5 million, up 26% year-over-year
Ameresco Reports Third Quarter 2018 Financial Results
 October 30, 2018 Ameresco Reports Third Quarter 2018 Financial Results Third Quarter 2018 Financial Highlights (year over year): Revenues of $205.4 million, up 0.3%, year to date of $569.8 million, up
Bottomline Technologies Reports Second Quarter Results
 Bottomline Technologies Reports Second Quarter Results Strong Growth in Subscription and Transaction Revenue Highlights Second Quarter PORTSMOUTH, N.H. February 1, 2017 Bottomline Technologies (NASDAQ:
Web.com Reports Record Fourth Quarter and Full Year 2012 Financial Results
 February 7, 2013 Web.com Reports Record Fourth Quarter and Full Year 2012 Financial Results Fourth quarter revenue and profitability exceed high end of Web.com's guidance Successful integration of Network
APX GROUP HOLDINGS, INC. REPORTS SECOND QUARTER 2015 RESULTS
 APX GROUP HOLDINGS, INC. REPORTS SECOND QUARTER 2015 RESULTS Second Quarter 2015 Financial and Portfolio Highlights Total Revenue of $157.9 Million, up 17.7% Year over Year Adjusted EBITDA 1 $93.4 Million,
INTERSECTIONS INC. CONSOLIDATED STATEMENTS OF OPERATIONS
 CONSOLIDATED STATEMENTS OF OPERATIONS Three Months Ended Years Ended December 31, December 31, (in thousands, except share and per share data) 2011 2010 2011 2010 Revenue $ 94,142 $ 91,196 $ 373,001 $
Wayfair Announces Fourth Quarter and Full Year 2018 Results
 Wayfair Announces Fourth Quarter and Full Year Results Q4 Direct Retail Net Revenue Growth of 41% Year over Year to $1,996 million Full Year Direct Retail Net Revenue Growth of 45% Year over Year to $6,718
Ultimate Reports Full Year and Q Financial Results
 FOR IMMEDIATE RELEASE Ultimate Reports Full Year and Q4 2017 Financial Results Record 2017 Recurring Revenues of $802.3 million, Up by 23% Record 2017 Total Revenues of $940.7 million, Up by 20% Record