Year-End Report 2017
|
|
|
- Shawn Powers
- 6 years ago
- Views:
Transcription


1 Year-End Report 217
2 217 summary Adjusted NAV +16 percent, reported NAV +15 percent, TSR 13 percent, (SIXRX +9 percent) Listed Core Investments: 17 percent total return Patricia Industries: mixed performance, add-on acquisitions and distribution from Mölnlycke and 3 Scandinavia EQT: 21 percent value growth in constant currency, SEK 1. bn. net cash flow to Investor Board proposes SEK 12 dividend per share in two installments, 9 percent increase 2
3 Q4 217 summary Adjusted NAV +1 percent, reported NAV + percent, TSR -7 percent, (SIXRX -3 percent) Listed Core Investments: percent total return Patricia Industries: improved profitability in Mölnlycke, intensified action to improve Aleris EQT: 7 percent value growth in constant currency, SEK -.8 bn. net cash flow to Investor 3


 > :")


4 Listed Core Investments Summary of 217 > Total return +17 percent (SIXRX +9 percent) > Investments: SEK 1.2 bn. in Ericsson > Board nominations: Ericsson, Electrolux, ABB > Strategy and M&A Atlas Copco: board and management team established for Epiroc Strategic acquisitions in ABB, Wärtsilä and Nasdaq LISTED CORE INVESTMENTS 4


, total")


5 Patricia Industries Summary of 217 > Adjusted market value of SEK 97 bn. (excluding cash), total return +1 percent > Priorities: Developing the existing companies New platform companies in the Nordics and in North America Manage Financial Investments for value and cash 5


6 Mölnlycke Q4 217 > Organic growth +2 percent in constant currency > Slightly higher growth in Wound Care than in Surgical > Strong growth in Emerging Markets, U.S. and Europe essentially flat > Underlying profitability up sequentially, in line with EUR m % last year Sales EBITDA, % EBITA, % > Strong cash flow > Strategic partnership with Tissue Analytics after the end of the quarter A provider of advanced products for treatment and prevention of wounds and single-use surgical solutions 6

7 Aleris Q4 217 > Organic growth +3 percent in constant currency > Profitability sharply lower, mainly due to restructuring > Underlying profitability in Healthcare flat, lower in Care > Overall performance remains unsatisfactory > Intensified actions to sustainably improve profitability SEK m Sales EBITDA, % EBITA, % % > Lowered short- to medium-term forecasts, SEK 1. bn. impairment of reported value > Patricia Industries commitment of maximum SEK 1. bn. injection to pay down debt A provider of healthcare and care services in Scandinavia 7

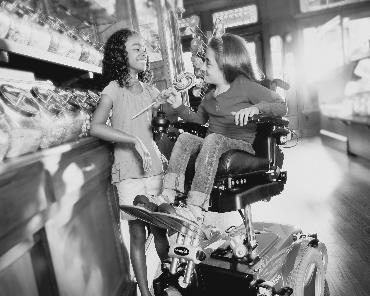
8 Permobil Q4 217 > Organic growth +9 percent in constant currency > Growth driven by Power and Seating & Positioning > Underlying profitability slightly higher than last year > Acquisition of MAX Mobility, closed in January 218 > Acquisition of business lines from Ottobock after the SEK m Sales EBITDA, % EBITA, % % end of the quarter A provider of advanced mobility and seating rehab solutions 8

9 BraunAbility Q4 217 > Organic growth +2 percent in constant currency USD m. 6 % 1 > Similar growth in all business areas > Profitability impacted by elevated production costs related to new Chrysler minivan, CEO recruitment costs and M&A-related costs Sales EBITDA, % EBITA, % > Staci Kroon appointed new CEO A manufacturer of wheelchair accessible vehicles and wheelchair lifts 9
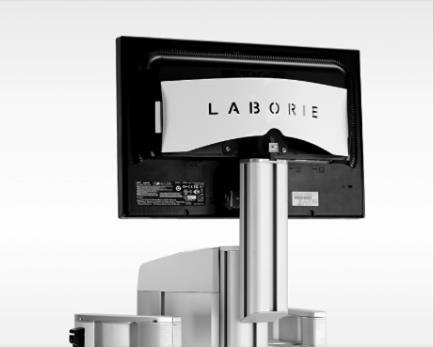
10 Laborie Q4 217 > Organic growth +7 percent in constant currency > Strong growth in disposables > Continued profitability improvement, despite significant investments in operations and negative impact from restructuring USD m % Sales EBITDA, % EBITA, % A provider of innovative capital equipment and consumables for the diagnosis and treatment of urologic and gastrointestinal (GI) disorders 1

 to Danish tax authority A")
11 3 Scandinavia Q4 217 > Service revenue decline 3 percent > Subscription base down by 7,, driven by decrease in Sweden > Continued strong momentum for Hallon and Oister > SEK 563 m. negative impact on EBITDA from payment of value added tax (related to previous SEK m Sales EBITDA, % % periods) to Danish tax authority A provider of mobile voice and broadband services in Sweden and Denmark 11

12 EQT Q4 217 SEK m. 4% of total adjusted assets SEK m Net cash flow EQT AB EQT Equity EQT Infrastructure Value change 7 percent in constant currency EQT Credit EQT Midmarket EQT Ventures Outstanding commitment SEK 16.6 bn. Draw-downs SEK m. Proceeds to Investor SEK m. EQT Real Estate 12
13 Operating priorities and goal fulfilment 217 Grow net asset value: Adjusted net asset value +16 percent Operate efficiently: Management costs below guidance Pay a steadily rising dividend: 9 percent increase proposed 13
14 Steadily rising dividend DPS p 14

15 Strategic priorities going forward LISTED CORE INVESTMENTS > More companies to become best-in-class > Gradually strengthen ownership in selected holdings > Continued profitable growth in the existing companies > New platforms in the Nordics and North America > Continue to invest in EQT funds > Pay a steadily rising dividend > Generate an attractive total shareholder return CORPORATE FUNCTIONS > High quality > Efficiency 15


16 Year-End Report 217 Financials, Helena Saxon, CFO January 23,
17 Financial highlights Q4 217 > Reported Net Asset Value was essentially flat and amounted to SEK 336 bn. SEK bn Adjusted NAV > Based on estimated market values of Patricia Industries, adjusted Net Asset Value amounted to SEK 385 bn., an increase of 1% Reported NAV
18 Contribution to Reported Net Asset Value Q NAV beginning of period Listed Core Investments Patricia Industries EQT Groupwide NAV end of period 18
19 Listed Core Investments Q4 217 SEK m. SEK m. 72% of total adjusted assets Total Contribution to NAV SEK -966 m. -1 No investments or divestments were made during the quarter TSR was flat vs. SIXRX -3% ABB Atlas Ericsson AstraZeneca Nasdaq Husqvarna Saab Electrolux Sobi Wärtsilä Copco SEB 19

 Reported")
20 Patricia Industries Estimated market values vs reported values December 31, SEK +48 bn. 59 SEK +39 bn SEK +5 bn. SEK +4 bn. Mölnlycke 9 4 Permobil Laborie Aleris Estimated market value BraunAbility Vectura Grand Hotel Financial Investments Patricia Industries (excl cash) Reported value Estimated market value vs. reported 7 7 Financial Investments 2
21 Patricia Industries Estimated market value development Q4 vs Q n/a Total NAV Mölnlycke Permobil Aleris BraunAbility Laborie*) 3 The Grand Vectura Financial Patricia Cash Total NAV Group Investments *) Laborie is shown at cost as it was acquired less than 18 months ago 21
22 Major drivers of estimated market value Q4 217 Company Est. market value change Q4 vs. Q3 Comment SEK 4.6 bn. Higher multiples, cash flow and currency impacted positively, operating profit lower SEK.9 bn. Yearly update of the market value of the property portfolio SEK -1.1 bn. Lower operating profit but multiples also contracted 22
23 Financial Investments Q4 217 SEK m. 2% of total adjusted assets > The realization of the portfolio continues > Total divestment proceeds amounted to SEK 352 m. in the quarter 1 52 m. NS Focus > Remaining value SEK 7.2 bn. Other m. 817 m. Madrague 454 m. Spigit 313 m. 268 m. Acquia CallFire 23
24 Leverage development > Leverage 3.5% (5.3%) as of December 31, 217 > Net debt amounted to SEK 12.2 bn. > Investor s gross cash amounted to SEK 18.9 bn. > Average maturity of the debt portfolio 9.9 years Current rating Standard & Poor s Moody s AA- Aa3 24
25 Financial calendar & Contact details Event Date Interim Management Statement, January March 218 April 2, 218 Annual General Meeting May 8, 218 Interim Report, January June 218 July 17, 218 Interim Management Statement, January September 218 October 17, 218 Year-End report, January December 218 January 24, 219 Contact details Magnus Dalhammar Head of Investor Relations Stefan Stern Head of Corporate Relations, Sustainability and Communications stst@investorab.com 25
Interim Management Statement January March 2018
 Interim Management Statement January March 218 Q1 218 Overall performance Business areas Adjusted NAV flat Reported NAV +2% TSR -1% SIXRX flat Listed Core Investments +1% total return SEK 8.6 bn. in dividends
Interim Report January June 2018
 Interim Report January June 218 Q2 218 Overview Adjusted NAV SEK 394 bn., +5 percent including dividend Listed Core Investments +4% total return Patricia Industries Estimated market values +9% (ex. cash)
Year-End Report 2018
 Year-End Report 218 218 summary Solid performance despite challenging equity markets NAV flat, TSR +4 percent, outperforming Swedish stock market by 8 percentage points Investments in three listed core
January June CEO Johan Forssell
 January June 216 CEO Johan Forssell summary > Stable quarter despite challenging environment > Continued execution on strategy SEK 212.2 bn., 77 percent of total assets SEK 13.3 bn., 5 percent of total
Interim Management Statement January-September 2017
 Interim Management Statement January-September 2017 Highlights during the third quarter Adjusted net asset value*, based on estimated market values for the major wholly-owned subsidiaries and partner-owned
Introduction to Patricia Industries
 Introduction to Patricia Industries 1 What is Patricia Industries? Mission Focus on wholly-owned companies Long term holding horizon Active ownership New investments B/S and cash flow to support mission
Adjusted net asset value* amounted to SEK 372,004 m. (SEK 486 per share) on
 on") Year-End Report 2018 Highlights during the fourth quarter Adjusted net asset value* amounted to SEK 372,004 m. (SEK 486 per share) on December 31, 2018, a decrease of SEK 48,566 m., or 12 percent during
Year-End Report 2018 Highlights during the fourth quarter Adjusted net asset value* amounted to SEK 372,004 m. (SEK 486 per share) on December 31, 2018, a decrease of SEK 48,566 m., or 12 percent during
Year-End Report CEO Börje Ekholm
 Year-End Report 2014 CEO Börje Ekholm Summary 2014 > Lead owner in Wärtsilä > EUR 130 m. distribution from Mölnlycke Health Care > Aleris focused on improving operations > EQT distributed SEK 2.5 bn.,
Interim Report January-June 2018
 Interim Report January-June 2018 Highlights during the second quarter Adjusted net asset value*, based on estimated market values for the major subsidiaries and partner-owned investments within Patricia
Interim Report January-September CEO Börje Ekholm
 Interim Report January-September CEO Börje Ekholm Third quarter highlights > Net asset value increase of SEK 8 bn. to SEK 163 bn. > Add-ons in Core Investments ABB and Wärtsilä > Run-rate cost expected
Investor Capital Markets Day
 Investor Capital Markets Day Johan Forssell CEO Purpose of the day Present our strategic direction Explain the value creation in our business areas Present the wholly-owned subsidiaries within Patricia
Highlights Total Shareholder Return (TSR) amounted to 13 percent. During the past 20 years, average annual TSR has been 11 percent.
 amounted to 13 percent. During the past 20 years, average annual TSR has been 11 percent.") Annual report 2017 2017 was a strong year for Investor. Our adjusted net asset value grew by 16 percent and our total shareholder return amounted to 13 percent, which exceeded our return requirement and
Annual report 2017 2017 was a strong year for Investor. Our adjusted net asset value grew by 16 percent and our total shareholder return amounted to 13 percent, which exceeded our return requirement and
Overview annual average performance. Total return NAV (%)* Investor B (%) SIXRX (%)
* Investor B (%) SIXRX (%)") Year-End Report 2014 Highlights during the fourth quarter Net asset value amounted to SEK 260,963 m. (SEK 343 per share) on December 31, 2014, an increase of SEK 14,162 m. (SEK 19 per share) during the
Year-End Report 2014 Highlights during the fourth quarter Net asset value amounted to SEK 260,963 m. (SEK 343 per share) on December 31, 2014, an increase of SEK 14,162 m. (SEK 19 per share) during the
Interim Report January-March 2013
 Interim Report January-March 2013 Highlights during the first quarter Net asset value amounted to SEK 191.0 bn. (SEK 251 per share) on March 31, 2013, an increase by SEK 16.3 bn., (SEK 21 per share) during
Interim Report January-June 2012
 Interim Report January-June 2012 Highlights during the second quarter Net asset value amounted to SEK 154.9 bn. (SEK 204 per share) on June 30, 2012, a decrease by SEK 12.1 bn., (SEK 16 per share) during
Net Asset Value Report January March 2004
 Net Asset Value Report January March 2004 Investor s net asset value on March 31, 2004 amounted to SEK 91,584 m. (SEK 119 per share), compared with SEK 83,063 m. (SEK 108 per share) on December 31, 2003.
Interim Report January March 2003
 Interim Report January March 2003 Investor s net asset value on March 31, 2003 amounted to SEK 58,869 m. (SEK 77 per share), compared with SEK 62,869 m. (SEK 82 per share) on December 31, 2002. The value
Interim Report January-September 2010
 Interim Report January-September 2010 Highlights during the third quarter The acquisition and consolidation of Aleris for a gross investment of SEK 2.5 bn. (SEK 1.7 bn. adjusted for the share already owned
Johan Forssell Vice President and Head of Core Holdings
 Johan Forssell Vice President and Head of Core Holdings Our Core Holdings Healthcare Technology Engineering Financial Services 1 Major transactions (> 1 billion SEK) 2001 + Ericsson 2002 + ABB 2003 + ABB
Sustainable business. Our sustainability work as a company and employer
 Sustainable business Investor has a long tradition of being a responsible owner, company and employer, and firmly believes that sustainability is a prerequisite for creating long-term value. Companies
Interim Report January-March 2012
 Interim Report January-March 2012 Highlights during the first quarter Net asset value amounted to SEK 167.0 bn. (SEK 220 per share) on March 31, 2012, an increase by SEK 10.9 bn., (SEK 15 per share) during
Interim Report January - March 2002
 Interim Report January - March 2002 Investor s net asset value on March 31, 2002 amounted to SEK 118,683 m. (SEK 155 per share), compared with SEK 118,284 m. on December 31, 2001 (SEK 154 per share). The
AGM 2014 CEO speech. Dear shareholders,
 AGM 2014 CEO speech Dear shareholders, Welcome to the Annual General Meeting for Investor AB. I hope that you have met with our great employees, and that you have acquainted yourselves with, and perhaps
>>06. Contents FINANCIALS
 ANNUAL REPORT 2006 >> Contents Shareholder information........................ Welcome to Investor........................... President s comments........................ 2 Vision, goal and strategy.......................
Interim Report January-September 2009
 Interim Report January-September 2009 Highlights during the third quarter Gambro, CaridianBCT and Mölnlycke Health Care showed strong operational momentum. 3 Scandinavia turned EBIT positive for the month
Corporate Governance Report
 Corporate Governance Report Corporate governance practices refer to the decision making systems through which owners, directly or indirectly, govern a company. s business model of active ownership is to
Interim Report January-June, 2014
 Interim Report January-June, 2014 Johan Dennelind President and CEO All regions contribute to stable margin Group service revenues flat - net sales negatively impacted by Spain Underlying EBITDA maintained
Investor s total return in 1999 amounted to 35 percent (-1). The return for the new investments business was more than 50 percent (30) in 1999.
. The return for the new investments business was more than 50 percent (30) in 1999.") Investor s net asset value on December 31,, was SEK 153,259 m. (compared with SEK 93,502 m. in the previous year). This corresponds to SEK 191 (117) per share. During the year, the net asset value increased
Investor s net asset value on December 31,, was SEK 153,259 m. (compared with SEK 93,502 m. in the previous year). This corresponds to SEK 191 (117) per share. During the year, the net asset value increased
Improved margin and cash flow in Q1 2013
 2013-06-04 BofA Merrill Lynch Global Telecom & Media conference June 4, 2013 Per-Arne Blomquist President and CEO 1 Improved margin and cash flow in Q1 2013 Revenue growth impacted by reduced mobile interconnect
Interim Report January-June 2009
 Interim Report January-June 2009 Highlights during the second quarter 3 Scandinavia continued to report healthy growth and the Swedish operation reached EBIT breakeven for the month of June. No significant
Interim Report January March 2017
 Interim Report January March 2017 First quarter 2017 Net sales increased by 4 per cent in the first quarter, to SEK 1,930 (1,859) million. Organic growth excluding foreign exchange effects was 1 per cent.
INTERIM REPORT JANUARY SEPTEMBER 2017 JOHAN DENNELIND, PRESIDENT & CEO
 INTERIM REPORT JANUARY SEPTEMBER 2017 Q3 JOHAN DENNELIND, PRESIDENT & CEO KEY TAKEAWAYS FOR Q3 NORWAY KEEPS DELIVERING SWEDEN REDUCING COSTS SWEDEN FIBER DELAYS + 2018 400m -6% 8,000 STRONG YTD OPCF REALLOCATING
third QUARTER october 2010
 third QUARTER 2010 22 october 2010 HENRY STÉNSON SENIOR VICE PRESIDENT COMMUNICATIONS Third QUARTER 2010 THIS PRESENTATION CONTAINS FORWARD-LOOKING STATEMENTS. SUCH STATEMENTS ARE BASED ON OUR CURRENT
12/ / Assets, SEK m Net debt/cash, SEK m
 Year-End Report 2007 Important events in the fourth quarter Investor increased its ownership in selected Core Investments. Net purchases of shares were made in Husqvarna for SEK 255 m., in Electrolux for
Year-end Report January-December, 2012
 Year-end Report January-December, 20 Lars Nyberg President and CEO Record-high Free cash flow during 20 Net sales SEK 4,898 million (4,804) Increased 1.2% in local currencies EBITDA* SEK 36,059 million
first QUARTER april 2010
 first QUARTER 2010 23 april 2010 HENRY STÉNSON SENIOR VICE PRESIDENT COMMUNICATIONS first QUARTER 2010 THIS PRESENTATION CONTAINS FORWARD LOOKING STATEMENTS. SUCH STATEMENTS ARE BASED ON OUR CURRENT EXPECTATIONS
TeliaSonera Interim Report January September 2015
 Solid core business THIRD QUARTER SUMMARY Net sales increased 6.3 percent to SEK 27,029 million (25,417). Net sales in local currencies, excluding acquisitions and disposals, increased 2.4 percent. Service
Interim report Q3 2018
 Interim report Q3 2018 October 25, 2018 Per Lindberg, President and CEO Anders Lindén, CFO Key highlights Q3 2018 A solid quarter Continued good customer demand Organic growth vs. Q3 2017, but lower order
SECOND QUARTER July 2009
 SECOND QUARTER 29 22 July 29 AGENDA CEO review Financial review Concluding remarks Harri Koponen Lars Nilsson Harri Koponen 2 29-7-22 Second quarter 29 HIGHLIGHTS Q2 Record result with all regions performing
Acquisition of Aleris Care Announcement presentation. 16 October 2018
 Acquisition of Aleris Care Announcement presentation 16 October 2018 Transaction summary Transaction in brief The acquisition Ambea has entered into an agreement to acquire Aleris Care at an enterprise
Eltel AB Q Presentation
 Eltel AB Q2 2018 Presentation 9 August 2018 Eltel - Shaping Future Infranets 1 Today s presenters Håkan Kirstein CEO Petter Traaholt CFO Eltel - Shaping Future Infranets 2 Highlights An agreement to divest
JANUARY 1 SEPTEMBER 30, 2018
 JANUARY 1 SEPTEMBER 30, 2018 (compared with the corresponding period a year ago) Net sales increased 8.4% to SEK 87,388m (80,601) Organic net sales, which exclude exchange rate effects, acquisitions and
FLAT +3.8% YEAR-END REPORT JANUARY DECEMBER 2017 STRONG Q4 PUTS 2017 CASH FLOW WELL ABOVE EXPECTATIONS JOHAN DENNELIND PRESIDENT & CEO 2.
 YEAR-END REPORT JANUARY DECEMBER 2017 JOHAN DENNELIND PRESIDENT & CEO Q4 STRONG Q4 PUTS 2017 CASH FLOW WELL ABOVE EXPECTATIONS We said: cash flow above SEK 7.5 billion WE DID 9.7bn +0.8bn Q4 (+0.8bn Q4)
Full year report January December 2016
 Full year report January December 2016 Telephone conference February 10, 2017 Thomas Berglund, CEO Olof Bengtsson, CFO Continued positive development in Nordic and Germany France compensated for the main
Mr Green & Co AB. Interim Report January-June Per Norman CEO & Simon Falk CFO. 21 July 2017 conference call
 Mr Green & Co AB Interim Report January-June 2017 Per Norman CEO & Simon Falk CFO 21 July 2017 conference call Revenues +36.3% EBITDA margin 18.2% Customer deposits +34.4% Q217 vs Q216 2 Strong financial
Interim Report, January-March 2001
 Interim Report, January-March 2001 Investor s net asset value* on March 31, 2001 amounted to SEK 126,216 m. (compared with SEK 157,772 m. on March 31, 2000), corresponding to SEK 165 per share (206). At
Interim Report January June 2011
 Interim Report January June Lars Nyberg President and CEO 1 A united TeliaSonera shows strong profitability Net sales SEK 25,894 million (27,065) Increased 3.0 percent in local currencies EBITDA* SEK 9,9
Nomura Financial Services Conference London, 29 August Jan Erik Back, CFO
 Nomura Financial Services Conference London, 29 August 2012 Jan Erik Back, CFO SEB s strategy remains firm Universal bank in Sweden and the Baltics Corporate bank in the Nordics, Germany and internationally
Mr Green & Co AB. Interim Report January - September Per Norman CEO & Simon Falk CFO. October 28, 2016
 Mr Green & Co AB Interim Report January - September Per Norman CEO & Simon Falk CFO October 28, 1 vs 2 Delivering on our new strategy Mr Green 2.0 FIVE CORNERSTONES; BRAND, USER EXPERIENCE, PRODUCT OFFERING,
Interim Report January September 2014
 Interim Report January September 2014 Johan Dennelind President & CEO Capital Markets Day summary 2018 2013 2014 2015 2016 2017 The New TeliaSonera Big changes Stabilize & shape Transform & perform Transform
Strong quarter for the Nolato Group
 Nolato AB (publ) nine-month interim report 2007 Strong quarter for the Nolato Group Third quarter 2007 in brief Strong margin for Nolato Telecom and continued growth in sales for Nolato Medical Sales totaled
RECORD SALES, EBITA AND CASH FLOW ACCELERATED ORGANIC GROWTH TO 19 %
 RECORD SALES, EBITA AND CASH FLOW ACCELERATED ORGANIC GROWTH TO 19 % Bygghemma Group First AB (publ) 1 Today s presenters Mikael Olander President and CEO Martin Edblad CFO Bygghemma Group since 2012 CEO
Year-end Report 2016
 Year-end Report Magnus Groth President and CEO January 26, 2017 Year-end Report 2 Summary Organic sales increased 2% 1) Hygiene business +3%, Forest Products -3%, Emerging markets +7% Increased organic
Note 10. Employees and personnel costs 1
 Note. Employees and personnel costs Guidelines for salary and other for the President and Accounting policies other Members of the Extended Management Group Accounting policies on employee benefits such
Third quarter report 2009
 Third quarter report 2009 Henry sténson Senior Vice President Communications Third quarter report 2009 This presentation contains forward looking statements. Such statements are based on our current expectations
Interim report Jan- Mar 2018
 Interim report Jan- Mar 2018 JONAS GUSTAVSSON, CEO STEFAN JOHANSSON, CFO APRIL 25, 2018 Agenda Business overview Market and highlights Financials Divisional performance Strategy implementation Summary
Investor breakfast meeting
 Annika Falkengren President & CEO Jan Erik Back CFO Investor breakfast meeting 17 August 20 1 Priorities for 20 Maintain flexibility & resilience Exploit core strengths Corporates in Nordics & Germany
6 OF 7 MARKETS 5BN/YEAR INTERIM REPORT JANUARY MARCH 2018 GOOD START OF 2018 JOHAN DENNELIND PRESIDENT & CEO MOBILE GROWTH ACROSS FOOTPRINT
 INTERIM REPORT JANUARY MARCH 2018 Q1 JOHAN DENNELIND PRESIDENT & CEO GOOD START OF 2018 MOBILE GROWTH ACROSS FOOTPRINT 6 OF 7 MARKETS REPORTED EBITDA GROWTH +7.4% STRONG OPERATIONAL FREE CASH FLOW 4.3BN
Kimmo Alkio President and CEO Lasse Heinonen CFO
 Tieto Q1/2012 Kimmo Alkio President and CEO Lasse Heinonen CFO Summary Financial performance in line with short-term expectations New strategy for 2012 2016 launched and well received Competitive cost
Annika Falkengren. President and CEO. Result presentation
 Annika Falkengren President and CEO Result presentation 2010 Highlights Income Solid results given present macroeconomic climate Lower provisioning for credit losses and no new NPL formation Provisions
Year-end Report January December 2014
 Year-end Report January December 2014 Johan Dennelind President & CEO 4 4G population coverage now exceeds 99 percent in Sweden 4G traffic now surpasses 3G traffic in Sweden 4 new villas per hour connected
Interim report. January-June 2006
 Interim report January-June 2006 Interim report January-June 2006 Anders Igel President and CEO Record result SEK 6.3 billion in Growth 4.5% EBITDA 1 margin 35% (33) EPS 0.94 (0.44) SEK million 25,000
JANUARY 1 JUNE 30, 2017
 JANUARY 1 JUNE 30, 2017 (compared with the corresponding period a year ago) Net sales increased 9% to SEK 53,423m (49,231) Organic sales, excluding exchange rate effects, acquisitions and divestments,
Mr Green & Co AB. Interim Report January-September Per Norman CEO & Simon Falk CFO. 27 October 2017 Conference Call
 Mr Green & Co AB Interim Report January-September 2017 Per Norman CEO & Simon Falk CFO 27 October 2017 Conference Call Revenues +28.4% EBITDA margin 17.1% Customer deposits +24.8% Q317 vs Q316 2 Continued
Year end report. January-December st of January 2018 Mikael Ericson, President and CEO Erik Forsberg, CFO
 Year end report January-December 2017 31 st of January 2018 Mikael Ericson, President and CEO Erik Forsberg, CFO Agenda 1. Highlights for the fourth quarter and FY 2017 2. Key messages from Capital Markets
Cash flow and balance sheet Financial resilience
 Cash flow and balance sheet Financial resilience Capital markets day 2017 N O V E M B E R 7-8, 2 0 1 7 N E W Y O R K Ericsson Internal 2017-10-06 Page 1 Carl Mellander CFO Ericsson Internal 2017-10-06
JANUARY 1 MARCH 31, 2018
 JANUARY 1 MARCH 31, 2018 (compared with the corresponding period a year ago) Net sales increased 10.9% to SEK 28,020m (25,268) Organic net sales, which exclude exchange rate effects, acquisitions and divestments,
Tieto Q4/2012. Kimmo Alkio President and CEO Lasse Heinonen CFO Pellervo Hämäläinen VP, Communications & IR. 6 February 2013
 Tieto Q4/2012 Kimmo Alkio President and CEO Lasse Heinonen CFO Pellervo Hämäläinen VP, Communications & IR 2013 Tieto Corporation 6 February 2013 1 Q4 2012 in brief Strong improvement in underlying profitability
PRESENTATION OF THE FOURTH QUARTER AND FULL-YEAR FEBRUARY 2018
 PRESENTATION OF THE FOURTH QUARTER AND FULL-YEAR 2017 9 FEBRUARY 2018 AGENDA A B C D Operating Companies Performance in Q4 2017 Kinnevik s Financial Position Review of Full-Year 2017 2018 Priorities TODAY
Q Interim report January-March 2017
 Q1 217 Interim report January-March 217 Sales and results of operations Group Progress in the quarter Income and profit both generated from a broader base spanning more parts of Catella Generally higher
ENIRO Q1 REPORT Johan Lindgren, CEO Mattias Lundqvist, CFO Cecilia Lannebo, Head of IR
 ENIRO Q1 REPORT 2012-04-25 Johan Lindgren, CEO Mattias Lundqvist, CFO Cecilia Lannebo, Head of IR FINANCIAL HIGHLIGHTS, Q1 2012 Revenues SEK 959 M (966), a decline of 0,7% (-24). Organically revenues declined
Interim Report Q3, 2013 November 6, 2013
 Interim Report Q3, November 6, Bo Annvik President and CEO Andreas Ekberg CFO Innovative Vehicle Solutions Agenda Business Highlights Market Update Sales Financials Outlook Q&A Innovative Vehicle Solutions
Q1 Q Q3 Q EUR million Jan-Mar 2018 Jan-Mar 2017 Change, % EUR million Jan-Dec 2017
 Stockholm, Sweden, 4 May Eltel Group Interim report January March January March Group net sales decreased 10.5% to EUR 266.6 million (297.8), mainly as a result of divestments and on-going discontinuation
Year-end report JANUARY DECEMBER 2015
 Year-end report JANUARY DECEMBER 215 Having joined Bisnode on 1 September, it is now my pleasure to present the first year-end report as CEO of Bisnode. As communicated in the Q3 215 report we have in
EVRY ASA Q PRESENTATION CEO BJÖRN IVROTH CFO HENRIK SCHIBLER
 1 EVRY ASA Q1 2018 PRESENTATION CEO BJÖRN IVROTH CFO HENRIK SCHIBLER Agenda Group highlights Business update Financial highlights Business area performance Targets and Concluding remarks Q&A 2 Group highlights
Recommended cash offer of SEK 111 per share in Gambro
 Press release April 3, 2006 Recommended cash offer of SEK 111 per share in Gambro Indap AB ( Indap ), indirectly jointly-owned by Investor AB ( Investor ) and EQT IV ( EQT ), today announces a public cash
First Quarter
 First Quarter 214 214-5-6 First quarter 214 New organization more focus on e-commerce greater synergy potential New brand structure Continued decline in mail volumes and increased price pressure Restructuring
Telephone Conference Q2-18 Johan Torgeby President & CEO 17 July, 2018
 Telephone Conference Q2-18 Johan Torgeby President & CEO 17 July, 2018 Highlights Jan-Jun 2018 Pick-up in customer activity following a muted start of the year Broad based demand for SEB s services Strong
BUSINESS REVIEW Q3/2018 / CRAMO PLC Q3
 BUSINESS REVIEW /2018 / CRAMO PLC 1 PROFITABLE GROWTH CONTINUED BUSINESS REVIEW /2018 / CRAMO PLC JULY SEPTEMBER 2018 Sales EUR 197.9 (191.9) million, up by 3.1%. In local currencies, sales grew by 7.5%.
Full year report January December 2017
 Full year report January December 2017 Telephone conference February 7, 2018 Thomas Berglund, CEO Olof Bengtsson, CFO Solid Q4 now speeding up the journey of specialization and digitalization Highlights
Q1 January 1 31 March May 2016
 Q1 January 1 31 March 2016 19 May 2016 Humana at a glance Humana highlights Clear focus on full responsibility 1 Leading Nordic care company founded in 2001 with four strong business areas Focus on full
Q FINANCIAL REPORT. Lars-Johan Jarnheimer President and CEO
 Q4 26 FINANCIAL REPORT Lars-Johan Jarnheimer President and CEO TELE2: Q4 26 RESULTS SEK MILLION 26 25 26 25 Q4 Q4 Full Year Full Year Continuing operations Operating revenue 12,952 12,635 5,36 44,457 Net
Mr Green & Co AB Interim Report - Q3
 Mr Green & Co AB Interim Report - January-September November 6, MR GREEN & CO AB 1 The Mr Green Group organized for growth Mr Green & Co AB Sweden Mr Green & Co AB - a Swedish company owning, acquiring
Annika Falkengren. President and CEO. Result presentation. January September 2010
 Annika Falkengren President and CEO Result presentation January September 2010 Highlights Income Seasonally slow quarter supported by diversified earnings Further improved asset quality Baltics back in
Interim Report January March 2017
 ALIG, SE715891 Interim Report January March 217 For more information contact: Per Ekstedt, CFO, Phone: +46 ()8 42 14 57 / Sofia Wretman, Head of IR, Phone: +46 ()8 42 14 41 217 - Solid performance FIRST
TietoEnator Q4 and full year February 2008, Helsinki Strategy and actions for 2008 Interim CEO Åke Plyhm
 TietoEnator Q4 and full year 2007 6 February 2008, Helsinki Strategy and actions for 2008 Interim CEO Åke Plyhm Performance and outlook CFO Timo Salmela Strategy and actions for 2008 Performance and outlook
Third quarter report 2018 Stockholm, October 18, 2018
 Third quarter report Stockholm, October 18, Third quarter highlights Sales as reported increased YoY by 9% and sales adjusted for comparable units and currency increased by 1%. Segment Networks showed
First Quarter Report 2011
 Copenhagen, Helsinki, Oslo, Stockholm, 28 April 2011 First Quarter Report 2011 Solid quarter CEO Christian Clausen s comment to the report: I am proud to present another strong quarter. Our relationship
Viking Assistance Group AS. Quarterly Report 3Q17 July September 2017
 Viking Assistance Group AS Quarterly Report 3Q17 July September 2017 THIRD QUARTER 2017 SUMMARY Group revenues of MNOK 179,0 Group EBITDA of MNOK 12,6 Solid assistance margins during the quarter Higher
EVRY ASA Q PRESENTATION CEO BJÖRN IVROTH CFO HENRIK SCHIBLER
 1 EVRY ASA Q3 2018 PRESENTATION CEO BJÖRN IVROTH CFO HENRIK SCHIBLER Agenda Group highlights Business update Financial highlights Business area performance Concluding remarks Q&A 2 Group highlights Q3
Year-end Report January - December 2011
 Year-end Report January - December 2 Lars Nyberg President and CEO 1 Continued revenue growth and margin expansion Net sales SEK 1,35 million (16,979) Increased 2.6% in local currencies EBITDA* SEK 36,91
Telenor Fourth Quarter Jon Fredrik Baksaas, CEO
 Telenor Fourth Quarter 2011 Jon Fredrik Baksaas, CEO Disclaimer The following presentation is being made only to, and is only directed at, persons to whom such presentation may lawfully be communicated
Q4 Presentation February, 2013
 Q4 Presentation 2012 14 February, 2013 Disclaimer This presentation has been prepared by Duni AB (the Company ) solely for use at this investor presentation and is furnished to you solely for your information
Investor Presentation. Result presentation. January September 2010
 Investor Presentation Result presentation January September 2010 Highlights Income Seasonally slow quarter supported by diversified earnings Further improved asset quality Baltics back in black Profit
Q3 report November Per Strömberg, CEO Sven Lindskog, CFO
 report 11 November Per Strömberg, CEO Sven Lindskog, CFO Good quarter across the Group Stable financial development Improved net sales +5% on a comparable basis Improved EBIT MSEK 149 of which Apotek Hjärtat
YEAR-END REPORT JANUARY DECEMBER 2016
 YEAR-END REPORT JANUARY DECEMBER 20 JOHAN DENNELIND, PRESIDENT & CEO DELIVERING ON OUR AMBITIONS WE REVISED UP AND SAID EBITDA IN LINE OR SLIGHTLY ABOVE 2015 WE DID +2.6% WE SAID CAPEX IN THE UPPER RANGE
Interim Report January September 2017
 Interim Report January September 2017 Third quarter of 2017 Net sales increased by 7 per cent in the third quarter, to SEK 1,853 (1,740) million. Adjusted EBITA increased by 7 per cent to SEK 104 (97)
Improved profitability continued measures to reverse trend in digital revenue
 INTERIM REPORT 2016 JANUARY MARCH Improved profitability continued measures to reverse trend in digital revenue I am happy to report that our efficiency improvement measures are having an effect. The EBITDA
Elisa Corporation Interim Report. 1 January March 2003
 Elisa Corporation Interim Report 1 January 2003 31 March 2003 Contents Review of Q1 2003 and Future Outlook CEO Matti Mattheiszen Group Key Figures and Financial Situation CFO Vesa-Pekka Silaskivi Performance
JANUARY 1 DECEMBER 31, 2017
 JANUARY 1 DECEMBER 31, 2017 (compared with the corresponding period a year ago) Net sales increased 8.0% to SEK 109,265m (101,238) Operating profit before amortization of acquisition-related intangible