Gabelli 41 st Annual Automotive Aftermarket Symposium. October 30 31, 2017
|
|
|
- Monica Park
- 6 years ago
- Views:
Transcription


1 Gabelli 41 st Annual Automotive Aftermarket Symposium October 30 31,


2 Forward Looking Statements You should be aware that except for historical information, the matters discussed herein are forward looking statements within the meaning of the Private Securities Litigation Reform Act of Forward looking statements, including projections and anticipated levels of future performance, are based on current information and assumptions and involve risks and uncertainties which may cause actual results to differ materially from those discussed herein. You are urged to review our filings with the SEC and our press releases from time to time for details of these risks and uncertainties. 2


3 SMP Snapshot 98 Years in Business Founded 1919 $1.06 Billion 2016 Sales 4,100 Employees Worldwide LAWRENCE I. SILLS Executive Chairman Board of Directors ERIC P. SILLS Director, CEO and President JAMES J. BURKE EVP Finance and Chief Financial Officer DALE BURKS EVP and Chief Commercial Officer 2016 Sales Breakdown Sales by Market 89% 11% Aftermarket OE / OES Sales by Product Line 27% 73% Engine Mgmt Temp Control Major Product Categories Engine Management Ignition Products Emissions Products Fuel Delivery Vehicle Electronics Wire & Cable Temperature Control A/C Compressors Other A/C System Components Engine Cooling Products Blower & Radiator Fan Motors Window Lift Motors 3


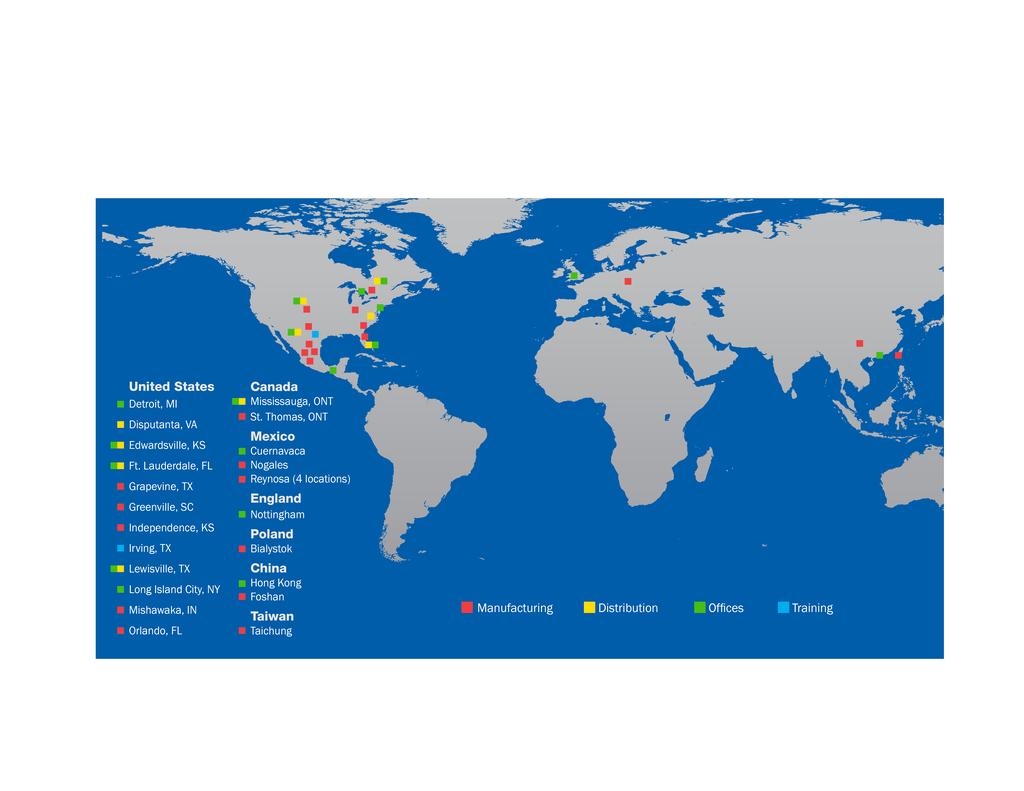
4 SMP Snapshot Professionally Recognized Brands Global Footprint 3 Million sq. ft. 14 Manufacturing Plants 5 Distribution Centers 9 Offices 4
5 Favorable Industry Trends Vehicle Population Continues to Age Average Age of Cars and Light Trucks 4.0% Miles Driven is Increasing Annual Miles Driven, (Percent Change from Previous Year) 3.5% % 2.8% % 1.0% 0.9% 0.8% 0.5% 0.3% 0.3% 1.1% 1.3% % % -2.0% -1.9% -0.6% -0.7% DIFM Revenue Continues to Grow Age Mix of Vehicles Billions $250 $200 $150 $100 DIFM DIY 100% 80% 60% 40% VIO (11 and Older) VIO (6-10 yrs) VIO (0-5 yrs) 33.5% 32.0% 29.7% 27.6% 26.1% 25.1% 25.1% 27.1% 28.6% 29.7% 30.2% 30.8% 31.1% 30.9% 30.6% 30.1% 29.0% 25.9% 23.5% 21.8% $50 20% 36.3% 37.2% 39.2% 41.6% 43.2% 44.8% 45.9% 47.1% 48.0% 48.5% $ * 2017* 2018* 2019* 0%


6 Industry Outlook 2025 Industry Outlook 2025 Slow & steady revenue growth 2-3% per year All Growth in DIFM segment DIY is Flat 2013 Aftermarket Parts Size and Share by Segment 2025 Aftermarket Parts Size and Share by Segment DIY $20B 26% DIY $20B 22% DIFM New Vehicle Dealer $13B 17% 57% DIFM Non-Dealer $43B DIFM New Vehicle Dealer $18B 20% 58% DIFM Non-Dealer $52B Includes all categories Engine Management is even more skewed to DIFM Source: strategy& / Booz & Company 6

7 Premium Value Proposition Best-in-Class Full-Line, Full-Service Supplier Of Premium Engine Management and Temperature Control Products Our premium brands meet all the commercial customers needs Premium Quality Customer Training Premium Brands Field Sales Support Full-Line Coverage Marketing Support Supply Chain Excellence 7
8 Strategic Objectives Premium Value Proposition Drive for Continuous Improvement Successful Growth Programs External programs that provide real value to our customers Best-in-class full-line, full-service supplier of premium engine management and temperature control products Internal programs that make us a stronger company Investment in increased manufacturing Increase in low-cost footprint Global sourcing without compromise to quality Strategic expansion of our business Complementary product lines Complementary markets, geographies and channels Strategic acquisitions Return to Shareholders Dividend Increase Treasury Stock Buyback Program 8

 ($M) UP 28.1% $125.0 $123.5 UP 2.")

9 5 Year Performance Measures Consolidated Net Sales ($M) Gross Margin $1,100 UP 8.9% 31.0% $950 $983.7 $980.4 $1,058.5 $972.0 UP 5.7% 30.0% 29.5% $800 $ % 29.5% $828.7 $765.0 $762.3 $767.0 $ % 28.9% 30.5% 29.4% $ % $ % $ % $ % /2017 YTD Sept YTD Full Year EBITDA (w/o Special Items) ($M) UP 28.1% $125.0 $123.5 UP 2.1% $100.0 $111.5 $106.8 $102.4 $104.6 $96.4 $86.0 $89.1 $75.0 $78.6 $50.0 $25.0 Diluted EPS (w/o Special Items) $3.00 UP 30.0% $2.50 $2.77 $2.52 $2.32 $2.35 $2.00 $2.28 $2.04 $2.13 $1.91 $1.50 $1.78 $1.00 $0.50 $ Sept YTD Full Year $ Sept YTD Full Year 9
10 Appendix 10
11 Reconciliation of GAAP and Non-GAAP Measures ($ in thousands) EBITDA WITHOUT SPECIAL ITEMS NINE MONTHS SEPTEMBER 30, (Unaudited) GAAP EARNINGS FROM CONTINUING OPERATIONS BEFORE TAXES $ 82,204 $ 85,037 $ 65,110 $ 64,100 $ 69,479 DEPRECIATION & AMORTIZATION 17,439 14,829 13,042 12,889 13,203 INTEREST EXPENSE 1,785 1,206 1,238 1,205 1,621 EBITDA 101, ,072 79,390 78,194 84,303 LITIGATION CHARGE ,650 - RESTRUCTURING AND INTEGRATION EXPENSES 3,914 2,127 (49) 1,069 2,531 GAIN FROM SALE OF BUILDINGS (786) (786) (786) (786) (786) SPECIAL ITEMS 3,128 1,341 (835) 10,933 1,745 EBITDA WITHOUT SPECIAL ITEMS $ 104,556 $ 102,413 $ 78,555 $ 89,127 $ 86,048 TOTAL DEBT $ 73,137 $ 70,178 $ 24,583 $ 59,271 $ 32,292 DEBT TO EBITDA RATIO (TTM) 0.6:1 0.6:1 0.2:1 0.5:1 0.3:1 MANAGEMENT BELIEVES THAT EBITDA WITHOUT SPECIAL ITEMS, WHICH IS A NON-GAAP MEASUREMENT, IS MEANINGFUL TO INVESTORS BECAUSE IT PROVIDES A VIEW OF THE COMPANY WITH RESPECT TO ONGOING OPERATING RESULTS. SPECIAL ITEMS REPRESENT SIGNIFICANT CHARGES OR CREDITS THAT ARE IMPORTANT TO AN UNDERSTANDING OF THE COMPANY'S OVERALL OPERATING RESULTS IN THE PERIODS PRESENTED. SUCH NON-GAAP MEASUREMENTS ARE NOT RECOGNIZED IN ACCORDANCE WITH GENERALLY ACCEPTED ACCOUNTING PRINCIPLES AND SHOULD NOT BE VIEWED AS AN ALTERNATIVE TO GAAP MEASURES OF PERFORMANCE. 11
12 Reconciliation of GAAP and Non-GAAP Measures (cont d) ($ in thousands, except per share amounts) EARNINGS FROM CONTINUING OPERATIONS NINE MONTHS SEPTEMBER 30, (Unaudited) GAAP EARNINGS FROM CONTINUING OPERATIONS $ 51,736 $ 53,573 $ 42,341 $ 41,382 $ 43,652 LITIGATION CHARGE ,650 - RESTRUCTURING AND INTEGRATION EXPENSES 3,914 2,127 (49) 1,069 2,531 REVERSAL OF LT TAX LIABILITY (350) - CERTAIN TAX CREDITS AND PRODUCTION DEDUCTIONS FINALIZED IN PERIOD (463) (235) (571) (361) (374) GAIN FROM SALE OF BUILDINGS (786) (786) (786) (786) (786) INCOME TAX EFFECT RELATED TO RECONCILING ITEMS (1,251) (536) 333 (4,373) (698) NON-GAAP EARNINGS FROM CONTINUING OPERATIONS $ 53,150 $ 54,143 $ 41,268 $ 47,231 $ 44,325 DILUTED EARNINGS PER SHARE FROM CONTINUING OPERATIONS GAAP DILUTED EARNINGS PER SHARE FROM CONTINUING OPERATIONS $ 2.22 $ 2.32 $ 1.82 $ 1.79 $ 1.88 LITIGATION CHARGE RESTRUCTURING AND INTEGRATION EXPENSES REVERSAL OF LT TAX LIABILITY (0.02) - CERTAIN TAX CREDITS AND PRODUCTION DEDUCTIONS FINALIZED IN PERIOD (0.02) (0.01) (0.03) (0.02) (0.02) GAIN FROM SALE OF BUILDINGS (0.03) (0.03) (0.03) (0.03) (0.03) INCOME TAX EFFECT RELATED TO RECONCILING ITEMS (0.05) (0.02) 0.02 (0.19) (0.03) NON-GAAP DILUTED EARNINGS PER SHARE FROM CONTINUING OPERATIONS $ 2.28 $ 2.35 $ 1.78 $ 2.04 $ 1.91 MANAGEMENT BELIEVES THAT EARNINGS FROM CONTINUING OPERATIONS AND DILUTED EARNINGS PER SHARE FROM CONTINUING OPERATIONS, EACH OF WHICH ARE NON-GAAP MEASUREMENTS AND ARE ADJUSTED FOR SPECIAL ITEMS, ARE MEANINGFUL TO INVESTORS BECAUSE THEY PROVIDE A VIEW OF THE COMPANY WITH RESPECT TO ONGOING OPERATING RESULTS. SPECIAL ITEMS REPRESENT SIGNIFICANT CHARGES OR CREDITS THAT ARE IMPORTANT TO AN UNDERSTANDING OF THE COMPANY'S OVERALL OPERATING RESULTS IN THE PERIODS PRESENTED. SUCH NON-GAAP MEASUREMENTS ARE NOT RECOGNIZED IN ACCORDANCE WITH GENERALLY ACCEPTED ACCOUNTING PRINCIPLES AND SHOULD NOT BE VIEWED AS AN ALTERNATIVE TO GAAP MEASURES OF PERFORMANCE. 12
13 Reconciliation of GAAP and Non-GAAP Measures (cont d) ($ in thousands) EBITDA WITHOUT SPECIAL ITEMS TWELVE MONTHS DECEMBER 31, (Unaudited) GAAP EARNINGS FROM CONTINUING OPERATIONS BEFORE TAXES $ 98,570 $ 74,103 $ 81,753 $ 84,962 $ 67,947 DEPRECIATION & AMORTIZATION 20,457 17,637 17,295 17,595 16,466 INTEREST EXPENSE 1,556 1,537 1,616 1,902 2,788 EBITDA 120,583 93, , ,459 87,201 CUSTOMER BANKRUPTCY CHARGE - 3, DEFERRED FINANCING FEE WRITE-OFF LITIGATION CHARGE , RESTRUCTURING AND INTEGRATION EXPENSES (INCOME) 3,957 (134) 1,197 3,357 1,437 GAIN FROM SALE OF PREFERRED STOCK INVESTMENT GAIN FROM DEBENTURE REPURCHASE GOODWILL AND INTANGIBLE ASSET IMPAIRMENT GAIN FROM SALE OF BUILDINGS (1,048) (1,048) (1,048) (1,048) (1,287) SPECIAL ITEMS 2,909 3,105 10,799 2, EBITDA WITHOUT SPECIAL ITEMS $ 123,492 $ 96,382 $ 111,463 $ 106,768 $ 87,351 TOTAL DEBT $ 54,975 $ 47,505 $ 56,816 $ 21,481 $ 40,648 DEBT TO EBITDA RATIO (TTM) 0.4:1 0.5:1 0.5:1 0.2:1 0.5:1 MANAGEMENT BELIEVES THAT EBITDA WITHOUT SPECIAL ITEMS, WHICH IS A NON-GAAP MEASUREMENT, IS MEANINGFUL TO INVESTORS BECAUSE IT PROVIDES A VIEW OF THE COMPANY WITH RESPECT TO ONGOING OPERATING RESULTS. SPECIAL ITEMS REPRESENT SIGNIFICANT CHARGES OR CREDITS THAT ARE IMPORTANT TO AN UNDERSTANDING OF THE COMPANY'S OVERALL OPERATING RESULTS IN THE PERIODS PRESENTED. SUCH NON-GAAP MEASUREMENTS ARE NOT RECOGNIZED IN ACCORDANCE WITH GENERALLY ACCEPTED ACCOUNTING PRINCIPLES AND SHOULD NOT BE VIEWED AS AN ALTERNATIVE TO GAAP MEASURES OF PERFORMANCE. 13
14 Reconciliation of GAAP and Non-GAAP Measures (cont d) ($ in thousands, except per share amounts) EARNINGS FROM CONTINUING OPERATIONS TWELVE MONTHS DECEMBER 31, (Unaudited) GAAP EARNINGS FROM CONTINUING OPERATIONS $ 62,412 $ 48,120 $ 52,899 $ 53,043 $ 42,969 CUSTOMER BANKRUPTCY CHARGE - 3, DEFERRED FINANCING FEE WRITE-OFF LITIGATION CHARGE , RESTRUCTURING AND INTEGRATION EXPENSES (INCOME) 3,957 (134) 1,197 3,357 1,437 REVERSAL OF LT TAX LIABILITY - - (350) - - CERTAIN TAX CREDITS AND PRODUCTION DEDUCTIONS FINALIZED IN PERIOD (235) (571) (361) (374) (774) GAIN FROM SALE OF BUILDINGS (1,048) (1,048) (1,048) (1,048) (1,287) INCOME TAX EFFECT RELATED TO RECONCILING ITEMS (1,164) (1,243) (4,320) (924) (60) NON-GAAP EARNINGS FROM CONTINUING OPERATIONS $ 63,922 $ 49,411 $ 58,667 $ 54,054 $ 42,285 DILUTED EARNINGS PER SHARE FROM CONTINUING OPERATIONS GAAP DILUTED EARNINGS PER SHARE FROM CONTINUING OPERATIONS $ 2.70 $ 2.08 $ 2.28 $ 2.28 $ 1.86 CUSTOMER BANKRUPTCY CHARGE DEFERRED FINANCING FEE WRITE-OFF LITIGATION CHARGE RESTRUCTURING AND INTEGRATION EXPENSES (INCOME) 0.17 (0.01) REVERSAL OF LT TAX LIABILITY - - (0.02) - - CERTAIN TAX CREDITS AND PRODUCTION DEDUCTIONS FINALIZED IN PERIOD (0.01) (0.03) (0.02) (0.02) (0.03) GAIN FROM SALE OF BUILDINGS (0.04) (0.04) (0.04) (0.04) (0.06) INCOME TAX EFFECT RELATED TO RECONCILING ITEMS (0.05) (0.05) (0.19) (0.04) - NON-GAAP DILUTED EARNINGS PER SHARE FROM CONTINUING OPERATIONS $ 2.77 $ 2.13 $ 2.52 $ 2.32 $
15 Thank You 15
Gabelli Automotive Aftermarket Symposium. October 31 November 1, 2016
 Gabelli Automotive Aftermarket Symposium October 31 November 1, 2016 1 Forward Looking Statements You should be aware that except for historical information, the matters discussed herein are forward looking
Standard Motor Products, Inc. Q Investor Presentation
 Standard Motor Products, Inc. Q3 2018 Investor Presentation 1 Forward Looking Statements You should be aware that except for historical information, the matters discussed herein are forward looking statements
Standard Motor Products, Inc. Q Investor Presentation
 Standard Motor Products, Inc. Q1 2018 Investor Presentation 1 Forward Looking Statements You should be aware that except for historical information, the matters discussed herein are forward looking statements
Standard Motor Products, Inc. Annual Meeting of Shareholders May 18 th, 2017
 Standard Motor Products, Inc. Annual Meeting of Shareholders May 18 th, 2017 1 2017 Annual Meeting of Shareholders AGENDA Larry Sills Executive Chairman Introduction Eric Sills Director, CEO & President
Standard Motor Products, Inc. Q Investor Presentation
 Standard Motor Products, Inc. Q2 2017 Investor Presentation 1 Forward Looking Statements You should be aware that except for historical information, the matters discussed herein are forward looking statements
Gabelli Automotive Aftermarket Symposium November 2-3, 2015
 Gabelli Automotive Aftermarket Symposium November 2-3, 2015 1 Forward Looking Statements You should be aware that except for historical information, the matters discussed herein are forward looking statements
Standard Motor Products, Inc.
 Standard Motor Products, Inc. 23 rd Annual Wall Street Institutional Investor Conference September 6, 2012 1 Forward Looking Statements You should be aware that except for historical information, the matters
Standard Motor Products, Inc.
 Standard Motor Products, Inc. 2011 Annual Automotive Aftermarket Symposium October 31 November 2, 2011 1 Forward Looking Statements You should be aware that except for historical information, the matters
Standard Motor Products, Inc. Announces Third Quarter 2010 Results and a Quarterly Dividend
 For Immediate Release For more information, contact: James J. Burke Standard Motor Products, Inc. (718) 392-0200 Jennifer Tio Maximum Marketing Services, Inc. (312) 226-4111 x2449 Jennifer.tio@maxmarketing.com
Standard Motor Products, Inc. Annual Meeting of Shareholders May 20, 2010
 Standard Motor Products, Inc. Annual Meeting of Shareholders May 20, 2010 2010 Annual Meeting of Shareholders Larry Sills, Chairman and CEO Jim Burke, VP Finance & CFO Forward Looking Statements You should
Standard Motor Products, Inc. Announces. Fourth Quarter and Year End 2015 Results
 For Immediate Release For more information, contact: James J. Burke Standard Motor Products, Inc. (718) 392-0200 Standard Motor Products, Inc. Announces Fourth Quarter and Year End 2015 Results New York,
Standard Motor Products, Inc. Announces. Fourth Quarter and 2016 Year End Results
 For Immediate Release For more information, contact: James J. Burke Standard Motor Products, Inc. (718) 392-0200 Standard Motor Products, Inc. Announces Fourth Quarter and 2016 Year End Results New York,
Standard Motor Products, Inc. Announces. Fourth Quarter and 2017 Year End Results
 For Immediate Release For more information, contact: James J. Burke Standard Motor Products, Inc. (718) 392-0200 Standard Motor Products, Inc. Announces Fourth Quarter and 2017 Year End Results New York,
Standard Motor Products, Inc. Announces. Third Quarter 2018 Results and a Quarterly Dividend
 For Immediate Release For more information, contact: James J. Burke Standard Motor Products, Inc. (718) 392-0200 Standard Motor Products, Inc. Announces Third Quarter 2018 Results and a Quarterly Dividend
Digital River, Inc. First Quarter Results (In thousands, except share data) Subject to reclassification
 Subject to reclassification") (In thousands, except share data) Consolidated Balance Sheets (Unaudited) December 31, Assets Current assets Cash and cash equivalents $ 500,742 $ 542,851 Short-term investments 144,615 162,794 Accounts
(In thousands, except share data) Consolidated Balance Sheets (Unaudited) December 31, Assets Current assets Cash and cash equivalents $ 500,742 $ 542,851 Short-term investments 144,615 162,794 Accounts
Standard Motor Products, Inc. Announces Fourth Quarter and Year End 2013 Results and a New Stock Repurchase Program
 For Immediate Release For more information, contact: James J. Burke Standard Motor Products, Inc. (718) 392-0200 Jennifer Tio Maximum Marketing Services, Inc. (312) 226-4111 x2449 Jennifer.tio@maxmarketing.com
Standard Motor Products, Inc. Announces. Second Quarter 2016 Results and a Quarterly Dividend
 For Immediate Release For more information, contact: James J. Burke Standard Motor Products, Inc. (718) 392-0200 Standard Motor Products, Inc. Announces Second Quarter 2016 Results and a Quarterly Dividend
Standard Motor Products, Inc. Announces Second Quarter 2009 Results
 For Immediate Release For more information, contact: James J. Burke Standard Motor Products, Inc. (718) 392-0200 Jennifer Tio Maximum Marketing Services, Inc. (312) 226-4111 x2449 Jennifer.tio@maxmarketing.com
Standard Motor Products, Inc. Announces Third Quarter 2009 Results
 For Immediate Release For more information, contact: James J. Burke Standard Motor Products, Inc. (718) 392-0200 Jennifer Tio Maximum Marketing Services, Inc. (312) 226-4111 x2449 Jennifer.tio@maxmarketing.com
Standard Motor Products, Inc. Announces. Fourth Quarter and 2018 Year End Results
 For Immediate Release For more information, contact: James J. Burke Standard Motor Products, Inc. (718) 392-0200 Standard Motor Products, Inc. Announces Fourth Quarter and 2018 Year End Results New York,
Standard Motor Products, Inc. Announces. Third Quarter 2017 Results and a Quarterly Dividend
 For Immediate Release For more information, contact: James J. Burke Standard Motor Products, Inc. (718) 392-0200 Standard Motor Products, Inc. Announces Third Quarter 2017 Results and a Quarterly Dividend
Digital River, Inc. Second Quarter Results (Unaudited, in thousands) Subject to reclassification
 Subject to reclassification") (Unaudited, in thousands) Condensed Consolidated Balance Sheets As of December 31, 2008 2007 Assets: Current assets Cash and cash equivalents $ 276,927 $ 381,788 Short-term investments 201,297 315,636
(Unaudited, in thousands) Condensed Consolidated Balance Sheets As of December 31, 2008 2007 Assets: Current assets Cash and cash equivalents $ 276,927 $ 381,788 Short-term investments 201,297 315,636
Digital River, Inc. Fourth Quarter Results (In thousands, except share data) Subject to reclassification
 Subject to reclassification") (In thousands, except share data) Consolidated Balance Sheets (Unaudited) 2012 2011 Assets Current assets Cash and cash equivalents $ 542,851 $ 497,193 Short-term investments 162,794 223,349 Accounts receivable,
(In thousands, except share data) Consolidated Balance Sheets (Unaudited) 2012 2011 Assets Current assets Cash and cash equivalents $ 542,851 $ 497,193 Short-term investments 162,794 223,349 Accounts receivable,
Standard Motor Products, Inc. Announces Third Quarter 2015 Results, a Quarterly Dividend and a New Revolving Credit Facility
 For Immediate Release For more information, contact: James J. Burke Standard Motor Products, Inc. (718) 392-0200 Standard Motor Products, Inc. Announces Third Quarter 2015 Results, a Quarterly Dividend
ServiceNow, Inc. Condensed Consolidated Statements of Operations (in thousands, except share and per share data)
") Condensed Consolidated Statements of Operations (in thousands, except share and per share data) December 31, 2015 December 31, 2014 December 31, 2015 December 31, 2014 Revenues: Subscription $ 244,702
Condensed Consolidated Statements of Operations (in thousands, except share and per share data) December 31, 2015 December 31, 2014 December 31, 2015 December 31, 2014 Revenues: Subscription $ 244,702
Standard Motor Products, Inc. Announces. Second Quarter 2017 Results and a Quarterly Dividend
 For Immediate Release For more information, contact: James J. Burke Standard Motor Products, Inc. (718) 392-0200 Standard Motor Products, Inc. Announces Second Quarter 2017 Results and a Quarterly Dividend
Standard Motor Products, Inc. Announces Second Quarter 2011 Results and a Quarterly Dividend
 For Immediate Release For more information, contact: James J. Burke Standard Motor Products, Inc. (718) 392-0200 Jennifer Tio Maximum Marketing Services, Inc. (312) 226-4111 x2449 Jennifer.tio@maxmarketing.com
ServiceNow, Inc. Condensed Consolidated Statements of Operations (in thousands, except share and per share data) (Unaudited)
 (Unaudited)") Condensed Consolidated Statements of Operations (in thousands, except share and per share data) September 30, 2016 September 30, 2015 September 30, 2016 September 30, 2015 Revenues: Subscription $ 318,934
Condensed Consolidated Statements of Operations (in thousands, except share and per share data) September 30, 2016 September 30, 2015 September 30, 2016 September 30, 2015 Revenues: Subscription $ 318,934
Fiscal 2019 First Quarter Results. October 30, 2018
 Fiscal 2019 First Quarter Results October 30, 2018 Safe Harbor This presentation contains forward-looking statements within the meaning of Section 27A of the Securities Act of 1933, as amended, and Section
Standard Motor Products, Inc. Announces. First Quarter 2017 Results and a Quarterly Dividend
 For Immediate Release For more information, contact: James J. Burke Standard Motor Products, Inc. (718) 392-0200 Standard Motor Products, Inc. Announces First Quarter 2017 Results and a Quarterly Dividend
ServiceNow, Inc. Condensed Consolidated Statements of Operations (in thousands, except share and per share data) (unaudited)
 (unaudited)") Condensed Consolidated Statements of Operations (in thousands, except share and per share data) Revenues: Subscription $ 166,751 $ 104,878 $ 567,217 $ 349,804 Professional services and other 31,253 20,352
Condensed Consolidated Statements of Operations (in thousands, except share and per share data) Revenues: Subscription $ 166,751 $ 104,878 $ 567,217 $ 349,804 Professional services and other 31,253 20,352
Standard Motor Products, Inc. Announces Second Quarter 2013 Results and a Quarterly Dividend
 For Immediate Release For more information, contact: James J. Burke Standard Motor Products, Inc. (718) 392-0200 Jennifer Tio Maximum Marketing Services, Inc. (312) 226-4111 x2449 Jennifer.tio@maxmarketing.com
October 26, Earnings Summary Third Quarter FY 2016
 October 26, 2016 Earnings Summary Third Quarter FY 2016 SAFE HARBOR Certain information contained in this presentation may constitute forward-looking statements within the meaning of the Private Securities
Standard Motor Products, Inc. Announces Fourth Quarter 2011 Results
 For Immediate Release For more information, contact: James J. Burke Standard Motor Products, Inc. (718) 392-0200 Jennifer Tio Maximum Marketing Services, Inc. (312) 226-4111 x2449 Jennifer.tio@maxmarketing.com
3 rd Quarter 2018 Earnings Release Conference Call
 3 rd Quarter 2018 Earnings Release Conference Call October 31, 2018 1 2018 Belden Inc. belden.com @beldeninc Safe Harbor Statement Our commentary and responses to your questions may contain forward-looking
Standard Motor Products, Inc. Announces Second Quarter 2012 Results and a Quarterly Dividend
 For Immediate Release For more information, contact: James J. Burke Standard Motor Products, Inc. (718) 392-0200 Jennifer Tio Maximum Marketing Services, Inc. (312) 226-4111 x2449 Jennifer.tio@maxmarketing.com
TENNECO REPORTS THIRD QUARTER 2014 RESULTS
 news release TENNECO REPORTS THIRD QUARTER 2014 RESULTS Record third quarter revenue of $2.1 billion Record third quarter EBIT of $140 million EPS of $1.27 per diluted share Lake Forest, Illinois, October
ServiceNow, Inc. Condensed Consolidated Statements of Operations (in thousands, except share and per share data) (Unaudited)
 (Unaudited)") Condensed Consolidated Statements of Operations (in thousands, except share and per share data) Revenues: Subscription $ 179,907 $ 117,375 Professional services and other 32,057 21,715 Total revenues 211,964
Condensed Consolidated Statements of Operations (in thousands, except share and per share data) Revenues: Subscription $ 179,907 $ 117,375 Professional services and other 32,057 21,715 Total revenues 211,964
NEWS RELEASE. Valvoline Reports Third-Quarter Fiscal 2018 Results
 NEWS RELEASE Valvoline Reports Third- Fiscal Results For the quarter, Valvoline Instant Oil Change (VIOC) delivers system-wide same-store sales (SSS) growth of 7.9 percent, Core North America premium mix
2018 Outlook. Webcast Presentation December 13, 2017
 2018 Outlook Webcast Presentation December 13, 2017 Safe Harbor Statement All statements made herein that are not historical facts should be considered as forward-looking statements within the meaning
Sales $ 407,444 $ 396,064 $ 1,602,580 $ 1,515,608 Cost of sales (258,660) (242,460) (1,021,230) (952,221)
 (242,460) (1,021,230) (952,221)") CONSOLIDATED STATEMENTS OF INCOME (Unaudited) (Dollar amounts in thousands, except per share data) 2018 2017 2018 2017 Sales $ 407,444 $ 396,064 $ 1,602,580 $ 1,515,608 Cost of sales (258,660) (242,460)
CONSOLIDATED STATEMENTS OF INCOME (Unaudited) (Dollar amounts in thousands, except per share data) 2018 2017 2018 2017 Sales $ 407,444 $ 396,064 $ 1,602,580 $ 1,515,608 Cost of sales (258,660) (242,460)
ITRON, INC. CONSOLIDATED STATEMENTS OF OPERATIONS
 , INC. CONSOLIDATED STATEMENTS OF OPERATIONS (Unaudited, in thousands, except per share data) Revenues $ 523,335 $ 642,477 $ 2,178,178 $ 2,434,124 Cost of revenues 359,835 449,944 1,463,031 1,687,666 Gross
ITRON, INC. CONSOLIDATED STATEMENTS OF OPERATIONS
 , INC. CONSOLIDATED STATEMENTS OF OPERATIONS (Unaudited, in thousands, except per share data) Revenues $ 504,063 $ 615,555 $ 1,654,843 $ 1,791,647 Cost of revenues 332,266 438,559 1,103,196 1,237,722 Gross
Tenneco Reports Fourth Quarter And Full-Year 2012 Financial Results
 news release Tenneco Reports Fourth Quarter And Full-Year 2012 Financial Results Highest-ever full-year revenue of $7.4 billion Record net income and EPS for Q4 and full year Record fourth quarter cash
EMC CORPORATION Consolidated Income Statements (in thousands, except per share amounts) Unaudited
 Unaudited") Consolidated Income Statements (in thousands, except per share amounts) Three Months Ended Nine Months Ended September 30, September 30, September 30, September 30, 2011 2010 2011 2010 Revenues: Product
Consolidated Income Statements (in thousands, except per share amounts) Three Months Ended Nine Months Ended September 30, September 30, September 30, September 30, 2011 2010 2011 2010 Revenues: Product
Bottomline Technologies Reconciliation to Non GAAP Measures Three Months Ended June 30, 2013
 Reconciliation to Measures Three Months Ended June 30, 2013 Non Cash Amortization of Equity Based Integration Restructuring Interest GAAP Intangible Assets Compensation Related Expenses Expenses Expense
Fiscal 2018 Fourth Quarter Results. July 26, 2018
 Fiscal 2018 Fourth Quarter Results July 26, 2018 Safe Harbor This presentation contains forward-looking statements within the meaning of Section 27A of the Securities Act of 1933, as amended, and Section
TENNECO REPORTS FOURTH QUARTER AND FULL-YEAR 2013 RESULTS
 news release TENNECO REPORTS FOURTH QUARTER AND FULL-YEAR 2013 RESULTS Record-high 4Q and full year revenue Record-high 4Q EBIT and net income 4Q cash flow from operations of $412 million Lake Forest,
TopBuild Reports Strong Second Quarter 2018 Results
 NYSE:BLD The leading purchaser, installer and distributor of insulation products to the U.S. construction industry TopBuild Reports Strong Second Quarter 2018 Results Net Sales Increased 27.7% $0.76 Income
ITRON, INC. CONSOLIDATED STATEMENTS OF OPERATIONS
 , INC. CONSOLIDATED STATEMENTS OF OPERATIONS (Unaudited, in thousands, except per share data) Revenues $ 489,353 $ 482,175 $ 964,148 $ 929,711 Cost of revenues 326,312 322,587 646,572 630,000 Gross profit
ITRON, INC. CONSOLIDATED STATEMENTS OF OPERATIONS
 , INC. CONSOLIDATED STATEMENTS OF OPERATIONS (Unaudited, in thousands, except per share data) Revenues $ 474,795 $ 447,536 Cost of revenues 320,260 307,413 Gross profit 154,535 140,123 Operating expenses
ITRON, INC. CONSOLIDATED STATEMENTS OF OPERATIONS
 , INC. CONSOLIDATED STATEMENTS OF OPERATIONS (Unaudited, in thousands, except per share data) Revenues $ 571,640 $ 563,691 Cost of revenues 388,535 378,713 Gross profit 183,105 184,978 Operating expenses
Selling, general and administrative expenses 35,645 33,787. Net other operating income (292) (270) Operating profit 44,202 17,756
 (270) Operating profit 44,202 17,756") Condensed Interim Consolidated Income Statement For the quarter ended September 30 Continuing operations Revenue 328,071 258,941 Cost of sales 248,516 207,668 Gross profit 79,555 51,273 Selling, general
Condensed Interim Consolidated Income Statement For the quarter ended September 30 Continuing operations Revenue 328,071 258,941 Cost of sales 248,516 207,668 Gross profit 79,555 51,273 Selling, general
Reconciliation of Non-GAAP Measures
 Earnings Before Interest, Taxes, Depreciation, Amortization and Goodwill & Intangible Asset Impairment Q4-2015 Q4-2016 Net income applicable to TRC Companies, Inc.'s common shareholders $6.8 $5.9 Interest
ITRON, INC. CONSOLIDATED STATEMENTS OF OPERATIONS
 , INC. CONSOLIDATED STATEMENTS OF OPERATIONS (Unaudited, in thousands, except per share data) Revenues $ 447,536 $ 571,640 Cost of revenues 307,413 388,535 Gross profit 140,123 183,105 Operating expenses
FAIR ISAAC CORPORATION CONDENSED CONSOLIDATED BALANCE SHEETS (In thousands) (Unaudited)
 (Unaudited)") CONDENSED CONSOLIDATED BALANCE SHEETS (In thousands) June 30, September 30, 2016 2015 ASSETS: Current assets: Cash and cash equivalents $ 118,155 $ 86,120 Accounts receivable, net 155,196 158,773 Prepaid
CONDENSED CONSOLIDATED BALANCE SHEETS (In thousands) June 30, September 30, 2016 2015 ASSETS: Current assets: Cash and cash equivalents $ 118,155 $ 86,120 Accounts receivable, net 155,196 158,773 Prepaid
4 th Quarter 2018 Earnings Release Conference Call
 4 th Quarter 2018 Earnings Release Conference Call February 20, 2019 1 2019 Belden Inc. belden.com @beldeninc Safe Harbor Statement Our commentary and responses to your questions may contain forward-looking
FAIR ISAAC CORPORATION CONDENSED CONSOLIDATED BALANCE SHEETS (In thousands) (Unaudited)
 (Unaudited)") CONDENSED CONSOLIDATED BALANCE SHEETS (In thousands) March 31, September 30, 2016 2015 ASSETS: Current assets: Cash and cash equivalents $ 85,374 $ 86,120 Accounts receivable, net 155,207 158,773 Prepaid
CONDENSED CONSOLIDATED BALANCE SHEETS (In thousands) March 31, September 30, 2016 2015 ASSETS: Current assets: Cash and cash equivalents $ 85,374 $ 86,120 Accounts receivable, net 155,207 158,773 Prepaid
CORNING INCORPORATED AND SUBSIDIARY COMPANIES CONSOLIDATED STATEMENTS OF OPERATIONS (Unaudited; in millions, except per share amounts)
") CONSOLIDATED STATEMENTS OF OPERATIONS (Unaudited; in millions, except per share amounts) For the three months ended March 31, 2005 2004 Net sales $ 1,050 $ 844 Cost of sales 621 544 Gross margin 429 300
CONSOLIDATED STATEMENTS OF OPERATIONS (Unaudited; in millions, except per share amounts) For the three months ended March 31, 2005 2004 Net sales $ 1,050 $ 844 Cost of sales 621 544 Gross margin 429 300
BAML 2018 Leveraged Finance Conference Presentation. December 4, 2018
 BAML 2018 Leveraged Finance Conference Presentation December 4, 2018 Disclaimer Forward-Looking Statement Any "forward-looking" statements, within the meaning of Section 27A of the Securities Act of 1933
ITRON, INC. CONSOLIDATED STATEMENTS OF OPERATIONS
 , INC. CONSOLIDATED STATEMENTS OF OPERATIONS (Unaudited, in thousands, except per share data) Revenues $ 470,103 $ 489,353 $ 918,350 $ 964,148 Cost of revenues 351,532 326,312 661,580 646,572 Gross profit
Q Financial Supplement
 Reconcilation of GAAP and Non-GAAP Financial Measures Non-GAAP Net Income and Non-GAAP EPS (in thousands except per share data) 2014 2015 Three Months Ending June 30, Low Range Guidance (1) High Range
Q3 Fiscal Year 2019 Financial Highlights
 Q3 Fiscal Year 2019 Financial Highlights For the quarter ended October 31, 2018 November 29, 2018 Forward Looking Statements Certain statements in this communication may contain forward looking statements
FAIR ISAAC CORPORATION CONDENSED CONSOLIDATED BALANCE SHEETS (In thousands) (Unaudited)
 (Unaudited)") CONDENSED CONSOLIDATED BALANCE SHEETS (In thousands) June 30, September 30, 2018 2017 ASSETS: Current assets: Cash and cash equivalents $ 119,929 $ 105,618 Accounts receivable, net 182,419 168,586 Prepaid
CONDENSED CONSOLIDATED BALANCE SHEETS (In thousands) June 30, September 30, 2018 2017 ASSETS: Current assets: Cash and cash equivalents $ 119,929 $ 105,618 Accounts receivable, net 182,419 168,586 Prepaid
FAIR ISAAC CORPORATION CONDENSED CONSOLIDATED BALANCE SHEETS (In thousands) (Unaudited)
 (Unaudited)") CONDENSED CONSOLIDATED BALANCE SHEETS (In thousands) 2018 2017 ASSETS: Current assets: Cash and cash equivalents $ 90,023 $ 105,618 Accounts receivable, net 208,865 168,586 Prepaid expenses and other current
CONDENSED CONSOLIDATED BALANCE SHEETS (In thousands) 2018 2017 ASSETS: Current assets: Cash and cash equivalents $ 90,023 $ 105,618 Accounts receivable, net 208,865 168,586 Prepaid expenses and other current
GILAT SATELLITE NETWORKS LTD. CONDENSED CONSOLIDATED STATEMENTS OF OPERATIONS U.S. dollars in thousands (except share and per share data)
") CONDENSED CONSOLIDATED STATEMENTS OF OPERATIONS (except share and per share data) 2016 2015 2016 2015 Audited Revenues $ 279,551 $ 197,543 $ 80,345 $ 67,682 Cost of revenues 204,061 143,318 56,147 47,181
CONDENSED CONSOLIDATED STATEMENTS OF OPERATIONS (except share and per share data) 2016 2015 2016 2015 Audited Revenues $ 279,551 $ 197,543 $ 80,345 $ 67,682 Cost of revenues 204,061 143,318 56,147 47,181
Three Months Ended Twelve Months Ended 12/31/ /31/ /31/ /31/
 Consolidated Statements of Operations (In thousands, except share and per share data) TABLE 1 Software licenses $11,336 $8,901 $37,859 $30,709 Support and maintenance 12,631 12,194 49,163 45,591 Professional
Q3 Fiscal 2018 Investor Overview
 Q3 Fiscal 2018 Investor Overview Forward-Looking Statements Certain statements in this presentation, other than statements of historical fact, including estimates, projections, statements related to Valvoline
Forward-Looking Statements
 Forward-Looking Statements Parts of this presentation contain forward-looking statements within the meaning of the Private Securities Litigation Reform Act of 1995. These forward-looking statements involve
Fiscal 2018 Q3 Earnings Presentation July 11, 2018
 Fiscal 2018 Q3 Earnings Presentation July 11, 2018 Risks and Non-GAAP Disclosures This presentation contains forward-looking statements within the meaning of U.S. securities laws, including guidance about
TENNECO REPORTS FOURTH QUARTER AND FULL-YEAR 2017 RESULTS
 news release TENNECO REPORTS FOURTH QUARTER AND FULL-YEAR 2017 RESULTS Record fourth quarter and full-year revenue; double-digit growth in commercial truck and off-highway Record fourth quarter EBIT and
Itron, Inc. Comparison of Key 2015 Financial Metrics to Preliminary Results Announced February 17, Total operating expenses 486, ,839
 Itron, Inc. Comparison of Key 2015 Financial Metrics to Preliminary Results Announced February 17, 2016 (Unaudited, in thousands, except per share data) (announced Feb. 17, 2016) Preliminary FY 2015 Final
For more information, contact: Brad Pogalz (952)
") For more information, contact: Brad Pogalz (952) 887-3753 Donaldson Reports Fourth Quarter and Full-Year 2017 Earnings Fourth quarter 2017 sales increased 11.2 percent, full-year sales increased 6.8 percent
For more information, contact: Brad Pogalz (952) 887-3753 Donaldson Reports Fourth Quarter and Full-Year 2017 Earnings Fourth quarter 2017 sales increased 11.2 percent, full-year sales increased 6.8 percent
Net sales $ 1,890 $ 1,738 $ 7,745 $ 7,467 Cost of sales 1,444 1,406 5,794 5,683 Gross profit ,951 1,784
 Condensed Consolidated Statements of Operations - Unaudited Three Months Ended Twelve Months Ended December 31, December 31, 2012 2011 2012 2011 Net sales $ 1,890 $ 1,738 $ 7,745 $ 7,467 Cost of sales
Second Quarter Fiscal Quarter Ended April 1, 2017
 Second Quarter Fiscal 2017 Quarter Ended April 1, 2017 Safe Harbor Statement Certain statements made during this presentation, including the Company's outlook for the third quarter fiscal year 2017 and
INNOSPEC REPORTS THIRD QUARTER 2018 FINANCIAL RESULTS
 INNOSPEC REPORTS THIRD QUARTER 2018 FINANCIAL RESULTS Improved growth in revenue and operating income in all core businesses Net sales up 9 percent; Operating income up 15 percent; Operating income before
TENNECO REPORTS THIRD QUARTER RESULTS
 news release TENNECO REPORTS THIRD QUARTER RESULTS Record-high third quarter revenue Record-high third quarter EBIT before restructuring charges Lake Forest, Illinois, October 28, 2013 Tenneco Inc. (NYSE:TEN)
NEWS RELEASE. Valvoline Reports First-Quarter Results
 NEWS RELEASE Valvoline Reports First- Results Reported net income of $53 million and earnings per diluted share (EPS) of $0.28 Adjusted EPS declined 7% to $0.27, while adjusted EBITDA declined 6% to $101
Regulation G Financial Reconciliations. Meeting with Management June 4, 2008
 Regulation G Financial Reconciliations Meeting with Management June 4, 2008 RECONCILIATION OF LAST TWELVE MONTHS (LTM) NET SALES Net Sales Fiscal Year Ended December 29, $1,230,626 Three Months Ended March
Fiscal 2019 Q1 Earnings Presentation January 9, 2019
 Fiscal 2019 Q1 Earnings Presentation January 9, 2019 Risks and Non-GAAP Disclosures This presentation contains forward-looking statements within the meaning of U.S. securities laws, including guidance
Analog Devices, Third Quarter, Fiscal Schedule A Revenue and Earnings Summary (Unaudited) (In thousands, except per-share amounts)
 (In thousands, except per-share amounts)") Analog Devices, Third Quarter, Fiscal Schedule A Revenue and Earnings Summary (Unaudited) (In thousands, except per-share amounts) Revenue $ 1,433,902 $ 1,147,982 $ 869,591 Year-to-year change 65% 47 %
Analog Devices, Third Quarter, Fiscal Schedule A Revenue and Earnings Summary (Unaudited) (In thousands, except per-share amounts) Revenue $ 1,433,902 $ 1,147,982 $ 869,591 Year-to-year change 65% 47 %
MERITOR, INC. CONSOLIDATED STATEMENT OF OPERATIONS (Unaudited) (In millions, except per share amounts)
 (In millions, except per share amounts)") CONSOLIDATED STATEMENT OF OPERATIONS (In millions, except per share amounts) 2016 2015 2016 2015 Sales $ 728 $ 853 $ 3,199 $ 3,505 Cost of sales (644 ) (745) (2,763) (3,043) GROSS MARGIN 84 108 436 462
CONSOLIDATED STATEMENT OF OPERATIONS (In millions, except per share amounts) 2016 2015 2016 2015 Sales $ 728 $ 853 $ 3,199 $ 3,505 Cost of sales (644 ) (745) (2,763) (3,043) GROSS MARGIN 84 108 436 462
Third Quarter Fiscal 2019 Earnings Call
 NYSE: GHM January 30, 2019 Third Quarter Fiscal 2019 Earnings Call James R. Lines President & Chief Executive Officer Jeffrey F. Glajch Vice President & Chief Financial Officer 2019 Graham Corp. 1 Safe
MYERS INDUSTRIES, INC. Second Quarter 2018 Earnings Presentation
 MYERS INDUSTRIES, INC. Second Quarter 2018 Earnings Presentation SAFE HARBOR STATEMENT & NON-GAAP MEASURES Statements in this presentation concerning the Company s goals, strategies and expectations for
UNITED RENTALS, INC. CONDENSED CONSOLIDATED STATEMENTS OF INCOME (UNAUDITED) (In millions, except per share amounts)
 (In millions, except per share amounts)") CONDENSED CONSOLIDATED STATEMENTS OF INCOME (UNAUDITED) (In millions, except per share amounts) Revenues: Equipment rentals $ 916 $ 523 Sales of rental equipment 123 76 Sales of new equipment 21 18 Contractor
CONDENSED CONSOLIDATED STATEMENTS OF INCOME (UNAUDITED) (In millions, except per share amounts) Revenues: Equipment rentals $ 916 $ 523 Sales of rental equipment 123 76 Sales of new equipment 21 18 Contractor
2016 Financial Update and 2017 Outlook. Webcast Presentation December 13, 2016
 2016 Financial Update and 2017 Outlook Webcast Presentation December 13, 2016 Safe Harbor Statement Note: All statements made herein that are not historical facts should be considered as forwardlooking
MARRIOTT INTERNATIONAL, INC. Non-GAAP Financial Measure Reconciliation ($ in millions)
") ($ in millions) We consider lodging operating income to be a meaningful indicator of our performance because it measures our growth in profitability as a lodging company and enables investors to compare
($ in millions) We consider lodging operating income to be a meaningful indicator of our performance because it measures our growth in profitability as a lodging company and enables investors to compare
ALLEGION REPORTS THIRD-QUARTER 2017 FINANCIAL RESULTS
 ALLEGION REPORTS THIRD-QUARTER 2017 FINANCIAL RESULTS Third-quarter 2017 net earnings per share (EPS) of $0.94, compared with 2016 EPS of $0.02; Adjusted 2017 EPS of $1.02, up 9.7 percent compared with
Coherent, Inc. Consolidated Statement of Operations - GAAP
 Consolidated Statement of Operations - GAAP (In thousands except percentages and per share data, unaudited) March 31, December 30, September 30, July 1, April 1, December 31, October 1, July 2, April 2,
ServiceNow, Inc. Condensed Consolidated Statements of Operations (in thousands, except share and per share data) (unaudited)
 (unaudited)") ServiceNow, Inc. Condensed Consolidated Statements of Operations (in thousands, except share and per share data) (unaudited) Revenues: Subscription $ 626,567 $ 449,506 $ 1,755,174 $ 1,239,762 Professional
ServiceNow, Inc. Condensed Consolidated Statements of Operations (in thousands, except share and per share data) (unaudited) Revenues: Subscription $ 626,567 $ 449,506 $ 1,755,174 $ 1,239,762 Professional
Q1 Fiscal 2018 Investor Overview
 Q1 Fiscal 2018 Investor Overview Forward-Looking Statements Certain statements in this presentation, other than statements of historical fact, including estimates, projections, statements related to our
DONALDSON COMPANY Investor Presentation
 DONALDSON COMPANY Investor Presentation For more information, contact: Brad Pogalz Director, Investor Relations and Corporate Communications brad.pogalz@donaldson.com 952-887-3753 SAFE HARBOR STATEMENT
TENNECO REPORTS SECOND QUARTER 2015 RESULTS
 news release TENNECO REPORTS SECOND QUARTER 2015 RESULTS Revenue of $2.1 billion Continued EBIT margin improvement Higher year-over-year cash from operations Lake Forest, Illinois, July 24, 2015 Tenneco
TENNECO REPORTS SECOND QUARTER 2016 RESULTS
 news release TENNECO REPORTS SECOND QUARTER 2016 RESULTS Revenue growth continuing to outpace industry production Record-high second quarter EBIT Year-over-year margin expansion Record-high second quarter
SHILOH INDUSTRIES REPORTS THIRD QUARTER FISCAL 2017 RESULTS GROSS MARGIN EXPANSION OF 160 BASIS POINTS
 SHILOH INDUSTRIES REPORTS THIRD QUARTER FISCAL 2017 RESULTS GROSS MARGIN EXPANSION OF 160 BASIS POINTS VALLEY CITY, Ohio, August 29, 2017 (GLOBE NEWSWIRE) - Shiloh Industries, Inc. (NASDAQ: SHLO), a leading
SECOND QUARTER 2018 EARNINGS CONFERENCE CALL
 SECOND QUARTER 2018 EARNINGS CONFERENCE CALL Forward Looking Statements & Non-GAAP Disclaimer The following information may contain forward-looking statements, including forward-looking statements within
INGERSOLL-RAND PUBLIC LIMITED COMPANY (Exact name of registrant as specified in its charter)
") UNITED STATES SECURITIES AND EXCHANGE COMMISSION WASHINGTON, D.C. 20549 FORM 8-K CURRENT REPORT Pursuant to Section 13 or 15(d) of the Securities Exchange Act of 1934 Date of Report - February 1, 2013
UNITED STATES SECURITIES AND EXCHANGE COMMISSION WASHINGTON, D.C. 20549 FORM 8-K CURRENT REPORT Pursuant to Section 13 or 15(d) of the Securities Exchange Act of 1934 Date of Report - February 1, 2013
Consolidated Balance Sheets (U.S. Dollars in thousands) December 31, 2014
 December 31, 2014") Consolidated Balance Sheets (Audited) Current assets Cash and cash equivalents 44,979 33,744 Available-for-sale marketable securities 29,448 16,003 Short-term bank deposits 29,989 80,922 Trade receivables,
Consolidated Balance Sheets (Audited) Current assets Cash and cash equivalents 44,979 33,744 Available-for-sale marketable securities 29,448 16,003 Short-term bank deposits 29,989 80,922 Trade receivables,
Q Financial Results
 Q2 2017 Financial Results July 26, 2017 Copyright Fortinet Inc. All rights reserved. Safe Harbor Statement Information, statements and projections contained in these presentation slides and related conference
The Manitowoc Company, Inc.
 The Manitowoc Company, Inc. RBC CAPITAL MARKETS GLOBAL INDUSTRIALS CONFERENCE SEPTEMBER 5, 2018 LAS VEGAS, NV Dave Antoniuk, SVP & CFO Ion Warner, VP Marketing & IR Forward- Looking Statements Safe Harbor