FY 2017 results. March 29, 2018
|
|
|
- Moris Hall
- 6 years ago
- Views:
Transcription

1 FY 2017 results March 29, 2018


2 speakers of the day Sébastien CLERC Chief Executive Officer Joined Voltalia in 2011 Marie de LAUZON Chief Administrative Officer Joined Voltalia in years of experience in the infrastructures and renewable sector and former founder and head of Natixis Environnement Infrastructures 15 years of experience in investment banking, consulting and asset management and 4 years of experience in the renewable sector 2
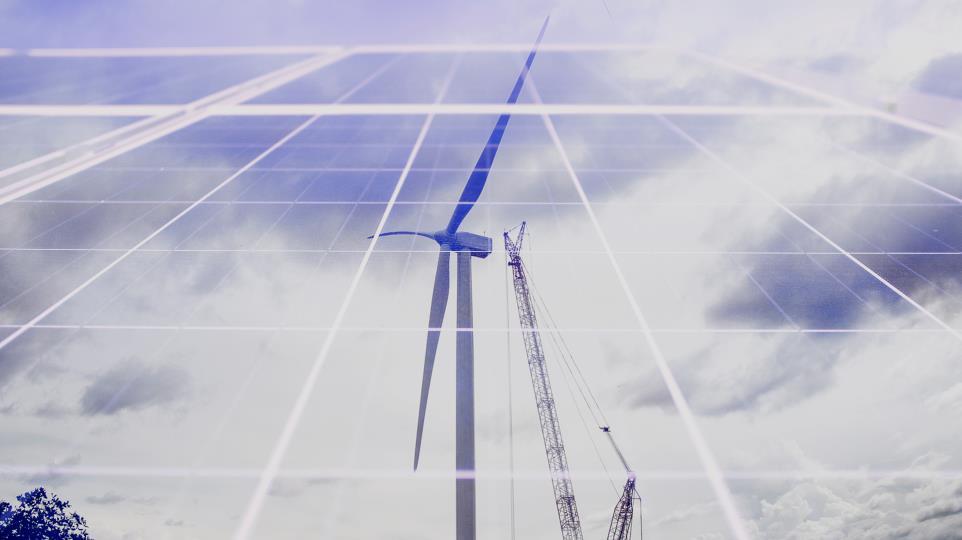
3 increased competitiveness of renewables Increased competitiveness fueling global sector growth PV Solar Onshore wind Fossil fuel cost range LCOE (global cost) evolution (USD/MWh, nominal value) e Solar Wind Evolution of global renewable energy capacity (GW) Source: Bloomberg (BNEF) 3
4 an increasing consumption coverage number of people powered by Voltalia x number of people powered by Voltalia since M people at year-end
5 highlights record year as a power producer ongoing turnaround of services 2020 objectives within reach 5
6 agenda a growing independent renewable energy player competitive edge financials recent developments recent developments roadmap 6

7 Growing independent renewable energy player


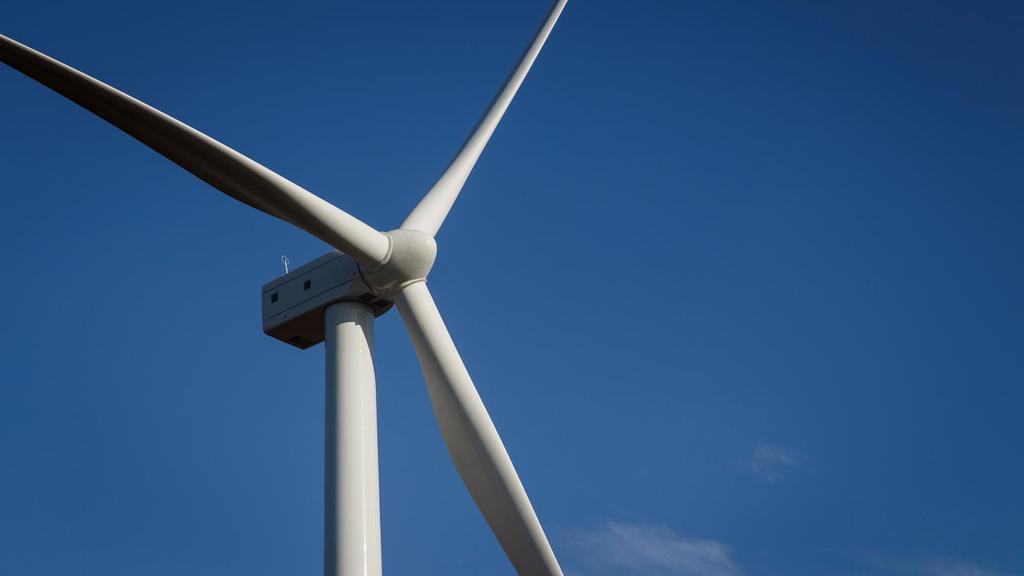
8 our positioning multi-energy solar wind hydro biomass multi-country multi-business model ENERGY PRODUCER SERVICE PROVIDER 8


9 offices in 18 countries, focused on Europe, LatAm and Africa 464 people 508 MW of installed capacity Offices 9


10 our mission improve global environment foster local development 10
11 a CSR policy in line with our mission CO 2 1,039 ktco 2 eq avoided in % of staff trained in % 50% 43 of women among Board members socioeconomic projects developed in Brazil 11
12 competitive edge

 41% 12% 69% 18% 15% 14% Note:")
 Vila Acre (27 MW Brazil)")

13 best-in-class load factors METRO.FRANCE BRAZIL FRENCH GUIANA GREECE PORTUGAL UK 24% 55%(1) 18% Hybrid 38%(2) 41% 12% 69% 18% 15% 14% Note: 2017 load factors as of December 31, 2017 (1) Vila Acre (27 MW Brazil) annualized (2) Production data on total installed capacity (12 MW vs 9 MW per contractual requirement) 13
 progressively replaced by 4 MW")
 Telecom towers in Myanmar Powering 171 telecom towers (2kW each) that are either")
14 innovative offering in isolated sites Oiapoque in Brazil 90% clean electricity in 2021 vs. 100% fossil-fuel based before Voltalia Hybrid site: 12 MW diesel (2015) progressively replaced by 4 MW solar (2017) MW hydro (2021) Telecom towers in Myanmar Powering 171 telecom towers (2kW each) that are either off-grid or on a bad grid with cleaner electricity Phase 1: diesel + batteries Phase 2: solar panels to be added 14
15 power supply to telecom towers 4 million telecom towers across the world offer mobile services to customers 1 million towers with no or bad grid access use diesel generators for their electricity needs Solar solution for telecom towers with no / bad grid access (# of towers) Solar Hybrid Solutions Gensets Only Source: Voltalia analysis 15
16 Price long term visibility and value creation Secured revenues during the PPA + market revenues before and after PPA 17 years of revenues secured through long term sales contracts Spot or Private contract Spot or Private contract PPA 88% of installed capacity not dependent on support policies X months 20 years XX years As of December 2017 PPA: long term power sale agreement 16

17 financial review
18 continuous profitable growth Full year revenues (in m) EBITDA (in m) CAGR 76% CAGR 92% FY 2013 FY 2014 FY 2015 FY 2016 FY FY 2013 FY 2014 FY 2015 FY 2016 FY
19 2017 financial highlights Energy Sales: continued profitable growth % of rev. Services: scaling-up In million euros (before eliminations) Variation In million euros (before eliminations) Variation Revenues % EBITDA % % EBITDA margin 65% 59% Revenues % EBITDA (9.8) (0.2) nm % EBITDA margin -17% -1% 43% revenues growth with new wind farms of Vila Para and Vila Acre (accelerated commissioning at the end of June 2017) positive price effect in H2 due to contract suspensions and high spot price Good pricing drives EBITDA growth and better margins 81% revenues growth: first full year of consolidation, growth in internalized services Profitability mixed performances negative EBITDA margin for Development with investment in development of future projects and Construction volume below breakeven 8% EBITDA margin in O&M: recurring business, improvement from 6% in
20 in 2017, revenue growth driven by successful strategy in Brazil and build-up of services In m (17) Revenues 2016 Net capacity additions and other Brazil - contract suspension strategy FX Services - Dev., EPC Services - O&M Eliminations Revenues
21 in 2017, EBITDA growth driven by energy sales In m (11) (3) EBITDA 2016 Net capacity additions and other Brazil - contract suspension strategy FX Services - Dev., EPC Services - O&M Eliminations & corporate EBITDA
22 positive net profit In million euros IFRS audited data Var. Constant currency var. Revenues % +36% Operating expenses (108.4) (76.9) +41% EBITDA % +33% EBITDA margin 40% 39% D&A increase more than EBITDA: commissioning of new power plants in 2017 and, from July 1 st, first contribution of SMG, previously in preservation mode Depreciation, amortisation and provisions (27.1) (13.2) +106% Other operating income and expense 1.3 (2.6) nm Operating result % +23% Financial result (36.5) (29.0) +26% Taxes and other minority interests (5.8) (4.6) +27% Net profit x6.1 x3.7 of which minority interests 2.9 (1.1) nm of which net profit (group share) % 1 Includes Martifer Solar, integrated in the consolidated accounts from August 1, 2016 financial result increases less than EBITDA: improved financing conditions in Brazil increase in taxable revenues in Brazil subsidiaries with minority partners benefitted from the contract suspension strategy positive net profit thanks to strong H2 22
23 consolidated balance sheet In million euros IFRS audited data Var. Tangible and intangible assets (38) Cash and cash equivalent (30) Other assets Total assets (55) Equity, Group share (28) Minority interests (8) Financial debt (15) Other current liabilities (4) Total liabilities (55) 71% of fixed assets in BRL, with BRL depreciation vs. EUR in 2017 (30.2)m variation explained by: Cash flow from operations Cash flow from investment (78.5) Cash flow from financing (10.2) Currency translation impact (7.3) 82% project finance 1 Includes Martifer Solar, integrated in the consolidated accounts from August 1,
24 recent developments
 A-4: 2020 at the latest A-6: 2022 at the latest 20-year power sale contracts, securing total revenues of 400 M+* Before PPA start,")
 >1 GW pipeline 25 * Revenues estimated over a 20-year period based on a capacity factor of 58% and at current exchange rates, excluding contractual indexation of selling prices on")
25 success in 2017 Brazilian auctions Country Technology Capacity Name / location Contractual COD date Contract features Project acceleration Brazil Wind 163 MW (increased from 155 MW) A-4: 70 MW A-6: 93 MW Ventos da Serra do Mel in Serra Branca cluster (Nordeste) A-4: 2020 at the latest A-6: 2022 at the latest 20-year power sale contracts, securing total revenues of 400 M+* Before PPA start, Voltalia will sell the power plants production through private power sale contracts Serra Branca cluster wind power plants 309 MW in operation Areia Branca (90 MW) Vamcruz (93 MW) Vila Para (99 MW) Vila Acre (27 MW) >1 GW pipeline 25 * Revenues estimated over a 20-year period based on a capacity factor of 58% and at current exchange rates, excluding contractual indexation of selling prices on Brazilian inflation


26 first projects in Africa First solar plant in Egypt First hydro projects in Morocco Technology Location Capacity Solar, photovoltaic panels mounted on single-axis trackers Ben Ban complex in Upper-Egypt 32 MW Status PPA signed, expected COD Q Technology Location Capacity Status Hydropower plants Middle-Atlas region 9.8 MW and 7.2 MW Permits obtained, private PPAs under negotiation 26
 Capacity 5.")

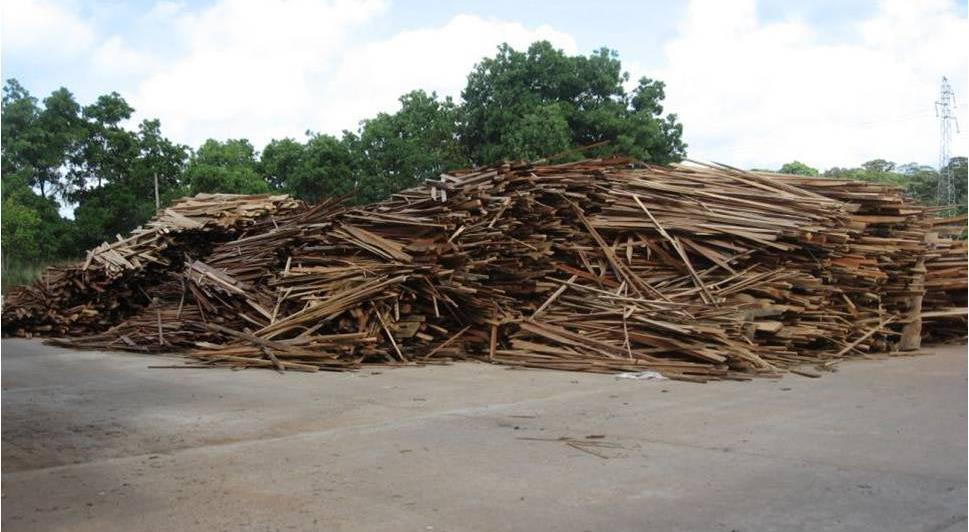
27 new biomass power plant in French Guiana Country French Guiana Cacao Biomass plant Technology Biomass Location Cacao (Roura area) Capacity 5.1 MW Contractual COD date Contract features Other features H year contract, with 10-15M* annual revenues The plant will substitute diesel generators, burn wood waste and foster local employment 27 * Revenues calculated on a c. 90% load factor


28 selection of other projects in France energy capacity announce Canadel solar 10.4 MW July 2017 Tresques solar 3.0 MW August 2017 Carrière des Plaines solar 8.2 MW August 2017 Parroc solar 5.0 MW August 2017 Pagap solar 5.0 MW February 2018 Talagard solar 5.0 MW February 2018 Sarry wind 22.0 MW March


29 positive newsflow building future revenues and profit 271 MW Additional capacity and energy sales revenues Contribution to 2020 targets Additional Services revenues from internalized services Contribution to 2020 targets 29
30 roadmap
31 2020 targets Consolidated installed capacity Operated capacity (own + third party clients) EBITDA 1 GW 3 GW m 508 MW 1.2 GW 72 m in
32 2020 roadmap: 919 MW secured Africa, ME, Asia 31% 46% LatAm MW 919 MW + 81 MW 1 GW 411 MW 508 MW Europe 23% 1% 5% Hydro Biomass Solar 36% 31/12/2017 Secured portfolio 31/12/2020 Wind 58% 411 MW 32
33 a growing and diversified pipeline Hydro Biomass 3% 1% Africa, ME, Asia 20% Solar 46% Wind 50% 3.4 GW 3.4 GW Europe 21% LatAm 59% 33
34 key takeaways record year as a power producer ongoing turnaround of services 2020 objectives within reach 34
35 Q&As

36 appendix
37 FY production / installed capacity Cumulated power production by area and by energy (in GWh) Wind Solar Biomass Hydro Hybrid Total 2017 Total 2016 Brazil 1, , Metro. France French Guiana Greece United Kingdom* Portugal Total 2, , ,251.7 Consolidated installed capacity (in MW) Wind Solar Biomass Hydro Hybrid Total 2017 Total 2016 Brazil Metro. France French Guiana United Kingdom* Greece Portugal Total
38 IPP countries: market features Brazil France Greece Egypt Support policies NO YES YES NO Country s expected needs for new capacities +24 GW wind generation capacity by GW of solar by GW additional clean energy generation capacity by GW of new renewable energy capacity by % of electricity consumption from clean energy by GW wind +3.5 GW of solar by 2027 Regulation scheme National reverse auctions (energy and capacity) Local tenders National tenders Call-for-projects Tenders Auctions Net metering Competitive bidding Remuneration scheme PPAs Spot market Prior to 2017: fixed tariff Since 2017: contract-fordifference Fixed tariff for projects < 500 kw Fixed tariff premium for projects > 500 kw Fixed tariff Merchant for private investors Electricty sales contract duration Long-term debt in local currency 20 years years years years YES YES YES YES 38
39 upcoming events / contact details 2018 financial communication calendar April 18, 2018 May 24, 2018 July 18, 2018 September 26, 2018 October 17, 2018 Q revenues Annual general meeting Q revenues 2018 half-year results Q revenues IR contacts Chief Administrative Officer: Marie de Lauzon Investor Relations: Mark Reinhard / Clémence Granveau invest@voltalia.com +33 (0)


40 VOLTALIA 28 rue de Mogador Paris France T. +33 (0) IMPROVE GLOBAL ENVIRONMENT FOSTER LOCAL DEVELOPMENT
Investor presentation. Oddo Forum 2018
 Investor presentation Oddo Forum 2018 Agenda A growing independent renewable energy player Competitive edge Recent developments Financials Roadmap 2 A growing independent renewable energy player Key figures
Investor presentation. H results September 26, 2017
 Investor presentation H1 2017 results September 26, 2017 Speakers of the day Sébastien CLERC Chief Executive Officer Joined Voltalia in 2011 Marie de LAUZON Chief Administrative Officer Joined Voltalia
FY 2016 results. April 4, 2017
 FY 2016 results April 4, 2017 Speakers of the day Sébastien CLERC Chief Executive Officer Joined Voltalia in 2011 Marie de LAUZON Chief Administrative Officer Joined Voltalia in 2014 27 years of experience
PRESS RELEASE H results
 PRESS RELEASE H1 2018 results September 26, 2018 H1 2018 results: improved bottom line, strong short and mediumterm prospects Revenues growth (+11% at constant exchange rates) mainly driven by positive
2017 interim results Confirmed revenue growth Investments in the relaunch of services Confirmation of 2019 ambitions
 2017 interim results Confirmed revenue growth Investments in the relaunch of services Confirmation of 2019 ambitions Strong revenue growth (+74.6%) thanks to energy sales (+36.5% -organic growth) and services
HALF YEAR FINANCIAL REPORT 1 st HALF 2017
 Limited company with share capital of 278,976,086.10 Registered office: 28 rue de Mogador 75009 PARIS 485 182 448 Paris Trade and Companies Register Paris HALF YEAR FINANCIAL REPORT 1 st HALF 2017 CONTENTS
Enel Green Power business plan. Rome - April 3 rd 2014
 Enel Green Power 20142018 business plan Rome April 3 rd 2014 EGP 20142018 business plan Agenda Snapshot on 2013 key achievements F. Starace, CEO Focus on geothermal R. Deambrogio, Head of Italy & Europe
Enel Green Power 9M 2015 consolidated results
 Enel Green Power Rome November 13, 2015 Agenda Overview of recent events Analysis of results Closing remarks 1 Active portfolio management Exit from El Salvador Cash-in: 224 m Capital gain: 123 m Entry
FY 2015 consolidated results. March 23, 2016
 FY 2015 consolidated results March 23, 2016 Agenda Delivery on strategic plan Financial results Business analysis Closing remarks 1 Delivery on strategic plan Opening remarks Operational efficiency delivering
GROWING OUR INDUSTRY-LEADING POSITION
 GROWING OUR INDUSTRY-LEADING POSITION Juan Araluce EVP & Chief Sales Officer Copenhagen, 29 November 2018 Track record and Performance Trends in the Sector Commercial Strategy to maintain #1 position AGENDA
Enel Green Power 1Q 2014 consolidated results
 Enel Green Power Rome May 7, 2014 Agenda Highlights Analysis of results Closing remarks 1 Highlights Over 60% of 20142018 plan addressed with 2.4GW in execution Good operating performance: +15% output
SALES AND HIGHLIGHTS 2018 FIRST QUARTER
 SALES AND HIGHLIGHTS 2018 FIRST QUARTER DISCLAIMER This presentation does not constitute an offer to sell securities in the United States or any other jurisdiction. No reliance should be placed on the
SALES AND HIGHLIGHTS 2017 THIRD QUARTER
 SALES AND HIGHLIGHTS 2017 THIRD QUARTER DISCLAIMER This presentation does not constitute an offer to sell securities in the United States or any other jurisdiction. No reliance should be placed on the
Voltalia announces the launch of a share capital increase
 THIS PRESS RELEASE DOES NOT CONSTITUTE OR FORM A PART OF ANY OFFER OR SOLICITATION TO PURCHASE OR SUBSCRIBE FOR SECURITIES IN THE UNITED STATES OF AMERICA. THE WARRANTS AND THE SHARES MAY NOT BE OFFERED
Capital Markets Day. Strategic Plan Alberto De Paoli CFO
 Capital Markets Day Strategic Plan 2019-21 Alberto De Paoli CFO Agenda Alberto De Paoli (CFO) Capital allocation 2019-21 Our Plan Business line highlights Financial management Risk management Earnings
Fourth quarter Oslo, 25 January 2019
 Fourth quarter 2018 Oslo, 25 January 2019 Disclaimer The following presentation is being made only to, and is only directed at, persons to whom such presentation may lawfully be communicated ( relevant
FOCUS ON EDF EN Analyst Group Lunch Meeting - 6 July 2017
 FOCUS ON EDF EN Analyst Group Lunch Meeting - 6 July 2017 Antoine Cahuzac - Group Senior Executive VP of Renewable Energies and CEO of EDF Énergies Nouvelles Bruno Fyot COO of EDF EN Denis Rouhier CFO
Capital Markets Day. Global Renewable Energies. Antonio Cammisecra
 Capital Markets Day Global Renewable Energies Antonio Cammisecra Integrated model fit for digitalized, low carbon world Generation growth engine Leading geographic expansion Growth engine for the utility
REGISTRATION DOCUMENT
 REGISTRATION DOCUMENT 2016 1 Société anonyme (public limited company) with registered capital of 278,976,086.10 euros Registered office: 28, rue de Mogador - 75009 PARIS 485 182 448 Paris Register of Commerce
Investor presentation. December 2018
 Investor presentation December 2018 Disclaimer The following presentation is being made only to, and is only directed at, persons to whom such presentation may lawfully be communicated ( relevant persons
Endesa FY 2017 Results 28/02/2018
 Endesa FY 2017 Results 28/02/2018 1. Highlights and key financial figures 2. Endesa s performance in 2017 market context 3. Financial results 4. Final remarks 2 1. Highlights and key financial figures
Renewable Energy and Mining Summit. Toronto, September 25th, 2013
 Renewable Energy and Mining Summit Toronto, September 25th, 2013 1 SOLARPACK- Company Profile Company Overview Started operations in 2005 in Spain 60 highly specialized professionals 79 MW own developed
1Q 2015 Results. May 8, 2015
 1Q 2015 Results May 8, 2015 Highlights of the period Good operating results: recurring EBITDA +4% Latam: confirmed positive trends, EBITDA +33% yoy and reorganization kicked -off Renewables: +0.2 GW capacity
9M 2016 consolidated results. November 10, 2016
 9M 2016 consolidated results November 10, 2016 Opening remarks EBITDA +8% net of forex and on a like-for-like basis Double digit growth of net ordinary income on a like-for-like basis Positive contribution
April-September 2017 Results: short term impacts, long term actions. November 6, 2017
 April-September 2017 Results: short term impacts, long term actions November 6, 2017 Disclaimer This material has been prepared by Siemens Gamesa Renewable Energy, and is disclosed solely for information
Siemens Gamesa Renewable Energy Q3 18 Results
 Siemens Gamesa Renewable Energy Q3 18 Results 27 July 2018 Disclaimer This material has been prepared by Siemens Gamesa Renewable Energy, and is disclosed solely for information purposes. This document
RESULTS PRESENTATION 1 ST QUARTER 2011
 RESULTS PRESENTATION 1 ST QUARTER 2011 HIGHLIGHTS STRUCTURE AND SEGMENT REPORTING MANAGEMENT ANALYSIS - ECONOMIC AND FINANCIAL ANALYSIS - ANALYSIS BY SEGMENT - CAPEX - NET DEBT APPENDICES HIGHLIGHTS HIGHLIGHTS
FY 2016 RESULTS. March 2 nd, 2017
 FY 2016 RESULTS March 2 nd, 2017 AGENDA Key messages & strategy execution Financial update 2017 outlook & conclusion FY2016 RESULTS 2 KEY MESSAGES & STRATEGY EXECUTION KEY MESSAGES 2016 results in line
Janda III - Cádiz - Spain 15:00 CET 14:00 UK / LISBON
 Janda III - Cádiz - Spain 15:00 CET 14:00 UK / LISBON This presentation has been prepared by EDP Renováveis, S.A. (the "Company ; LEI 529900MUFAH07Q1TAX06) solely for use at the presentation to be made
SALES AND HIGHLIGHTS 2017 FIRST QUARTER
 SALES AND HIGHLIGHTS 2017 FIRST QUARTER DISCLAIMER This presentation does not constitute an offer to sell securities in the United States or any other jurisdiction. No reliance should be placed on the
Investor presentation. September 2016
 Investor presentation September 2016 Investor presentation Agenda 1H 2016 consolidated results pag. 2 FY 2015 consolidated results 2016-23: New regulatory period for electricity distribution in Italy 2016-19
1H 2018 consolidated results. July 31, 2018
 1H 2018 consolidated results July 31, 2018 Highlights Ordinary EBITDA +3% FFO +8%, Group Net income +5% Industrial growth ~315 mn growth EBITDA 2019 growth EBITDA secured at around 70% Operational efficiency
Legal Notice DISCLAIMER
 Legal Notice DISCLAIMER This document has been prepared by Iberdrola, S.A. exclusively for use during the presentation of financial results of the first quarter of the 2018 fiscal year. As a consequence
Conference Call. Encavis AG Bold move into the PPA market. October 9, 2018
 Conference Call Encavis AG Bold move into the PPA market October 9, 2018 2 BOLD MOVE INTO FAST GROWING PPA MARKET BY ACQUISITION OF GIGANTIC SOLARPARK TALAYUELA > Successful expansion of the business model
Fourth quarter and full year 2015
 Fourth quarter and full year 2015 Raymond Carlsen, CEO Mikkel Tørud, CFO Oslo, January 29, 2016 Our values Predictable Driving results Changemakers Working together Disclaimer The following presentation
Capital Stage AG: Strategic Partnership with Solarcentury. November 2, 2017, 11:00 CET
 Capital Stage AG: Strategic Partnership with Solarcentury November, 07, :00 CET Benefits of the partnership with Solarcentury Access to exclusive pipeline of. GW solar PV over years European assets of
Clean Technology Fund (CTF) Proposal for CTF 2.0
 Proposal for CTF 2.0") Clean Technology Fund (CTF) Proposal for CTF 2.0 Outline Clean Technology Fund: 2008 to 2016 The Journey so far Changing climate in a changing world SDGs, Paris Agreement Unique opportunity Use of assets
Clean Technology Fund (CTF) Proposal for CTF 2.0 Outline Clean Technology Fund: 2008 to 2016 The Journey so far Changing climate in a changing world SDGs, Paris Agreement Unique opportunity Use of assets
2015 Investor day Strategic Plan New foundations for growth
 2015 Investor day 2015-19 Strategic Plan New foundations for growth March 19, 2015 2015 Investor day Agenda 2014 main developments Francesco Starace CEO FY 2014 results Alberto De Paoli CFO 2015-2019 strategic
Capital Markets Day. Strategic Plan Francesco Starace CEO & General Manager
 Capital Markets Day Strategic Plan 2019-21 Francesco Starace CEO & General Manager Agenda Francesco Starace (CEO & General Manager) Enel Today 2015-2018 Our Delivery 2019-2021 Our Vision & Positioning
Investor presentation
 Investor presentation May 2017 Our values Predictable Driving results Changemakers Working together Disclaimer The following presentation is being made only to, and is only directed at, persons to whom
ENGIE financial information as of March 31, 2018 Sustained organic growth and full-year guidance confirmed
 Press release May 15, 2018 ENGIE financial information as of March 31, 2018 Sustained organic growth and full-year guidance confirmed The successful strategic repositioning of the Group on low CO 2 generation,
SALES AND HIGHLIGHTS 2018 THIRD QUARTER
 SALES AND HIGHLIGHTS 2018 THIRD QUARTER DISCLAIMER This presentation does not constitute an offer to sell securities in the United States or any other jurisdiction. No reliance should be placed on the
Siemens Gamesa Renewable Energy Q Results
 Siemens Gamesa Renewable Energy Q2 208 Results 04 May 208 Disclaimer This material has been prepared by Siemens Gamesa Renewable Energy, and is disclosed solely for information purposes. This document
MAHARASHTRA ELECTRICITY REGULATORY COMMISSION MUMBAI
 MAHARASHTRA ELECTRICITY REGULATORY COMMISSION MUMBAI MAHARASHTRA ELECTRICITY REGULATORY COMMISSION (RENEWABLE PURCHASE OBLIGATION, ITS COMPLIANCE AND IMPLEMENTATION OF RENEWABLE ENERGY CERTIFICATE FRAMEWORK)
NEW ENERGY SOLAR (ASX: NEW) PRESENTATION MORGAN STANLEY CLEAN ENERGY DAY
 PRESENTATION MORGAN STANLEY CLEAN ENERGY DAY") 13 April 2018 NEW ENERGY SOLAR (ASX: NEW) PRESENTATION MORGAN STANLEY CLEAN ENERGY DAY Today, New Energy Solar 1 will be presenting at Morgan Stanley s Clean Energy Day conference. The presentation is
13 April 2018 NEW ENERGY SOLAR (ASX: NEW) PRESENTATION MORGAN STANLEY CLEAN ENERGY DAY Today, New Energy Solar 1 will be presenting at Morgan Stanley s Clean Energy Day conference. The presentation is
Accelerating growth. Capital Markets Update, 30 May 2018
 Accelerating growth Capital Markets Update, 30 May 2018 Disclaimer The following presentation is being made only to, and is only directed at, persons to whom such presentation may lawfully be communicated
Transcript business plan. May 7, Transcript 2015 Investor day
 Transcript 2015-2019 business plan May 7, 2015 Transcript 2015 Investor day May 7, 2015 1 Corporate Participants Francesco Venturini Enel Green Power SpA - CEO Giulio Carone Enel Green Power SpA - CFO
RESULTS PRESENTATION 1 ST SEMESTER 2011
 RESULTS PRESENTATION 1 ST SEMESTER 2011 HIGHLIGHTS MANAGEMENT ANALYSIS - ECONOMIC AND FINANCIAL ANALYSIS - ANALYSIS BY SEGMENT - CAPEX - NET DEBT KEY MESSAGES APPENDICES HIGHLIGHTS HIGHLIGHTS Operating
Gamesa An extraordinary year
 J a n u a r y - D e c e m b e r 2 0 1 6 R e s u l t s Gamesa An extraordinary year 1 23 February 2017 Contents 1. Period highlights 2. January-December 2016 Results and KPIs 3. Outlook 4. Conclusions 2
EDP RENOVÁVEIS. João Manso Neto, CEO EDP Renováveis
 EDP RENOVÁVEIS João Manso Neto, CEO EDP Renováveis #4 worldwide wind player EDP Group company focused on wind and solar investments 77.5% EDP SHAREHOLDING 4,412 MW 5,091 MW Leader in the most competitive
Senvion SA Annual Results Presentation 2017 March 15, 2018
 Senvion SA Annual Results Presentation 2017 March 15, 2018 Disclaimer This presentation (the Presentation ) has been prepared by Senvion S.A. ( Senvion and together with its subsidiaries, we, us or the
Ezentis increases its EBITDA by 142,3% in the first nine months of the year up to 16,4 million Euros
 Results Presentation Ezentis increases its EBITDA by 142,3% in the first nine months of the year up to 16,4 million Euros The revenue of the Company increased by 30% up to 228,5 million Euros thanks to
O&M in the Last Mile Ezentis manages, maintains and deploys infrastructure for telecommunications and utilities companies.
 1 O&M in the Last Mile Ezentis manages, maintains and deploys infrastructure for telecommunications and utilities companies. Focus on Latin America where Ezentis activity represents 91,3% of total Group
A unique profile. BLX Toronto Stock Exchange
 A unique profile BLX Toronto Stock Exchange September 30, 2018 Cautionary Statements Forward-looking Statements Some of the statements contained in this presentation, including those regarding future results
Investor and Analyst presentation Senvion S.A.
 Investor and Analyst presentation Senvion S.A. Nine month results for the period ended on 30 September 2018 14 November 2018 Disclaimer This presentation (the Presentation ) has been prepared by Senvion
presentation 2016 VHM GROUP OF COMPANIES
 presentation 2016 VHM GROUP OF COMPANIES VHM GROUP OF COMPANIES INVESTMENT CONSULTING ENGINEERING CONSULTING PROJECT MANAGEMENT ASSET MANAGEMENT 3 Content I. Mission statement II. Corporate structure III.
Total Revenues in 9M14 was 158 M. Growth on operational performance, reflected on the 35 % increase in EBITDA (on a comparable basis) to 8.
 to 8.") 9M2014 RESULTS DESTAQUES page 3 Total Revenues in 9M14 was 158 M Growth on operational performance, reflected on the 35 % increase in EBITDA (on a comparable basis) to 8.5 M Consolidated EBITDA Margin
9M2014 RESULTS DESTAQUES page 3 Total Revenues in 9M14 was 158 M Growth on operational performance, reflected on the 35 % increase in EBITDA (on a comparable basis) to 8.5 M Consolidated EBITDA Margin
Enel Américas Strategic Plan
 Enel Américas Strategic Plan 2019-21 Maurizio Bezzeccheri CEO Aurelio Bustilho CFO Enel Américas Strategic Plan Agenda Maurizio Bezzeccheri Delivery 2016-18 Enel Américas today Energy transition and new
Financing Renewable Energy in Developing Countries: A Global Perspective Dana R. Younger International Finance Corporation Japan Renewable Energy
 Financing Renewable Energy in Developing Countries: A Global Perspective Dana R. Younger International Finance Corporation Japan Renewable Energy Foundation Experts Meeting on Renewable Energy Tokyo September
Enel Chile Strategic Plan
 Enel Chile Strategic Plan 2019-21 Paolo Pallotti CEO Marcelo De Jesus CFO Agenda Paolo Pallotti (CEO) 2018 Enel Chile Today 2016-18 Our Journey 2019-21 Our Pillars Marcelo De Jesus (CFO) 2019-21 Our Plan
FY 2017 RESULTS. March 8 th, 2018
 FY 2017 RESULTS March 8 th, 2018 AGENDA Highlights 2017 performance 2018 outlook Additional material FY 2017 RESULTS 2 HIGHLIGHTS SUCCESSFUL STRATEGIC REPOSITIONING Our 3-year plan is now 90% completed
Q FINANCIAL RESULTS. Milan May 10 th, 2018
 Q1 2018 FINANCIAL RESULTS Milan May 10 th, 2018 1 AGENDA Q1 2018 Highlights o o o Group overview Results by business Outlook Financial results Appendix 2 Q1 2018 Financial Highlights Organic growth recovery
First Quarter 2018 Results (1Q18) April 26, 2018
 April 26, 2018") First Quarter 2018 Results () April 26, 2018 Agenda 1. Highlights and consolidated results 2. results by activity 3. Conclusions Appendices 1 1. Highlights and consolidated results Transformation pillars
First Quarter 2018 Results () April 26, 2018 Agenda 1. Highlights and consolidated results 2. results by activity 3. Conclusions Appendices 1 1. Highlights and consolidated results Transformation pillars
October 8, 2015 Brookfield Renewable Energy Partners
 October 8, 2015 Brookfield Renewable Energy Partners Investor Meeting 2015 CAUTIONARY STATEMENT REGARDING FORWARD-LOOKING STATEMENTS This presentation contains forward-looking statements and information,
BROKER PRESENTATION JUNE 2017
 PACIFIC ENERGY LIMITED ASX : PEA BROKER PRESENTATION JUNE 2017 Important Notice and Disclaimer This presentation has been prepared by (PEA) for information purposes only. This presentation is not a product
FY 2017 RESULTS. March 8 th, 2018
 FY 2017 RESULTS March 8 th, 2018 AGENDA Highlights 2017 performance 2018 outlook FY 2017 RESULTS 2 HIGHLIGHTS SUCCESSFUL STRATEGIC REPOSITIONING Our 3-year plan is now 90% completed after 2 years Strategic
1Q 2016 Results. May 4th, Conference call and webcast
 1Q 2016 Results May 4th, 2016 Conference call and webcast Date: Wednesday, May 4th, 2016, 14:00 CET 13:00 UK/Lisbon Webcast: www.edpr.com Phone dialin number: +44 (0)20 7162 0177 +1 334 323 6203 Phone
ENEL Green Bond Framework
 ENEL Green Bond Framework December 2017 1. Introduction Enel and its subsidiaries (the Group or the Enel Group ) are deeply committed to the renewable energies sector and to researching and developing
Company Presentation. September 2018
 Company Presentation September 2018 Table of Contents Section 1: Company and Asset Overview Section 2: Highlights Section 3: Financial Performance 2 1. Company and Asset Overview Terna Energy Company Overview
Corporate Presentation. L o n d o n, 1 0 O c t o b e r
 Corporate Presentation L o n d o n, 1 0 O c t o b e r 2 0 1 7 Disclaimer This document has been prepared by Falck Renewables S.p.A. (the "Company") for use during meetings with investors and financial
Clean Technology Fund (CTF) Proposal for CTF 2.0
 Proposal for CTF 2.0") Clean Technology Fund (CTF) Proposal for CTF 2.0 Outline Clean Technology Fund: 2008 to 2016 The Journey so far Changing climate in a changing world SDGs, Paris Agreement Unique opportunity Use of assets
Clean Technology Fund (CTF) Proposal for CTF 2.0 Outline Clean Technology Fund: 2008 to 2016 The Journey so far Changing climate in a changing world SDGs, Paris Agreement Unique opportunity Use of assets
9M 2015 Results. October 28th, Conference call and webcast
 9M 2015 Results October 28th, 2015 Conference call and webcast Date: Wednesday, October 28th 2015, 15:00 CET 14:00 UK/Lisbon Webcast: www.edpr.com Phone dialin number: +44 (0) 20 7162 0077 +1 334 323 6201
Spanish Regulation & Latam
 London. 24th February, 2010 Spanish Regulation & Latam José Luis San Pedro 1 Regulation: Sector evolution during the last year Royal Decree Law 6/2009 deepens the liberalisation of the sector Removal of
Neoenergia s Overview Regulatory Environment Networks (Distribution and Transmission) Contracted Generation Financial Results and Debt Profile
 Contracted Generation Financial Results and Debt Profile") 1 Disclaimer The following presentation was developed by Neoenergia S.A. (NEOENERGIA) assigning the general situation and the NEOENERGIA business development. Despite all the care and diligence used in
1 Disclaimer The following presentation was developed by Neoenergia S.A. (NEOENERGIA) assigning the general situation and the NEOENERGIA business development. Despite all the care and diligence used in
FINANCIAL INFORMATION AS OF SEPTEMBER 30, 2015
 FINANCIAL INFORMATION AS OF SEPTEMBER 30, 2015 KEY MESSAGES Financial performance impacted by commodity price drop, partially offset by performance in fast growing markets and cost discipline Cash flow
Offshore Wind. Investing in the future of energy. Offshore Wind. North American Liquids Pipelines. U.S. Transmission. Natural Gas Utilities
 Offshore Vern Yu Executive VP & Chief Development Officer Offshore Investing in the future of energy North American Liquids Pipelines U.S. Transmission Natural Gas Utilities Canadian Transmission & Midstream
RESULTS PRESENTATION. 1 st HALF 2010
 RESULTS PRESENTATION 1 st HALF 2010 HIGHLIGHTS ECONOMIC AND FINANCIAL ANALYSIS REVENUES AND EBITDA ANALYSIS BY SEGMENT - METALLIC CONSTRUCTION - RENEWABLE ENERGY CAPEX NET DEBT ANNEXES 2 HIGHLIGHTS Analysis
COLBÚN PRESENTATION 2016 M A Y. Southern Cone & Andean Opportunities Conference J.P. Morgan
 COLBÚN PRESENTATION 216 M A Y Southern Cone & Andean Opportunities Conference J.P. Morgan A G E N D A O VERVIEW OPERATIONS IN CHILE AND PERU FINANCIALS G R O W T H O P P O R T U N I T I E S VALUE PROPOSAL
Renewable Energy Auctions Analysing IRENA Energy Community Workshop on Renewable Energy Auctions 8 March 2017
 Renewable Energy Auctions Analysing 2016 IRENA Energy Community Workshop on Renewable Energy Auctions 8 March 2017 Renewable Energy Auctions Recent highlights 2 Price trends: solar PV auctions 3 Price
Q I N T E R I M R E P O R T. Brookfield Renewable Partners L.P.
 Q2 2017 I N T E R I M R E P O R T Brookfield Renewable Partners L.P. OUR OPERATIONS We manage our facilities through operating platforms in North America, Colombia, Brazil, and Europe which are designed
Morocco s experience in financing solar projects
 Morocco s experience in financing solar projects February 5, 2019 1 Morocco s Energy Strategy 2 RENEWABLE ENERGIES, AT THE HEART OF MOROCCO S ENERGY STRATEGY Strong will of increasing renewable energy
9M 2016 Results. November 3rd, Conference call and webcast
 9M 2016 Results November 3rd, 2016 Conference call and webcast Date: Thursday, November 3rd, 2016, 15:00 CET 14:00 UK/Lisbon Webcast: www.edpr.com Phone dialin number: +44 (0)20 7162 0177 +1 646 851 2407
Q217 ETRION CORPORATION
 Q217 ETRION CORPORATION MANAGEMENT S DISCUSSION AND ANALYSIS THREE AND SIX MONTHS ENDED JUNE 30, 2017 Etrion is an independent power producer that develops, builds, owns and operates utility-scale solar
August 18, 2017 BLX Toronto Stock Exchange
 A unique profile August 18, 2017 BLX Toronto Stock Exchange Cautionary Statements Forward-looking Statements Some of the statements contained in this presentation, including those regarding future results
GREEK RENEWABLES SUPPORT SCHEME PROPOSALS
 BRIEFING GREEK RENEWABLES SUPPORT SCHEME PROPOSALS MARCH 2016 BRIEF OUTLINE OF THE SCHEME PHOTOVOLTAIC PROJECTS TRANSITIONAL PROVISIONS NON-INTERCONNECTED ISLANDS COMPETITIVE BIDDING PROCESS FROM 2017
Fiscal Policy and Financial Support Schemes for Clean Energy Mini Grids (CEMG)
") Fiscal Policy and Financial Support Schemes for Clean Energy Mini Grids (CEMG) page 1 page 2 Summary of the presentation Introduction 1. Fiscal Policy and Regulation (B1) 2. Grants and Subsidies (E1) 3.
Fiscal Policy and Financial Support Schemes for Clean Energy Mini Grids (CEMG) page 1 page 2 Summary of the presentation Introduction 1. Fiscal Policy and Regulation (B1) 2. Grants and Subsidies (E1) 3.
Statkraft Investor Update. March 2014
 Statkraft Investor Update March 2014 Disclaimer This presentation has been prepared by, and the information contained herein (unless otherwise indicated) has been provided by Statkraft AS (the "Company").
H results. innogy SE 11 August 2017 Bernhard Günther CFO
 H1 2017 results innogy SE 11 August 2017 Bernhard Günther CFO Notice This document contains forward-looking statements. These statements are based on the current views, expectations, assumptions and information
Quality assets. Selective and profitable growth. Self-funding business model
 This presentation has been prepared by EDP Renováveis, S.A. (the "Company") solely for use at the presentation to be made on May 6 th, 2015. By attending the meeting where this presentation is made, or
Investor presentation
 Investor presentation October 2017 Our values Predictable Driving results Changemakers Working together Disclaimer The following presentation is being made only to, and is only directed at, persons to
Perspective on Financing Wind Energy Projects. June 16, 2016
 Perspective on Financing Wind Energy Projects June 16, 2016 Agenda 2 1 Risk Matrix 3 Context Setting Way Forward KEY SEGMENTS IN THIS PRESENTATION 3 Indian Energy Sector Landscape Bank Lending Sector wise
Ilo Peru. Sohar II - Oman H RESULTS. August 1 st, 2013
 Ilo Peru H1 2013 RESULTS Sohar II - Oman H1 2013 RESULTS August 1 st, 2013 Highlights H1 2013 results reflect the combination of: - good operational performance and favorable weather - challenging regulatory
A 20 YEAR ENTREPREUNARIAL JOURNEY IN RENEWABLES. 2 nd October 2017
 A 20 YEAR ENTREPREUNARIAL JOURNEY IN RENEWABLES 2 nd October 2017 AGENDA 1 Introduction 2 Business environment 3 EREN RE Organization 4 Intensity! 5 Wrap up 2 A PARTNERSHIP BUILT OVER FIFTEEN YEARS EREN
2017 Full Year Results
 2017 Full Year Results Title of the presentation 2 lines Location, Date, Author Paris February 15 th, 2018 Disclaimer This presentation may contain forward-looking statements, Such statements may include
SMA SOLAR TECHNOLOGY AG Analyst / Investor Presentation Financial Results 2017
 SMA SOLAR TECHNOLOGY AG Analyst / Investor Presentation Financial Results 2017 Pierre-Pascal Urbon, CEO Ulrich Hadding, CFO March 28, 2018 Date, Author SMA Solar Technology AG Disclaimer IMPORTANT LEGAL
Regional Power Market Challenges and Opportunities from Nepalese perspective
 Regional Power Market Challenges and Opportunities from Nepalese perspective Hitendra Dev Shakya Director, Power Trade Department, Nepal Electricity Authority Outline of the Presentation 1. Energy sector
Energiewende. Drivers and Enablers for German Offshore Wind. Dr. Martin Schöpe
 Energiewende Drivers and Enablers for German Offshore Wind Dr. Martin Schöpe BMWi Head of Unit IIA1 International Cooperation on Energy Hamburg, 25 September 2018 18-09-24 Referent 1 Source: Ecofys 2018
UNITED STATES SECURITIES AND EXCHANGE COMMISSION WASHINGTON, D.C FORM 6-K
 Table of Contents UNITED STATES SECURITIES AND EXCHANGE COMMISSION WASHINGTON, D.C. 20549 FORM 6-K Report of Foreign Private Issuer Pursuant to Rule 13a-16 or 15d-16 under the Securities Exchange Act of
June 1, 2017 BLX Toronto Stock Exchange
 A unique profile June 1, 2017 BLX Toronto Stock Exchange Cautionary Statements Forward-looking Statements Some of the statements contained in this presentation, including those regarding future results
Minimising Risk Maximising Return. Chanda Kapande Business Development Manager Wind Prospect
 Minimising Risk Maximising Return Chanda Kapande Business Development Manager Wind Prospect Agenda Wind Prospect Wind energy in East Africa Sample Project & Financial model RIsks Wind Conclusions Performance