Investor Presentation. March 2018
|
|
|
- Kimberly Kennedy
- 6 years ago
- Views:
Transcription

1 Investor Presentation March 2018
2 Safe Harbor Statement and Other Matters This presentation contains forward-looking statements, within the meaning of the safe harbor provisions of the U.S. Private Securities Litigation Reform Act of 1995, which involve risks and uncertainties. Forward-looking statements provide current expectations of future events based on certain assumptions and include any statement that does not directly relate to a historical or current fact. The words "believe," "expect," will, "anticipate," "plan," "estimate," "target," "project" and similar expressions, among others, generally identify "forward-looking statements," which speak only as of the date such statements were made. These forward-looking statements may address, among other things, the outcome or resolution of any pending or future environmental liabilities, the commencement, outcome or resolution of any regulatory inquiry, investigation or proceeding, the initiation, outcome or settlement of any litigation, changes in environmental regulations in the U.S. or other jurisdictions that affect demand for or adoption of our products, anticipated future operating and financial performance, business plans and prospects, capital investments and projects, plans for dividends or share repurchases, sufficiency or longevity of intellectual property protection, cost savings targets, plans to increase profitability and growth, our ability to make acquisitions, integrate acquired businesses or assets into our operations, and achieve anticipated synergies or cost savings, and our outlook for Adjusted EBITDA, Adjusted EPS and Free Cash Flow, all of which are subject to substantial risks and uncertainties that could cause actual results to differ materially from those expressed or implied by such statements. Forward-looking statements are based on certain assumptions and expectations of future events that may not be accurate or realized. These statements are not guarantees of future performance. Forward-looking statements also involve risks and uncertainties that are beyond Chemours' control. Additionally, there may be other risks and uncertainties that Chemours is unable to identify at this time or that Chemours does not currently expect to have a material impact on its business. Factors that could cause or contribute to these differences include the risks, uncertainties and other factors discussed in our filings with the Securities and Exchange Commission, including in our Annual Report on Form 10-K for the year ended December 31, Chemours assumes no obligation to revise or update any forward-looking statement for any reason, except as required by law. We prepare our financial statements in accordance with Generally Accepted Accounting Principles ( GAAP ). Within this presentation we may make reference to Adjusted Net Income, Adjusted EPS, Adjusted EBITDA, Adjusted EBITDA margin, Free Cash Flow, Return on Invested Capital (ROIC) and Net Leverage Ratio which are non-gaap financial measures. The company includes these non-gaap financial measures because management believes they are useful to investors in that they provide for greater transparency with respect to supplemental information used by management in its financial and operational decision making. Free Cash Flow is defined as Cash from Operations minus cash used for PP&E purchases. Further information with respect to and reconciliations of such measures to the nearest GAAP measure can be found in the appendix hereto. Management uses Adjusted Net Income (Loss), Adjusted EPS, Adjusted EBITDA, Adjusted EBITDA margin, Free Cash Flow, ROIC and Net Leverage Ratio to evaluate the company s performance excluding the impact of certain noncash charges and other special items which we expect to be infrequent in occurrence in order to have comparable financial results to analyze changes in our underlying business from quarter to quarter. Additional information for investors is available on the company s website at investors.chemours.com. 2
 Fluoroproducts Chemical Solutions")


3 The Chemours Company at a Glance ($ in millions) Fluoroproducts Chemical Solutions Titanium Technologies Source: Company filings and data 1. Data represents net sales for the last twelve months ending December 31, 2017 See reconciliation of Non-GAAP measures in the appendix 3

4 Full Year 2017 Financial Summary ($ in millions unless otherwise noted) Increased price, improved demand, and cost management led to ~800 basis point Adjusted EBITDA margin expansion Strong Opteon refrigerants adoption, higher base refrigerant pricing and increased demand for fluoropolymers Higher average selling prices and increased volume of Ti-Pure pigment Increased volume and price for Chemical Solutions products offset by impacts from portfolio changes Strong Free Cash Flow despite increased capital expenditures and $335 PFOA MDL settlement payment 1 Net Income attributable to Chemours 2 Calculation based on diluted share count See reconciliation of Non-GAAP measures in the appendix 3 Defined as Adjusted EBITDA divided by Net Sales 4 Defined as Cash from Operations minus cash used for PP&E purchases; 2017 includes $335M PFOA MDL settlement payment completed in August Defined as Adjusted EBITDA on a trailing twelve-month basis less depreciation & amortization divided by average invested capital over the last five quarters 4
5 Fluoroproducts Business Summary BUSINESS OVERVIEW Supplies fluoropolymer products for high performance applications across broad array of industries Supplies fluorochemical products for air conditioning, refrigeration and foam blowing agent markets Global market leader in Fluoroproducts Brands: Teflon, Freon, Opteon, Krytox, Nafion, Viton FINANCIAL SUMMARY $ Millions Revenue $2,264 $2,654 Adjusted EBITDA $445 $669 Adj. EBITDA Margin 20% 25% Fluorochemicals refrigerants, propellants, foam blowing agents, fire suppressants Fluoropolymers industrial resins and specialty products and coatings Key end markets air conditioning, refrigeration, automotive, electronics, communications, wire & cable, energy, consumer, oil & gas, aerospace See reconciliation of Non-GAAP measures in the appendix Source: Company filings and data 1. Segment net sales on a trailing twelve-month basis ending 4Q17 5


6 Fluoropolymers Target Markets for Application Development 2016 Market Size* CAGR 2027 Market Size* Trends and Fluoropolymer Opportunities Automotive 1,100 5% 1,900 Emission standards and fuel efficiency with internal combustion engines Decarbonization of transportation via alternative energy Active safety and infotainment Renewable Energy & Storage % 850 Development of smart grid with increasing amount of renewable energy and energy storage Government and OEM driven alternative energy vehicles Consumer Electronics & Communications 910 9% 2,300 Growth and innovation in smart phones, wearables, IoT, artificial intelligence, etc. Next generation connectivity (5G), advances in circuit boards, LAN, antennas, thermal and electrical shielding Sources: McKinsey; Bain; IHS BCC, US Department of Energy, Chemours sales data and market forecasting * $ Millon; Addressable market size based on current applications, ingredient sales only 6

7 Chemours Fluoropolymers Impact Expect growth in both core and differentiated product lines over the next ten years - GDP-like 10-year CAGR for core - GDP+ 10-year CAGR for differentiated products Anticipate differentiated products to become a more meaningful piece of the Fluoropolymers portfolio over time - Attractive long-term mega trends Fluoropolymers Gross Contribution Breakdown Source: Company estimates 7


8 Chemours Fluorochemicals Conversion to Opteon Updated CAGR Based on: Stronger Mobile Air Conditioning growth Faster adoption of Stationary Refrigerants, driven by EU Higher volume and price anticipated Upward Revision to Fluorochemicals Profitability Over December 2017 Investor Day Projections Source: Company estimates 8
9 Fluoroproducts Business Summary Fluorochemicals Balancing the technological shift from base refrigerants to low GWP offerings A result of regulations globally to reduce HFCs Supporting long-term needs of our customers through continued development of low GWP products Investing in low-cost HFO manufacturing and capacity to drive future earnings Fluoropolymers Investing in application development to drive greater portfolio mix of higher value differentiated offerings Leveraging our market leadership to expand into key, attractive applications and end market Shifting focus toward higher differentiation product mix to enhance margin profile We are Unlocking the Potential of the Chemours Fluoroproducts Business through Fluoropolymers Application Development and Global Technology Transition of Fluorochemicals 9

10 Chemours Fluoroproducts Strategic Priorities Positioning to capture value from emerging industry and regulatory trends Increasing investment to shift our business to an application development focus Delivering long-term GDP+ growth with enhanced profitability Source: Chemours estimates 10
11 Chemical Solutions Business Overview BUSINESS OVERVIEW Portfolio of industrial businesses primarily operating in the Americas Reputation for safety, reliability and stewardship Three production facilities located in North America Memphis, TN: Mining Solutions Belle, WV: PC&I Pascagoula, MS: PC&I FINANCIAL SUMMARY $ Millions Revenue $772 $571 Adjusted EBITDA $39 $57 Adj. EBITDA Margin 5% 10% Mining Solutions sodium cyanide, hydrogen cyanide Performance Chemicals & Intermediates methylamines, glycolic acid, Vazo products, aniline, nitrobenzene See reconciliation of Non-GAAP measures in the appendix Source: Company filings and data 1. Segment net sales on a trailing twelve-month basis ending 4Q17 11

12 Chemours Chemical Solutions Strategic Priorities Strong and growing market position for Mining Solutions Targeted investments in key product lines Continuous focus on reducing costs and optimizing Belle infrastructure 12

13 Titanium Technologies Business Overview BUSINESS OVERVIEW Global leader 1 in TiO 2 with production capacity of 1.25 million metric tons 4 TiO 2 plants with 7 production lines Packaging facility at Kallo, Belgium Mineral sands mine at Starke, FL Strong brand reputation Ti-Pure sold to approximately 700 customers globally Industry-leading manufacturing cost position Unique chloride technology Feedstock flexibility FINANCIAL SUMMARY $ Millions Revenue $2,364 $2,958 Adjusted EBITDA $466 $862 Adj. EBITDA Margin 20% 29% Coatings architectural, industrial, automotive Plastics rigid/flexible packaging, PVC pipe/windows Papers laminate papers, coated paper/paperboard, sheet See reconciliation of Non-GAAP measures in the appendix Source: Company filings and data 1. TiO 2 market share statistics based on production capacity per 2016 TZMI 2. Reflects 4Q17 trailing twelve-month segment net sales; excludes non-tio 2 sales 13

14 Chemours Vision of Ti-Pure Value Stabilization CHEMOURS VISION We absorb the demand variance in our customer s marketplace, while maintaining value-based pricing for Ti-Pure products Reduced business volatility stabilizes Chemours cash generation and enables more consistent capacity planning to serve our customers We can support and grow our investment in new offerings over time, enhancing growth options for our customers Our customers can focus their efforts on market growth and avoid the distracting seesaw of Can I get the TiO 2 I need? or How high will the price go? CHEMOURS APPROACH Create contractual relationships which support a more stable customer-chemours relationship Improve our manufacturing flexibility and capacity to economically respond to both decreases and increases in our customers sales which vary their requirements for Ti-Pure TiO 2 Deliver value from a sustained investment in market insights and new offering development 14

15 Chemours Enhanced Circuit Manufacturing Capacity Chemours is committed to regularly adding incremental capacity at high capital return Technology-enabled debottlenecking will further increase our economy of scale advantage Improving our world class uptime capability through strong operational discipline and structured continuous improvement Developing long-term capacity plans to support customer growth Supported with capital investment to expand our ilmenite mine and long-term ore contracts Additional ~10% Flexible Capacity Will Support Our Customers Growth 15

16 Chemours Titanium Technologies Strategic Priorities Chemours Titanium Technologies is driving a robust business model focused on durable growth Stabilizing the value of Ti-Pure TiO 2, which is good for our customers, investors and suppliers Renewing our focus on customers and offerings Being the go-to supplier supporting customer growth through reliable supply, regular capacity addition and innovative offerings Improving our unique manufacturing skills for increased product and production flexibility at an advantaged cost Participating in China s development 16
17 2018 Outlook Expected to be at Higher End of Ranges 1 Adjusted EBITDA $ $1.85 Billion Key Factors and Assumptions 2 Adjusted EPS $ $5.60 Free Cash Flow > $600 Million 2018 Ti-Pure realized average price above 2017 average price Continued Opteon adoption Fluoropolymers volume growth Strong demand in Mining Solutions Benefits to Adjusted EPS and Free Cash Flow from recent US tax reform See reconciliation of Non-GAAP measures in the appendix 1 Outlook estimates were provided on March 26, 2018 and are not being confirmed or updated at this time. 2 Subject to risks, uncertainties and assumptions, all of which are described in our public filings and safe harbor statement 17

18 Long-Term Growth Through Portfolio Strength FLUOROPRODUCTS Aligning fluoropolymer application development to provide customer solutions in fast-growing markets Maximizing refrigerant regulatory environment to grow Opteon and optimize other fluorochemical product offerings CHEMICAL SOLUTIONS Supplying growing demand for sodium cyanide Supporting key customers in Mexico with capacity expansion Focusing on value stabilization to align with long-term customer needs TITANIUM TECHNOLOGIES Targeting customer growth with high-quality TiO 2 Meeting increased Chinese demand for chloride TiO 2 with BaiMax Adding incremental capacity to meet customer demand with low-cost, flexible circuit Portfolio Expected To Generate Significant Free Cash Flow Through
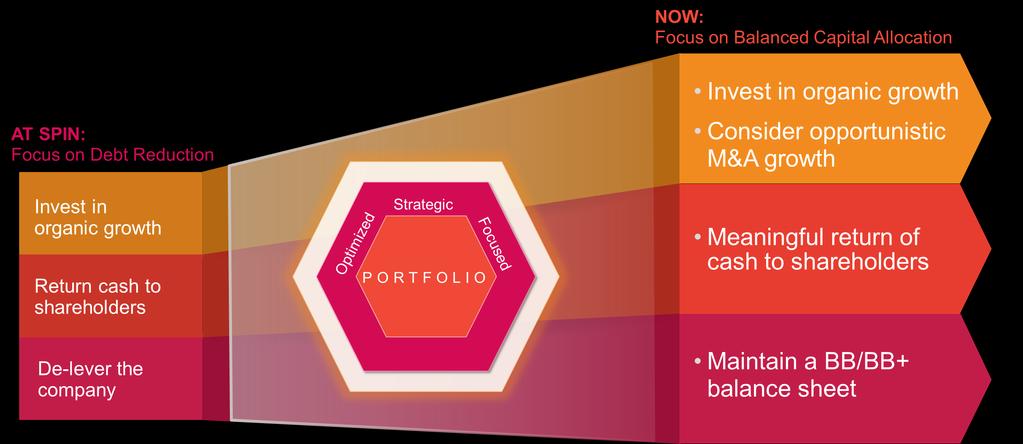
19 Capital Allocation Priorities 19

20 Driving Shareholder Value Throughout 2020 * 1. Based on $0.17/share, subject to quarterly Board approval Expect To Deliver Robust Growth, Generate Strong FCF and Provide Attractive Returns See reconciliation of Non-GAAP measures in the appendix * Outlook estimates were provided on February 15, 2018 and are not being confirmed or updated at this time. Subject to risks, uncertainties and assumptions, all of which are described in our public filings and safe harbor statement 20
21 Appendix 21
22 GAAP Net Income Attributable to Chemours and Adjusted EBITDA Tabular Reconciliations (Unaudited) ($ in millions except per share amounts) Year ended December 31, $ amounts $ per share $ amounts $ per share Net income attributable to Chemours $ 746 $ 4.04 $ 7 $ 0.04 Non-operating pension and other post-retirement employee benefit income (34) (0.18) (20) (0.11) Exchange (gains) losses (3) (0.02) Restructuring charges Asset-related charges Gain on sale of assets or businesses (22) (0.12) (254) (1.40) Transaction costs Legal and other charges Adjustments made to income taxes (25) (0.14) Benefit from income taxes relating to reconciling items 1 (14) (0.08) (148) (0.81) Adjusted Net Income $ 729 $ 3.95 $ 213 $ 1.17 Net income attributable to non-controlling interests 1 - Interest expense, net Depreciation and amortization All remaining provision for income taxes Adjusted EBITDA $ 1,422 $ 822 Weighted average number of common shares outstanding - basic 184,844, ,621,422 Weighted average number of common shares outstanding - diluted 190,983, ,416,500 Earnings per share - basic $ 4.04 $ 0.04 Earnings per share - diluted 2 $ 3.91 $ 0.04 Adjusted earnings per share - basic $ 3.95 $ 1.17 Adjusted earnings per share - diluted 2 $ 3.82 $ Total of provision for (benefit from) income taxes reconciles to the amount reported in the Consolidated Statements of Operations for the years ended December 31, 2017 and Diluted earnings per share is calculated using net income available to common shareholders divided by diluted w eighted-average common shares outstanding during each period, w hich includes unvested restricted shares. Diluted earnings per share considers the impact of potentially dilutive securities except in periods in w hich there is a loss because the inclusion of the potential common shares w ould have an anti-dilutive effect. 22
23 GAAP Cash Flow Provided by Operating Activities to Free Cash Flow Tabular Reconciliation (Unaudited) GAAP Cash Flow to Free Cash Flow Tabular Reconciliations (UNAUDITED) ($ in millions unless otherwise noted) Three months ended Twelve months ended December 31, September 30, December 31, Cash flow provided by operating activities 1 2 $ 303 $ 269 $ 112 $ 639 $ 594 Cash flow used for purchases of property, plant and equipment (165) (103) (108) (411) (338) Free Cash Flow $ 138 $ 166 $ 4 $ 228 $ Cash flow provided by operating activities for the tw elve months ended December 31, 2017 and 2016 include the DuPont prepayment of $190 million received in the first quarter of 2016, of w hich $0 million and $58 million remain outstanding as of December 31, 2017 and 2016, respectively. Excluding the DuPont prepayment, Free Cash Flow for the tw elve months ended December 31, 2016 w ould have been $198 million. 2 Cash flow provided by operating activities for the tw elve months ended December 31, 2017 include PFOA MDL Settlement payments of $335 million. Excluding the PFOA MDL settlement payments, Free Cash Flow for the tw elve months ended December 31, 2017 w ould have been $563 million. 23
24 Segment Net Sales and Adjusted EBITDA (Unaudited) SEGMENT NET SALES AND ADJUSTED EBITDA (UNAUDITED) ($ in millions unless otherwise noted) Three months ended December 31, Three months ended September 30, Twelve months ended December 31, SEGMENT NET SALES Titanium Technologies $ 785 $ 623 $ 799 $ 2,958 $ 2,364 Fluoroproducts ,654 2,264 Chemical Solutions Total Company $ 1,575 $ 1,322 $ 1,584 $ 6,183 $ 5,400 SEGMENT ADJUSTED EBITDA Titanium Technologies $ 261 $ 157 $ 249 $ 862 $ 466 Fluoroproducts Chemical Solutions Corporate & Other (46) (38) (44) (166) (128) Total Company $ 394 $ 239 $ 381 $ 1,422 $ 822 SEGMENT ADJUSTED EBITDA MARGIN Titanium Technologies 33.2% 25.2% 31.2% 29.1% 19.7% Fluoroproducts 24.2% 19.5% 24.8% 25.2% 19.7% Chemical Solutions 14.9% 6.9% 12.2% 10.0% 5.1% Corporate & Other 0.0% 0.0% 0.0% 0.0% 0.0% Total Company 25.0% 18.1% 24.1% 23.0% 15.2% 24
25 GAAP Net Income Attributable to Chemours to Adjusted Net Income, Adjusted EBITDA and Adjusted EPS Tabular Reconciliations (Unaudited) Low (Estimated) Year Ended December 31, 2018 Net income attributable to Chemours $ 980 $ 1,040 Restructuring charges Benefit from income taxes relating to reconciling items (1) (5) (5) Adjusted net income 995 1,055 Interest expense, net Depreciation and amortization All remaining provision for income taxes Adjusted EBITDA $ 1,775 $ 1,850 High Weighted average number of common shares outstanding - basic (2) Dilutive effects of Chemours' employee compensation plans (2) (3) Weighted average number of common shares outstanding - diluted Earnings per share - basic $ 5.39 $ 5.72 Earnings per share - diluted (3) Adjusted earnings per share - basic Adjusted earnings per share - diluted (3) (1) The income tax impacts included in this caption are determined using the applicable rates in the taxing jurisdictions in which income or expense occurred and include both current and deferred income tax (benefit) expense based on the nature of the non-gaap financial measure. (2) Our estimates for the weighted-average number of common shares outstanding - basic and diluted reflect results for the year ended December 31, 2017, which are carried forward for the projection period. (3) Diluted earnings per share is calculated using net income available to common shareholders divided by the diluted weighted-average number of common shares outstanding during each period, which includes unvested restricted shares. Diluted earnings per share considers the impact of potentially dilutive securities, except in periods in which there is a loss because the inclusion of the potential common shares would have an anti-dilutive effect. Our estimates reflect our current visibility and expectations of market factors, such as, but not limited to: currency movements, titanium dioxide prices and end-market demand. Actual results could differ materially from the current estimates due to market factors and unknown or uncertain other factors, such as non-operating pension and other post-retirement employee benefit activity with respect to our foreign pension plans, including settlements or curtailments, cost savings actions that may be taken in the future, the impact of currency movements on our results, including exchange gains and losses, and the related tax effects, or the impact of new accounting pronouncements. 25
26 GAAP Cash Flow Provided by Operating Activities to Free Cash Flow Tabular Reconciliations (Unaudited) GAAP Cash Flow Provided by Operating Activities to Free Cash Flow Tabular Reconciliations (Unaudited) (Dollars in millions) (Estimated) Year Ended December 31, 2018 Cash flow provided by operating activities Less: Cash flow used for purchases of property, plant and equipment Free Cash Flow > $1,125 (525) - (475) > $600 26
27 Return On Invested Capital (Unaudited) RETURN ON INVESTED CAPITAL (UNAUDITED) (Dollars in millions) Year Ended December Adjusted EBITDA (1) $ 1,422 $ 822 Less: Depreciation and amortization (273) (284) Adjusted EBIT 1, Total debt 4,112 3,544 Total equity Less: Cash and cash equivalents (1,556) (902) Invested capital, net $ 3,421 $ 2,746 Average invested capital (2) $ 3,157 $ 3,419 Return on Invested Capital 36.4% 15.7% (1) See a reconciliation of Adjusted EBITDA to net income (loss) attributable to Chemours in preceding tab. (2) Average invested capital is based on a five-point trailing average of invested capital, net. 27

28 2018 The Chemours Company. Chemours and the Chemours Logo are trademarks or registered trademarks of The Chemours Company 28
Investor Presentation. March 2018
 Investor Presentation March 2018 Safe Harbor Statement and Other Matters This presentation contains forward-looking statements, within the meaning of the safe harbor provisions of the U.S. Private Securities
Investor Presentation. November 2018
 Investor Presentation November 2018 Safe Harbor Statement and Other Matters This presentation contains forward-looking statements, within the meaning of the safe harbor provisions of the U.S. Private Securities
Investor Presentation. May 2018
 Investor Presentation May 2018 Safe Harbor Statement and Other Matters This presentation contains forward-looking statements, within the meaning of the safe harbor provisions of the U.S. Private Securities
The Chemours Company. Investor Presentation. March 2017
 The Chemours Company Investor Presentation March 2017 Safe Harbor Statement and Other Matters This presentation contains forward-looking statements, within the meaning of the federal securities laws, that
Investor Presentation. June 2018
 Investor Presentation June 2018 Safe Harbor Statement and Other Matters This presentation contains forward-looking statements, within the meaning of the safe harbor provisions of the U.S. Private Securities
The Chemours Company. Third Quarter Earnings Presentation. November 3, 2017
 The Chemours Company Third Quarter Earnings Presentation November 3, 2017 Safe Harbor Statement and Other Matters This presentation contains forward-looking statements, within the meaning of the safe harbor
The Chemours Company Goldman Sachs Basic Materials Conference. May 17, 2017
 The Chemours Company Goldman Sachs Basic Materials Conference May 17, 2017 Safe Harbor Statement and Other Matters This presentation contains forward-looking statements, within the meaning of the federal
The Chemours Company. First Quarter Earnings Presentation. May 2, 2017
 The Chemours Company First Quarter Earnings Presentation May 2, 2017 Safe Harbor Statement and Other Matters This presentation contains forward-looking statements, within the meaning of the federal securities
Second Quarter Earnings Presentation. August 3, 2018
 Second Quarter Earnings Presentation August 3, 2018 Safe Harbor Statement and Other Matters This presentation contains forward-looking statements, within the meaning of the safe harbor provisions of the
First Quarter Earnings Presentation. May 4, 2018
 First Quarter Earnings Presentation May 4, 2018 Safe Harbor Statement and Other Matters This presentation contains forward-looking statements, within the meaning of the safe harbor provisions of the U.S.
Third Quarter Earnings Presentation. November 2, 2018
 Third Quarter Earnings Presentation November 2, 2018 Safe Harbor Statement and Other Matters This presentation contains forward-looking statements, within the meaning of the safe harbor provisions of the
Consolidated Earnings & Capital Allocation Outlook. Mark E. Newman, CFO
 Consolidated Earnings & Capital Allocation Outlook Mark E. Newman, CFO Generating Value Delivering Against Our Commitments Revenue ($ Millions) Adjusted EBITDA ($ Millions) 8,000 7,000 6,000 5,000 4,000
The Chemours Company Second Quarter 2016 Earnings Presentation
 The Chemours Company Second Quarter 2016 Earnings Presentation August 9, 2016 Safe Harbor Statement This presentation contains forward-looking statements, which often may be identified by their use of
The Chemours Company. Quarterly Financial Information. May 4, 2018
 The Chemours Company Quarterly Financial Information May 4, 2018 1 Safe Harbor Statement This presentation contains forward-looking statements, within the meaning of the safe harbor provisions of the U.S.
The Chemours Company. Quarterly Financial Information. February 16, 2018
 The Chemours Company Quarterly Financial Information February 16, 2018 Safe Harbor Statement This presentation contains forward-looking statements, within the meaning of the safe harbor provisions of the
CHEMOURS CO FORM 8-K. (Current report filing) Filed 06/18/15 for the Period Ending 06/18/15
 Filed 06/18/15 for the Period Ending 06/18/15") CHEMOURS CO FORM 8-K (Current report filing) Filed 06/18/15 for the Period Ending 06/18/15 Address 1007 MARKET STREET WILMINGTON, DE 19898 Telephone 302-773-1000 CIK 0001627223 Symbol CC'I SIC Code 2800
CHEMOURS CO FORM 8-K (Current report filing) Filed 06/18/15 for the Period Ending 06/18/15 Address 1007 MARKET STREET WILMINGTON, DE 19898 Telephone 302-773-1000 CIK 0001627223 Symbol CC'I SIC Code 2800
THE CHEMOURS COMPANY 2016 ANNUAL REPORT. Reinvigorated. A year of transformation.
 THE CHEMOURS COMPANY 2016 ANNUAL REPORT Reinvigorated. A year of transformation. A Note from Richard and Mark 2016 financial and business performance results: Fellow Shareholders, For Chemours, 2016 was
The Chemours Company (Exact Name of Registrant as Specified in Its Charter)
") UNITED STATES SECURITIES AND EXCHANGE COMMISSION WASHINGTON, D.C. 20549 FORM 8-K CURRENT REPORT PURSUANT TO SECTION 13 OR 15(d) OF THE SECURITIES EXCHANGE ACT OF 1934 June 19, 2015 Date of Report (Date
UNITED STATES SECURITIES AND EXCHANGE COMMISSION WASHINGTON, D.C. 20549 FORM 8-K CURRENT REPORT PURSUANT TO SECTION 13 OR 15(d) OF THE SECURITIES EXCHANGE ACT OF 1934 June 19, 2015 Date of Report (Date
Tronox Reports Third Quarter 2013 Financial Results
 November 6, 2013 Tronox Reports Third Quarter 2013 Financial Results STAMFORD, Conn., Nov. 6, 2013 /PRNewswire/ -- Tronox Limited (NYSE:TROX) today reported third quarter 2013 revenue of $491 million,
Pentair KeyBanc Capital Markets Industrial, Automotive & Transportation Conference
 Pentair KeyBanc Capital Markets Industrial, Automotive & Transportation Conference John L. Stauch Chief Financial Officer May30, 2013 PENTAIR FORWARD-LOOKING STATEMENTS CAUTION CONCERNING FORWARD-LOOKING
Tronox Announces Amendment to Cristal TiO 2 Agreement
 Tronox Announces Amendment to Cristal TiO 2 Agreement and Reports 4Q17 Results March 1, 2018 2018 Tronox Limited All rights reserved www.tronox.com Safe Harbor Statement and Non U.S. GAAP Financial Terms
JP Morgan Global High Yield and Leveraged Finance Conference February 27, 2018
 JP Morgan Global High Yield and Leveraged Finance Conference February 27, 2018 General Disclosure This presentation includes forward-looking statements within the meaning of Section 27A of the U.S. Securities
EARNINGS TELECONFERENCE
 EARNINGS TELECONFERENCE FOURTH QUARTER - FISCAL 2018 Q4 FISCAL 2018 1 FORWARD LOOKING STATEMENTS This presentation contains forward-looking statements based on management s current expectations, estimates
4Q 2017 Presentation. February 27, 2018
 4Q 2017 Presentation February 27, 2018 SAFE HARBOR Statements contained in this presentation that are not historical and reflect our views about future periods and events, including our future performance,
ITRON, INC. CONSOLIDATED STATEMENTS OF OPERATIONS
 , INC. CONSOLIDATED STATEMENTS OF OPERATIONS (Unaudited, in thousands, except per share data) Revenues $ 470,103 $ 489,353 $ 918,350 $ 964,148 Cost of revenues 351,532 326,312 661,580 646,572 Gross profit
Ingersoll Rand s Acquisition of Precision Flow Systems (PFS) February 11, 2019
 February 11, 2019") Ingersoll Rand s Acquisition of Precision Flow Systems (PFS) February 11, 2019 1 Safe Harbor This presentation contains forward-looking statements, which are statements that are not historical facts, including
Ingersoll Rand s Acquisition of Precision Flow Systems (PFS) February 11, 2019 1 Safe Harbor This presentation contains forward-looking statements, which are statements that are not historical facts, including
ITRON, INC. CONSOLIDATED STATEMENTS OF OPERATIONS
 , INC. CONSOLIDATED STATEMENTS OF OPERATIONS (Unaudited, in thousands, except per share data) Revenues $ 523,335 $ 642,477 $ 2,178,178 $ 2,434,124 Cost of revenues 359,835 449,944 1,463,031 1,687,666 Gross
ITT Inc. Investor Presentation
 ITT Inc. Investor Presentation Safe Harbor This presentation contains forward-looking statements intended to qualify for the safe harbor from liability established by the Private Securities Litigation
October 22, 2013 Media Contact: Patty Seif WILMINGTON, Del Investor Contact:
 October 22, 2013 Media Contact: Patty Seif WILMINGTON, Del. 302-774-4482 patricia.r.seif@dupont.com Investor Contact: 302-774-4994 DuPont Delivers 3Q 2013 Operating Earnings of $.45 per Share Sales Increase
Wells Fargo Securities Industrial & Construction Conference May 8, 2014 New York
 Wells Fargo Securities Industrial & Construction Conference May 8, 2014 New York Nick Fanandakis Chief Financial Officer E. I. du Pont de Nemours & Company Regulation G The attached charts include company
ZEBRA TECHNOLOGIES SECOND-QUARTER 2016 RESULTS. August 9, 2016
 ZEBRA TECHNOLOGIES SECOND-QUARTER 2016 RESULTS August 9, 2016 Anders Gustafsson Chief Executive Officer Mike Smiley Chief Financial Officer 2 Safe Harbor Statement Statements made in this presentation
Jefferies Global Industrials Conference August 7, 2018
 Jefferies Global Industrials Conference August 7, 2018 General Disclosure This presentation includes forward-looking statements within the meaning of Section 27A of the U.S. Securities Act of 1933, as
FIRST QUARTER 2018 EARNINGS CONFERENCE CALL MAY 9, 2018
 FIRST QUARTER 2018 EARNINGS CONFERENCE CALL MAY 9, 2018 Forward-Looking Statements and Non-GAAP Financial Measures Forward-Looking Statements This webcast and presentation contain statements that are forward-looking
PolyOne Investor Presentation KeyBanc 2014 Basic Materials & Packaging Conference Boston, MA September 10, 2014
 PolyOne Investor Presentation KeyBanc 2014 Basic Materials & Packaging Conference Boston, MA September 10, 2014 PolyOne Corporation Page 1 Forward-Looking Statements In this presentation, statements that
Avery Dennison Jefferies Industrials Conference
 Avery Dennison Jefferies Industrials Conference August 9, 2016 Anne Bramman SVP and Chief Financial Officer 1 Avery Dennison Investor Presentation Forward-Looking Statements Certain statements contained
Copyright 2018 CPI Card Group. Fourth Quarter & FY 2017 Earnings Conference Call March 12, 2018
 Fourth Quarter & FY 2017 Earnings Conference Call March 12, 2018 Safe Harbor Forward-Looking Statements Statements in this presentation that are not statements of historical fact are forward-looking statements
ITRON, INC. CONSOLIDATED STATEMENTS OF OPERATIONS
 , INC. CONSOLIDATED STATEMENTS OF OPERATIONS (Unaudited, in thousands, except per share data) Revenues $ 447,536 $ 571,640 Cost of revenues 307,413 388,535 Gross profit 140,123 183,105 Operating expenses
ITRON, INC. CONSOLIDATED STATEMENTS OF OPERATIONS
 , INC. CONSOLIDATED STATEMENTS OF OPERATIONS (Unaudited, in thousands, except per share data) Revenues $ 474,795 $ 447,536 Cost of revenues 320,260 307,413 Gross profit 154,535 140,123 Operating expenses
ITRON, INC. CONSOLIDATED STATEMENTS OF OPERATIONS
 , INC. CONSOLIDATED STATEMENTS OF OPERATIONS (Unaudited, in thousands, except per share data) Revenues $ 489,353 $ 482,175 $ 964,148 $ 929,711 Cost of revenues 326,312 322,587 646,572 630,000 Gross profit
ITRON, INC. CONSOLIDATED STATEMENTS OF OPERATIONS
 , INC. CONSOLIDATED STATEMENTS OF OPERATIONS (Unaudited, in thousands, except per share data) Revenues $ 571,640 $ 563,691 Cost of revenues 388,535 378,713 Gross profit 183,105 184,978 Operating expenses
N O V E M B E R 2 0,
 N O V E M B E R 2 0, 2 0 1 8 This communication contains forward-looking statements as defined in the Securities Exchange Act of 1934 and is subject to the safe harbors created therein. These forward-looking
A Trusted Technology Partner to Medical and Advanced Technology Equipment Manufacturers
 A Trusted Technology Partner to Medical and Advanced Technology Equipment Manufacturers Baird Industrial Conference, November 2017 Matthijs Glastra, Chief Executive Officer NASDAQ: NOVT 1 Safe Harbor Statement
October 25, 2011 Media Contact: Michael Hanretta WILMINGTON, Del Investor Contact:
 October 25, 2011 Media Contact: Michael Hanretta WILMINGTON, Del. 302-774-4005 michael.j.hanretta@usa.dupont.com Investor Contact: 302-774-4994 DuPont Delivers Strong EPS Growth on 32% Higher Sales for
ITRON, INC. CONSOLIDATED STATEMENTS OF OPERATIONS
 , INC. CONSOLIDATED STATEMENTS OF OPERATIONS (Unaudited, in thousands, except per share data) Revenues $ 504,063 $ 615,555 $ 1,654,843 $ 1,791,647 Cost of revenues 332,266 438,559 1,103,196 1,237,722 Gross
ITT Inc. Investor Presentation
 ITT Inc. Investor Presentation Safe Harbor This presentation contains forward-looking statements intended to qualify for the safe harbor from liability established by the Private Securities Litigation
2013 INVESTOR MEETINGS May 2013
 2013 May 2013 INVESTOR MEETINGS WHIRLPOOL CORPORATION ADDITIONAL INFORMATION This document contains forward-looking statements about Whirlpool Corporation and its consolidated subsidiaries ( Whirlpool
Second Quarter 2017 Earnings Conference Call
 Second Quarter 2017 Earnings Conference Call July 28, 2017 NYSE: TEN Agenda Second Quarter Highlights Segment Results and Financial Overview Outlook and Strategic Priorities Brian Kesseler Chief Executive
ITT reports 2017 fourth-quarter and full-year results, 2018 guidance
 ITT Inc. 1133 Westchester Ave. White Plains, NY 10604 tel 914 641 2000 Press Release ITT reports 2017 fourth-quarter and full-year results, 2018 guidance 2017 Full-Year Results: Revenue up 8% to $2.6 billion,
DuPont Second Quarter 2015 Earnings
 DuPont Second Quarter 2015 Earnings Conference Call July 28, 2015 Regulation G The attached charts include company information that does not conform to generally accepted accounting principles (GAAP).
Sanford C. Bernstein Strategic Decisions Conference
 Sanford C. Bernstein Strategic Decisions Conference June, 2016 Tom Lynch Chief Executive Officer Forward-Looking Statements and Non-GAAP Measures Forward-Looking Statements This presentation contains certain
July 23, 2013 Media Contact: Michael Hanretta WILMINGTON, Del Investor Contact:
 July 23, 2013 Media Contact: Michael Hanretta WILMINGTON, Del. 302-774-4005 michael.j.hanretta@dupont.com Investor Contact: 302-774-4994 DuPont Delivers 2Q 2013 Operating EPS of $1.28 Agriculture Sales
Veritiv Corporation Fourth Quarter and Full Year 2018 Financial Results February 28, 2019
 Veritiv Corporation Fourth Quarter and Full Year 2018 Financial Results February 28, 2019 Tom Morabito Director of Investor Relations 2 Safe Harbor Provision Certain statements contained in this presentation
Safe Harbor. Non-GAAP Financial Information
 1 Safe Harbor This document contains forward-looking statements within the meaning of the Private Securities Litigation Reform Act of 1995, including financial projections subject to risks, uncertainties
Veritiv Corporation Fourth Quarter and Fiscal Year 2017 Financial Results March 1, 2018
 Veritiv Corporation Fourth Quarter and Fiscal Year 2017 Financial Results March 1, 2018 Tom Morabito Director of Investor Relations 2 Safe Harbor Provision Certain statements contained in this presentation
Veritiv Corporation Third Quarter 2017 Financial Results November 7, 2017
 Veritiv Corporation Third Quarter 2017 Financial Results November 7, 2017 Tom Morabito Director of Investor Relations 2 Safe Harbor Provision Certain statements contained in this presentation regarding
2016 INVESTOR MEETINGS FIRST QUARTER 2016 WHIRLPOOL CORPORATION
 2016 INVESTOR MEETINGS FIRST QUARTER 0 FIRST-QUARTER INVESTOR MEETINGS WHIRLPOOL CORPORATION ADDITIONAL INFORMATION This Presentation contains forward-looking statements about Whirlpool Corporation and
Itron, Inc. Comparison of Key 2015 Financial Metrics to Preliminary Results Announced February 17, Total operating expenses 486, ,839
 Itron, Inc. Comparison of Key 2015 Financial Metrics to Preliminary Results Announced February 17, 2016 (Unaudited, in thousands, except per share data) (announced Feb. 17, 2016) Preliminary FY 2015 Final
Johnson Controls reports fiscal Q3 earnings with strong organic growth and underlying margin expansion
 FOR IMMEDIATE RELEASE CONTACT: Investors: Antonella Franzen (609) 720-4665 Ryan Edelman (609) 720-4545 Media: Fraser Engerman (414) 524-2733 Johnson Controls reports fiscal Q3 earnings with strong organic
Ted Doheny, President & CEO Bank of America Merrill Lynch Global Agriculture & Materials Conference February 28, 2018
 Ted Doheny, President & CEO Bank of America Merrill Lynch Global Agriculture & Materials Conference February 28, 2018 1 Safe Harbor & Regulation G Statement This presentation contains forward-looking statements
Veritiv Corporation First Quarter 2018 Financial Results May 8, 2018
 Veritiv Corporation First Quarter 2018 Financial Results May 8, 2018 Tom Morabito Director of Investor Relations 2 Safe Harbor Provision Certain statements contained in this presentation regarding Veritiv
Fiscal 2019 First Quarter Results. October 30, 2018
 Fiscal 2019 First Quarter Results October 30, 2018 Safe Harbor This presentation contains forward-looking statements within the meaning of Section 27A of the Securities Act of 1933, as amended, and Section
Q and FY 2015 Investor Presentation
 Q4 2015 and FY 2015 Investor Presentation Legal Disclaimer This presentation contains "forward-looking statements" within the meaning of the Private Securities Litigation Reform Act of 1995. All statements
Deutsche Bank Global Auto Industry Conference
 Deutsche Bank Global Auto Industry Conference Detroit, MI January 17, 2018 NYSE: TEN Safe Harbor This presentation contains forward-looking statements that involve risks and uncertainties which could cause
Zep Inc. Company Overview. October 2013
 Zep Inc. Company Overview October 2013 Safe Harbor This release contains, and other written or oral statements made by or on behalf of Zep may include, forward-looking statements, within the meaning of
productivity results support our confidence in raising the full-year earnings outlook.
 April 21, 2011 Media Contact: Anthony Farina WILMINGTON, Del. 302-773-4418 anthony.r.farina@usa.dupont.com Investor Contact: 302-774-4994 DuPont Reports 1Q 2011 Earnings of $1.52 per Share, Raises 2011
Steve Martens VP Investor Relations FY13 Q3
 Steve Martens VP Investor Relations steve.martens@molex.com FY13 Q3 Forward-Looking Statement Statements in this presentation that are not historical are forward-looking and are subject to various risks
January 28, 2014 Media Contact: Patty Seif WILMINGTON, Del Investor Contact:
 January 28, 2014 Media Contact: Patty Seif WILMINGTON, Del. 302-774-4482 patricia.r.seif@dupont.com Investor Contact: 302-774-4994 DuPont Reports 4Q and Full-Year 2013 Operating EPS of $.59 and $3.88;
Investor Overview NYSE: CW
 Investor Overview NYSE: CW 1 2019 Curtiss-Wright Safe Harbor Statement Please note that the information provided in this presentation is accurate as of the date of the original presentation. The presentation
CARS.COM. Third Quarter 2017 Earnings November 8, 2017
 CARS.COM Third Quarter 2017 Earnings November 8, 2017 Forward Looking Statements This presentation contains forward looking statements within the meaning of the federal securities laws, including those
ITT reports strong 2018 third-quarter results Raises EPS and Organic Revenue guidance mid-points
 ITT Inc. 1133 Westchester Ave. White Plains, NY 10604 tel 914 641 2000 Press Release ITT reports strong 2018 third-quarter results Raises EPS and Organic Revenue guidance mid-points 2018 Third-Quarter
Raymond James 37 th Annual Institutional Investors Conference. March 8, 2016
 Raymond James 37 th Annual Institutional Investors Conference March 8, 2016 Forward-looking statements and Non-GAAP financial measures Forward-looking statements Certain statements included in this presentation,
TopBuild Reports Strong Second Quarter 2018 Results
 NYSE:BLD The leading purchaser, installer and distributor of insulation products to the U.S. construction industry TopBuild Reports Strong Second Quarter 2018 Results Net Sales Increased 27.7% $0.76 Income
Our Transformation Continues Sidoti NDR May 29-30, 2018
 Our Transformation Continues Sidoti NDR May 29-30, 2018 Disclosure Regarding Forward-Looking Statements Forward-Looking Statements and Factors That May Affect Future Results: Throughout this presentation,
Nasdaq: DAIO. Joel Hatlen. Chief Operating & Financial Officer. Data I/O Corporation September 2017 Investor Presentation
 Nasdaq: DAIO Joel Hatlen Chief Operating & Financial Officer Data I/O Corporation September 2017 Investor Presentation Safe Harbor The matters that we discuss today will include forward-looking statements
CPI Card Group Inc. Reports Fourth Quarter and Full Year 2016 Results
 NEWS RELEASE CPI Card Group Inc. Reports Fourth Quarter and Full Year 2016 Results 3/1/2017 Q4 Net Sales of $67.4 million, Full Year 2016 Net Sales of $308.7 million Full Year Net Income from Continuing
Rogers Corporation Q Earnings Call August 9, 2016
 Rogers Corporation Q2-2016 Earnings Call August 9, 2016 Introductions Bruce Hoechner President & Chief Executive Officer Janice Stipp Vice President, Finance & Chief Financial Officer Bob Daigle Senior
RAVEN INDUSTRIES SOLVING GREAT CHALLENGES
 RAVEN INDUSTRIES SOLVING GREAT CHALLENGES As of October 31, 2018 1 SAFE HARBOR & REGULATION G Safe Harbor Statement Certain matters discussed today may include 'forward looking statements' as that term
Babcock & Wilcox Enterprises, Inc. Company Overview March 2018
 Babcock & Wilcox Enterprises, Inc. Company Overview March 2018 Safe Harbor Statement B&W cautions that this presentation contains forward-looking statements, including, without limitation, statements relating
FY 2018 First Quarter Earnings Supplemental Information. August 10, 2017
 FY 2018 First Quarter Earnings Supplemental Information August 10, 2017 Forward-Looking Statements Certain statements in this presentation and other oral and written statements made by Vista Outdoor from
Q Earnings. April 25, 2018
 Q2 2018 Earnings April 25, 2018 Forward-Looking Statements and Non-GAAP Measures Forward-Looking Statements This presentation contains certain forward-looking statements within the meaning of the U.S.
Investor Presentation. February 2019
 Investor Presentation February 2019 Safe Harbor Statement Certain statements contained within this presentation may be considered forward-looking under the Private Securities Litigation Reform Act of 1995
3Q Presentation. November 7, 2017
 3Q Presentation November 7, 2017 SAFE HARBOR Statements contained in this presentation that are not historical and reflect our views about future periods and events, including our future performance, constitute
Our Transformation Continues. March 21, 2018
 Our Transformation Continues March 21, 2018 Disclosure Regarding Forward-Looking Statements Forward-Looking Statements and Factors That May Affect Future Results: Throughout this presentation, we make
INNOPHOS HOLDINGS, INC. REPORTS SECOND-QUARTER 2017 RESULTS. Q2 Revenue and Earnings Performance Exceeds Guidance
 FOR IMMEDIATE RELEASE Investor Contact Media Contact Mark Feuerbach Ryan Flaim Innophos Sharon Merrill Associates 609-366-1204 617-542-5300 investor.relations@innophos.com iphs@investorrelations.com INNOPHOS
USA Truck, Inc. (NASDAQ: USAK) Investor Presentation February 2016
 Investor Presentation February 2016") USA Truck, Inc. (NASDAQ: USAK) Investor Presentation February 2016 DISCLOSURE STATEMENT This presentation and accompanying comments may contain forward-looking statements within the meaning of Section
USA Truck, Inc. (NASDAQ: USAK) Investor Presentation February 2016 DISCLOSURE STATEMENT This presentation and accompanying comments may contain forward-looking statements within the meaning of Section
Electrical Products Group Conference. May 23, 2018
 Electrical Products Group Conference May 23, 2018 FORWARD-LOOKING STATEMENTS NON-GAAP MEASURES The Company uses certain non-gaap measures in discussing the Company s performance. The reconciliation of
Q Earnings. GAAP to Non-GAAP Reconciliation
 Q1 2012 Earnings GAAP to Non-GAAP Reconciliation This presentation contains forward-looking statements relating to, among other things, our outlook for full year 2012 bookings, adjusted EBITDA, stock-based
A Trusted Technology Partner to Medical and Advanced Technology Equipment Manufacturers
 A Trusted Technology Partner to Medical and Advanced Technology Equipment Manufacturers February 2018 Matthijs Glastra, Chief Executive Officer NASDAQ: NOVT 1 Safe Harbor Statement The statements in this
Qorvo Announces Fiscal 2019 Second Quarter Financial Results
 Qorvo Announces Fiscal 2019 Second Quarter Financial Results October 31, GREENSBORO, N.C., Oct. 31, (GLOBE NEWSWIRE) -- Qorvo (Nasdaq:QRVO), a leading provider of innovative RF solutions that connect the
Investor Presentation February 2017
 Investor Presentation February 2017 Safe Harbor Certain statements in this document regarding anticipated financial, business, legal or other outcomes including business and market conditions, outlook
Q Investor Presentation
 Q3 2016 Investor Presentation Legal Disclaimer This presentation contains "forward-looking statements" within the meaning of the Private Securities Litigation Reform Act of 1995. All statements contained
TE Connectivity. Citi U.S. and European Industrials Conference. September 2013
 TE Connectivity Citi U.S. and European Industrials Conference September 2013 Forward-Looking Statements and Non-GAAP Measures Forward-Looking Statements -- This presentation contains certain forward-looking
JULY 26, Earnings Summary Second Quarter 2018
 JULY 26, 2018 Earnings Summary Second Quarter 2018 SAFE HARBOR This presentation contains, and management may make, forward-looking statements within the meaning of the Private Securities Litigation Reform
Nasdaq: DAIO. Data I/O Corporation January 2018 Investor Presentation
 Nasdaq: DAIO Data I/O Corporation January 2018 Investor Presentation Safe Harbor The matters that we discuss today will include forward-looking statements that involve risks factors that could cause Data
2
 News Release 1 2 3 4 5 6 Ashland Global Holdings Inc. and Consolidated Subsidiaries Table 1 STATEMENTS OF CONSOLIDATED INCOME (LOSS) (In millions except per share data - preliminary and unaudited) Three
Q Investor Presentation
 Q2 2015 Investor Presentation Legal Disclaimer This presentation contains "forward-looking statements" within the meaning of the Private Securities Litigation Reform Act of 1995. All statements contained
Rockwell Automation. Company Overview August 2018 PUBLIC. Copyright 2018 Rockwell Automation, Inc. All Rights Reserved.
 Rockwell Automation Company Overview August 2018 SAFE HARBOR STATEMENT THIS PRESENTATION INCLUDES STATEMENTS RELATED TO THE EXPECTED FUTURE RESULTS OF THE COMPANY AND ARE THEREFORE FORWARD-LOOKING STATEMENTS.
INC. ANNOUNCES FOURTH QUARTER AND FULL YEAR 2018 RESULTS
 For more information contact: Jason Willey Investor Relations and Corporate Development (360) 567-4890 jason.willey@nlight.net nlight, INC. ANNOUNCES FOURTH QUARTER AND FULL YEAR 2018 RESULTS Revenues
Innophos Holdings, Inc. Reports Fourth-Quarter and Full-Year 2017 Results
 Innophos Holdings, Inc. Reports Fourth-Quarter and Full-Year 2017 Results February 21, 2018 Significant Progress Advancing Vision 2022 Strategy 2017 Revenue and Earnings In-Line with Expectations Sets
Q Earnings Call February 20, 2019
 Q4 2018 Earnings Call February 20, 2019 1 Forward-looking statements Safe Harbor Statement This release contains forward-looking statements, which may concern our plans, objectives, outlook, goals, strategies,