GENERAL MILLS. Fiscal 2018 Second Quarter Results. December 20, 2017
|
|
|
- Laureen Benson
- 6 years ago
- Views:
Transcription


1 GENERAL MILLS Fiscal 2018 Second Quarter Results December 20, 2017
2 A Reminder on Forward-looking Statements This presentation contains forward-looking statements within the meaning of the Private Securities Litigation Reform Act of 1995 that are based on management s current expectations and assumptions. These forward-looking statements are subject to certain risks and uncertainties that could cause actual results to differ materially from the potential results discussed in the forward-looking statements. In particular, our predictions about future net sales and earnings could be affected by a variety of factors, including: competitive dynamics in the consumer foods industry and the markets for our products, including new product introductions, advertising activities, pricing actions and promotional activities of our competitors; economic conditions, including changes in inflation rates, interest rates, tax rates, or the availability of capital; product development and innovation; consumer acceptance of new products and product improvements; consumer reaction to pricing actions and changes in promotion levels; acquisitions or dispositions of businesses or assets; changes in capital structure; changes in the legal and regulatory environment, including tax reform legislation, labeling and advertising regulations, and litigation; impairments in the carrying value of goodwill, other intangible assets, or other long-lived assets, or changes in the useful lives of other intangible assets; changes in accounting standards and the impact of significant accounting estimates; product quality and safety issues, including recalls and product liability; changes in consumer demand for our products; effectiveness of advertising, marketing and promotional programs; changes in consumer behavior, trends and preferences, including weight loss trends; consumer perception of health-related issues, including obesity; consolidation in the retail environment; changes in purchasing and inventory levels of significant customers; fluctuations in the cost and availability of supply chain resources, including raw materials, packaging and energy; disruptions or inefficiencies in the supply chain; effectiveness of restructuring and cost savings initiatives; volatility in the market value of derivatives used to manage price risk for certain commodities; benefit plan expenses due to changes in plan asset values and discount rates used to determine plan liabilities; failure or breach of our information technology systems; foreign economic conditions, including currency rate fluctuations; and political unrest in foreign markets and economic uncertainty due to terrorism or war. The company undertakes no obligation to publicly revise any forward-looking statements to reflect any future events or circumstances. 2
3 Jeff Harmening Chief Executive Officer
4 Second Quarter Fiscal 2018 Summary Broad-based Topline Improvement Driving +1% Organic Net Sales* Growth Total Segment Op. Profit* Improved from Q1, Down vs. LY; Plans in Place to Drive Strong Profit Growth in 2H Raising F18 Organic Net Sales Outlook; Maintaining Guidance for SOP and Adjusted Diluted EPS* *Non-GAAP measures. 4

5 Don Mulligan EVP, Chief Financial Officer
6 Second Quarter Fiscal 2018 Financial Summary ($ IN MILLIONS, EXCEPT PER SHARE) $ % CHANGE ORGANIC % CHANGE* Net Sales $4,199 +2% +1% CONSTANT- CURRENCY % CHANGE* Segment Operating Profit* % Net Earnings Attributable to General Mills Diluted EPS $ Certain Items Affecting Comparability 0.08 Adjusted Diluted EPS* $0.82-4% -5% *Non-GAAP measures. See appendix for reconciliation. 6
7 Second Quarter Fiscal 2018 Components of Net Sales Growth Organic Net Sales* = +1% +2% +1 pt +1 pt Flat Flat Organic Volume Organic Price & Mix Foreign Exchange Acquisitions / Divestitures Total Net Sales As Reported *Non-GAAP measure. 7
8 Second Quarter Fiscal 2018 Margin Results ADJUSTED GROSS MARGIN* 36.8% (% of Net Sales) 34.4% ADJUSTED OPERATING PROFIT MARGIN* 19.6% (% of Net Sales) 17.4% Q2 MARGIN DRIVERS Higher Input Costs, Including Currency-driven Inflation Trade Expense Phasing Strong Seasonal Merchandising Media Expense up 7% F17 F18 F17 F18 + Cost Savings *Non-GAAP measures. See appendix for reconciliation. 8
9 Expect 2H Adjusted Operating Profit Margin* to Strengthen ADJUSTED OPERATING PROFIT MARGIN* 2H MARGIN DRIVERS (% of Net Sales) + Positive Price/Mix 18.1% 17.1% 17.4% 18+% + Increased Cost Savings + Moderating Inflation FY Q1 Q2 2H Target Fiscal 2017 Fiscal 2018 *Non-GAAP measures. See appendix for reconciliation. 9


10 Second Quarter Fiscal 2018 Joint Venture Results AFTER-TAX EARNINGS: $24MM; -19% VS. LY IN CONSTANT CURRENCY* Cereal Partners Worldwide Net Sales -2%** Häagen-Dazs Japan Net Sales -3%** *Non-GAAP measure. See appendix for reconciliation. **Growth rates in constant currency. 10
11 Second Quarter Fiscal 2018 Other Income Statement Items Restructuring & Project-related Charges of $6MM Pretax (Includes $5MM in Cost of Sales) Unallocated Corporate Expense Increased Excluding Certain Items Net Interest Expense Down 1% vs. LY Adjusted Effective Tax Rate 29.3% vs. 32.4% LY* Average Diluted Shares Outstanding Down 3% *Non-GAAP measure. See appendix for reconciliation. 11
12 First Half Fiscal 2018 Financial Summary ($ IN MILLIONS, EXCEPT PER SHARE) $ % CHANGE ORGANIC % CHANGE* Net Sales $7,968-1% -1% CONSTANT- CURRENCY % CHANGE* Segment Operating Profit* 1, % Net Earnings Attributable to General Mills Diluted EPS $ Certain Items Affecting Comparability 0.10 Adjusted Diluted EPS* $1.53-6% -7% *Non-GAAP measures. See appendix for reconciliation. 12
13 Core Working Capital ($ IN MILLIONS) Q2 F18 F17 % Change Accounts Receivable $1,510 $1,383 Inventories 1,516 1,526 Accounts Payable 2,467 1,938 Total Core Working Capital $560 $971-42% Table does not foot due to rounding. 13
14 First Half Fiscal 2018 Cash Flow Highlights 1H OPERATING CASH FLOW ($ IN MILLIONS) $1,079 $1,567 Fixed Asset Investment = $260MM Dividends Paid = $565MM Net Share Repurchases = $550MM F17 F18 14
15 Second Half Fiscal 2018 Expectations Strong Seasonal Merchandising in Q3 Excellent 2H Innovation Line Up Favorable Price/Mix Across All Segments Cost Savings Accelerate; Highest in Q4 Strong Growth in Segment Operating Profit* and Adjusted Diluted EPS*; Weighted to Q4 *Non-GAAP measure. 15
16 Updating Fiscal 2018 Guidance PREVIOUS F18 GUIDANCE REVISED F18 GUIDANCE Organic Net Sales* -1 to -2% -1% to Flat Total Segment Operating Profit* Flat to +1%¹ Flat to +1%¹ Adjusted Operating Profit Margin* Higher Lower Adjusted Diluted EPS* +1 to 2%¹ +1 to 2%¹ *Non-GAAP measure. (1) Constant-currency growth rate. 16

17 Jon Nudi SVP; Group President, North America Retail
18 North America Retail Q2 Key Messages Broad-based Improvement in Topline Trends Improving Bottom Line; Initiatives to Drive Profit Growth in 2H Good Progress on Fiscal 2018 Priorities Strong Back-half Plans to Maintain Trajectory 18


")

19 Second Quarter Fiscal 2018 North America Retail SEGMENT GROWTH Organic Net Sales* Constant-currency Segment Operating Profit* Q2 Flat -5% Q2 NET SALES GROWTH BY OPERATING UNIT U.S. Cereal +7% Canada +7 U.S. Snacks +5 U.S. Meals & Baking -2 U.S. Yogurt -11 Total North America Retail +1% (+1% CC¹*) Constant-currency growth *Non-GAAP measure. See appendix for reconciliation 19
20 Continued Topline Improvement in U.S. Retail GENERAL MILLS U.S. RETAIL SALES (% vs. LY) GENERAL MILLS CATEGORIES U.S. RETAIL SALES (% vs. LY) 0.3% -0.6% -0.4% -3.9% -0.9% -7.4% F17 Q4 F18 Q1 F18 Q2 F17 Q4 F18 Q1 F18 Q2 Source: Nielsen XAOC 20
21 U.S. Retail Sales Improvement is Broad Based GENERAL MILLS TOP CATEGORIES U.S. RETAIL SALES GROWTH CHANGE (Q2 Fiscal 2018 vs. Q4 Fiscal 2017, basis points) 1, , , (260) Cereal Yogurt Grain Bars Dough Soup Desserts Hot Snacks Fruit Snacks Mexican Source: Nielsen XAOC, F18 YTD through November 21


22 Quality Topline Improvement Q2 BASELINE SALES IMPROVED 610 BASIS POINTS VS. Q4 F17* BETTER CONSUMER SUPPORT STRONGER INNOVATION NEW PRODUCT SALES +52% VS. LY *Source: Nielsen XAOC, F18 Q2 Source: Nielsen XAOC, F18 YTD through November 22
 DISPLAY MERCHANDISING +DD VS. LY Q1 0.")
23 Quality Topline Improvement BETTER MERCHANDISING AND IN THE ZONE ON PRICING F18 GENERAL MILLS U.S. RETAIL AVERAGE UNIT PRICE 2.1% (% vs. LY; Excludes Yogurt) DISPLAY MERCHANDISING +DD VS. LY Q1 0.4% Q2 Source: Nielsen US Food; baseline sales exposed to display excluding Yogurt, Q2 F18 Source: Nielsen Grocery, Walmart, & Target Channels 23


24 Quality Topline Improvement EXPANDING IN GROWING CHANNELS U.S. RETAIL E-COMMERCE GROWTH 82% +82% F17 1H F18 1H Source: Nielsen XAOC and Internal Estimates 24
25 North America Retail Fiscal 2018 Priorities Improve U.S. Cereal Reshape U.S. Yogurt Portfolio Differentially Grow Snack Bars, Hot Snacks and Mexican Foods Drive Sustainable Profit Growth on Key Foundation Brands Expand Our Natural & Organic Portfolio 25
26 Improving U.S. Cereal GENERAL MILLS U.S. CEREAL RETAIL SALES (% vs. LY) 1% -1% -3% F17 Q1 Q2 F18 Source: Nielsen XAOC 26


 +14% +14% +8%")

27 Taste Cereals Leading Portfolio Improvement FISCAL 2018 YEAR-TO-DATE RETAIL SALES (% vs. LY) +14% +14% +8% +8% 35% of U.S. Cereal Portfolio Source: Nielsen XAOC 27


28 Second-half U.S. Cereal Plans EXTENDING MOMENTUM WITH INNOVATION AND REMARKABLE EXECUTIONS Drive Peanut Butter Cheerios Launch Incremental New Products Execute Remarkable Marketing and Merchandising 28

29 Reshape U.S. Yogurt Portfolio EXPAND INTO FASTER GROWING SEGMENTS THROUGH INNOVATION Innovation Ahead of Target Oui is the Largest Launch in the Category in the Last Five Years* Yoplait Mix-Ins Delivering Good Results *Nielsen XAOC dollar sales through first 21 weeks of launch. 29


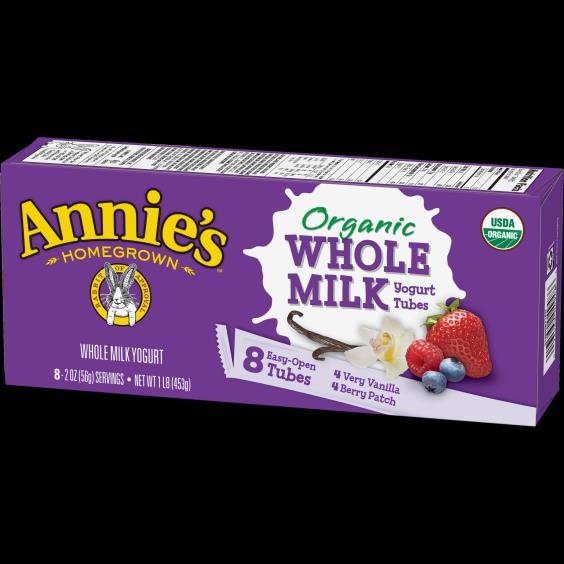
30 Improve Core Portfolio Easy Open Tubes News in First Half Brand Building on Original Style Yoplait 30


31 Continue U.S. Yogurt Improvement in Second Half Behind News and Innovation NEW SEGMENTS CORE New Flavors of Oui More Fruit in Original Style Yoplait Annie s Pouches Yoplait FruitSide 31


 TOTINO S HOT")


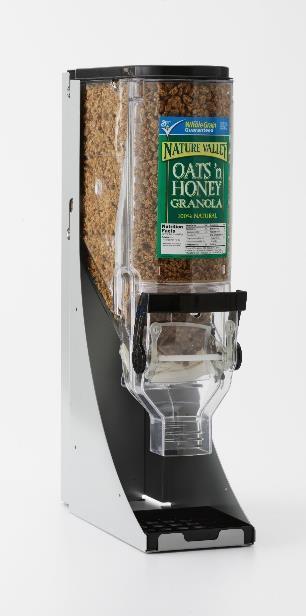
32 Drive Differential Growth on Key Businesses FISCAL 2018 YEAR-TO-DATE RETAIL SALES (% vs. LY) TOTINO S HOT SNACKS OLD EL PASO SNACK BARS Nature Valley: +11% Lärabar: +31% +2% +3% Fiber One: -25% +3% Source: Nielsen XAOC 32


33 Second-half Snack Bars News FIBER ONE NATURE VALLEY 33


34 Soup and Baking Season Update SOUP DESSERT MIXES REFRIGERATED DOUGH Retail Sales: +2% Dollar Share: +0.5 pts Retail Sales: +0.5% Dollar Share: +1.3 pts Retail Sales: -1% Dollar Share: -0.4 pts Source: Nielsen XAOC, October-November


 MAC & CHEESE")


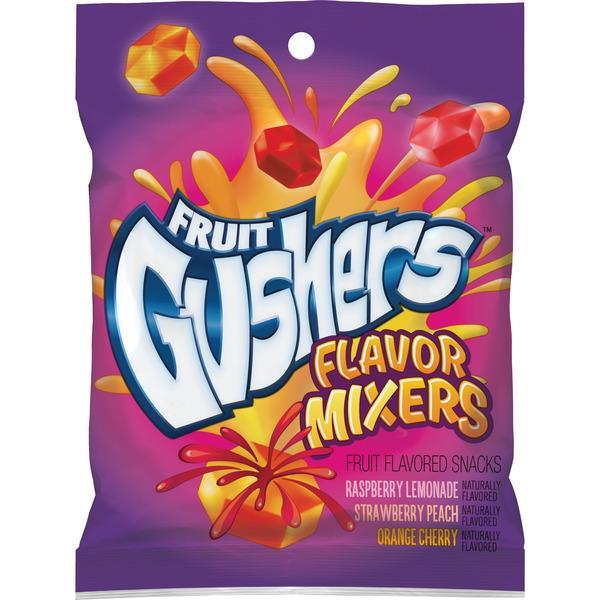
35 Expand our Natural & Organic Portfolio FISCAL 2018 YEAR-TO-DATE MARKET SHARE* (Change vs. LY) MAC & CHEESE CEREAL FRUIT SNACKS +1.5pts +0.8pts +1.8pts *Dollar share of natural & organic categories. Source: Nielsen XAOC/Natural Supermarkets/Whole Foods FYTD through October. 35
36 North America Retail Q2 Key Messages Broad-based Improvement in Topline Trends Improving Bottom Line; Initiatives to Drive Profit Growth in 2H Good Progress on Fiscal 2018 Priorities Strong Back-half Plans to Maintain Trajectory 36

37 Jeff Harmening Chief Executive Officer


38 Second Quarter Fiscal 2018 Convenience Stores & Foodservice SEGMENT GROWTH Q2 Q2 NET SALES GROWTH BY PLATFORM Organic Net Sales* +5% Segment Operating Profit -2% Focus 6 Platforms +4% Other +7 Total CS&F +5% *Non-GAAP measure. See appendix for reconciliation 38
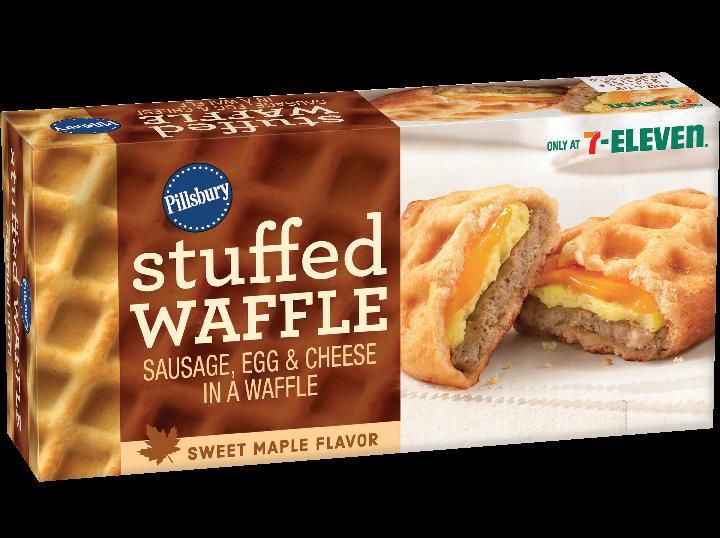


39 Convenience Stores & Foodservice F18 SECOND-HALF PLANS FROZEN MEALS SNACKS CEREAL Frozen Breads in K through 12 39


40 Second Quarter Fiscal 2018 Europe & Australia SEGMENT GROWTH Q2 Organic Net Sales* +1% Constant-currency Segment Operating Profit* -40% *Non-GAAP measure. See appendix for reconciliation 40


41 Europe & Australia F18 SECOND-HALF PLANS HÄAGEN-DAZS SNACK BARS Year 2 in Australia Expanding Fiber One Distribution 41


42 Second Quarter Fiscal 2018 Asia & Latin America SEGMENT GROWTH Q2 Organic Net Sales* Flat Constant-currency Segment Operating Profit* -46% *Non-GAAP measure. See appendix for reconciliation 42


43 Asia & Latin America F18 SECOND-HALF PLANS YOPLAIT IN CHINA HÄAGEN-DAZS SNACKING IN INDIA AND MIDDLE EAST Expanding Perle de Lait New Flavors of Mochi and Fruit & Flowers Launching Pastry Cakes in India 43


44 Fiscal 2018 Growth Priorities GROW CEREAL GLOBALLY (Including CPW) IMPROVE U.S. YOGURT THROUGH INNOVATION INVEST IN DIFFERENTIAL GROWTH OPPORTUNITIES MANAGE FOUNDATION BRANDS WITH APPROPRIATE INVESTMENT 44
45 Second Quarter Fiscal 2018 Summary Broad-based Topline Improvement Driving +1% Organic Net Sales* Growth Total Segment Op. Profit* Improved from Q1, Down vs. LY; Plans in Place to Drive Strong Profit Growth in 2H Raising F18 Organic Net Sales Outlook; Maintaining Guidance for SOP and Adjusted Diluted EPS* *Non-GAAP measures. 45
46 A Reminder on Non-GAAP Guidance Our fiscal 2018 outlook for organic net sales growth, constant currency total segment operating profit and adjusted diluted EPS, and adjusted operating profit margin are non-gaap financial measures that exclude, or have otherwise been adjusted for, items impacting comparability, including the effect of foreign currency exchange rate fluctuations, restructuring charges and projectrelated costs, mark-to-market effects, unusual tax items, acquisitions, and divestitures. We are not able to reconcile these forward-looking non-gaap financial measures to their most directly comparable forward-looking GAAP financial measures without unreasonable efforts because we are unable to predict with a reasonable degree of certainty the impact of changes in foreign currency exchange rates and commodity prices or the timing or impact of restructuring actions, unusual tax items, acquisitions, and divestitures throughout fiscal The unavailable information could have a significant impact on our fiscal 2018 GAAP financial results. For fiscal 2018, we currently expect: foreign currency exchange rates (based on blend of forward and forecasted rates and hedge positions), acquisitions, and divestitures to increase net sales by approximately 1 percent; foreign currency exchange rates to have an immaterial impact on total segment operating profit and adjusted diluted EPS growth; total restructuring charges and project-related costs related to actions previously announced to total $40 million; and unusual tax items previously announced to total approximately $42 million of expense. 46
47 Reconciliation of Second Quarter Fiscal 2018 Organic Net Sales Growth (FISCAL YEAR) Organic Volume Organic Price/Mix Q Organic Net Sales Foreign Exchange Reported Net Sales Growth North America Retail 1 pt (1) pt Flat 1 pt 1 % Convenience Stores & Foodservice 3 pts 2 pts 5 % - 5% Europe & Australia 1 pt - 1 % 6 pts 7 % Asia & Latin America (7) pts 7 pts Flat 2 pts 2 % Total Flat 1 pt 1 % 1 pt 2 % 47
48 Reconciliation of Second Quarter Fiscal 2018 Total Segment Operating Profit (FISCAL YEARS, $ IN MILLIONS) Q % Change North America Retail $622.9 $651.0 (4) % Convenience Stores & Foodservice (2) Europe & Australia (35) Asia & Latin America (42) Total Segment Operating Profit $773.0 $830.4 (7) % Unallocated Corporate Items Divestiture loss NM Restructuring, impairment, and other exit costs (94) Operating Profit $729.8 $768.9 (5) % 48
49 Reconciliation of Fiscal 2018 Constant-currency Total Segment Operating Profit Growth (FISCAL YEAR) 2018 Percentage Change in Total Segment Operating Profit as Reported Percentage Change in Impact of Total Segment Foreign Currency Operating Profit on a Exchange Constant-currency Basis Q2 (7) % 1 pt (8) % 1H (11) % 1 pt (12) % Certain measures in this release are presented excluding the impact of foreign currency exchange (constant-currency). To present this information, current period results for entities reporting in currencies other than United States dollars are translated into United States dollars at the average exchange rates in effect during the corresponding period of the prior fiscal year, rather than the actual average exchange rates in effect during the current fiscal year. Therefore, the foreign currency impact is equal to current year results in local currencies multiplied by the change in the average foreign currency exchange rate between the current fiscal period and the corresponding period of the prior fiscal year. 49
50 Reconciliation of Second Quarter Fiscal 2018 Adjusted Diluted EPS and Related Constant-currency Growth Rate (FISCAL YEARS) Per Share Data Change Diluted earnings per share, as reported $ 0.74 $ 0.80 (8) % Tax adjustment* Mark-to-market effects* - (0.03) Divestiture loss, net* Restructuring charges* Project-related costs* Diluted earnings per share, excluding certain items affecting comparability $ 0.82 $ 0.85 (4) % Foreign currency exchange impact 1 pt Diluted earnings per share growth, excluding certain items affecting comparability, on a constant-currency basis (5) % Q2 *See reconciliation of Tax Rate excluding items for tax impact of individual items. 50
51 Reconciliation of Second Quarter Fiscal 2018 Adjusted Gross Margin (FISCAL YEARS) Q % of Net Sales % of Net Sales Gross margin as reported 34.4 % 37.0 % Mark-to-market effects (0.1) (0.7) Restructuring charges Project-related costs Adjusted gross margin 34.4 % 36.8 % 51
52 Reconciliation of Second Quarter Fiscal 2018 Adjusted Operating Profit Margin (FISCAL YEARS) Q % of Net Sales % of Net Sales Operating profit margin as reported 17.4 % 18.7 % Mark-to-market effects (0.1) (0.7) Restructuring charges Project-related costs Divestiture loss Adjusted operating profit margin 17.4 % 19.6 % 52
53 Reconciliation of Fiscal 2017 Adjusted Operating Profit Margin (FISCAL YEAR) 2017 % of Net Sales Operating profit margin as reported 16.4 % Mark-to-market effects (0.1) Divestiture (gain) loss, net 0.1 Restructuring costs 1.4 Project-related costs 0.3 Adjusted operating profit margin 18.1 % 53
54 Reconciliation of First Quarter Fiscal 2018 Adjusted Operating Profit Margin (FISCAL YEARS) Q % of Net Sales Operating profit margin as reported 16.6 % Mark-to-market effects - Restructuring charges 0.5 Project-related costs - Adjusted operating profit margin 17.1 % 54
55 Reconciliation of Second Quarter Fiscal 2018 Constant-currency After-tax JV Earnings (FISCAL YEAR) Q2 Percentage Change in After-tax Earnings from Joint Ventures as Reported Impact of Foreign Currency Exchange Percentage Change in Aftertax Earnings from Joint Ventures on a Constantcurrency Basis 2018 (20) % (1) pt (19) % 55
56 Reconciliation of Second Quarter Fiscal 2017 Constant-currency After-tax JV Earnings (FISCAL YEAR) Q2 Percentage Change in After-tax Earnings from Joint Ventures as Reported Impact of Foreign Currency Exchange Percentage Change in Aftertax Earnings from Joint Ventures on a Constantcurrency Basis % 1 pt 27 % 56
57 Reconciliation of Second Quarter Fiscal 2018 Tax Rate Excluding Items (FISCAL YEARS, $ IN MILLIONS, EXCEPT PER SHARE DATA) Q Pretax Earnings* Income Taxes Pretax Earnings* Income Taxes As reported $654.9 $234.9 $693.4 $227.4 Mark-to-market effects (4.5) (1.6) (29.1) (10.7) Restructuring charges Project-related costs Divestiture loss Tax adjustment - (42.2) - - As adjusted $656.8 $192.6 $730.7 $236.5 Effective tax rate: As reported 35.9 % 32.8 % As adjusted 29.3 % 32.4 % Sum of adjustments to income taxes $(42.3) $9.1 Average number of common shares - diluted EPS Impact of income tax adjustments on diluted EPS excluding certain items affecting comparability $(0.07) $0.02 *Earnings before income taxes and after-tax earnings from joint ventures. 57
58 Reconciliation of First Half Fiscal 2018 Organic Net Sales Growth (FISCAL YEAR) Organic Volume Organic Price/Mix 1H 2018 Organic Net Sales Foreign Exchange Reported Net Sales Growth North America Retail (1) pt (1) pt (2) % - (2) % Convenience Stores & Foodservice 2 pts 1 pt 3 % - 3 % Europe & Australia - 2 pts 2 % 3 pts 5 % Asia & Latin America (12) pts 8 pts (4) % 1 pt (3) % Total (1) pt Flat (1) % - (1) % 58
59 Reconciliation of First Half Fiscal 2018 Total Segment Operating Profit (FISCAL YEARS, $ IN MILLIONS) 1H % Change North America Retail $1,156.1 $1,279.2 (10) % Convenience Stores & Foodservice (5) Europe & Australia (32) Asia & Latin America (37) Total Segment Operating Profit $1,437.1 $1,617.5 (11) % Unallocated Corporate Items (26) Divestiture loss NM Restructuring, impairment, and other exit costs (92) Operating Profit $1,355.6 $1,414.7 (4) % 59
60 Reconciliation of First Half Fiscal 2018 Adjusted Diluted EPS and Related Constant-currency Growth Rate (FISCAL YEARS) Per Share Data Change Diluted earnings per share, as reported $ 1.43 $ 1.47 (3) % Tax adjustment* Mark-to-market effects* - (0.01) Divestiture loss, net* Restructuring charges* Project-related costs* Diluted earnings per share, excluding certain items affecting comparability $ 1.53 $ 1.63 (6) % Foreign currency exchange impact 1 pt Diluted earnings per share growth, excluding certain items affecting comparability, on a constant-currency basis (7) % 1H *See reconciliation of Tax Rate excluding items for tax impact of individual items. 60
61 Reconciliation of Second Quarter Fiscal 2018 Constant-currency Operating Profit Growth by Segment (FISCAL YEAR) Q Percentage Change in Segment Operating Profit as Reported Impact of Percentage Change in Foreign Currency Segment Operating Profit on Exchange a Constant-currency Basis North America Retail (4) % 1 pt (5) % Europe & Australia (35) % 5 pts (40) % Asia & Latin America (42) % 4 pts (46) % 61
62 Reconciliation of Fiscal 2018 Canada Operating Unit Constant-currency Net Sales Growth (FISCAL YEAR) Percentage Change in Canada Net Sales as Reported Impact of Foreign Currency Exchange Percentage Change in Canada Net Sales on a Constant-currency Basis 2018 Q2 7 % 6 pts 1 % H 3 % 4 pts (1) % 62
GENERAL MILLS. Fiscal 2018 First Quarter Results. September 20, 2017
 GENERAL MILLS Fiscal 2018 First Quarter Results September 20, 2017 Don Mulligan EVP, Chief Financial Officer A Reminder on Forward-looking Statements This presentation contains forward-looking statements
GENERAL MILLS. Fiscal 2018 Third Quarter Results. March 21, 2018
 GENERAL MILLS Fiscal 2018 Third Quarter Results March 21, 2018 A Reminder on Forward-looking Statements This presentation contains forward-looking statements within the meaning of the Private Securities
GENERAL MILLS FISCAL 2019 FIRST-QUARTER EARNINGS SEPTEMBER 18, 2018
 GENERAL MILLS FISCAL 2019 FIRST-QUARTER EARNINGS SEPTEMBER 18, 2018 A Reminder on Forward-looking Statements This presentation contains forward-looking statements within the meaning of the Private Securities
GENERAL MILLS. Fiscal 2018 Fourth Quarter and Full-year Results. June 27, 2018
 GENERAL MILLS Fiscal 2018 Fourth Quarter and Full-year Results June 27, 2018 A Reminder on Forward-looking Statements This presentation contains forward-looking statements within the meaning of the Private
GENERAL MILLS FISCAL 2019 THIRD-QUARTER EARNINGS MARCH 20, 2019
 GENERAL MILLS FISCAL 2019 THIRD-QUARTER EARNINGS MARCH 20, 2019 1 A Reminder on Forward-looking Statements This presentation contains forward-looking statements within the meaning of the Private Securities
GENERAL MILLS FISCAL 2019 SECOND-QUARTER EARNINGS DECEMBER 19, 2018
 GENERAL MILLS FISCAL 2019 SECOND-QUARTER EARNINGS DECEMBER 19, 2018 1 A Reminder on Forward-looking Statements This presentation contains forward-looking statements within the meaning of the Private Securities
General Mills. Fiscal 2016 First Quarter Results
 General Mills Fiscal 2016 First Quarter Results A Reminder on Forward-looking Statements This presentation contains forward-looking statements within the meaning of the Private Securities Litigation Reform
GENERAL MILLS REPORTS FISCAL 2018 SECOND-QUARTER RESULTS
 News/Information Investor Relations P. O. Box 1113 Minneapolis, MN 55440 FOR IMMEDIATE RELEASE December 20, Contact: (analysts) Jeff Siemon: 763-764-2301 (media) Bridget Christenson: 763-764-6364 GENERAL
A Reminder on Forward-looking Statements
 A Reminder on Forward-looking Statements This presentation contains forward-looking statements within the meaning of the Private Securities Litigation Reform Act of 1995 that are based on management s
General Mills. Fiscal rd Quarter Results. March 19,
 General Mills Fiscal 2014 3 rd Quarter Results March 19, 2014 6582-1 This presentation contains forward-looking statements within the meaning of the Private Securities Litigation Reform Act of 1995 that
GENERAL MILLS REPORTS FISCAL 2019 FIRST-QUARTER RESULTS
 News/Information Investor Relations P. O. Box 1113 Minneapolis, MN 55440 FOR IMMEDIATE RELEASE September 18, 2018 Contact: (analysts) Jeff Siemon: 763-764-2301 (media) Kelsey Roemhildt: 763-764-6364 GENERAL
GENERAL MILLS REPORTS FISCAL 2019 SECOND-QUARTER RESULTS AND REAFFIRMS FULL-YEAR GUIDANCE
 FOR IMMEDIATE RELEASE December 19, Contact: (analysts) Jeff Siemon: 763-764-2301 (media) Kelsey Roemhildt: 763-764-6364 GENERAL MILLS REPORTS FISCAL 2019 SECOND-QUARTER RESULTS AND REAFFIRMS FULL-YEAR
GENERAL MILLS REPORTS STRONG FISCAL 2019 THIRD-QUARTER RESULTS AND UPDATES FULL-YEAR GUIDANCE
 News/Information FOR IMMEDIATE RELEASE Investor Relations P. O. Box 1113 Minneapolis, MN 55440 March 20, Contact: (analysts) Jeff Siemon: 763-764-2301 (media) Rob Litt: 763-764-6364 GENERAL MILLS REPORTS
GENERAL MILLS REPORTS FOURTH-QUARTER AND FULL-YEAR FISCAL 2018 RESULTS; PROVIDES 2019 OUTLOOK
 News/Information Investor Relations P. O. Box 1113 Minneapolis, MN 55440 FOR IMMEDIATE RELEASE June 27, 2018 Contact: (analysts) Jeff Siemon: 763-764-2301 (media) Bridget Christenson: 763-764-6364 GENERAL
Bethany Quam. SVP; Group President, Europe & Australia
 Bethany Quam SVP; Group President, Europe & Australia Europe & Australia Segment F17 Net Sales: $1.8 Billion Yogurt Ice Cream F17 Segment Operating Profit: $164 Million Mexican Snacks Focused on 4 of 5
fourth quarter. Earnings contributed by the extra week totaled approximately $0.04 per diluted share. U.S. Retail Segment Results
 General Mills Reports Fourth Quarter And Full Year Fiscal Results Fiscal 2016 Plans Include Increased Levels of Core Brand Renovation, Strong New Product Innovation, and Continued Progress on Cost Savings
General Mills Achieves Record-Level Results in Fiscal 2010 Company Sees Continuing Growth in Fiscal 2011
 General Mills Achieves Record-Level Results in Fiscal 2010 Company Sees Continuing Growth in Fiscal 2011 MINNEAPOLIS, Jun 29, 2010 (BUSINESS WIRE) -- General Mills (NYSE: GIS) today reported strong results
Excluding certain items affecting comparability, earnings per share grew 23 percent to $0.97, exceeding the consensus of analyst estimates.
 General Mills Reports Strong Results for Fiscal 2010 Third Quarter Company Raises Full-year EPS Guidance MINNEAPOLIS, Mar 24, 2010 (BUSINESS WIRE) -- General Mills (NYSE: GIS) today reported financial
General Mills Reports Fourth Quarter And Full Year Fiscal 2015 Results
 General Mills Reports Fourth Quarter And Full Year Fiscal 2015 Results Fiscal 2016 Plans Include Increased Levels of Core Brand Renovation, Strong New Product Innovation, and Continued Progress on Cost
CAGNY 2019 FEBRUARY 19, 2019
 CAGNY 2019 FEBRUARY 19, 2019 A Reminder on Forward-looking Statements This presentation contains forward-looking statements within the meaning of the Private Securities Litigation Reform Act of 1995 that
Nov. 23, Nov. 24, 2013 % Change. Nov. 23, 2014
 Consolidated Statements of Earnings and Supplementary Information GENERAL MILLS, INC. AND SUBSIDIARIES (Unaudited) (In Millions, Except per Share Data) % Change % Change Net sales $ 4,712.2 $ 4,875.7 (3.4)%
Global Growth and Returns GENERAL MILLS 01 ANNUAL REPORT
 Global Growth and Returns GENERAL MILLS 01 ANNUAL REPORT GLOBAL GROWTH AND RETURNS At General Mills, we serve the world by making food people love. Our goal is to create market-leading growth to deliver
Third Quarter 2010 Earnings
 Kellogg Company Third Quarter 2010 Earnings Forward-Looking Statements This presentation contains, or incorporates by reference, forward-looking statements with projections concerning, among other things,
Putting the Consumer First 86th Annual Shareholders Meeting September 23, 2014
 7459-1 A Reminder on Forward-looking Statements This presentation contains forward-looking statements within the meaning of the Private Securities Litigation Reform Act of 1995 that are based on management
Kellogg Company FOURTH QUARTER 2017 FINANCIAL RESULTS February 8, 2018
 Kellogg Company FOURTH QUARTER 2017 FINANCIAL RESULTS February 8, 2018 Forward-Looking Statements This presentation contains, or incorporates by reference, forward-looking statements with projections concerning,
Kellogg Company February 21, Boca Raton February 21, 2018
 Boca Raton February 21, 2018 Deploy For Growth Forward-Looking Statements This presentation contains, or incorporates by reference, forward-looking statements with projections concerning, among other things,
2016 FIRST QUARTER FINANCIAL RESULTS
 Kellogg Company Kellogg Company 2016 FIRST QUARTER FINANCIAL RESULTS Forward Looking Statements This presentation contains, or incorporates by reference, forward looking statements with projections concerning,
Kellogg Company THIRD QUARTER 2017 FINANCIAL RESULTS October 31, 2017
 Kellogg Company THIRD QUARTER 2017 FINANCIAL RESULTS October 31, 2017 Forward-Looking Statements This presentation contains, or incorporates by reference, forward-looking statements with projections concerning,
FY18 Q3 Earnings Presentation
 FY18 Q3 Earnings Presentation March 22, 2018 Today s Presenters Brian Kearney Investor Relations Sean Connolly President and Chief Executive Officer Dave Marberger Chief Financial Officer 2 Forward-Looking
Mondelēz International Q Results. July 27, 2016
 Mondelēz International Q2 2016 Results July 27, 2016 1 Forward-Looking Statements This presentation contains a number of forward-looking statements. Words, and variations of words, such as will, expect,
FORM 10 Q. GENERAL MILLS INC gis. Filed: March 30, 2007 (period: February 25, 2007)
") FORM 10 Q GENERAL MILLS INC gis Filed: March 30, 2007 (period: February 25, 2007) Quarterly report which provides a continuing view of a company's financial position Table of Contents Part I. FINANCIAL
FORM 10 Q GENERAL MILLS INC gis Filed: March 30, 2007 (period: February 25, 2007) Quarterly report which provides a continuing view of a company's financial position Table of Contents Part I. FINANCIAL
The J. M. Smucker Company
 The J. M. Smucker Company Fourth Quarter Fiscal 2018 Earnings SUPPLEMENTARY INFORMATION June 7, 2018 Consolidated Results ($ in millions, except per share data) FY18 Q4 FY17 Q4 YoY Change Net Sales $1,781
Kellogg Company 2016 THIRD QUARTER FINANCIAL RESULTS November 1, 2016
 Kellogg Company 2016 THIRD QUARTER FINANCIAL RESULTS Agenda Overview Financials North America Europe Latin America Asia Pacific Summary John Bryant, Chairman & Chief Executive Officer Ron Dissinger, Chief
WHITEWAVE FOODS REPORTS RECORD THIRD QUARTER 2015 RESULTS REPORTS FIRST $1 BILLION NET SALES QUARTER INCREASES GROWTH & EARNINGS EXPECTATIONS FOR 2015
 WHITEWAVE FOODS REPORTS RECORD THIRD QUARTER 2015 RESULTS REPORTS FIRST $1 BILLION NET SALES QUARTER INCREASES GROWTH & EARNINGS EXPECTATIONS FOR 2015 Total Net Sales Increased 17%; Adjusted Constant Currency
McCormick & Company, Inc. 2nd Quarter 2017 Financial Results and Outlook June 29, 2017
 McCormick & Company, Inc. 2nd Quarter 2017 Financial Results and Outlook June 29, 2017 1 The following slides accompany a June 29, 2017 presentation to investment analysts. This information should be read
FOURTH QUARTER 2017 EARNINGS PRESENTATION FEBRUARY 8, 2018
 FOURTH QUARTER 2017 EARNINGS PRESENTATION FEBRUARY 8, 2018 REGARDING FORWARD-LOOKING STATEMENTS Statements contained in this press release that are not historical facts are forward-looking statements.
Fourth Quarter & Full-Year Fiscal 2018 Results. Strategy & Portfolio Review
 Fourth Quarter & Full-Year Fiscal 2018 Results Strategy & Portfolio Review 1 Forward-Looking Statements The factors that could cause actual results to vary materially from those anticipated or expressed
Fourth-Quarter Sales Increased 7 Percent; Organic Sales Decreased 2 Percent
 Print Page Close Window Campbell Reports Fourth-Quarter and Full-Year Results Fourth-Quarter Sales Increased 7 Percent; Organic Sales Decreased 2 Percent Fourth-Quarter Adjusted EPS from Continuing Operations
Kellogg Company SECOND QUARTER 2017 FINANCIAL RESULTS August 3, 2017
 Kellogg Company SECOND QUARTER 2017 FINANCIAL RESULTS August 3, 2017 Forward-Looking Statements This presentation contains, or incorporates by reference, forward-looking statements with projections concerning,
WHITEWAVE FOODS REPORTS RECORD FIRST QUARTER 2015 RESULTS AND INCREASES GROWTH & EARNINGS EXPECTATIONS FOR 2015
 WHITEWAVE FOODS REPORTS RECORD FIRST QUARTER 2015 RESULTS AND INCREASES GROWTH & EARNINGS EXPECTATIONS FOR 2015 Total Net Sales Increased 10%; Constant Currency Net Sales Increased 13% Adjusted Total Operating
Q Results. October 29, 2018
 Q3 2018 Results October 29, 2018 Forwardlooking Statements This presentation contains a number of forwardlooking statements. Words, and variations of words, such as will, expect, may, should, believe,
UNITED STATES SECURITIES AND EXCHANGE COMMISSION Washington, D.C FORM 10-Q
 UNITED STATES SECURITIES AND EXCHANGE COMMISSION Washington, D.C. 20549 FORM 10-Q (Mark One) QUARTERLY REPORT PURSUANT TO SECTION 13 OR 15(d) OF THE SECURITIES EXCHANGE ACT OF 1934 FOR THE QUARTERLY PERIOD
Q Results July 25, 2018
 Q2 2018 Results July 25, 2018 1 Forwardlooking statements This presentation contains a number of forwardlooking statements. Words, and variations of words, such as will, expect, believe, estimate, deliver,
FLOWERS FOODS, INC. REPORTS FOURTH QUARTER AND FULL YEAR 2017 RESULTS
 FLOWERS FOODS, INC REPORTS FOURTH QUARTER AND FULL YEAR 2017 RESULTS February 07, 2018 THOMASVILLE, Ga, Feb 7, 2018 /PRNewswire/ -- Flowers Foods, Inc (NYSE: FLO), producer of Nature's Own, Wonder, Tastykake,
WHITEWAVE FOODS REPORTS RECORD FOURTH QUARTER AND FULL YEAR 2014 RESULTS CONTINUED STRONG GROWTH EXPECTATIONS FOR 2015
 WHITEWAVE FOODS REPORTS RECORD FOURTH QUARTER AND FULL YEAR 2014 RESULTS CONTINUED STRONG GROWTH EXPECTATIONS FOR 2015 Net Sales Increased 34% in Q4 and 35% in FY 2014 Organic Net Sales Increased 11% in
McCormick & Company, Inc. 1 st Quarter 2018 Financial Results and Outlook
 McCormick & Company, Inc. 1 st Quarter 2018 Financial Results and Outlook March 27, 2018 The following slides accompany a March 27, 2018, earnings release conference call. This information should be read
THE J. M. SMUCKER COMPANY
 Richard Smucker Chief Executive Officer THE J. M. SMUCKER TEAM RICHARD SMUCKER Chief Executive Officer MARK SMUCKER President, U.S. Retail Coffee PAUL SMUCKER WAGSTAFF President, U.S. Retail Consumer Foods
FOURTH QUARTER 2018 REVIEW FEBRUARY 7, 2019
 FOURTH QUARTER 2018 REVIEW FEBRUARY 7, 2019 REGARDING FORWARD LOOKING STATEMENTS Statements contained in this press release that are not historical facts are forward looking statements. Forward looking
Avery Dennison Jefferies Industrials Conference
 Avery Dennison Jefferies Industrials Conference August 9, 2016 Anne Bramman SVP and Chief Financial Officer 1 Avery Dennison Investor Presentation Forward-Looking Statements Certain statements contained
Full-Year & Q Results. January 31, 2018
 Full-Year & Q4 2017 Results January 31, 2018 Forward-looking statements This presentation contains a number of forward-looking statements. Words, and variations of words, such as will, expect, could, likely,
Q Results May 1, 2018
 Q1 2018 Results May 1, 2018 1 Forward-looking statements This presentation contains a number of forward-looking statements. Words, and variations of words, such as will, expect, should, plan, believe,
McCormick & Company, Inc. 3rd Quarter 2017 Financial Results and Outlook September 28, 2017
 McCormick & Company, Inc. 3rd Quarter 2017 Financial Results and Outlook September 28, 2017 1 The following slides accompany a September 28, 2017 earnings release conference call. This information should
CAMPBELL REPORTS FIRST-QUARTER RESULTS
 FOR IMMEDIATE RELEASE INVESTOR CONTACT: MEDIA CONTACT: Ken Gosnell Thomas Hushen (856) 342-6081 (856) 342-5227 ken_gosnell@campbellsoup.com thomas_hushen@campbellsoup.com CAMPBELL REPORTS FIRST-QUARTER
Second Quarter 2018 Financial Review and Analysis (preliminary, unaudited)
") Second Quarter 2018 Financial Review and Analysis (preliminary, unaudited) Supplemental Presentation Materials Unless otherwise indicated, comparisons are to the same period in the prior year. 1 Second
Second Quarter 2018 Financial Review and Analysis (preliminary, unaudited) Supplemental Presentation Materials Unless otherwise indicated, comparisons are to the same period in the prior year. 1 Second
GENERAL MILLS INC ( GIS ) 10 Q Quarterly report pursuant to sections 13 or 15(d) Filed on 9/22/2010 Filed Period 8/29/2010
 10 Q Quarterly report pursuant to sections 13 or 15(d) Filed on 9/22/2010 Filed Period 8/29/2010") GENERAL MILLS INC ( GIS ) 10 Q Quarterly report pursuant to sections 13 or 15(d) Filed on 9/22/2010 Filed Period 8/29/2010 Table of Contents (Mark One) UNITED STATES SECURITIES AND EXCHANGE COMMISSION
GENERAL MILLS INC ( GIS ) 10 Q Quarterly report pursuant to sections 13 or 15(d) Filed on 9/22/2010 Filed Period 8/29/2010 Table of Contents (Mark One) UNITED STATES SECURITIES AND EXCHANGE COMMISSION
Q4 & FY 2018 Results. January 30, 2019
 Q4 & FY 2018 Results January 30, 2019 This presentation contains a number of forwardlooking statements. Words, and variations of words, such as will, expect, may, believe, estimate, deliver, potential,
UNITED STATES SECURITIES AND EXCHANGE COMMISSION Washington, D.C FORM 10-Q
 UNITED STATES SECURITIES AND EXCHANGE COMMISSION Washington, D.C. 20549 FORM 10-Q (Mark One) QUARTERLY REPORT PURSUANT TO SECTION 13 OR 15(d) OF THE SECURITIES EXCHANGE ACT OF 1934 FOR THE QUARTERLY PERIOD
Best Buy Reports Third Quarter Results
 Best Buy Reports Third Quarter Results Enterprise Comparable Sales Increased 4.4% Diluted EPS of $0.78 Increased 30% Raising FY18 Financial Outlook MINNEAPOLIS, November 16, -- Best Buy Co., Inc. (NYSE:
First Quarter 2018 Financial Review and Analysis (preliminary, unaudited)
") First Quarter 2018 Financial Review and Analysis (preliminary, unaudited) Supplemental Presentation Materials Unless otherwise indicated, comparisons are to the same period in the prior year. 1 First Quarter
First Quarter 2018 Financial Review and Analysis (preliminary, unaudited) Supplemental Presentation Materials Unless otherwise indicated, comparisons are to the same period in the prior year. 1 First Quarter
The J.M. Smucker Company
 The J.M. Smucker Company CONSUMER ANALYST GROUP OF NEW YORK CONFERENCE February 21, 2018 Strategy and Business Update Mark Smucker President and Chief Executive Officer Financial Update Mark Belgya Vice
MEAD JOHNSON NUTRITION REPORTS FIRST QUARTER 2017 RESULTS
 MEAD JOHNSON NUTRITION REPORTS FIRST QUARTER 2017 RESULTS CHICAGO, Ill., April 27, 2017 - Mead Johnson Nutrition Company (NYSE: MJN) today announced its financial results for the quarter ended March 31,
CHIEF EXECUTIVE OFFICER REMARKS
 Announces Fiscal 2016 Third Quarter Results ORRVILLE, Ohio, February 23, 2016 -- (NYSE: SJM) today announced results for the third quarter ended January 31, 2016, of its 2016 fiscal year. All comparisons
Supplemental Information
 Supplemental Information 2 nd Quarter Fiscal 2018 May 7, 2018 Today s Speakers Tom Hayes President & CEO Stewart Glendinning EVP & CFO 2 Forward-Looking Statements Certain information contained in this
PepsiCo Second Quarter 2012 Earnings Call July 25, 2012
 PepsiCo Second Quarter 2012 Earnings Call July 25, 2012 Indra Nooyi Chairman and Chief Executive Officer Hugh Johnston Chief Financial Officer Safe Harbor Statement of Terms & Non-GAAP Information Note:
Q Update. May 3, 2017
 Q1 2017 Update May 3, 2017 Safe Harbor Statement This webcast presentation contains a number of forward-looking statements. Words such as build, gain, drive, invest, grow, execute, enable, continue, expect,
(GIS-NYSE) SUMMARY. Risk Level *
 SUMMARY. Risk Level *") January 23, 2015 General Mills Inc. Current Recommendation SUMMARY DATA NEUTRAL Prior Recommendation Outperform Date of Last Change 07/14/2005 Current Price (01/22/15) $54.78 Target Price $58.00 52-Week
January 23, 2015 General Mills Inc. Current Recommendation SUMMARY DATA NEUTRAL Prior Recommendation Outperform Date of Last Change 07/14/2005 Current Price (01/22/15) $54.78 Target Price $58.00 52-Week
Fourth Quarter and Full Year 2018 Financial Review and Analysis
 Fourth Quarter and Full Year 2018 Financial Review and Analysis (preliminary, unaudited) Supplemental Presentation Materials Unless otherwise indicated, comparisons are to the same periods in the prior
Forward Looking Statement
 Forward Looking Statement This presentation contains, or incorporates by reference, forward looking statements with projections concerning, among other things, the Company s global growth and efficiency
2017 THIRD-QUARTER EARNINGS REVIEW October 24, 2017
 2017 THIRD-QUARTER EARNINGS REVIEW October 24, 2017 CAUTIONARY STATEMENT This presentation contains forward-looking statements about Whirlpool Corporation and its consolidated subsidiaries ( Whirlpool
EMC CORPORATION Consolidated Income Statements (in thousands, except per share amounts) Unaudited
 Unaudited") EMC CORPORATION Consolidated Income Statements (in thousands, except per share amounts) Six Months Ended June 30, June 30, June 30, June 30, 2012 2011 2012 2011 Revenues: Product sales $ 3,178,737 $ 3,043,984
EMC CORPORATION Consolidated Income Statements (in thousands, except per share amounts) Six Months Ended June 30, June 30, June 30, June 30, 2012 2011 2012 2011 Revenues: Product sales $ 3,178,737 $ 3,043,984
CHIEF EXECUTIVE OFFICER REMARKS
 Announces Fiscal 2018 Second Quarter Results ORRVILLE, Ohio, November 16, 2017 -- The J. M. Smucker Company (NYSE: SJM) today announced results for the second quarter ended October 31, 2017, of its 2018
FOURTH-QUARTER 2017 EARNINGS REVIEW January 25, 2018
 FOURTH-QUARTER 2017 EARNINGS REVIEW January 25, 2018 GLOBAL OVERVIEW INSERT PHOTO HERE Marc Bitzer Chief Executive Officer 2 2017 FOURTH-QUARTER HIGHLIGHTS Ongoing EPS of $4.10 in Q4 and $13.74 for the
Earnings Release. Q Results October 20, 2017
 Earnings Release Q1 2018 Results October 20, 2017 1 Business Results Q1 FY 2018 2 First Quarter 2018 Organic Sales Growth Organic Volume Growth Core EPS Growth Free Cash Flow Productivity Q1 18 +1% +1%
CHIEF EXECUTIVE OFFICER REMARKS
 Announces Fiscal 2019 Third Quarter Results ORRVILLE, Ohio, February 26, 2019 -- (NYSE: SJM) today announced results for the third quarter ended January 31, 2019, of its 2019 fiscal year. Financial results
McCORMICK REPORTS DOUBLE DIGIT THIRD QUARTER SALES AND PROFIT GROWTH AND INCREASES 2018 EARNINGS PER SHARE OUTLOOK
 FOR IMMEDIATE RELEASE McCORMICK REPORTS DOUBLE DIGIT THIRD QUARTER SALES AND PROFIT GROWTH AND INCREASES 2018 EARNINGS PER SHARE OUTLOOK HUNT VALLEY, Md., September 27, 2018 - McCormick & Company, Incorporated
UNITED STATES SECURITIES AND EXCHANGE COMMISSION Washington, D.C FORM 10-Q
 UNITED STATES SECURITIES AND EXCHANGE COMMISSION Washington, D.C. 20549 FORM 10-Q (Mark One) QUARTERLY REPORT PURSUANT TO SECTION 13 OR 15(d) OF THE SECURITIES EXCHANGE ACT OF 1934 FOR THE QUARTERLY PERIOD
EMC CORPORATION Consolidated Income Statements (in millions, except per share amounts) (unaudited)
 (unaudited)") EMC CORPORATION Consolidated Income Statements (in millions, except per share amounts) Three Months Ended March 31, March 31, 2016 2015 Revenues: Product sales $ 2,682 $ 2,905 Services 2,793 2,708 5,475
EMC CORPORATION Consolidated Income Statements (in millions, except per share amounts) Three Months Ended March 31, March 31, 2016 2015 Revenues: Product sales $ 2,682 $ 2,905 Services 2,793 2,708 5,475
Best Buy Reports Better-than-Expected Second Quarter Results
 Best Buy Reports Better-than-Expected Second Quarter Results Enterprise Comparable Sales Increased 6.2% GAAP Diluted EPS Increased 28% to $0.86 Non-GAAP Diluted EPS Increased 32% to $0.91 Raising FY19
SYSCO REPORTS FIRST QUARTER FISCAL 2018 RESULTS
 For more information contact: Sysco Corporation 1390 Enclave Parkway Neil Russell Camilla Zuckero Houston, TX 77077 Investor Contact Media Contact T 281-584-1308 T 281-899-1839 SYSCO REPORTS FIRST QUARTER
McCormick - A taste for the future. Wachovia Consumer Growth Conference October 15, 2008
 McCormick - A taste for the future Wachovia Consumer Growth Conference October 15, 2008 Forward-Looking Information Certain information contained in these materials and our remarks, including expected
GENERAL MILLS, INC. (Exact name of registrant as specified in its charter)
") UNITED STATES SECURITIES AND EXCHANGE COMMISSION Washington, D.C. 20549 FORM 10-Q (Mark One) QUARTERLY REPORT PURSUANT TO SECTION 13 OR 15(d) OF THE SECURITIES EXCHANGE ACT OF 1934 FOR THE QUARTERLY PERIOD
UNITED STATES SECURITIES AND EXCHANGE COMMISSION Washington, D.C. 20549 FORM 10-Q (Mark One) QUARTERLY REPORT PURSUANT TO SECTION 13 OR 15(d) OF THE SECURITIES EXCHANGE ACT OF 1934 FOR THE QUARTERLY PERIOD
Mondelēz International Reports Q1 Results
 Contacts: Michael Mitchell (Media) Shep Dunlap (Investors) +1-847-943-5678 +1-847-943-5454 news@mdlz.com ir@mdlz.com Mondelēz Reports Q1 Results Net revenues increased 5.5%; Organic Net Revenue 1 grew
Kellogg Company Reports Fourth Quarter 2017 Results and Issues 2018 Guidance
 Exhibit 99.1 Kellogg Company Financial News Release Analyst Contact: John Renwick, CFA (269) 961-9050 Media Contact: Kris Charles, (269) 961-3799 Kellogg Company Reports Fourth Quarter 2017 Results and
Best Buy Reports Better-than-Expected Fourth Quarter Earnings
 Best Buy Reports Better-than-Expected Fourth Quarter Earnings GAAP Diluted EPS Increased 37% to $1.91 Non-GAAP Diluted EPS Increased 27% to $1.95 Full Year GAAP and Non-GAAP Diluted EPS Increased 63% and
4th Quarter 2018 Earnings. Investor Presentation February 27, 2019
 4th Quarter 2018 Earnings Investor Presentation February 27, 2019 DISCLAIMER Forward Looking Statements This investor presentation contains statements reflecting our views about the future performance
PepsiCo Reports First Quarter 2018 Results; Reaffirms 2018 Financial Targets
 PepsiCo Reports First Quarter 2018 Results; Reaffirms 2018 Financial Targets Reported (GAAP) First Quarter 2018 Results First Quarter Net revenue growth 4.3% Foreign exchange impact on net revenue 2% EPS
McCormick & Company, Inc. 2 nd Quarter 2018 Financial Results and Outlook
 McCormick & Company, Inc. 2 nd Quarter 2018 Financial Results and Outlook June 28, 2018 The following slides accompany a June 28, 2018, earnings release conference call. This information should be read
The J. M. Smucker Company Announces Fiscal 2018 Fourth Quarter Results and Fiscal 2019 Outlook
 Announces Fiscal 2018 Fourth Quarter Results and Fiscal 2019 Outlook ORRVILLE, Ohio, June 7, 2018 -- (NYSE: SJM) today announced results for the fourth quarter ended April 30, 2018, of its 2018 fiscal
Zebra Technologies Third-Quarter 2018 Results. November 6, 2018
 Zebra Technologies Third-Quarter 2018 Results November 6, 2018 1 Safe Harbor Statement Statements made in this presentation which are not statements of historical fact are forward-looking statements and
Supplemental Information
 Supplemental Information 1st Quarter Fiscal 2018 February 8, 2018 Dennis Leatherby Tom Hayes Stewart Glendinning 2 Forward-Looking Statements Certain information contained in this presentation may constitute
Q2 Fiscal 2017 Earnings Commentary
 Q2 Fiscal 2017 Earnings Commentary August 31, 2017 The financial measures discussed below include both GAAP and adjusted non-gaap financial measures. In connection with the restructuring of its ivivva
AVERY DENNISON ANNOUNCES SECOND QUARTER 2018 RESULTS
 For Immediate Release AVERY DENNISON ANNOUNCES SECOND QUARTER 2018 RESULTS 2Q18 Reported EPS of $1.07 Adjusted EPS (non-gaap) of $1.66 2Q18 Net sales increased 14.0% to $1.85 billion Sales change ex. currency
Supplemental Information
 Supplemental Information 3 rd Quarter Fiscal 2018 August 6, 2018 Today s Speakers Tom Hayes President & CEO Stewart Glendinning EVP & CFO 2 Forward-Looking Statements Certain information contained in this
Investment Community Conference Call
 DieboldNixdorf.com Investment Community Conference Call Second Quarter, 2018 Earnings August 1, 2018 Use of Non-GAAP Financial Information To supplement our condensed consolidated financial statements
McCormick & Company, Inc.
 McCormick & Company, Inc. Bernstein Strategic Decisions Conference May 30, 2018 FORWARD-LOOKING INFORMATION Certain information contained in this release, including statements concerning expected performance
Sealed Air Reports Fourth Quarter and Full Year 2018 Results
 Exhibit 99.1 Sealed Air Corporation 2415 Cascade Pointe Blvd. Charlotte, NC 28208 For release: February 7, 2019 Sealed Air Reports Fourth Quarter and Full Year 2018 Results Solid year-over-year sales and
Second-Quarter Earnings Review
 Second-Quarter 2018 Earnings Review GLOBAL OVERVIEW Marc Bitzer President and Chief Executive Officer 2 2018 SECOND-QUARTER HIGHLIGHTS Ongoing EBIT margin expansion despite challenging cost environment
McCormick & Company, Inc. Fourth quarter 2010 financial results and business outlook January 26, 2011
 McCormick & Company, Inc. Fourth quarter 2010 financial results and business outlook January 26, 2011 The following slides accompany a January 26, 2011 presentation to investment analysts. This information
McCormick & Company, Inc.
 McCormick & Company, Inc. Fourth Quarter 2008 Financial Results and Business Outlook The following slides accompany a January 28, 2009 presentation to investment analysts 1 Forward-looking information
23/05/2018 The TJX Companies, Inc. Reports Above-Plan Q1 FY19 Comp Sales Growth of 3% and Exceeds EPS Expectations; Updates Full-
 154.126.80.126 The TJX Companies, Inc. Reports Above-Plan Q1 FY19 Comp Sales Growth of 3% and Exceeds EPS Expectations; Updates Full-Year Guidance to Reflect Strong Q1 Results Net sales increased 12% to