A LEADING PRODUCER OF NATURAL SODA ASH
|
|
|
- Loren Boyd
- 6 years ago
- Views:
Transcription

1 A LEADING PRODUCER OF NATURAL SODA ASH OCI RESOURCES LP INVESTOR PRESENTATION AUGUST 2014 OCI Resources LP 1


2 ORGANIZATIONAL OVERVIEW
3 Organizational Structure OCI Enterprises Inc. 100% OCI Chemical Corporation OCI Company (Korea) - Strong sponsor commitment from $4+ bn market cap company - Since 1996, OCI has invested more than $400 mn in maintenance, efficiency, and expansion capital expenditures increasing production to 2.5 mn short tons Natural Resource Partners L.P. 100% 100% OCI Wyoming Holding Co. (Common and Subordinated units) 100% NRP Trona LLC Public Unitholders (Common units) OCI Resource Partners LLC (General partner) 25.1% L.P. Interest 72.9% L.P. Interest 2% G.P. Interest IDRs OCI Resources LP ( OCI Resources ) 51% Member Interest OCI Wyoming LLC 49% Member Interest ( OCI Wyoming ) OCI Resources LP 3
4 INVESTMENT HIGHLIGHTS
 Hou 25% Other Synthetic 5% Natural 25%")


5 Attractive Industry Structure Limited Natural Capacity Globally (Production Method, by Percentage of Volume) Well-Structured Industry (North America Soda Ash Market Share by Capacity) Hou 25% Other Synthetic 5% Natural 25% Searles 10% Alcali 2% OCI 19% Total Global Capacity: 73.5 mn ST Tata 20% Total North American Capacity: 14 mn ST Synthetic Production Capacity Solvay 45% Solvay 19% FMC 30% US soda ash producers using Trona have significant cost advantages (1/3 to 1/2 of competing processes) from lower energy costs and raw material price exposures year reserve life - Lowest ore-to-ash ratio - Closest to surface minerals - Highest production per employee - Best safety record Source: IHS OCI Resources LP 5
6 Stable End-Markets with Broad Geographic Exposure Global Soda Ash Consumption by End Market (By Volume) U.S. Soda Ash Domestic / Export Split (By Percentage of Volume) Other 19% Flat 26% Glass Products Metals & Mining 6% Total Global Demand: 59 mn ST 58% 56% 54% 52% 53% 49% 49% 45% 43% Chemicals 9% 42% 44% 46% 48% 47% 51% 51% 55% 57% Soaps & Detergents 14% Other 6% Container 20% Exports Domestic Global market demand expected to grow at ~5% from E Source: IHS Source: IHS, U.S. Geological Survey. OCI Resources LP 6
7 Stable Customer Relationships Approximately 70% of OCI s domestic sales were made to customers with which OCI has had relationships in excess of 10 years. Sales Breakdown by Revenue ($ in millions) $363.1 $421.9 $462.6 $442.1 Majority export sales via ANSAC Domestic Customers Most domestic customer contracts range from 1-3 years Domestic contracts are typically renewed upon expiration 10+ year relationship with 70% of domestic customers 44% $ % $ % $ % $247.1 Export Customers 56% 43% 48% 44% $205.3 $203.3 $199.4 $195.1 Majority of export sales sold through American Natural Soda Ash Corp. (ANSAC) International sales, marketing and logistics for OCI and two other leading U.S. producers Domestic Export Incremental increases in production volume have been exported due to growing international demand Conducive to stability and growth of U.S. producers Leverages economies of scale (logistics) Operates under an exemption from the antitrust laws allowing it to be the exclusive export outlet OCI Resources LP 7


8 Organic and Acquisition Growth Opportunities OCI will capitalize on organic expansion & make accretive acquisitions to drive growth. Capitalize on organic expansion opportunities Emerging Market Growth Debottlenecking, Deca and Efficiency Enhancements driving approximately 100,000 ST annual production volume growth Low additional fixed cost from expansion projects leads to annual EBITDA growth of 6%-8% Increasing baseline of production promotes healthy quarterly distribution growth Pursue accretive acquisitions Aggressively pursuing qualifying MLP opportunities Industrial Minerals / Inorganic Chemical Assets Logistics Assets Assets currently existing or to be developed at OCI OCI Resources LP 8
9 OCI Resources Investment Highlights 1 Lowest Cost Soda Ash Production 2 Significant Reserve Life 3 Operational Advantages 4 Strong Safety Record and Environmental Responsibility 5 Stable Customer Relationships 6 Organic and Acquisition Growth Opportunities 7 Strong Management Team OCI Resources LP 9
10 FINANCIAL SUMMARY
11 Second Quarter 2014 Financial Highlights $ Millions (except Per Unit and Volume Amounts) 2Q14 2Q13 1H H 2013 Net Sales Net Income Adjusted EBITDA Distributable Cash Net Income per Unit Net Debt (Cash) Volumes Sold ST ,265 1,238 Ore to Ash Ratio Capital Expenditures Coverage Ratio since IPO OCI Resources LP 11
12 Operating and Financial Performance of OCI Wyoming LLC Soda Ash Volume Sold (millions of ST) Adjusted EBITDA & Margin (2) ($ in millions) 29.9% 30.8% % 23.1% $ % 24.6% 1.8 $126 $ $90 $84 $ YTD YTD EBITDA EBITDA Margin (1) Operating rate expresses the amount of soda ash produced in a given year as a percentage of our effective capacity for that year. Effective capacity reflects the volume of soda ash that we can produce using our current operational resources, taking into account scheduled and unscheduled downtime and idled capacity (2) See slide 30 and 31 for reconciliation of Adjusted EBITDA to GAAP net income OCI Resources LP 12
13 Strong Financial Position and Financial Strategy Leverage & Liquidity Total Debt / Adjusted EBITDA of 1.5x Debt to Capitalization of 39% $45 million of available liquidity under our credit facilities at end of June 2014 Distribution Stability 1.28x coverage ratio in first half of 2014 Diversity of domestic and international contracts and customers Distribution Growth Capitalize on growing demand for soda ash Increase operational efficiencies: Invested $400mn in maintenance, efficiency, and expansion related capital expenditures since 1996 Maintain financial flexibility Expand operations strategically OCI Resources LP 13
14 Appendix
15 Lowest Cost Soda Ash Production US soda ash producers using Trona have significant cost advantages from lower energy costs and raw material price exposures. U.S. Trona Solvay Hou Process Mining and refining Trona Synthetic production Synthetic production Raw Materials Trona Salt (brine), Limestone, Ammonia Salt (brine), Ammonia, Carbon Dioxide Energy Usage ~1/3 energy cost Energy Intensive Energy Intensive By-Products Deca (able to process into soda ash) Calcium Chloride (waste product) Ammonium chloride (co-product) 1/3~1/2 cost of competing processes (1) 2.9x 2.7x 2.6x Relative Soda Ash Production Costs (1) 1.0x U.S. Trona (Natural Gas) European Solvay China Solvay China Hou Source: IHS (1) Cost to produce 1 metric ton of soda ash as a multiple of Trona based production. OCI Resources LP 15
 Basis Recoverable Reserves Projected")

16 Significant Reserve Life Reserve Life Summary Ore Layout Summary LOWER BED UPPER BED Upper Bed Lower Bed 800ft 1,100ft Reserve Life Calculation (Hollberg) Basis Recoverable Reserves Projected Annual Consumption minimum 85% Grade 263 mn ST 4 mn ST = Implied Mine Life 66 Years Source: Hollberg Professional Group Note: Assumes 2013 mining rate of 4.0mn ST per year OCI Resources LP 16

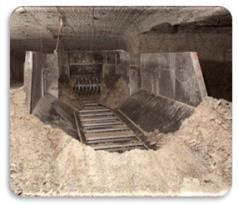
17 Trona Beds Closest to the Surface Beds 24 & 25 (closest to surface) are the key for lower manufacturing costs as lower halite impurities and shallow beds are conducive to efficient mining. Schematic Section Green River Basin OCI Resources LP 17

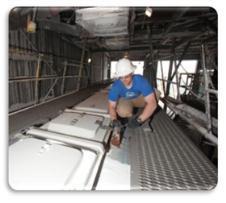
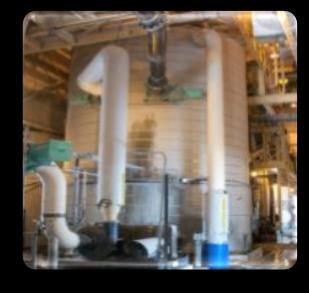
18 Unique Pond Network Lowers Ore to Ash Ratio Wider pond surface area and a unique pond network facilitate the minimization of soda ash lost in processing Trona. Advantageous Facility Layout Ponds enable OCI to recover soda ash via deca rehydration otherwise lost in processing Trona Technological innovation enables OCI to be more cost efficient Ore to Ash Ratio (1) (1) Amount of short tons of Trona ore required to produce one short ton of soda ash/liquor OCI Resources LP 18
19 Most Efficient Soda Ash Producer in Green River Basin OCI has the highest soda ash production per employee. We have the most efficient soda ash production facility in the Green River Basin. Production Per Employee (x10 ST, 2013) 575 Peer Peer Peer Source: State of Wyoming Mining Report, Wyoming Department of Environmental Quality, Annual Report State Inspector of Mines of Wyoming. OCI Resources LP 19
20 Strong Safety Record and Environmental Responsibility Consistent safety recognition to date is a testament to our commitment. Long Tradition of Excellence in Safety 2009, 2010 and 2011 IMA-NA / MSHA Top Safety Achievement Award (National) 2008, 2009, 2010, 2011 and 2012 WY State Mine Inspector s Top Safety Excellence Award Environmentally Responsible Trona based process produces less CO 2 emissions than synthetic production processes Technology for Tailings Management Zero discharge for waste water from operations Safety Statistics for Wyoming Soda Ash Producers (For Year Ended December 31, 2013) Peer 3 Peer 2 Peer 1 Citations Recordable Injuries Lost Work Day Injuries Source: Mine Safety and Health Administration. OCI Resources LP 20


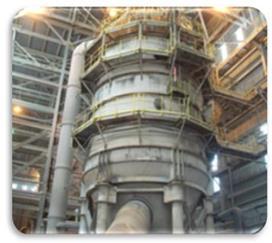
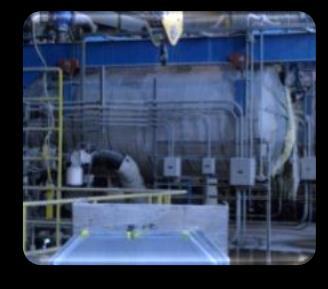

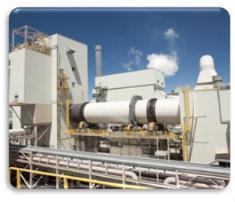

21 Process Overview Mining Process Flow Refining Process Flow Continuous Mining Haulage Crushing Surge Storage Hoisting OCI s Unique Process Screening & Crushing Calcining Dissolving Filtering Deca Rehydration Shipping Storage Drying Evaporation OCI Resources LP 21
 7 storage silos with 65,000 short ton")
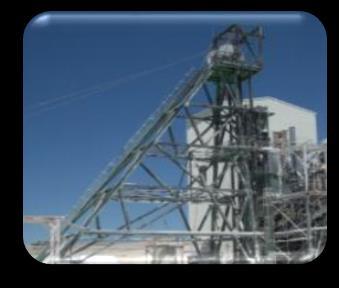
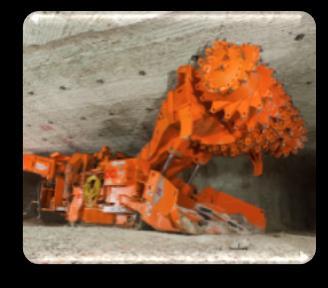
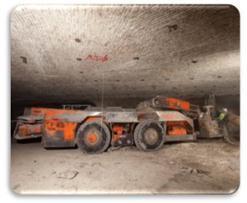
22 Facilities Overview and Mining Assets Mining Assets Mining Lease Map Land Surface Area: approx. 880 Acres Mine Lease Area: 23,500 Acres Water Supply Electricity Railroad Storage Green River Rocky Mountain power Union Pacific WATCO (Switching Provider) 7 storage silos with 65,000 short ton capacity Mining Assets Shafts 2 mining beds (upper & lower) 6 large continuous mining machines 5 active faces 10 underground shuttle cars 3 shafts 1 Man & materials Fresh air 2 Ore Return air to fans 3 Ore Fresh Air Source: Hollberg Professional Group (for Mining Lease Map ) OCI Resources LP 22
23 Chinese FOB Export Prices $320 $290 $290 $250 $230 $230 $270 $250 $220 $265 $240 $220 $205 $195 $195 $225 $255 $220 $230 $213 $240 $223 $190 $185 $180 $185 $165 $165 Q Q Q Q Q Q Q Q Q Q Q Q Q Q High - Per Metric Ton Low - Per Metric Ton Source: IHS. OCI Resources LP 23
24 Stable and Growing Demand Global demand grew by ~3% annually from The growth in demand was primarily driven by China. Industry forecasts volume to grow ~3-4% over the next 5 years with demand driven by emerging markets. Global Demand by Volume (million of ST) ~ E 2023E Source: IHS. OCI Resources LP 24
25 Non-GAAP Reconciliation OCI Resources Pro Forma Quarter Ended 6/30/13 Quarter Ended 6/30/14 Net Income $16.6 $21.1 Add Depreciation and Amortization Interest Expense (net) Provision for Income Taxes Adjusted EBITDA Less: Adjusted EBITDA Attributable to Non-controlling Interest Adjusted EBITDA Attributable to Predecessor / OCI Resources $10.5 $14.0 Non-GAAP Financial Measures We define Adjusted EBITDA as net income (loss) plus net interest expense, income tax, depreciation and amortization, unrealized derivative gains and losses and certain other expenses that are non-cash charges or that we consider not to be indicative of ongoing operations. Adjusted EBITDA is a non-gaap supplemental financial liquidity and performance measure that management and external users of our consolidated financial statements, such as industry analysts, investors, lenders and rating agencies, may use to assess: our operating performance as compared to other publicly traded partnerships in our industry, without regard to historical cost basis or financing methods; the ability of our assets to generate sufficient cash flow to make distributions to our unitholders; our ability to incur and service debt and fund capital expenditures; and the viability of capital expenditure projects and the returns on investment of various investment opportunities. We believe that the presentation of Adjusted EBITDA in this investor presentation provides useful information to investors in assessing our financial condition and results of operations. The GAAP measures most directly comparable to Adjusted EBITDA are net income and cash flow from operations. Our non-gaap financial measure of Adjusted EBITDA should not be considered as an alternative to net income or cash flow from operations. Adjusted EBITDA has important limitations as an analytical tool because it excludes some but not all items that affect net income and cash flows from operations. You should not consider Adjusted EBITDA in isolation or as a substitute for analysis of our results as reported under GAAP. Because Adjusted EBITDA may be defined differently by other companies, including those in our industry, our definition of Adjusted EBITDA may not be comparable to similarly titled measures of other companies, thereby diminishing its utility. OCI Resources LP 25
26 Non-GAAP Reconciliation OCI Resources Pro Forma Year Ended 12/31/12 Year Ended 12/31/13 Net Income $101.0 $70.6 Add Depreciation and Amortization Interest Expense (net) Provision for Income Taxes Adjusted EBITDA Less: Adjusted EBITDA Attributable to Non-controlling Interest Adjusted EBITDA Attributable to Predecessor / OCI Resources $72.7 $52.9 Non-GAAP Financial Measures We define Adjusted EBITDA as net income (loss) plus net interest expense, income tax, depreciation and amortization, unrealized derivative gains and losses and certain other expenses that are non-cash charges or that we consider not to be indicative of ongoing operations. Adjusted EBITDA is a non-gaap supplemental financial liquidity and performance measure that management and external users of our consolidated financial statements, such as industry analysts, investors, lenders and rating agencies, may use to assess: our operating performance as compared to other publicly traded partnerships in our industry, without regard to historical cost basis or financing methods; the ability of our assets to generate sufficient cash flow to make distributions to our unitholders; our ability to incur and service debt and fund capital expenditures; and the viability of capital expenditure projects and the returns on investment of various investment opportunities. We believe that the presentation of Adjusted EBITDA in this investor presentation provides useful information to investors in assessing our financial condition and results of operations. The GAAP measures most directly comparable to Adjusted EBITDA are net income and cash flow from operations. Our non-gaap financial measure of Adjusted EBITDA should not be considered as an alternative to net income or cash flow from operations. Adjusted EBITDA has important limitations as an analytical tool because it excludes some but not all items that affect net income and cash flows from operations. You should not consider Adjusted EBITDA in isolation or as a substitute for analysis of our results as reported under GAAP. Because Adjusted EBITDA may be defined differently by other companies, including those in our industry, our definition of Adjusted EBITDA may not be comparable to similarly titled measures of other companies, thereby diminishing its utility. OCI Resources LP 26
27 Non-GAAP Reconciliation OCI Resources Historical Year Ended December 31, Net Income $77.6 $54.9 $51.6 $88.0 $101.8 Add Depreciation and Amortization Interest Expense (net) Provision for Income Taxes Adjusted EBITDA Non-GAAP Financial Measures We define Adjusted EBITDA as net income (loss) plus net interest expense, income tax, depreciation and amortization, unrealized derivative gains and losses and certain other expenses that are non-cash charges or that we consider not to be indicative of ongoing operations. Adjusted EBITDA is a non-gaap supplemental financial liquidity and performance measure that management and external users of our consolidated financial statements, such as industry analysts, investors, lenders and rating agencies, may use to assess: our operating performance as compared to other publicly traded partnerships in our industry, without regard to historical cost basis or financing methods; the ability of our assets to generate sufficient cash flow to make distributions to our unitholders; our ability to incur and service debt and fund capital expenditures; and the viability of capital expenditure projects and the returns on investment of various investment opportunities. We believe that the presentation of Adjusted EBITDA in this investor presentation provides useful information to investors in assessing our financial condition and results of operations. The GAAP measures most directly comparable to Adjusted EBITDA are net income and cash flow from operations. Our non-gaap financial measure of Adjusted EBITDA should not be considered as an alternative to net income or cash flow from operations. Adjusted EBITDA has important limitations as an analytical tool because it excludes some but not all items that affect net income and cash flows from operations. You should not consider Adjusted EBITDA in isolation or as a substitute for analysis of our results as reported under GAAP. Because Adjusted EBITDA may be defined differently by other companies, including those in our industry, our definition of Adjusted EBITDA may not be comparable to similarly titled measures of other companies, thereby diminishing its utility. OCI Resources LP 27
28 Non-GAAP Reconciliation Coverage Ratio Rolling Non-GAAP Reconciliation Schedule Year ended December 31, Q1 Q Total ($ in millions, except per unit data) Reconciliation of net income to EBITDA and distributable cash flow: Net income $ 70.6 $ 21.6 $ 21.1 $ Add backs: Depreciation and amortization expense Interest expense, net Taxes EBITDA $ $ 28.2 $ 28.2 $ Less: EBITDA attributable to non-controlling interest EBITDA attributable to OCI Resources LP/Predecessor $ 47.1 $ 13.9 $ 14.0 $ 75.0 Less: EBITDA attributable to Predecessor through September 17, $ 29.8 EBITDA attributable to OCI Resources LP $ $ 45.2 Less: Cash interest expense, net attributable to OCIR $ 0.8 $ 1.9 Maintenance capital expenditures attributable to OCIR (1) $ 3.8 Distributable cash flow attributable to OCI Resources LP (2) $ $ 39.5 Cash distribution declared per unit $ Total units outstanding Total distributions to unitholders and general partner $ Distribution Coverage Ratio (1) The Partnership may fund expansion-related capital expenditures with borrowings under existing credit facilities such that expansion-related capital expenditures will have no impact on cash on hand or the calculation of cash available for distribution. In certain instances, the timing of the Partnership s borrowings and/or its cash management practices will result in a mismatch between the period of the borrowing and the period of the capital expenditure. In those instances, the Partnership adjusts designated reserves (as provided in the partnership agreement) to take account of the timing difference. Accordingly, expansion-related capital expenditures have been excluded from the presentation of cash available for distribution. (2) Distributable cash flow is only calculated subsequent to September 17, OCI Resources LP 28
29 Capital Structure Capitalization OCI Resources Pro Forma Available Liquidity ($ in millions) As of June 30, 2014 ($ in millions) Facility Size Available Liquidity Cash and Cash Equivalents $46.4 Long Term Debt OCI Wyoming Credit Facility $135.0 Revenue Bonds due Revenue Bonds due Revolving Credit Facility 0.0 Total Long Term Debt $155.0 Total Equity Total Capitalization $395.2 Revolving Credit Facility $10.0 $10.0 OCI Wyoming Credit Facility (1) Total $200.0 $45.0 (1) Includes outstanding borrowing of $135 mn and $20 mn of revenue bonds. OCI Resources LP 29
30 IDR Structure and Subordination Period OCIR IDR Structure Marginal Percentage Distribution per Unit Range Interest in Distributions (expressed as % of MQD) LP Share GP Share From To Initial Split 98% 2% 0% % 2nd Split 85% 15% 115% % 3rd Split 75% 25% 125% % 4th Split 50% 50% 150% -- above OCIR Subordinated LP Units Subordination % 49% Subordination Period Early Termination of Subordination Period The subordination period will end on the first business day after the MLP has earned and paid at least the minimum quarterly distribution on an annualized basis on each outstanding common, subordinated and general partner unit, for each of three consecutive, non-overlapping four-quarter periods ending on or after September 30, 2016 None OCI Resources LP 30
31 Safe Harbor Statement This presentation may contain forward-looking statements. All statements that address operating performance, events or developments that we expect or anticipate will occur in the future are forward-looking statements. Caution should be taken not to place undue reliance on any such forward-looking statements because actual results may differ materially from the results suggested by these statements. We undertake no obligation to publicly update or revise any forward-looking statements, whether as a result of new information, future events or otherwise. In addition, forward-looking statements are subject to certain risks and uncertainties that could cause actual results to differ materially from our historical experience and present expectations or projections. These risks and uncertainties include, but are not limited to, those described in the Risk Factors section of OCIR s 10-K dated March 14, 2014, and those described from time-to-time in our periodic and other reports filed with the Securities and Exchange Commission. OCI Resources LP 31
Ciner Resources LP Investor Presentation August 2017
 Ciner Resources LP Investor Presentation August 2017 Safe Harbor Statement This presentation may contain forward-looking statements. All statements that address operating performance, events or developments
NATURAL RESOURCE PARTNERS L.P MLP AND ENERGY INFRASTRUCTURE CONFERENCE FIRESIDE CHAT
 NATURAL RESOURCE PARTNERS L.P. 2018 MLP AND ENERGY INFRASTRUCTURE CONFERENCE FIRESIDE CHAT May 24, 2018 FORWARD LOOKING STATEMENTS The statements included in this presentation or contained in this presentation
SunCoke Energy Partners, L.P. Q Earnings & 2015 Guidance Conference Call. January 29, 2015
 SunCoke Energy Partners, L.P. Q4 2014 Earnings & 2015 Guidance Conference Call January 29, 2015 Forward-Looking Statements This slide presentation should be reviewed in conjunction with the Fourth Quarter
SHELL MIDSTREAM PARTNERS, L.P. (SHLX) Q RESULTS ANNOUNCEMENT
 Q RESULTS ANNOUNCEMENT") SHELL MIDSTREAM PARTNERS, L.P. (SHLX) Q1 2016 RESULTS ANNOUNCEMENT May 5, 2016 DEFINITIONS AND CAUTIONARY NOTE This presentation includes various forward-looking statements within the meaning of Section
SHELL MIDSTREAM PARTNERS, L.P. (SHLX) Q1 2016 RESULTS ANNOUNCEMENT May 5, 2016 DEFINITIONS AND CAUTIONARY NOTE This presentation includes various forward-looking statements within the meaning of Section
SunCoke Energy Partners, L.P. Q Earnings Conference Call. January 28, 2016
 SunCoke Energy Partners, L.P. Q4 2015 Earnings Conference Call January 28, 2016 Forward-Looking Statements This slide presentation should be reviewed in conjunction with the Fourth Quarter 2015 earnings
NAPTP 2013 MLP Investor Conference. May 23, 2013
 NAPTP 2013 MLP Investor Conference May 23, 2013 Mark Newman Senior Vice President and Chief Financial Officer Forward-Looking Statements Some of the information included in this presentation constitutes
Simplification and Financial Repositioning February 8, 2018
 Simplification and Financial Repositioning February 8, 2018 Note: We have revised slides 10 & 11, as described in the footnotes thereto, to clarify our basis of presentation Investor Notice In connection
Intrepid Reports Results for Second Quarter 2008
 PRESS RELEASE For Immediate Distribution Contact: Intrepid Potash, Inc. Karla Kimrey Phone: 303-296-3006 Intrepid Reports Results for Second Quarter 2008 Denver, Colorado; August 13, 2008 Intrepid Potash,
BP Midstream Partners LP 3Q 2018 Results
 NOVEMBER 14, 2018 BP Midstream Partners LP 3Q 2018 Results Rip Zinsmeister Chief executive officer Craig Coburn Chief financial officer 3Q 2018 RESULTS 1 Cautionary statement FORWARDLOOKING STATEMENTS
Investor Meetings. November 2014
 Investor Meetings November 2014 Forward-Looking Statements Some of the information included in this presentation constitutes forward-looking statements as defined in Section 27A of the Securities Act of
EQT Announces Plan to Separate Midstream Business. February 21, 2018
 EQT Announces Plan to Separate Midstream Business February 21, 2018 Cautionary Statement Regarding Forward-Looking Information Disclosures in this communication contain certain forward-looking statements
EQM & EQGP Investor Presentation
 EQM & EQGP Investor Presentation October 2015 Cautionary Statements Disclosures in this presentation contain certain forward-looking statements. Statements that do not relate strictly to historical or
November 8, Third Quarter 2018 Results Earnings Conference Call
 November 8, 2018 Third Quarter 2018 Results Earnings Conference Call Non-GAAP Financial Measures Third Quarter 2018 Results SemGroup s non-gaap measures, Adjusted EBITDA, Cash Available for Dividends (CAFD)
Shell Midstream Partners, L.P. (SHLX) Q Results
 Q Results") Shell Midstream Partners, L.P. (SHLX) Q4 2018 Results February 21, 2019 Shell Midstream Partners 1 Definitions and Cautionary Note This presentation includes various forward-looking statements within the
Shell Midstream Partners, L.P. (SHLX) Q4 2018 Results February 21, 2019 Shell Midstream Partners 1 Definitions and Cautionary Note This presentation includes various forward-looking statements within the
Investor Presentation. Third Quarter 2015
 Investor Presentation Third Quarter 2015 Forward-looking Information Certain matters contained in this presentation include "forward-looking statements" within the meaning of Section 27A of the Securities
NAPTP 2014 MLP Investor Conference. May 22, 2014
 NAPTP 2014 MLP Investor Conference May 22, 2014 Mark Newman Senior Vice President and Chief Financial Officer Forward-Looking Statements Some of the information included in this presentation constitutes
First Quarter 2018 Results
 BP Midstream Partners LP First Quarter 2018 Results MAY 10, 2018 Rip Zinsmeister CHIEF EXECUTIVE OFFICER Craig Coburn CHIEF FINANCIAL OFFICER 1 Cautionary statement FORWARD LOOKING STATEMENTS This presentation
May 9, First Quarter 2018 Results Earnings Conference Call
 May 9, 2018 Earnings Conference Call Non-GAAP Financial Measures SemGroup s non-gaap measures, Adjusted EBITDA and Total Segment Profit, are not GAAP measures and are not intended to be used in lieu of
EQM & EQGP Investor Presentation
 EQM & EQGP Investor Presentation July 2015 Cautionary Statements Disclosures in this presentation contain certain forward-looking statements. Statements that do not relate strictly to historical or current
September 2018 MINERALS TECHNOLOGIES INC. MTI OVERVIEW INNOVATION LEADERSHIP EXCELLENCE
 MINERALS TECHNOLOGIES INC. September 2018 MTI OVERVIEW INNOVATION LEADERSHIP EXCELLENCE SAFE HARBOR STATEMENT This presentation may contain forward-looking statements within the meaning of the Private
Investor Relations Presentation
 Investor Relations Presentation EQT Midstream Partners-EQT GP Holdings June 2017 1 Cautionary Statements Disclosures in this presentation contain certain forward-looking statements. Statements that do
Copano Energy. Memphis, TN
 Morgan Keegan 2008 Equity Conference Memphis, TN NASDAQ: CPNO September 5, 2008 Disclaimer Statements made by representatives of, L.L.C. (the Company ) during this presentation may constitute forward-looking
NAPTP MLP Conference. Carlin Conner, CEO Bob Fitzgerald, CFO. May 22, 2014
 NAPTP MLP Conference Carlin Conner, CEO Bob Fitzgerald, CFO May 22, 2014 Forward-looking Information Certain matters contained in this presentation include "forward-looking statements" within the meaning
US Ecology, Inc. Q Earnings Conference Call
 US Ecology, Inc. Q2 2018 Earnings Conference Call August 3, 2018 1 Today s Hosts Jeff Feeler Chairman & Chief Executive Officer Eric Gerratt Executive Vice President & Chief Financial Officer Steve Welling
Buckeye GP Holdings L.P. (NYSE: BGH) Buckeye Partners, L.P. (NYSE: BPL) Kelso & Company Annual LP Conference April 21, 2010
 Buckeye Partners, L.P. (NYSE: BPL) Kelso & Company Annual LP Conference April 21, 2010") Buckeye GP Holdings L.P. (NYSE: BGH) Buckeye Partners, L.P. (NYSE: BPL) Kelso & Company Annual LP Conference April 21, 2010 Forward Looking Statement Certain statements contained in this presentation or
Buckeye GP Holdings L.P. (NYSE: BGH) Buckeye Partners, L.P. (NYSE: BPL) Kelso & Company Annual LP Conference April 21, 2010 Forward Looking Statement Certain statements contained in this presentation or
Investor Relations Presentation
 Investor Relations Presentation EQT Midstream Partners-EQT GP Holdings February 2018 1 Cautionary Statements Disclosures in this presentation contain certain forward-looking statements. Statements that
PBF Logistics LP (NYSE: PBFX)
") PBF Logistics LP (NYSE: PBFX) UBS MLP One-on-One Conference January 2017 Safe Harbor Statements This presentation contains forward-looking statements made by PBF Logistics LP ( PBFX ), PBF Energy Inc.
PBF Logistics LP (NYSE: PBFX) UBS MLP One-on-One Conference January 2017 Safe Harbor Statements This presentation contains forward-looking statements made by PBF Logistics LP ( PBFX ), PBF Energy Inc.
INVESTOR PRESENTATION MAY 2016
 INVESTOR PRESENTATION MAY 2016 Forward Looking Statements Some of the information included herein may contain forward-looking statements within the meaning of the federal securities laws. Forwardlooking
Jefferies 2014 Global Energy Conference. November 11 & 12, 2014
 Jefferies 2014 Global Energy Conference November 11 & 12, 2014 Forward Looking Statements Statements contained in this presentation that state management s expectations or predictions of the future are
August 9, Second Quarter 2018 Results Earnings Conference Call
 August 9, 2018 Second Quarter 2018 Results Earnings Conference Call Non-GAAP Financial Measures Second Quarter 2018 Results SemGroup s non-gaap measures, Adjusted EBITDA, Cash Available for Dividends (CAFD)
Full year 2018 performance driven by continued strength in the Gulf of Mexico, capturing organic growth opportunities.
 The Partnership reported $141.1 million of net income attributable to the partnership, $140.8 million of net cash provided by operating activities, $178.7 million of adjusted EBITDA attributable to the
Shell Midstream Partners, L.P. (SHLX) Q Results
 Q Results") Shell Midstream Partners, L.P. (SHLX) Q3 2018 Results November 2, 2018 Shell Midstream Partners 1 Definitions and Cautionary Note This presentation includes various forward-looking statements within the
Shell Midstream Partners, L.P. (SHLX) Q3 2018 Results November 2, 2018 Shell Midstream Partners 1 Definitions and Cautionary Note This presentation includes various forward-looking statements within the
Investor Relations Presentation
 Investor Relations Presentation EQT Midstream Partners-EQT GP Holdings April 2018 1 Cautionary Statements Disclosures in this presentation contain certain forward-looking statements within the meaning
Carbon Solutions Acquisition and Refined Coal Update
 Advanced Emissions Solutions, Inc. Nasdaq: ADES Advancing Cleaner Energy Carbon Solutions Acquisition and Refined Coal Update November 16, 2018 2018 Advanced Emissions Solutions, Inc. All rights reserved.
Fourth Quarter and Full Year 2017 Results MARCH 22, 2018
 Fourth Quarter and Full Year 2017 Results MARCH 22, 2018 1 4Q & FULL YEAR 2017 RESULTS Brian Sullivan Vice President, Investor Relations 2 Cautionary Statement FORWARD LOOKING STATEMENTS This presentation
Wells Fargo Pipeline, MLP and Utility Symposium
 Wells Fargo Pipeline, MLP and Utility Symposium December 6 & 7, 2016 2 Forward Looking Statements and Non-GAAP Measures This presentation contains certain forward-looking statements within the meaning
May 24, 2018 MLP & Energy Conference
 May 24, 2018 MLP & Energy Conference Carlin Conner, CEO Non-GAAP Financial Measures SemGroup s non-gaap measures, Adjusted EBITDA and Total Segment Profit, are not GAAP measures and are not intended to
NEWS RELEASE. Westmoreland Reports 2014 Year End Results - Record Revenue and Adjusted EBITDA
 NEWS RELEASE Westmoreland Reports 2014 Year End Results - Record Revenue and Adjusted EBITDA WESTMORELAND COAL COMPANY 9540 South Maroon Circle, Suite 200 Englewood, Colorado 80112 (855) 922-6463 Telephone
PBF Logistics LP (NYSE: PBFX)
") PBF Logistics LP (NYSE: PBFX) Master Limited Partnership Association 2016 Investor Conference June 2016 Safe Harbor Statements This presentation contains forward-looking statements made by PBF Logistics
PBF Logistics LP (NYSE: PBFX) Master Limited Partnership Association 2016 Investor Conference June 2016 Safe Harbor Statements This presentation contains forward-looking statements made by PBF Logistics
Driven to Create Value Goldman Sachs 2017 Global Energy Conference January 2017
 Driven to Create Value Goldman Sachs 2017 Global Energy Conference January 2017 2015 Corporation. All Rights Reserved. Forward Looking Statements On November 17, 2016, we announced our plans to acquire
SHELL MIDSTREAM PARTNERS, L.P.
 Exhibit 99.1 SHELL MIDSTREAM PARTNERS, L.P. 4th QUARTER 2015 UNAUDITED RESULTS Strong operational performance generated $67.9 million of cash available for distribution as well as $65.5 million adjusted
FINANCIAL HIGHLIGHTS ASSET HIGHLIGHTS. Significant Offshore Pipeline Transportation:
 Exhibit 99.1 The Partnership reported $148.3 million of net income attributable to the partnership, $154.4 million of net cash provided by operating activities, $187.0 million of adjusted EBITDA attributable
Intrepid Reports Results for Third Quarter 2008
 PRESS RELEASE For Immediate Distribution Contact: Intrepid Potash, Inc. David Honeyfield Phone: 303-296-3006 Intrepid Reports Results for Third Quarter 2008 Denver, Colorado; November 11, 2008 Intrepid
UBS MLP One-on-One Conference. January 2014
 UBS MLP One-on-One Conference January 2014 Forward-looking Information Certain matters contained in this presentation include "forward-looking statements" within the meaning of Section 27A of the Securities
EQM & EQGP Investor Presentation
 EQM & EQGP Investor Presentation January 2016 Cautionary Statements Disclosures in this presentation contain certain forward-looking statements. Statements that do not relate strictly to historical or
Investor Presentation August 2015
 Investor Presentation August 2015 Disclaimer Forward-Looking Statements This presentation includes forward-looking statements. Forward-looking statements give our current expectations, contain projections
ABOUT SHELL MIDSTREAM PARTNERS, L.P.
 Exhibit 99.1 The Partnership reported $110.7 million of net income attributable to the partnership, $104.2 million of net cash provided by operating activities, $155.2 million of adjusted EBITDA attributable
Enable Midstream Partners, LP
 Enable Midstream Partners, LP Fourth Quarter 2014 Conference Call February 18, 2015 Forward-looking Statements This presentation and the oral statements made in connection herewith may contain forward-looking
INVESTOR PRESENTATION DECEMBER NYSE: HCLP hicrush.com
 INVESTOR PRESENTATION DECEMBER 2018 NYSE: HCLP hicrush.com Forward Looking Statements and Non-GAAP Measures Forward Looking Statements Some of the information included herein may contain forward-looking
UBS MLP One-on-One Conference
 UBS MLP One-on-One Conference January 12-13 Park City, UT Forward-looking Information Certain matters contained in this presentation include "forward-looking statements" within the meaning of Section 27A
Casper Terminal Acquisition
 Casper Terminal Acquisition October 2015 Cautionary Statements This presentation may contain forward-looking statements within the meaning of U.S. federal securities laws, including statements related
Acquisition of Wyoming Oil Properties. May 5, 2014
 Acquisition of Wyoming Oil Properties May 5, 2014 Forward-Looking & Other Cautionary Statements This presentation contains forward-looking statements. All statements, other than statements of historical
Arc Logistics Partners LP Investor Presentation March 2015
 Arc Logistics Partners LP Investor Presentation March 2015 Vince Cubbage - CEO, Chairman and Director Bradley Oswald - Senior Vice President, CFO and Treasurer Cautionary Note Forward Looking Statements
First Quarter 2011 Earnings Conference Call May 13, 2011
 Momentive Performance Materials Inc. First Quarter 2011 Earnings Conference Call May 13, 2011 1 Forward-Looking Statements Certain statements included in this presentation constitute forward-looking statements
Safe Harbor WESTMORELAND COAL COMPANY
 Investor Presentation June 2017 Safe Harbor This presentation contains forward-looking statements. These forward-looking statements often relate to our future performance and management s expectations
Dahlman Rose & Co. Global Metals, Mining & Materials Conference. November 17, 2011
 Dahlman Rose & Co. Global Metals, Mining & Materials Conference November 17, 2011 Safe Harbor Statement Some of the information included in this presentation contains forward-looking statements (as defined
Intrepid Reports Results for Fourth Quarter and Full Year 2008
 PRESS RELEASE For Immediate Distribution Contact: Intrepid Potash, Inc. William Kent Phone: 303-296-3006 Intrepid Reports Results for Fourth Quarter and Full Year 2008 Denver, Colorado; March 5, 2009 Intrepid
Westmoreland Reports Fourth Quarter and Full Year 2017 Results; Capital Structure Optimization Underway
 News Release Westmoreland Reports Fourth Quarter and Full Year 2017 Results; Capital Structure Optimization Underway Englewood, CO April 2, 2018 - Westmoreland Coal Company (Nasdaq:WLB) (the "Company")
Investor Presentation February 2017
 Investor Presentation February 2017 Safe Harbor Certain statements in this document regarding anticipated financial, business, legal or other outcomes including business and market conditions, outlook
May 24, 2018 MLP & Energy Conference
 May 24, 2018 MLP & Energy Conference Carlin Conner, CEO Non-GAAP Financial Measures SemGroup s non-gaap measures, Adjusted EBITDA and Total Segment Profit, are not GAAP measures and are not intended to
INVESTOR PRESENTATION NOVEMBER 2015
 INVESTOR PRESENTATION NOVEMBER 2015 Forward Looking Statements Some of the information included herein may contain forward-looking statements within the meaning of the federal securities laws. Forwardlooking
Morgan Stanley Midstream MLP and Diversified Natural Gas Corporate Access Event. March 2014
 Morgan Stanley Midstream MLP and Diversified Natural Gas Corporate Access Event March 2014 Forward-looking Information Certain matters contained in this presentation include "forward-looking statements"
SHELL MIDSTREAM PARTNERS, L.P. (SHLX) Q RESULTS ANNOUNCEMENT
 Q RESULTS ANNOUNCEMENT") SHELL MIDSTREAM PARTNERS, L.P. (SHLX) Q2 2016 RESULTS ANNOUNCEMENT August 4, 2016 DEFINITIONS AND CAUTIONARY NOTE This presentation includes various forward-looking statements within the meaning of Section
SHELL MIDSTREAM PARTNERS, L.P. (SHLX) Q2 2016 RESULTS ANNOUNCEMENT August 4, 2016 DEFINITIONS AND CAUTIONARY NOTE This presentation includes various forward-looking statements within the meaning of Section
Citigroup 14 th Annual High Yield / Leveraged Finance Conference
 FMC Corporation Citigroup 14 th Annual High Yield / Leveraged Finance Conference March 7, 2005 Thomas C. Deas, Jr. Vice President & Treasurer Disclaimer Safe Harbor Statement under the Private Securities
Arc Logistics Partners LP Investor Presentation May 2015
 Arc Logistics Partners LP Investor Presentation May 2015 Cautionary Note Forward Looking Statements Certain statements and information in this presentation may constitute "forward-looking statements."
EQM & EQGP Investor Presentation
 EQM & EQGP Investor Presentation February 2016 Cautionary Statements Disclosures in this presentation contain certain forward-looking statements. Statements that do not relate strictly to historical or
Capital Link Master Limited Partnership Investing Forum
 Capital Link Master Limited Partnership Investing Forum March 2, 2017 2 Forward Looking Statements and Non-GAAP Measures This presentation contains certain forward-looking statements within the meaning
SunCoke Energy Partners, L.P. Q Earnings Conference Call. April 26, 2018
 SunCoke Energy Partners, L.P. Q1 2018 Earnings Conference Call April 26, 2018 Forward-Looking Statements This slide presentation should be reviewed in conjunction with the First Quarter 2018 earnings release
Tata Chemicals (Soda Ash) Partners Holdings and Subsidiaries
 Partners Holdings and Subsidiaries") Tata Chemicals (Soda Ash) Partners Holdings and Subsidiaries Consolidated Financial Statements and Independent Auditors Report Index Page(s) Independent Auditors Report... 1-2 Consolidated Financial Statements
Tata Chemicals (Soda Ash) Partners Holdings and Subsidiaries Consolidated Financial Statements and Independent Auditors Report Index Page(s) Independent Auditors Report... 1-2 Consolidated Financial Statements
PTXP Update: Operations and Events
 Investor Presentation August 2016 Disclaimer Forward-Looking Statements This presentation includes forward-looking statements. Forward-looking statements give our current expectations, contain projections
US Ecology, Inc. Q Earnings Conference Call
 US Ecology, Inc. Q1 2018 Earnings Conference Call May 4, 2018 1 Today s Hosts Jeff Feeler Chairman & Chief Executive Officer Eric Gerratt Executive Vice President & Chief Financial Officer Steve Welling
SemGroup Corporation Announces Third Quarter 2017 Results
 SemGroup Corporation Announces Third Quarter 2017 Results Management Executing on Strategic Plan Recently Added Gulf Coast Assets Contribute to Third Quarter Results Announced Dividend of $0.45 Per Share
Buckeye Partners, L.P. Master Limited Partner Conference February 2005
 Buckeye Partners, L.P. Master Limited Partner Conference February 2005 Forward Looking Statements This presentation may include forward-looking statements within the meaning of Section 27A of the Securities
Investor Presentation. February 2011
 Investor Presentation February 2011 Cloud Peak Energy Inc. Financial Data Cloud Peak Energy Inc. is the sole owner of Cloud Peak Energy Resources LLC. Unless expressly stated otherwise in this presentation,
2018 Second Quarter Results Conference Call August 8, Welcome to the 2018 Second Quarter Conference Call for Genesis Energy.
 2018 Second Quarter Results Conference Call August 8, 2018 Notice: This transcript contains references to non-gaap financial measures. A presentation of the most directly comparable GAAP measures and reconciliations
Antero Midstream Announces Acquisition of Water Business, Private Placement of Common Units & Increased Guidance
 NEWS RELEASE Antero Midstream Announces Acquisition of Water Business, Private Placement of Common Units & Increased Guidance 9/18/2015 DENVER, Sept. 18, 2015 /PRNewswire/ -- Antero Midstream Partners
Investor Meetings. August 2015
 Investor Meetings August 2015 Forward-Looking Statements Some of the information included in this presentation constitutes forward-looking statements. All statements in this presentation that express opinions,
Creating Superior Value Go for Extraordinary
 Creating Superior Value Go for Extraordinary Mizuho Energy Summit April 9-10, 2018 Forward Looking Statements This presentation (and oral statements made regarding the subjects of this presentation) includes
Investor Presentation
 Investor Presentation September 2017 2 Noble Midstream Partners LP Overview Partnership Overview Premier E&P Sponsorship Noble Midstream Partners LP ( NBLX ) is a midstream MLP formed by sponsor, Noble
US Ecology, Inc. Q Earnings Conference Call
 US Ecology, Inc. Q4 2017 Earnings Conference Call February 16, 2018 1 Today s Hosts Jeff Feeler Chairman & Chief Executive Officer Eric Gerratt Executive Vice President & Chief Financial Officer Steve
September 2018 MINERALS TECHNOLOGIES INC. MTI OVERVIEW INNOVATION LEADERSHIP EXCELLENCE
 MINERALS TECHNOLOGIES INC. September 2018 MTI OVERVIEW INNOVATION LEADERSHIP EXCELLENCE SAFE HARBOR STATEMENT This presentation may contain forward-looking statements within the meaning of the Private
Investor Presentation: UBS MLP Conference January 2016
 Investor Presentation: UBS MLP Conference January 2016 Safe Harbor Disclosure Statement Statements made during the course of this presentation that are not historical facts are forward looking statements
Longbow Research Minneapolis, MN October 12, 2005 W. Kim Foster Senior Vice President and CFO
 FMC Corporation Longbow Research Minneapolis, MN October 12, 2005 W. Kim Foster Senior Vice President and CFO Disclaimer Safe Harbor Statement under the Private Securities Litigation Reform Act of 1995
Shell Midstream Partners, L.P. (SHLX) Q Results
 Q Results") Shell Midstream Partners, L.P. (SHLX) Q1 2017 Results May 5, 2017 John Hollowell Chief Executive Officer Shell Midstream Partners 1 Definitions and Cautionary Note This presentation includes various forward-looking
Shell Midstream Partners, L.P. (SHLX) Q1 2017 Results May 5, 2017 John Hollowell Chief Executive Officer Shell Midstream Partners 1 Definitions and Cautionary Note This presentation includes various forward-looking
2013 Citi One-on-One MLP / Midstream Infrastructure Conference. August 21-22, 2013
 2013 Citi One-on-One MLP / Midstream Infrastructure Conference August 21-22, 2013 Forward-Looking Statements Some of the information included in this presentation constitutes forward-looking statements
INVESTOR PRESENTATION MAY 2018
 INVESTOR PRESENTATION MAY 2018 Safe Harbor Disclosure Statement Statements made during the course of this presentation that are not historical facts are forward-looking statements within the meaning of
Sprague Resources LP Reports First Quarter 2018 Results. Partnership confirms 2018 Adjusted EBITDA Guidance of $120 to $140 Million
 Exhibit 99.1 News Release Investor Contact: Kory Arthur +1 603.766.7401 karthur@spragueenergy.com Sprague Resources LP Reports First Quarter 2018 Results Partnership confirms 2018 Adjusted EBITDA Guidance
Non-GAAP Reconciliations Third Quarter 2016 Published November 9, 2016
 Non-GAAP Reconciliations Third Quarter 2016 Published November 9, 2016 We supplement our financial information prepared in accordance with GAAP with certain non-gaap measures including Adjusted EBITDA
Q Earnings. Supplemental Financials. September 25, 2018
 Q3 2018 Earnings Supplemental Financials September 25, 2018 Forward-looking statements This presentation contains forward-looking statements within the meaning of the federal securities laws, including
INVESTOR UPDATE. April 2015
 INVESTOR UPDATE April 2015 FORWARD-LOOKING STATEMENTS Some of the statements in this presentation constitute forward-looking statements about Sunoco LP ( SUN ) and Energy Transfer Partners, L.P. ( ETP
Genesis Energy, L.P. Reports First Quarter 2018 Results
 FOR IMMEDIATE RELEASE May 4, 2018 Genesis Energy, L.P. Reports First Quarter 2018 Results HOUSTON (BUSINESS WIRE) Genesis Energy, L.P. (NYSE: GEL) today announced its first quarter results. We generated
SemGroup Reports Improved Earnings for Second Quarter 2018
 SemGroup Reports Improved Earnings for Second Quarter 2018 Tulsa, Okla. - August 8, 2018 - SemGroup Corporation (NYSE:SEMG) today reported second quarter 2018 net loss of $2.7 million, compared to net
Cowen and Company 5 th Annual Ultimate Energy Conference
 Cowen and Company 5 th Annual Ultimate Energy Conference Jenniffer Deckard, President and Chief Executive Officer Mark Barrus, Interim Chief Financial Officer Sharon VanZeeland, Vice President, Investor
Streamlining Transaction Summary. April 2018
 Streamlining Transaction Summary April 2018 1 Cautionary Statements Disclosures in this presentation contain certain forward-looking statements within the meaning of Section 21E of the Securities Exchange
2Q 2017 Highlights and Operating Results
 2Q 2017 Highlights and Operating Results July 25, 2017 1 2Q 2017 Highlights and Operating Results Table of Contents Page(s) 1 Sales Overview and Highlights 4-5 2 NSS Overview 6-7 3 EES Overview 8-9 4 UPS
PBF Energy Inc. (NYSE: PBF) January 2017 Investor Presentation
 January 2017 Investor Presentation") PBF Energy Inc. (NYSE: PBF) January 2017 Investor Presentation Safe Harbor Statements This presentation contains forward-looking statements made by PBF Energy Inc. ( PBF Energy ), the indirect parent of
PBF Energy Inc. (NYSE: PBF) January 2017 Investor Presentation Safe Harbor Statements This presentation contains forward-looking statements made by PBF Energy Inc. ( PBF Energy ), the indirect parent of
INVESTOR PRESENTATION JANUARY 2018
 INVESTOR PRESENTATION JANUARY 2018 Safe Harbor Disclosure Statement Statements made during the course of this presentation that are not historical facts are forward-looking statements within the meaning
Arch Coal, Inc. Reports Second Quarter 2013 Results. July 30, :46 AM ET
 Arch Coal, Inc. Reports Second Quarter 2013 Results July 30, 2013 7:46 AM ET Quarterly Adj. EBITDA increases 32% over first quarter, reaches $110 million Successful execution of cost reduction initiatives
January SemGroup and KKR Form Canadian Joint Venture and Acquire Meritage Midstream ULC
 January 2019 SemGroup and KKR Form Canadian Joint Venture and Acquire Meritage Midstream ULC Non-GAAP Financial Measures SemGroup s non-gaap measures, Adjusted EBITDA, Cash Available for Dividends (CAFD)
4Q 2018 Highlights and Operating Results. Products. Technology. Services. Delivered Globally.
 4Q 2018 Highlights and Operating Results Products. Technology. Services. Delivered Globally. Table of Contents Page 3 Safe Harbor Statement and Non-GAAP Financial Measures 4 Sales Overview 9 Overview of