FY2016 Earnings Call March 7, 2017 Rolf Buch, CEO Dr. A. Stefan Kirsten, CFO
|
|
|
- Laureen Lambert
- 6 years ago
- Views:
Transcription

1 March 7, 2017 Rolf Buch, CEO Dr. A. Stefan Kirsten, CFO
2 Highlights FFO Growth 2016 FFO1 per share * up 25.1%, driven by internal growth. 10% organic FFO1 growth guided for 2017 (i.e. excluding conwert). Sustainable organic FFO1 growth built in for 2018 and beyond. NAV Growth 2016 Adj. NAV per share * up 27.1%, driven by performance improvements, investments and yield compression from exposure to dynamic regional markets. Further substantial fair value growth potential to be unlocked in 2017 and beyond. Improvements across all KPIs Compelling Guidance 2017 Vonovia standalone guidance confirmed confident to reach upper end. Initial assumption for FFO1 contribution from conwert acquisition expected to be at least 60m. Updates on Several Housekeeping Topics * Please see Glossary / Sources in the Appendix for further information. page 2
3 Built-in Sustainable Organic FFO Growth FFO FFO is expected to grow organically, as rental income and EBITDA growth continue to accelerate. Broadly stable interest rate levels would be an additional contributor to FFO growth vs Outlook Predictable market rent growth of ~1.5% plus increased investments translate into further accelerating rent growth 23.6 Double digit %-growth from extension will continue beyond ~ E Number of units (ø) ' % In-place rent l-f-l (eop) /month/sqm % In-place rent (eop) /month/sqm % Vacancy rate (eop) % bps Rental income m 1, , % Maintenance expenses m % Operating expenses m % m FFO interest expense sensitivity Broadly unchanged interest rate environment would contribute to further FFO growth Expected EBITDA growth over 5-year horizon is about twice the amount of an increase in FFO interest expenses if rates went up by 200bps across the entire period Adj. EBITDA Rental * m , % Adj. EBITDA Extension * m % Adj. EBITDA Operations 1* m , % m 35% 25% FFO interest expense as % of Adj. EBITDA Operations 2* 2016 level Rates unchanged rates +100bps FFO interest expense m % Current income taxes FFO 1 m % 15% rates +200bps FFO 1 m % FFO 1 per share * /share % m 1 Including Adj. EBITDA Other; 2 Based on internal 5-year plan as of Sep * Please see Glossary / Sources in the Appendix for further information. page 3
4 Increasing Rent Growth Momentum FFO Delta In-place rent l-f-l (eop) /month/sqm % In-place rent (eop) /month/sqm % Rent growth driver Contribution Contribution Sitting tenants (incl. subsidized rents) 0.9% 1.1% New lettings 0.6% 0.6% Subtotal market-driven rent growth 1.5% 1.7% Modernization 1.8% 1.2% Subtotal l-f-l rent growth 3.3% 2.9% Space creation 0.0% 0.0% Subtotal organic rent growth 3.3% 2.9% Portfolio management (+ acquisitions./. sales) 1.4% 0.1% Total rent growth 4.7% 3.0% Note: 2015 includes 0.1% contribution from subsidized rents page 4
5 Stable Maintenance Growing Modernization FFO Stable maintenance expenses on a per sqm basis y-o-y. The maintenance capitalization ratio * is not an input factor but an outcome; i.e. what type of work is expensed vs. capitalized is determined by the accounting rules implemented as a pre-defined SAPprocess. m (unless indicated otherwise) Delta /sqm Delta Expenses for maintenance % Expenses for maintenance % Capitalized maintenance % Capitalized maintenance % Total % Total % Maintenance capitalization ratio * 23% 27% Investments (modernization, new initiatives, space creation) % * Please see Glossary / Sources in the Appendix for further information. page 5
6 Growing Investment Program FFO Modernization investments and space creation are increasingly meaningful organic growth drivers. Investments in year one generally lead to rent growth in year two. Increasing investment volume for Optimize Apartments, Upgrade Buildings, New Initiatives and Space Creation ( m) ~ 4m starting 2014 ~ 13m starting 2015 ~ 28m starting 2016 ~ 34m starting 2017 ~ 50m starting 2018 ~ 70m starting % 7.5% 7.8% ~7.2% ~7% ~7% Actual Actual Actual Forecast Ø hurdle rate Ø hurdle rate 1,000 1,000 1, A 2014A 2015A 2016FC 2017E 5yr annual run rate Program year Calendar year Yield 1 Additional rental income 2 1 Program year; 2 Additional rental income from investment yield. Illustrative as portion of the additional rent may shift between years. page 6
7 Increasing Organic Growth through Extension Strategy FFO Extension business with increasing significance and compelling growth rates. Contribution to Adj. EBITDA Operations * expected to grow from ~5% in 2016 to ~8% in Built-in growth for future years as successful programs are applied to the entire portfolio and new initiatives are tested and rolled out. Adj. EBITDA Extension * ( m) ~ ~75% % % * Please see Glossary / Sources in the Appendix for further information E page 7
8 Continued EBITDA Margin Expansion FFO Adj. EBITDA Operations margin * of 70.9% in 2016, up from 67.7% in Expensed vs. capitalized maintenance varies between companies and is a major discretionary factor in the EBITDA margin, which is why Vonovia reports Adj. EBITDA margins incl. and excl. maintenance. Excluding expensed maintenance and including operating costs and corporate SG&A the margin was 87.0% in 2016 up from 84.8% in Adj. EBITDA Operations margin * and Cost per unit 87.0% 84.8% 82.2% 79.6% 77.4% % % 63.8% 60.0% 60.8% m Delta Rental income 1, , % Maintenance expenses ,2 2.1% Operating expenses % Adj. EBITDA Rental * 1, % Income % of which external % of which internal >100% Operating expenses >100% Adj. EBITDA Extension * % IPO EBITDA Operations Margin* EBITDA Operations Margin (excl. Maintenance)* Cost per unit 1 Adj. EBITDA Other >100% Adj. EBITDA Operations * 1, % 1 Cost per unit: (Rental Income EBITDA Operations + Maintenance) / average # units. 2 Mainly consolidation * Please see Glossary / Sources in the Appendix for further information. page 8
 1.0% 2017 2018 2019 2020 2021 2022 2023 2024 2025 2026 2027 2028 2029 2030 from 2031 Weighted avg. financing 1.8% 2.0% 3.8% 1.9% 3.5%2 1.3% 2.")

9 Fully-balanced Maturity Profile FFO Current debt maturity profile 1 ( m) 3,000 Mortgages Structured Loans Bond Debt Hybrid Equity Hybrid avg. financing cost (RHS) 4.0% 2, % 2,000 1, % 1, Current unsecured reoffer yield (7-8 years) 1.0% from 2031 Weighted avg. financing 1.8% 2.0% 3.8% 1.9% 3.5%2 1.3% 2.7% 1.3% 1.6% 1.5% 1.8% 2.0% 2.0% 2.0% 2.0% cost p.a. 2 % of debt maturing % 8.6% 9.6% 15.8% 12.4% 10.9% 9.4% 7.9% 4.0% 3.7% 3.6% 0.0% 0.1% 0.1% 3.7% 1 Maturity profile as of Dec. 31, 2016, prepayment of TAURUS CMBS in February 2017 and 1.0bn bond issuance in January 2017 considered. 2 Weighted avg. financing cost excl. Equity Hybrid. Including Equity Hybrid avg. interest rate of debt maturing in 2021 is 3.8%. 3 Rounded figures. page 9
10 June 2015 June 2016 September 2016 December 2016 February 2017 Diverse Funding Mix and Comfortable KPIs FFO Diverse funding mix 1 Subsidized Modernization Debt 1% Mortgages 7% Structured Loans 10% Debt Hybrid 5% Bonds 1-2 (years indicate maturity) 1-2 years 13% 3-4 years 17% 9-10 years Equity Hybrid years 7% 7% 4% 5-6 years 14% 7-8 years 15% KPIs December 31, 2016 Target LTV 41.6% Mid-to low forties Unencumbered assets 1* in % 69% 50% Debt/EBITDA * 10.5x Fixed/hedged debt ratio 1 99% Global ICR (YTD) * 3.7x Financing cost 1 2.1% Weighted avg. maturity 1 ~7 years Ongoing optimization with most economic funding Development of Unencumberance Ratio / Impact on Financing Strategy Unencumberance ratio dropped from 49.6% pre GAGFAH down to 32.1% including GAGFAH in % After TAURUS CMBS prepayment unencumberance ratio is ca. 69%. This provides enough headroom for conwert integration and implementation of GAGFAH merger as well as full flexibility for our financing strategy with secured and unsecured debt instruments. 32% 44% 56% 60% 69% For each upcoming refinancing we can now choose the most suitable debt instrument. 1 Figures as of Dec. 31, 2016, prepayment of TAURUS CMBS in February 2017 and 1.0bn bond issuance from January 2017 considered. * Please see Glossary / Sources in the Appendix for further information. page 10
11 Apr 2014 Hybrid Dec 2014 Hybrid EMTN 2013 Yankee Eurobond 2013 EMTN 2014 EMTN Mar 2015 EMTN Dec 2015 EMTN Jun 2016 EMTN Sep 2016 EMTN Dec 2016 EMTN Jan 2017 Established Player in Debt Capital Markets FFO Maturity profile further smoothened through most recent bond issuances ( 2.5bn unsecured corporate bonds in 2016 and 1.0bn in January 2017). Redemption of all 3 CMBS structures inherited in the Gagfah takeover now completed (early redemption of third and last CMBS Taurus was Feb. 14, 2017). Average interest rate now down to 2.1% from 2.6% at the end of Unencumberance ratio up from 0% in June 2013 to currently 69%. Vonovia has established itself as one of the Top 15 Euro Investment Grade Corporate Issuers between 2014 and 2016 and has substantially reduced the issuance costs in the process. Top 15 Euro IG Corporate Issuers ( m) Cost per 100m Issuer Total Average Funding p.a. 1 BMW 5,919 8,205 6,170 20,294 6,765 2 VW - 8,910 10,700 19,610 6,537 3 Anheuser-Busch inbev 13,250 3,000 2,500 18,750 6,250 4 Total SA 7,000 5,000 5,300 17,300 5,767 5 Daimler AG 10,980 3,077 3,070 17,127 5,709 6 Royal Dutch Shell 4,000 3,450 5,825 13,275 4,425 7 Telefonica SA 5,900 1,467 5,650 13,017 4,339 8 Vodafone 7, ,410 11,910 3,970 9 Coca-Cola 500 8,500 2,000 11,000 3, BP pic 3,775 2,500 4,000 10,275 3, Sanofi 4,800 2,260 3,000 10,060 3, Renault 3,830 3,200 2,200 9,230 3, Bayer AG 1,500 1,300 6,250 9,050 3, Vonovia SE 2,500 4,000 2,200 8,700 2, Verizon 3,250-5,400 8,650 2, Source: Bank of America Merrill Lynch page 11
12 FFO Substantial LTV Reduction m (unless indicated otherwise) Dec. 31, 2016 Dec. 31, 2015 Delta Non-derivative financial liabilities 13, , % Foreign exchange rate effects % Cash and cash equivalents -1, , % Net debt 11, , % Sales receivables % Additional loan amount for outstanding acquisitions Adj. net debt 11, , % Fair value of real estate portfolio 27, , % Fair value of outstanding acquisitions Shares in other real estate companies >100% Adj. fair value of real estate portfolio 27, , % LTV 41.6% 46.9% -530bps Depending on the final outcome of the second offer period for conwert, the pro forma LTV * will be around 45% and therefore below the 2015YE level and towards the upper end of our target range. Vonovia uses the valuation uplift to buy conwert in a predominantly all-cash transaction, effectively translating value growth into an accretive acquisition. * Please see Glossary / Sources in the Appendix for further information. page 12
13 25.1% FFO1 per Share * Growth FFO Increased Adj. EBITDA Operations * and reduced financing costs lead to 25.1% FFO1 growth. AFFO * of 689.2m is approx. 1.3x proposed dividend amount. m (unless indicated otherwise) FY 2016 FY 2015 Delta Adj. EBITDA Operations * 1, % FFO interest expense % Current income taxes FFO % FFO % of which attributable to Vonovia s shareholders % of which attributable to Vonovia s hybrid capital investors % of which attributable to non-controlling interests % Capitalized maintenance % AFFO * % Current income taxes FFO % Adjusted EBITDA Sales * % FFO % FFO1 / share * (eop NOSH) % FFO1 / share * (avg. NOSH) % AFFO / share * (eop NOSH) % AFFO / share * (avg. NOSH) % * Please see Glossary / Sources in the Appendix for further information. page 13
14 Privatization Margin Up; Record Non-core Volume Privatization volume slightly below prior year but improved margin of 36.2%. Increased non-core and non-strategic volume for a combined total of 36,125 units over last two years, actively tapping the transaction market to clean up the portfolio. m (unless indicated otherwise) Privatization Non-core/Non-strategic Total No. of units sold 2,701 2,979 23, ,631 15,174 Income from disposal , Fair value of disposal * , Adj. profit from disposal Fair value step-up * (%) % 30.5% 5.4% 9.2% Selling costs Adj. EBITDA Sales * * Please see Glossary / Sources in the Appendix for further information. page 14
15 Estimated Value Growth Potential to be Unlocked NAV Illustrative fair value growth potential ( bn) Assumptions Rent multiple +2.0x x 44.0 Our portfolio management strategy of modernization investments, space creation and a focus on growth markets is expected to result in substantial value creation 25.0x going forward. 20.1x 5.1 1) What we can influence Value growth potential from modernization investments. 15.7x +2.0x 17.8x % valuation uplift for properties following modernization work in Upgrade Building Cluster % rent growth for Modernization Clusters 3. 10% rent growth for Operate Cluster. Value growth potential from space creation. 26k units at average letting rent of 10 per sqm and month and a market multiple of 25x. 2) Market dynamics beyond our influence Assumption for value growth potential from exposure to Fair value YE Value growth 2016 Fair value YE Mod. invest Space creation Multiple expansion Overall fair value potential growth markets with positive dynamics through additional yield compression / multiple expansion. Note: Value growth shown on this page is indicative. While we believe the underlying assumptions are reasonable, the actual future development may differ. 1 Strategic portfolio only incl. privatization properties in strategic locations; 2 Market comparables; 3 (i) Upgrade Buildings plus (ii) Optimize Apartments plus (iii) Optimize Apartments within Upgrade Buildings Cluster (Total volume of currently ~290k units) page 15
16 27.1% Adj. NAV per Share * Growth NAV Valuation uplift of 16.2% contributes to 27.1% Adj. NAV per share * growth. m (unless indicated otherwise) Dec. 31, 2016 Dec. 31, 2015 Delta Equity attributable to Vonovia's shareholders 12, , % Deferred taxes on investment properties and assets held for sale 4, , % Fair value of derivative financial instruments % Deferred taxes on derivative financial instruments % EPRA NAV * 17, , % Goodwill -2, , % Adj. NAV * 14, , % EPRA NAV /share * % Adj. NAV /share * % 1 Adjusted for effects from cross currency swaps * Please see Glossary / Sources in the Appendix for further information. page 16
 of which yield compression Berlin 3,448 1,640 22.6 753.2 28.0% 24.")
17 Valuation Uplift Across All Regional Markets But Varying Magnitudes NAV Regional Market Fair value ( million) Fair value ( /sqm) Multiple (in-place-rent) Change in value ( million) Change in value (l-f-l in %) of which yield compression Berlin 3,448 1, % 24.2% Rhineland (Cologne, Düsseldorf, Bonn) Rhine Main Area (Frankfurt, Darmstadt, Wiesbaden) Southern Ruhr Area (Dortmund, Essen, Bochum) 2,847 1, % 8.4% 3,100 1, % 9.8% 2, % 2.8% Strongest valuation uplift in Berlin, Munich and Freiburg. B locations such as Bremen, Kiel and Hannover with above-average valuation gains, but Northern Ruhr Area with only 5.6% uplift underperformed all other Regional Markets. Dresden 2,439 1, % 4.9% Stuttgart 1,585 1, % 9.8% Hamburg 1,733 1, % 16.4% Munich 1,652 2, % 19.6% Northern Ruhr Area (Duisburg, Gelsenkirchen) 1, % 0.5% Hanover 1,027 1, % 8.1% Kiel 861 1, % 11.7% Bremen 762 1, % 14.0% FV ( bn) Westphalia (Münster, Osnabrück) % 6.0% > Freiburg 493 1, % 23.2% < 1 Leipzig 261 1, % 8.8% Other Strategic Locations 1,882 1, % 8.6% Total Strategic Locations 26,341 1, , % 10.9% Value increase (%) < 10% 10% - 15% 15% - 20% > 20% page 17
18 Strategic Clusters Highest Yield Compression in Modernization Clusters NAV The highest uplift from both yield compression and overall was in the two modernization clusters Upgrade buildings and Optimize apartments, confirming our modernization strategy. Yield compression also in Non-core and Non-strategic locations but substantially higher in strategic markets. Strategic Cluster Fair value ( million) Fair value ( /sqm) Multiple (in-place-rent) Change in value ( million) Change in value (l-f-l in %) of which yield compression Operate 7,602 1, % 8.8% Upgrade buildings 9,470 1, % 12.2% Optimize apartments 7,800 1, % 11.4% Strategic 24,872 1, , % 10.9% Privatize 1,586 1, % 10.4% Non-Strategic % 3.8% Non-Core % 2.7% Total 27,013 1, , % 10.7% page 18
19 Value Growth of Acquisition Portfolios Exceeds Goodwill NAV Aggregate value growth of close to 3bn across acquisition portfolios. Acquisition premium already fully recovered through value accretion. m Acquisition year Fair Value at acquisition (l-f-l current portfolio) 1 Fair value Dec. 31, 2016 Value growth since acquisition Goodwill Value growth vs. goodwill Dewag , Vitus , Gagfah ,714 9,753 2,039 2, Franconia Südewo ,732 1, Grainger Portfolio Total 11,949 14,862 2,913 2, Acquisition portfolio adjusted for sales and shown on a like-for-like basis for better comparison. Delta to total goodwill results from IVV acquisition with a goodwill of 2.1m. page 19
20 Goodwill Headroom Grown, Value Up, Performance Assumptions Confirmed NAV While the fair value grew across all cash generating units (CGU) in 2016, the impairment test still resulted in a 1.1% increase of the headroom for the goodwill, as most regions saw the increase in fair value supported by an increase in the underlying cash flows. Except for the Region East (predominantly Berlin), the change in the headroom for the goodwill was considerably smaller than the respective fair value uplift; i.e. the fair value uplift in most regions was also driven by a stronger cash flow profile. Development of Fair Value and Headroom % of total headroom Dec. 31, 2016 Headroom 2016 vs Fair Value 2016 vs CGU 1 North (Hamburg, Kiel, etc.) 13% -5.1% +16.7% CGU 2 East (predominantly Berlin) 6% -27.0% +26.2% CGU 3 Southeast (Dresden, Leipzig, etc.) 9% -2.5% +12.5% CGU 4 West (Dortmund, Essen, etc.) 16% -4.9% +6.3% CGU 5 Middle (Frankfurt, Cologne, etc.) 19% +5.3% +13.8% CGU 6 South (Munich, Stuttgart, etc.) 17% +19.3% +14.5% CGU 7 Central 2% n/a n/a CGU 8 Extension segment 19% n/a n/a Total 100% CGU = cash generating unit * Please see Glossary / Sources in the Appendix for further information. page 20
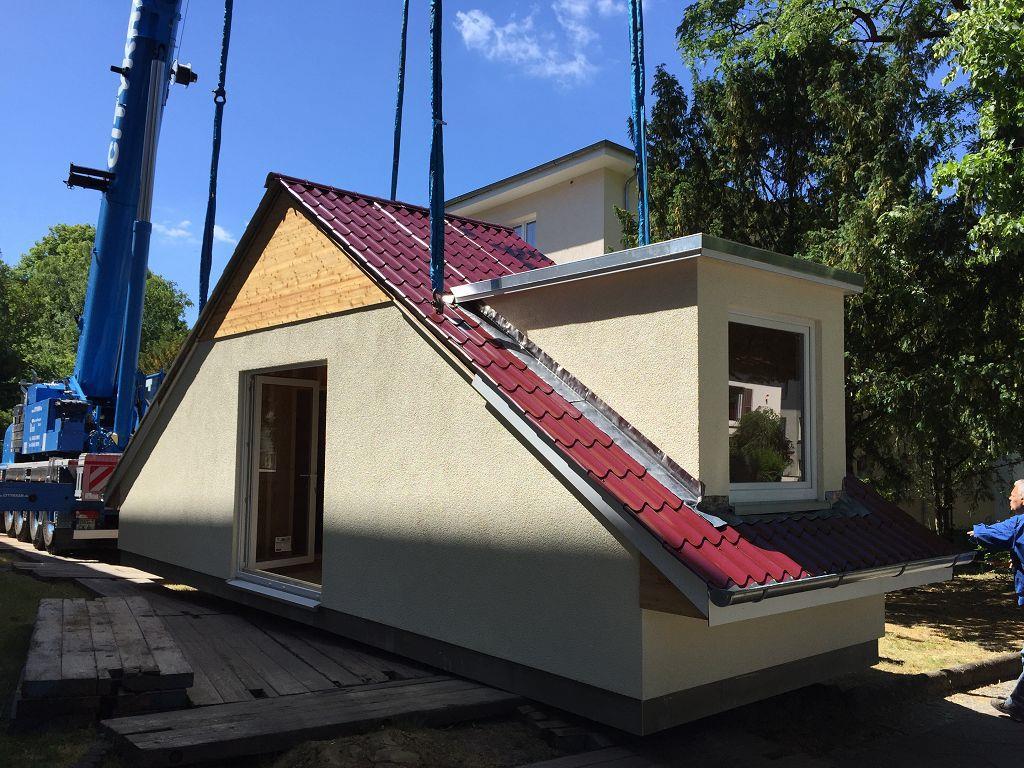
. On-site assembly of modules within only 5 days. Construction completed in mid December 2016 and fully let by mid January 2017.")
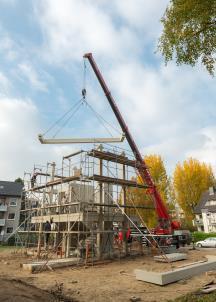
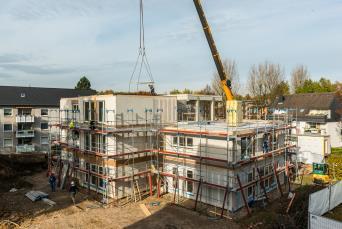
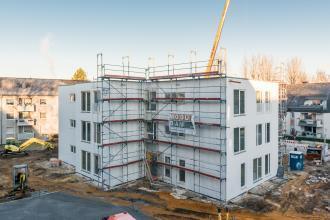
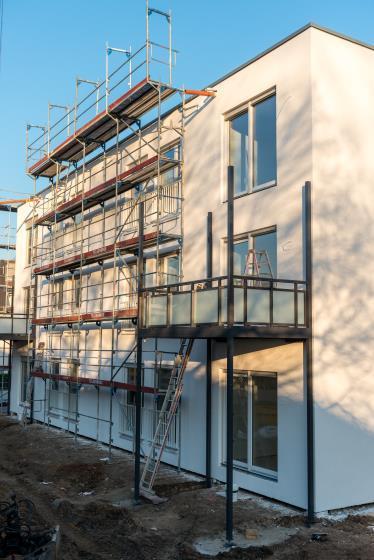
21 Modular Construction Pilot Project Completed NAV Pilot project in Bochum with 14 residential units. Factory-based construction of modules with construction costs of 1,800 per sqm (all-in, excl. land, which we already owned). On-site assembly of modules within only 5 days. Construction completed in mid December 2016 and fully let by mid January In-place rent of slightly above 9 per sqm (vs for Vonovia properties in immediate vicinity). Estimated completion of ~1,000 units in Subject to obtaining building permits page 21
22 Pro-active Portfolio Management NAV Investments * Disposal * More than 1bn invested in value-enhancing modernization* between 2013 and Sale of ~42k Non-core and Non-strategic assets ( ) with below-average quality, location and/or strategic potential. Pro-active portfolio management results in material improvements in quality of assets and locations. Well-positioned to benefit Acquisition * Acquisition of more than 220k units ( YTD, incl. conwert) in attractive regions and complementary to the existing portfolio. from strong underlying fundamentals of entire German residential market. Dec. 31, 2016 (unless indicated otherwise) Residential Units In-place rent ( /sqm) Vacancy rate (%) Fair value ( bn) Fair value (%) Fair value (%) at IPO in Operate 88, % 28% Upgrade Buildings (UB) 125, % 35% 64% of fair value in OA and UB Optimize Apartments (OA) 89, % 29% Subtotal Strategic Clusters 302, % 92% Privatize 17, % 6% Non-strategic 7, % 1% Non-core 5, % 1% Non-core and non-strategic volume down to 2% (~ 0.6bn) of total asset value. Total 333, % 100% * Please see Glossary / Sources in the Appendix for further information. 1 The cluster Non-strategic was introduced after the IPO. For comparison purposes, locations considered Non-strategic as of Sep 30, 2016, were defined as Non-strategic as of the IPO date as well. page 22
23 All Regional Markets Show Upward Potential NAV Fair Value Regional Markets ( million) ( /sqm) Multiple (in-place rent) Residential units Living area ( 000 sqm) Vacancy (%) Total (p.a. million) In-place rent Residential (p.a. million) ( / month/ sqm) Change like-for-like (%) Average p.a. rent growth forecast CBRE (5 yrs)* (%) Average rent growth (%) from Optimize Apartments Berlin 3,448 1, ,454 2, Rhine Main Area (Frankfurt, Darmstadt, Wiesbaden) Rhineland (Cologne, Düsseldorf, Bonn) 3,100 1, ,203 1, ,847 1, ,669 1, Dresden 2,439 1, ,983 2, Southern Ruhr Area (Dortmund, Essen, Bochum) 2, ,834 2, Hamburg 1,733 1, ,644 1, Munich 1,652 2, , Stuttgart 1,585 1, , Northern Ruhr Area (Duisburg, Gelsenkirchen) 1, ,097 1, Hanover 1,027 1, , Kiel 861 1, , Bremen 762 1, , Westphalia (Münster, Osnabrück) , Freiburg 493 1, , Leipzig 261 1, , Other Strategic Locations 1,882 1, ,514 1, Total Strategic Locations 26,341 1, ,274 19, ,480 1, * Please see Glossary / Sources in the Appendix for further information. page 23
24 Standalone Guidance Confirmed (Vonovia excl. conwert) Actuals Actuals 2017 Guidance (Nov. 2016, excl. conwert) L-f-l rent growth (eop) 2.9% 3.3% 3.5%-3.7% Accelerating rent growth Vacancy (eop) 2.7% 2.4% <2.5% Rental Income ( m) 1, , ,530-1,550 Stable top line inspite of ~24,000 non-core sales in 2016 FFO1 ( m) Double digit % organic growth Maintenance ( m) ~320.1 ~340 Modernization & Investments ( m) Privatization (#) 2,979 2,701 ~2,300 FV step-up* (Privatization) 30.5% 36.2% ~35% Non-core (#) 12,195 23,930 opportunistic FV step-up* (Non-Core) 9.2% 5.4% >0% Dividend/share % of FFO 1 1 To be proposed to the Annual General Shareholder Meeting * Please see Glossary / Sources in the Appendix for further information. page 24
25 First Indication for FFO1 Contribution from conwert Full Vonovia guidance for 2017 including conwert will be published with Q results on May 24. Vonovia stand-alone guidance for FFO1 is 830m - 850m. Conservative first assessment based on conwert 2016 FFO1 guidance of 80m as a starting point gives in an initial assumption of approx. 60m FFO1 contribution from conwert for In any scenario second offer period all cash or all shares and irrespective of acceptance ratio the conwert acquisition is FFO1 per share and NAV per share accretive from day 1. page 25
26 More than just a Bond Proxy Inflation protection with additional operational uplift 3.5% 3.0% Rent Growth (Germany) Rent Growth (VNA) Inflation Ø Inflation over the period = 1.4% p.a. Ø Rent Growth (Germany) over the period = 1.2% p.a. 2.5% 2.0% 1.5% 1.0% 0.5% 0.0% Source: German Statistics Office, Statista Additional sources of top-line growth adding to returns Growing EBITDA at an average of 5.9% p.a. resulting in an FFO CAGR ( ) of 13% Adj. EBITDA Extension * ( m) Adjusted EBITDA Operations * ( /avg. unit) FFO 1 ( /share) * and dividend ( /share) 3,172 FFO1 DPS CAGR +62% 57.0 ~100 2,244 2,378 2,372 CAGR +6% 2,468 2,709 2, CAGR +13% CAGR +17% ~70% of FFO E 1 Guidance mid-point * Please see Glossary / Sources in the Appendix for further information page E 1 To be proposed to the Annual General Shareholder Meeting. 2 based on eop number of shares and excluding impact from conwert acquisition
27 Housekeeping I Conwert update II Scrip dividend as alternative III Next portfolio valuation at the end of Q IV Gagfah: cross-border merger V Vonovia s stake in Deutsche Wohnen VI CEO contract extended to Feb page 27
28 Housekeeping I conwert Meets All Acquisition Criteria Acquisition criteria Strategic fit 84% of portfolio in top 25 locations of combined entity with majority in Dresden, Leipzig, Berlin and Potsdam FFO/share accretive Accretive from day 1 NAV/share non-dilutive Accretive from day 1 Smooth transaction BBB+ Rating (stable) All-cash transaction would have no impact on rating What has changed since the announcement At Announcement Since Announcement / Today One of the largest European RE transactions in 2016 with 2.8bn transaction volume. After four failed takeover attempts in recent years by third parties, Vonovia successfully completed the transaction within only four months. Terms communicated upon announcement in September were never changed even when markets turned negative. Flawless execution from preparation to the announcement and all the way to the settlement; no leakage, no delays, no interloper, no regulatory intervention, no changes to deal structure or timing. Share vs. cash Financial synergies Operational synergies conwert noncore portfolio Share alternative at per share substantially more attractive than mandatory cash offer at per share 5m ( 61m break costs to realize synergies) Operational synergies of 7m ~ 600m Of the 72.9m shares, only 0.7m were tendered for shares with the remaining 72.2 for cash Current interest rate environment makes realization of these synergies difficult to achieve First view indicates higher operational synergies than anticipated ~ 330m have been closed or announced since Sep 5 conwert NAV as per Q ~ 17 (est.) as per YE2016 page 28 Next update with Q1 earnings release on May 24
29 Housekeeping I Tender Offer for conwert Residual Timeline Sep 5, 2016 Oct 6 & Oct 28, 2016 Nov 17, 2016 Nov 18 Dec 19, 2016 Dec 22, 2016 Dec 23, 2016 Announcement of the intention to make a voluntary take-over offer Support from conwert board and management Commitment from Adler to tender all its conwert shares Approval from German Federal Cartel Office; Clearance from Austrian Federal Competition Authority Publication of the offer document Acceptance period Publication of final results of acceptance period: 71.54% acceptance ratio Start of second acceptance period Jan 16, 2017 Payment and settlement (conwert fully consolidated as of Jan 10, 2017) Jan 27, 2017 Mar 3, 2017 Mar 23, 2017 conwert EGM (Vonovia holds 4 of the 6 seats on conwert s Administrative Board) 71.54% current acceptance ratio End of second acceptance period Apr 2017 Jul 2017 Payment and settlement second acceptance period All relevant conwert data and systems fully integrated in Vonovia platform Future dates are indicative and subject to change. page 29
30 Housekeeping II Choice for Shareholders Scrip Dividend Choice Scrip dividend as an alternative to cash dividends offers choice to investors. Increasingly best practice Well established in many international markets like the US or UK and increasingly popular in Germany as well. E.ON, Deutsche Telekom, Lufthansa and others have been offering their shareholders for some years now cash dividends and as an alternative an equal dividend amount in the form of shares. Supervisory Board defines scrip dividend structure and price. Process Annual General Meeting approves total dividend amount. Shareholders choose cash or shares until early June. Payout date will be mid-june. page 30
31 Housekeeping III NAV Guidance vs. Semi-annual Valuation Gross asset real estate value represents more than 83% of total assets. Equity capital markets continue to use the NAV as share price proxy. Valuation & Timing NAV guidance without yield compression is of limited use. So far no need to conduct more than one valuation a year, but with more pronounced yield compression in many local markets in 2016 and most likely beyond the annual valuation cycle is too long. Next portfolio valuation will be as of June 30, Same Methodology for half-year valuation as for the year-end valuation. Methodology & Process For practical purposes, the valuation pool will comprise the largest 20 cities plus any other location for which there is indication of strong valuation movements. Data set and result of mid-year valuation will be meaningful enough to ensure that majority of the valuation movements of first two quarters is captured and reflected in financial accounts. Process and timing agreed with our auditors. Half-year valuations to be conducted for as long as there is market evidence of material valuation changes over a 6-months period. NAV guidance suspended page 31
32 Housekeeping IV Gagfah Cross-border Merger Vonovia ownership Redemption of CMBS completed Cross-border merger Vonovia holds 93.8% of all Gagfah shares. After redeeming the last Gagfah CMBS in Feb 2017, Vonovia is currently analyzing the final step of the integration by way of a cross-border merger of Gagfah S.A. into Vonovia SE, effectively completing the last leg of the integration and further reducing legal and governance complexities. A successful merger would lead to a mandatory exchange of all outstanding shareholders Gagfah shares against Vonovia shares in a fixed exchange ratio. After completing the company valuations and after a merger audit by a court-appointed, independent auditor, the governing bodies of Vonovia SE and Gagfah S.A. will deliberate on the merger and the exchange ratio. Synergy expectations over time ( m) At announcement At the end of 2015 Final view Operational synergies Financial synergies Note: Chart shows expected synergies at the different points in time; realization of full synergies in 2017 page 32
33 Housekeeping V Vonovia s Stake in Deutsche Wohnen Vonovia s stake in Deutsche Wohnen Vonovia owns 16.8m shares in Deutsche Wohnen. This equals 4.74% based on the 354.7m shares outstanding. Purchase price & unrealized gains The shares were purchased at an average purchase price of for a total consideration of 405.5m. Based on the closing price on March 3, 2017, the stake has a market value of 532.6m, resulting in a book gain of 127.1m (+31%). Deutsche Wohnen stake in Vonovia s numbers Deutsche Wohnen shares are accounted for under available-for-sale securities in IFRS (in non-current assets). Accounting on a mark-to-market basis, with adjustments to fair market value accounted for in Other comprehensive income. Included with market value in LTV denominator. FFO interest expense includes interest expense for share purchase (approx. 6m) and dividend payment of 9.1m for page 33

34 Housekeeping VI CEO Contract Extended to 2023 CFO Dr. A. Stefan Kirsten CEO Rolf Buch COO Klaus Freiberg CCO Gerald Klinck Since 2011 CFO of Vonovia Since 2013 CEO of Vonovia Board member since 2010 Board member since 2012 Former CEO of Majid Al Futtaiim Group LLC (real estate development company focusing mainly on retail and entertainment ventures in the Emirates) Former CFO of Metro AG and ThyssenKrupp AG in Germany Contract expires Dec. 31, 2020 Former management board member of Bertelsmann SE Former CEO of Arvato AG (global BPO service provider with more than 60,000 employees in over 40 countries) Contract expires Feb. 28, 2023 Responsible for the property management (customer care service, management and letting of portfolio) Former senior manager of Arvato Group; supervised and optimized the service centers of Deutsche Post and Deutsche Telekom Contract expires Jan. 31, 2022 Former CFO of GAGFAH Group 20+ years experience in leading positions in the real estate industry Contract expires at the AGM 2018 page 34
35 Summary Built-in sustainable organic FFO1 growth going forward. FFO1 is expected to grow organically, as rental income and EBITDA growth continue to accelerate. Broadly stable interest rate levels would be an additional contributor to FFO1 growth. Positive FFO1 trajectory even in an immediate 200bps interest rate hike scenario. Fair value growth potential to be unlocked. Our portfolio management strategy has put the portfolio on a growth track. Modernization investments and space creation are expected to be the main drivers of future value growth. Yield compression / multiple expansion from exposure to growth markets expected to be additional value driver. * Please see Glossary / Sources in the Appendix for further information. page 35
36 IR Contact & Financial Calendar Contact Financial Calendar 2017 Rene Hoffmann Head of Investor Relations Vonovia SE Philippstraße Bochum Germany Mar 7 Mar 8-10 Mar 10 Mar 13 Mar 22 Mar 23 Mar FY 2016 results Roadshow (London, Frankfurt, Amsterdam) Kempen European Property Seminar (New York) Roadshow (Paris) Commerzbank Resi Property Forum (London), IR only HSBC Real Estate Conference (Frankfurt), IR only Management Roadshow (China) rene.hoffmann@vonovia.de Mar 29 BofAML European Real Estate Conference (London), IR only Mar 30 Bankhaus Lampe Deutschlandkonferenz (Baden Baden), IR only May 9 Estimated record day for dividend entitlement May 16 Annual General Meeting May 24 Interim results 3M 2017 May 24 June 1 Jun 7 Berenberg European Conference (USA) Kepler Cheuvreux German Property Day (Paris) Goldman Sachs European Financials Conference (Madrid) Vonovia Investor Relations Tablet App Now available for ios and Android June 8 Kempen European Property Seminar (Amsterdam) ~ June 12 Estimated dividend payment date June Capital Markets Day (Bochum) June 22 dbaccess Berlin Conference (Berlin) Aug 2 Interim results 6M 2017 Nov 8 Interim results 9M 2017 page 36
37 Appendix page 37
38 Growth Across All KPIs Delta +10.2% per avg. unit * ( 3,172 vs. 2,878) +20.7% per sqm ( 2,206 vs. 1,827) Average number of residential sqm `000 21,509 20, % In-place rent (eop) /month/sqm % In-place rent l-f-l (eop) /month/sqm % Vacancy rate (eop) % 2.4% 2.7% -30bps Rental income m 1, , % Cost per average unit * % Adj. EBITDA Operations * m 1, % Rental * m 1, % Extension * m % Other (i.e. consolidation) m >100% FFO 1 m % FFO 1 per share * (eop NOSH) % FFO 1 per share * (avg. NOSH) % AFFO * m % Adj. EBITDA Sales * m % Adj. EBITDA (Total) m 1, , % FFO 2 m % +19.9% per sqm ( 1,264 vs. 1,054) Dec. 31, 2016 Dec. 31, 2015 Delta Fair value of real estate portfolio m 27, , % EPRA NAV * /share % Adj. NAV * /share % LTV % 41.6% 46.9% -530bps Dividend paid m m * Please see Glossary / Sources in the Appendix for further information. page 38
39 Reconciliation IFRS Profit to FFO m (unless indicated otherwise) FY 2016 FY 2015 Delta 0 PROFIT FOR THE PERIOD 2, % Financial result % Income taxes 1, % Increase due to fair value adjustment of investment properties vs. increase of deferred tax liabilities Depreciation and amortization >100% Net income from fair value adjustments of investment properties -3, ,323.5 >100% = EBITDA IFRS 1, % EBITDA increase mainly driven by rental business Non-recurring items % Total period adjustments from assets held for sale >100% Financial income from investments in other real estate companies >100% = ADJUSTED EBITDA 1, , % Adjusted EBITDA Sales * % = ADJUSTED EBITDA OPERATIONS* 1, % Interest expense FFO % Current income taxes FFO % = FFO % Capitalized maintenance % = AFFO* % Increase of adjusted EBITDA sales* due to higher Non-core sales volume and higher core step-ups Adjusted EBITDA Operations* reflects operational performance as well as acquisitions* and expansion strategy in Extension Segment Current income taxes FFO % FFO 2 (FFO 1 incl. Adjusted EBITDA Sales * /current income taxes Sales) % FFO 1 per share in (eop NOSH) * % AFFO per share in (eop NOSH) * % Number of shares (million) eop * Please see Glossary / Sources in the Appendix for further information. page 39
40 P&L m (unless indicated otherwise) FY 2016 FY 2015 Delta 0 Income from property letting 2, , % Other income from property management % Income from property management 2, , % Income from disposal of properties 1, % Carrying amount of properties sold -1, % Revaluation of assets held for sale % Profit on disposal of properties % L-f-l-rent increase of 3.3%, thereof 1.8% due to modernization*. Vacancy rate down from 2.7% in 2015 to 2.4% in 2016 Increase in sales from 15,174 in 2015 to 26,631 in 2016 (thereof 23,930 non-core); lower non-core step-up in % (2015: 9.2%) Net income from fair value adjustments of investment properties 3, ,323.5 >100% Capitalized internal expenses % Cost of materials -1, % Personnel expenses % Depreciation and amortization >100% Other operating income % Other operating expenses % Financial income >100% Financial expenses % Earnings before tax 3, ,734.5 >100% Positive operational development and high market dynamics for residential property market in Germany Significant expansion of value accretive modernization Income taxes -1, % Profit for the period 2, >100% Attributable to: Vonovia s shareholders 2, >100% Vonovia s hybrid capital investors % Non-controlling interests >100% Earnings per share (basic and diluted) in >100% * Please see Glossary / Sources in the Appendix for further information. page 40
41 Balance Sheet (1/2 Total Assets) m (unless indicated otherwise) Dec. 31, 2016 Dec. 31, 2015 Delta Assets Intangible assets 2, , % Property, plant and equipment % Investment properties 26, , % Financial assets >100% Other assets % Income tax receivables % Deferred tax assets % Increase mainly due to revaluation 3.2bn Increase mainly due to the acquisition* and valuation of Deutsche Wohnen shares 2015 include advance payments made on acquisitions of companies and real estate Total non-current assets 30, , % Inventories % Trade receivables % Financial assets >100% Other assets % Income tax receivables % Cash and cash equivalents 1, , % Assets held for sale % Total current assets 2, , % Decrease due to lower receivables from the sale of properties Positive market values from cross-currency swaps Decrease mainly due to scheduled and unscheduled loan repayments, mainly GRF 1 and 3-yr 2013 bond 2015 including 13,570 units sale to LEG Total assets 32, , % * Please see Glossary / Sources in the Appendix for further information. page 41
42 Balance Sheet (2/2 Total Equity and Liabilities) m (unless indicated otherwise) Dec. 31, 2016 Dec. 31, 2015 Delta Equity and liabilities Subscribed capital % Capital reserves 5, , % Retained earnings 6, , % Other reserves >100% Total equity attributable to Vonovia's shareholders 12, , % Increase results from revaluation of Deutsche Wohnen shares partly compensated by the valuation of cash flow hedges Equity attributable to hybrid capital investors 1, , % Total equity attributable to Vonovia's shareholders and hybrid capital investors , % Non-controlling interests % Total equity 13, , % Provisions % Trade payables % Non derivative financial liabilities 11, , % Derivatives % Liabilities from finance leases % Liabilities to non-controlling interests % Other liabilities >100% Deferred tax liabilities 3, , % Total non-current liabilities 16, , % Provisions % Mainly repayment of CMBS GRF 1 and CMBS GRF2 and repayments of portfolio loans, issue of EMTN bonds of total 2.5bn Decrease mainly due to contractual reductions and premature terminations The 2016 figures include purchase price liabilities in the amount of 76.1m Trade payables % Non derivative financial liabilities 1, % Derivatives % Liabilities from finance leases % The increase results from the final maturity of two Bonds in 2017 Liabilities to non-controlling interests % Other liabilities % Total current liabilities 2, , % Total liabilities 18, , % Total equity and liabilities 32, , % page 42
43 Additional Key Figures FY 2016 / FY 2015 / Dec. 31, 2016 Dec. 31, 2015 Headcount (eop) 7,437 6,368 EPRA vacancy rate (eop) 2.2% 2.5% IFRS profit for the period ( /share) Number of units acquired 2, ,632 Number of units sold 26,631 15,174 Total residential sqm ( 000; eop) 20,781 22,271 page 43
44 Valuation parameters and results Valuation parameters Management costs per residential unit p.a Maintenance costs (ongoing + apt. improvement per sqm) p.a p.a p.a. Discount rate 5.5% 5.8% Capitalization rate 4.3% 4.7% Market rent increase p.a. 1.2% p.a. 1.2% p.a. Stabilized vacancy rate 2.4% 2.7% Valuation results Net initial yield 4.0% 4.5% Gross yield 5.7% 6.5% In-place rent multiple 17.6x 15.4x Fair Value ( /sqm) 1,264 1,054 page 44
45 Y-o-y Valuation Growth Substantial value growth across the portfolio but yield compression clearly more pronounced in some regions than others. Regional Markets ( million) ( /sqm) Delta Fair Value Fair Value Fair Value Multiple (in-place rent) Residential units ( million) ( /sqm) Multiple (in-place rent) Residential units ( /sqm) Multiple (in-place rent) Berlin 2, , ,563 3, , ,454 Rhine Main Area (Frankfurt, Darmstadt, Wiesbaden) 2, , ,262 3, , ,203 Rhineland (Cologne, Düsseldorf, Bonn) 2, , ,214 2, , ,669 Dresden 2, ,047 2, , ,983 Southern Ruhr Area (Dortmund, Essen, Bochum) 2, ,224 2, ,834 Hamburg Munich 1, , ,622 1, , ,644 1, , ,543 1, , ,773 Stuttgart 1, , ,743 1, , ,303 Northern Ruhr Area (Duisburg, Gelsenkirchen) 1, ,531 1, ,097 Hanover Kiel , ,575 1, , , , , ,989 Bremen , , ,339 Westphalia (Münster, Osnabrück) , ,652 Freiburg Leipzig Other Strategic Locations Total Strategic Locations Note: Excluding Non-strategic locations; Changes are real case, not like-for-like , , , , , , ,089 1, , ,931 1, , ,514 22, , ,264 26, , ,274 page 45 28% 24% 15% 10% 14% 10% 16% 11% 10% 7% 19% 14% 25% 18% 11% 10% 5% 2% 16% 14% 20% 17% 19% 16% 14% 10% 27% 23% 12% 9% 16% 12% 17% 13%
46 Y-o-y Valuation Growth Substantial value growth across the portfolio but movements clearly more pronounced in some regions than others. Fair value /sqm In-place rent multiple Berlin 1,282 1,640 28% Berlin % Rhine Main Area 1,479 1,695 15% Rhine Main Area % Rhineland 1,256 1,437 14% Rhineland % Dresden 923 1,070 16% Dresden % Southern Ruhr Area % Southern Ruhr Area % Hamburg 1,341 1,595 19% Hamburg % Munich 1,996 2,497 25% Munich % Stuttgart Northern Ruhr Area ,529 1,701 5% 11% Growth Stuttgart Northern Ruhr Area 2% % Growth Hanover 1,003 1,167 16% Hanover % Kiel 850 1,020 20% Kiel % Bremen 898 1,070 19% Bremen % Westphalia % Westphalia % Freiburg 1,386 1,759 27% Freiburg % Leipzig 900 1,010 12% Leipzig % Other Strategic Locations 1,075 1,243 16% Other Strategic Locations % Note: Excluding Non-strategic locations; Changes are real case, not like-for-like page 46
47 Bond Overview Corporate Investment grade rating as of Rating agency Rating Outlook Last Update Standard & Poor s BBB+ Stable 06 September 2016 Bond ratings as of Name Tenor & Coupon ISIN Amount Issue price Coupon Final Maturity Date Rating Bond 002 (EUR-Bond) 6 years 3.125% DE000A1HNW52 600m % 3.125% 25 July 2019 BBB+ Bond 003 (USD-Bond) 4 years 3.200% US25155FAA49 USD 750m % 2.970%* 02 Oct 2017 BBB+ Bond 004 (USD-Bond) 10 years 5.000% US25155FAB22 USD 250m % 4.580%* 02 Oct 2023 BBB+ Bond 005 (EMTN) 8 years 3.625% DE000A1HRVD5 500m % 3.625% 08 Oct 2021 BBB+ Bond 006 (Hybrid) 60 years 4.625% XS m % 4.625% 08 Apr 2074 BBB- Bond 007 (EMTN) 8 years 2.125% DE000A1ZLUN1 500m % 2.125% 09 July 2022 BBB+ Bond 008 (Hybrid) perpetual 4% XS ,000m % 4.000% perpetual BBB- Bond 009A (EMTN) 5 years 0.875% DE000A1ZY m % 0.875% 30 Mar 2020 BBB+ Bond 009B (EMTN) 10 years 1.500% DE000A1ZY m % 1.500% 31 Mar 2025 BBB+ Bond 010A (EMTN) 2 years 0.950%+3M EURIBOR DE000A18V m % 0.835% hedged 15 Dec 2017 BBB+ Bond 010B (EMTN) 5 years 1.625% DE000A18V138 1,250m % 1.625% 15 Dec 2020 BBB+ Bond 010C (EMTN) 8 years 2.250% DE000A18V146 1,000m % 2.250% 15 Dec 2023 BBB+ Bond 011A (EMTN) 6 years 0.875% DE000A182VS4 500m % 0.875% 10 Jun 2022 BBB+ Bond 011B (EMTN) 10 years 1.500% DE000A182VT2 500m % 1.500% 10 Jun 2026 BBB+ Bond 012 (EMTN) 2 years 0.380%+3M EURIBOR DE000A185WC9 500m % 0.140% hedged 13 Sep 2018 BBB+ Bond 013 (EMTN) 8 years 1.250% DE000A189ZX0 1,000m % 1.250% 06 Dec 2024 BBB+ Bond 14A (EMTN) 5 years 0.750% DE000A19B8D4 500m % 0.750% 25 Jan 2022 BBB+ Bond 14B (EMTN) 10 years 1.750% DE000A19B8E2 500m % 1.750% 25 Jan 2027 BBB+ * EUR-equivalent Coupon page 47
48 Covenants and KPIs Bond KPIs Covenant Level Dec. 31, 2016 LTV* Total Debt / Total Assets Secured LTV* Secured Debt / Total Assets ICR* Last 12M EBITDA / Last 12M Interest Expense Unencumbered Assets* Unencumbered Assets / Unsecured Debt <60% 41% <45% 11% >1.80x 3.68x >125% 225% Rating KPIs Covenant Debt to Capital Total Debt / Total Equity + Total Debt ICR* Last 12M EBITDA / Last 12M Interest Expense Level (BBB+) <60% >1.80x * Please see Glossary / Sources in the Appendix for further information. page 48
49 Gagfah Synergy Realization Original estimate of 84m total synergies from Gagfah acquisition vs. final estimate of 137m. Synergy realization (aggregate view, m) E Initial expectation at announcement Operational synergies Financial synergies page 49
50 Conservative Valuation In-place valuations are still only half of replacement values, in spite of accelerating valuation growth in recent years. Values per sqm ( ) ~2,500 ~1, ,054 1,264 VNA 2010 VNA 2011 VNA 2012 VNA 2013 VNA 2014 VNA 2015 VNA 2016(E) VNA modular construction costs* Market costs for new constructions* * Please see Glossary / Sources in the Appendix for further information. Note: VNA refers to Deutsche Annington Portfolio at the time page 50
 818 locations 12/2016 665 locations Strategic Portfolio ~400 locations Vonovia location High-influx cities ( Schwarmstädte ).")
51 Substantial Reduction of Portfolio Locations 03/2015 (incl. Südewo) 818 locations 12/ locations Strategic Portfolio ~400 locations Vonovia location High-influx cities ( Schwarmstädte ). For more information: page 51
52 Acquisitions Opportunistic but Disciplined Acquisition pipeline ( 000 units) excl. Gagfah Examined* Analyzed in more detail* Due Diligence, partly ongoing* Bids* Signed* FY 2014 FY 2015 FY conwert Immobilien SE transaction closed in Q * Please see Glossary / Sources in the Appendix for further information. page 52
53 Innovative Traditional Proven and Unchanged Strategy since IPO Reputation & Customer Satisfaction 1 Property Management Systematic optimization of operating performance and core business productivity through leveraging scaling effects High degree of standardization and industrialization throughout the entire organization 2 Financing Ensure well-balanced financing mix and maturity profile with low financing costs, investment grade credit rating and adequate liquidity at all times 5 Mergers & Acquisitions 3 Portfolio Management Fast and unfettered access to equity and debt capital markets at all times Portfolio optimization by way of tactical acquisitions and non-core/non-strategic disposals to ensure exposure to strong local markets Pro-active development of the portfolio through investments to offer the right products in the right markets and on a long-term basis Continuous review of on- and off-market opportunities to lever economies of scale and apply strategic pillars 1-4 to a growing portfolio All acquisitions must meet the stringent acquisition criteria 4 Extension Expansion of core business to extend the value chain by offering additional services and products that are directly linked to our customers and/or the properties Insourcing of services to ensure maximum process management and cost control page 53


 Average apartment size of ~61 sqm Vacancy ~2.4% almost fully let 13.")
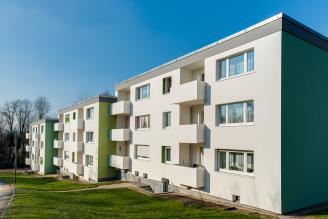
54 Vonovia at a Glance Germany s largest residential landlord with national footprint in urban regional markets Residential real estate company with B-to-C characteristics. Industrialized approach leverages economies of scale in a highly homogeneous asset class. Strong internal growth profile via sustainable market rent growth, additional rent growth from portfolio investments and dynamic extension business. Market leadership with nationwide footprint offers additional growth opportunities. Robust business model delivers highly stable and growing cash flows. Predictable top and bottom line with downside protection and upside potential. 333k apartments Strategic Portfolio Vonovia Location High-influx cities ( Schwarmstädte ) Average apartment size of ~61 sqm Vacancy ~2.4% almost fully let 13.5 years average tenure ~ 1,540m stable rental income ~ 760m operating profit before sales (FFO 1) Dividend policy: approx. 70% of FFO 1 Munich Karlsruhe Dortmund Note: Excluding conwert acquisition page 54

55 If You Want to Know Where Germans Live - Follow the Light Illustration of Germany at Night Source: page 55

56 Strong Overlap with Vonovia Portfolio Illustration of Germany at Night Source: page 56
57 Market German Residential Safe Harbor and Low Risk German residential market: important pillar of the German economy With a GDP contribution of more than 500bn the German residential real estate industry represents more than 18% of Germany s GDP. Germany and its resilient economy provide a comparatively safe harbor for foreign investments. Germany is the economic powerhouse and growth engine of Europe. Due to its regulatory structure, the German residential rental market is largely immune to macro-economic fluctuations and offers high cash flow visibility. Residential market provides superior returns especially in low interest rate environment. Germany: regulated market ensures sustainable rent growth % USA: rent growth is highly volatile % GDP Germany quarterly development y-o-y Rent Growth Germany quarterly development y-o-y -7 GDP USA quarterly development y-o-y Rent Growth USA annually development y-o-y Sources: Federal Statistics Office, GdW (German Association of Professional Homeowners), REIS, BofA Merrill Lynch Global Research; BIP USA: IMF, Statista Note: Due to lack of q-o-q US rent growth data, the annual rent growth for a year is assumed to also be the q-o-q rent growth of that year page 57
58 Market German Residential Favorable Fundamentals New Supply falls short of demand After record construction volumes in the 1990s, new volumes have plummeted as Germany has reduced its building capacity. While volumes have been recovering from all-time lows in 2009 and 2010, the current levels are still short of demand. Large gap between building permits and actual new constructions during last seven years. Discrepancy between new demand and new supply is forecast to continue and add to supply/demand imbalance already evident in many urban areas. Substantial disconnect between in-place values and market replacement cost. 800 Residential building permits and new construction volume ( 000 units) Completions on average 17% below permits Demand exceeds annual average of past 15 years by ~150k Completions Estimated required volume Permits Sources: Federal Statistics Office, IW Köln, GdW (German Association of Professional Homeowners) page 58
59 Market German Residential Favorable Fundamentals Low home ownership ratio Germans prefer to rent With the exception of Switzerland, Germany has the lowest homeownership ratio in Europe. Rental regulation, favorable tenant laws, the general perception that home buying is a life-time decision and comparatively stringent financing requirements are main drivers for low homeownership rate. Rental housing very affordable in Germany Affordability in Germany is higher than in the UK or France. Whereas most other European countries saw an increase, the share of rent-related payments in relation to disposable income declined in Germany between 2005 and Home ownership rate 2015 in % Rent as % of disposable household income Romania Norway Spain Italy Finland Belgium Netherlands France UK Germany Switzerland Ø Europe 75.1% 22 Germany UK France Share of disposable household income spent on rent, water, electricity and fuel Sources: Federal Statistics Office, Eurostat page 59
60 Market German Residential Favorable Fundamentals Fragmented ownership structure Germany is the largest housing market in Europe with ~42m housing units, of which ~23m are rental units. Ownership structure is highly fragmented and majority of owners are non-professional landlords. Listed sector represents ~4% of total rental market. Growing number of smaller households While the overall population in Germany is expected to slightly decline, the number of households is forecast to grow until at least 2030 with a clear trend towards smaller households. The household growth is driven by various demographic and social trends including divorce rates, employment mobility etc. Ownership structure (million units) Distribution of household sizes (million) Amateur landlords Professional, not listed Σ 40.1 Σ or more persons 4 persons -29% -24% Government owned Cooperatives persons -24% Listed property companies Churches and other persons 1 person +12% +11% Sources: Federal Statistics Office, GdW (German Association of Professional Homeowners) page 60
61 Market No Correlation between Interest Rates and Property Values Valuation methodology for German residential properties is primarily based on market prices for assets not on interest rates While market prices are affected by the general interest levels there is no significant correlation. Other factors such as supply/demand imbalance, rental regulation, market rent growth, location of assets etc. outweigh the impact of interest rates when it comes to pricing residential real estate. The steep decline in interest rates (down by 7.4% since 1992) is not mirrored by asset yields (down by 1.1% since 1992). Asset yields outperformed interest rates by 2.2% on average since 1992 and 5.4% in June German residential yields vs. EUR interest rates 1 No correlation pattern between interest rates and property values 1-1.1% Δ 5.4% -7.4% 1 Yearly asset yields vs. rolling 200d average of 10y interest rates Sources: Thomson Reuters, bulwiengesa page 61
62 Shared- Services Central Local Scalable Organization Asset Management Property Management ~333,000 apartments 38 Business Units 6 Business Units 5 Business Units 4 Business Units 8 Business Units 7 Business Units 8 Business Units Local property management, letting, care-taking North East South-East South Middle West 6 Regions Product Management New Construction & Modernization Acquisition & Sales Customer Service Residential Environment Service Technical Service Finance/ Tax Controlling / Valuation Legal/ HR IT Other Functions* *Other shared services: Internal Audit, Communications, Central Procurement, Insurances, Investor Relations, Accounting page 62
63 Attractive Dividend Policy Number of months until costs are earned * by recurring income 1 Sustainable and growing cash flow with attractive pay-out ratio ~ Dividend (ca. 70%) FFO % of FFO number of months * Other (ca. 30%) Interest expenses Taxes Operating Expenses 2 Maintenance Expenses (E) 0 FFO 1 per share* ( ) Dividend per share ( ) 1 Rental income + EBITDA Extension and Other; excluding sales effects; 2 To be proposed to the Annual General Shareholder Meeting. 3 Vonovia standalone guidance for 2017, excluding impact from conwert acquisition. *Please see Glossary / Sources in the Appendix for further information. 2017(E): effects from conwert takeover not taken into account page 63
64 VWAP (Euro/share) Average Market Cap ( bn) Vonovia History Seed portfolios of today s Vonovia have origin in public housing provided by government, large employers and similar landlords with a view towards offering affordable housing. At beginning of last decade, private equity invested in German residential on a large scale including into what is Vonovia today (mainly Deutsche Annington and Gagfah then). IPO in Final exit of private equity in Share price and market capitalization 35 Stoxx 600 inclusion DAX inclusion MSCI inclusion Gagfah acq. (140k units) Südewo acq. (20k units) S-DAX inclusion DeWAG & Vitus acq. (41k units) MDAX inclusion Q3 '13 Q4 '13 Q1 '14 Q2 '14 Q3 '14 Q4 '14 Q1 '15 Q2 '15 Q3 '15 Q4 '15 Q1 '16 Q2 '16 Q3 '16 Q4 '16 0 Source: Factset, company data Average Market Cap ( bn) page 64 VWAP (Euro/share)
65 Jul-13 Aug-13 Sep-13 Oct-13 Nov-13 Dec-13 Jan-14 Feb-14 Mar-14 Apr-14 May-14 Jun-14 Jul-14 Aug-14 Sep-14 Oct-14 Nov-14 Dec-14 Jan-15 Feb-15 Mar-15 Apr-15 May-15 Jun-15 Jul-15 Aug-15 Sep-15 Oct-15 Nov-15 Dec-15 Jan-16 Feb-16 Mar-16 Apr-16 May-16 Jun-16 Jul-16 Aug-16 Sep-16 Oct-16 Nov-16 Dec-16 Liquid Large-cap Stock Shareholder structure (as of December 31, 2016) Share information 8.3% 7.6% 5.4% 3.6% 3.1% Blackrock Norges Lansdowne Deutsche Bank First day of trading July 11, 2013 Number of shares outstanding Free float based on Deutsche Börse definition ISIN Ticker symbol Share class 466 million 92.4% DE000A1ML7J1 VNA Registered shares with no par value Sun Life Listing Frankfurt Stock Exchange 72.0% Other Market segment Regulated Market, Prime Standard According to German law the lowest threshold for voting rights notifications is at 3% Major indices and weight (as of Dec. 31, 2016) DAX Stoxx Europe 600 MSCI Germany GPR 250 FTSE EPRA/NAREIT Europe 1.4% 0.2% 1.3% 1.1% 7.3% VNA share price performance since IPO vs. DAX and EPRA Europe Index Vonovia DAX FTSE EPRA/NAREIT Dev. Europe + 85 % + 41 % + 33 % 90 Source: Factset page 65
66 Increasing level of perception and judgment Three Valuation Layers with Different Volatilities High degree of stability and predictability of underlying business (layer 1) and portfolio valuation (layer 2) is not reflected in share price development (layer 3), as equity markets appear to apply valuation parameters that are substantially less material for Vonovia s operating performance. Layer Development Main drivers 3 Stock Market Valuation (Stock price per share) 2 Portfolio Valuation (Adj. NAV per share) IPO Only partly driven by performance and portfolio valuation Negatively correlated to bund yields and interest rates Subject to additional macro considerations Market prices for assets are much more relevant than interest rate levels Additional material factors are supply/ demand imbalance and sustainable market rent growth 1 Cash Flow (FFO * & Dividend per share) page ~ ~70% (E) FFO DPS Regulated market No cluster risk due to high degree of granularity Robust business model 1 To be proposed to the Annual General Shareholder Meeting. 2 based on eop number of shares and excluding impact from conwert acquisition. *Please see Glossary / Sources in the Appendix for further information.


67 Extension - Innovation as Growth Driver Continuous flow of innovative projects that are all immediately linked to the apartment or customer/rental contract. Optimize Apartments Upgrade buildings (energetic modernization) Heating system modernizations Curb appeal Bathroom modernization Floor additions Kitchens Energy generation Modular construction Safety Parcel boxes E- mobili ty Digital access Parking Smart Home Multimedia Craftsmen service Condo management Sub- Metering Insurance Energy distribution Old-age assistance Up and running New Business Proof of concept page 67


68 Impressions Frankfurt, Odenwaldstr. 2-4b Frankfurt, Am Lindenbaum 15-85A Frankfurt, Friedlebenstr. 32 Essen, Meistersingerstrasse 20-24C page 68


69 Impressions Dortmund, Binsengarten 8-24 A Dresden, Kipsdorfer Strasse, Dresden, Niederseidewitzer Weg, Dresden, Berzdorfer Str page 69


70 Impressions Essen, Feldwiese Dortmund, Doerwerstr, Dortmund, Lippmannstr page 70 Essen, Bonnekampstr B


71 Optimize Apartment Before After page 71


72 Optimize Apartment Before After page 72


73 Upgrade Building Before After page 73


74 Upgrade Building Before After page 74


75 Upgrade Building Before After page 75


76 Modernization - Impressions Before After Addition of new floor plus modernization investment Addition of new floor plus modernization investment Upgrade Building Upgrade Building page 76

77 Floor Addition page 77


78 Floor Addition page 78


79 Modular Construction Pictures taken at the production site of our cooperation partner Modulbau Lingen. page 79


80 Modular Construction page 80

81 Modular Construction page 81


82 Modular Construction page 82
83 Neighbourhood Development Eltingviertel page 83


84 TGS Van page 84
Company Presentation December 2016
 Company Presentation December 2016 Market German Residential Safe Harbor and Low Risk German residential market: important pillar of the German economy With a GDP contribution of more than 430bn the German
Company Presentation Non-deal Asia Roadshow February 7-10, 2017
 Company Presentation Non-deal Asia Roadshow February 7-10, 2017 Market Company Strategy & Execution page 2 2006 2007 2008 2009 2010 2011 2012 2013 2014 2015 2016 2006 2007 2008 2009 2010 2011 2012 2013
Deutsche Wohnen SE.» 9M 2017 results. Conference Call, 14 November 2017
 Deutsche Wohnen SE» 9M 2017 results Conference Call, 14 November 2017 1 » Agenda 1 Highlights 9M 2017 2 Portfolio 3 Financials 4 Appendix 2 » Highlights 9M 2017 Strong operating business L-f-l rental growth
Q Results. Conference Call Dusseldorf, 30 April Rolf Buch, CEO Dr. A. Stefan Kirsten, CFO
 Deutsche Annington Immobilien SE Q1 2014 Results Conference Call Dusseldorf, 30 April 2014 Rolf Buch, CEO Dr. A. Stefan Kirsten, CFO Deutsche Annington Immobilien SE 30.04.2014 Presenting today Rolf Buch
9M 2013 Results. November 6, 2013
 Deutsche Annington Immobilien SE 9M 2013 Results November 6, 2013 Deutsche Annington Immobilien SE 06.11.2013 Disclaimer Confidentiality Declaration This presentation has been specifically prepared by
13 th Kepler Cheuvreux German Corporate Conference Frankfurt, 22 January 2014 Rolf Buch, CEO
 1 Syndicate Analyst Presentation May 2013 13 th Kepler Cheuvreux German Corporate Conference Frankfurt, 22 January 2014 Rolf Buch, CEO Deutsche Annington: Innovation leader based on a long-term vision,
9M 2018 RESULTS 09 NOVEMBER 2018 TLG IMMOBILIEN AG 9M 2018 RESULTS
 TLG IMMOBILIEN AG 9M 208 RESULTS DISCLAIMER This presentation includes statements, estimates, opinions and projections with respect to anticipated future performance of TLG IMMOBILIEN ("Forward-Looking
Conference call presentation Q
 Conference call presentation Q1 2018 2018 Content 2 I. TAG highlights Q1 2018 II. TAG financials Q1 2018 III. TAG portfolio Q1 2018 IV. TAG outlook FY 2018 V. Appendix 3 5 12 16 19 Portfolio details, vacancy
Interim Financial Report Vonovia SE
 Interim Financial Report Vonovia SE for the first quarter of 2016 Key Figures in million Key Financial Figures 3M 2016 3M 2015 Change in % Rental income 392.0 263.6 48.7 Adjusted EBITDA Rental 269.0 177.1
Quarterly Statement A S O F
 Quarterly Statement AS OF KEY FACTS Q3 / 2017 T 1 Key facts RESULTS OF OPERATIONS Q3 2017 Q3 2016 + / % / bp 01.01. 01.01. 30.09.2016 Rental income million 134.7 131.9 2.1 398.4 381.3 4.5 Net rental and
CONDENSED INTERIM CONSOLIDATED FINANCIAL STATEMENTS
 CONDENSED INTERIM CONSOLIDATED FINANCIAL STATEMENTS H1JUNE 30, 2015 BOARD OF DIRECTORS REPORT CONDENSED INTERIM CONSOLIDATED FINANCIAL STATEMENTS JUNE 30, 2015 1 CONTENT Board of Directors Report 2-31
Company Presentation. January 2018
 Company Presentation January 2018 Disclaimer This document is for informational purposes only. This document is not intended to form the basis of any investment decision and should not be considered as
Vonovia Company Presentation. Vonovia Company Presentation October 18, 2017
 . Agenda 1 Who we are. Page 2 Vonovia. Germanys Leading Residential Real Estate Company. Management of 353,000 apartments in our possession. 1 million tenants nationwide. 13.5 years average tenure. Average
Deutsche Wohnen AG.» Company presentation. September 2012
 Deutsche Wohnen AG» Company presentation September 2012 1 » Agenda 1 Major highlights in H1/2012 2 BauBeCon acquisition 3 Proven asset and portfolio management track record in connection with the right
UBS Global Real Estate CEO/CFO Conference. December 1/2, 2015
 UBS Global Real Estate CEO/CFO Conference December 1/2, 2015 01 ADO OVERVIEW AND INVESTMENT HIGHLIGHTS Overview ADO the pure play Berlin residential specialist Investment highlights 1 2 3 Berlin residential
P R E S E N T A T I O N H1/ A U G U S T
 P R E S E N T A T I O N H1/2014 0 5 A U G U S T 2 0 1 4 D I S CLAIMER The statements contained herein may include statements of future expectations and other forward-looking statements that are based on
CONFERENCE CALL. 9M 2015 Results
 CONFERENCE CALL 9M 2015 Results 13.11.2015 9M 2015 SHOPPING CENTERS Retail turnover 9M 2015 1) Retail sector % change rent-to-sales ratio in % % of sales % of space Department stores -2.3 6.0 7.8 13.5
NINE MONTHS FINANCIAL RESULTS NOVEMBER 19, 2015
 NINE MONTHS FINANCIAL RESULTS NOVEMBER 19, 2015 01 ADO OVERVIEW AND INVESTMENT HIGHLIGHTS Overview ADO the pure play Berlin residential specialist Investment highlights 1 2 3 Berlin residential pure play
Strategic Financing of a Listed Company
 Strategic Financing of a Listed Company Christian Hillermann ADLER Real Estate AG Dr. Sven Janssen Oddo Seydler Bank AG Contents ADLER Real Estate AG company presentation 1. Company highlights 2. Event
CPI PROPERTY GROUP reports financial information for the first quarter of 2018
 Press Release Luxembourg, 31th May 2018 CPI PROPERTY GROUP reports financial information for the first quarter of 2018 CPI PROPERTY GROUP (hereinafter CPIPG, the Company or together with its subsidiaries
FINANCIAL STATEMENTS. For the year ended December 31, 2013
 2013CONSOLIDATED FINANCIAL STATEMENTS For the year ended December 31, 2013 BOARD OF DIRECTORS REPORT REPORT OF THE RÉVISEUR D ENTREPRISES AGRÉÉ (INDEPENDENT AUDITOR) OF COMPREHENSIVE INCOME OF FINANCIAL
Capital Markets Day 2016 / Essen / June 6 th Modernization Frederic Neumann / Managing Director Vonovia South
 Capital Markets Day 2016 / Essen / June 6 th 2016 Modernization Frederic Neumann / Managing Director Vonovia South Agenda Portfolio strategy & modernization track record From a single product program to
LEG Immobilien AG H1 Results 2015
 LEG Immobilien AG H1 Results 2015 14 th August 2015 Disclaimer While the company has taken all reasonable care to ensure that the facts stated in this presentation are accurate and that the opinions contained
CONFERENCE Call FY2017 Preliminary Results 6 MARCH 2018
 CONFERENCE Call FY07 Preliminary Results 6 MARCH 08 SHOPPING CENTERS # Retail turnover 07 RETAIL SECTOR % change in 07 rent-to-sales ratio in % DEPARTMENT STORES -0.7 6. 7.4 3. FOOD -.5 7.6 8.9 6.4 FASHION
DEMIRE Deutsche Mittelstand Real Estate AG. Fiscal Year 1 January 31 December 2017
 DEMIRE Deutsche Mittelstand Real Estate AG Third Quarter 2017 Interim Statement Fiscal Year 1 January 31 December 2017 Foreword of the Executive Board Dear Shareholders, It is with great satisfaction that
PRELIMINARY INDICATION FOR FULL YEAR 2012 RESULT
 PRELIMINARY INDICATION FOR FULL YEAR 2012 RESULT JANUARY 2013 AGENDA OVERVIEW OF EXTRAORDINARY EFFECTS AND IMPACT ON 2012 RESULT 1 2 EBT TARGET OF 50 MIO IN 2012 WRITE DOWN OF GOODWILL AND INTANGIBLE ASSETS
INTERIM FINANCIAL REPORT. First Quarter of 2014
 INTERIM FINANCIAL REPORT First Quarter of 2014 million 3M 2014 3M 2013 Change (%) Key Figures Rental income 180.5 182.0 0.8 Adjusted EBITDA Rental 109.5 109.3 0.2 Income from disposal of properties 60.2
Deutsche Wohnen SE.» Full year results Conference Call, 23 March 2018
 Deutsche Wohnen SE» Full year results 2017 Conference Call, 23 March 2018 1 » Table of content 1 Highlights 2017 2 Portfolio & valuation update 3 Financials 4 Guidance 5 Appendix 2 » Highlights FY 2017
Interim Financial Report Vonovia SE
 Interim Financial Report Vonovia SE for the first half-year of 2016 Key Figures in million Key Financial Figures H1 2016 H1 2015 Change in % Rental income 774.7 628.0 23.4 Adjusted EBITDA Rental 535.6
CORESTATE Capital Group
 CORESTATE Capital Group Q3 2017 Earnings Presentation November 2017 Disclaimer This presentation contains forward-looking statements that involve a number of risks and uncertainties. Such statements are
FIRST QUARTER 2017 INTERIM STATEMENT
 DEMIRE Deutsche Mittelstand Real Estate AG FIRST QUARTER 2017 INTERIM STATEMENT Fiscal Year January 1 Dezember 31 2017 Foreword of the Executive Board Dear Shareholders, With the quarterly statement for
Growing Assets 9M 2013 Q1-Q3 2011
 2013 Growing Assets 9M 2013 Q1-Q3 2011 CONTENT Content 22 I. TAG Highlights 3 II. TAG FFO 2013 / Guidance 2014 5 III. TAG Strategy: Growth and Margins 7 IV. TAG Portfolio: Regions / Achievements / Capex
Deutsche Wohnen SE.» Q results. Conference Call, 15 May 2018
 Deutsche Wohnen SE» Q1 2018 results Conference Call, 15 May 2018 1 » Agenda 1 Highlights Q1 2018 2 Portfolio 3 Financials 4 Appendix 2 » Highlights Q1 2018 Operating business remains strong L-f-l rental
12 th Annual General Meeting. + Vienna, 8 May 2013
 12 th Annual General Meeting + Vienna, 8 May 2013 conwert is a fully integrated real estate company focusing on residential properties and apartment buildings in Germany and Austria. This focus is complemented
Company presentation November 2017
 Company presentation November 2017 1 CONTENT Content I. TAG overview and strategy 3 2 II. III. IV. TAG portfolio TAG services business TAG return on capex 7 12 16 V. TAG acquisitions and disposals 21 VI.
CAPTURE CHANCES DRIVE INNOVATION
 CAPTURE CHANCES DRIVE INNOVATION LEG Immobilien AG 10 August 2018 H1-2018 Results Disclaimer While the company has taken all reasonable care to ensure that the facts stated in this presentation are accurate
DEMIRE Deutsche Mittelstand Real Estate AG Conference Call Full Year Results 2017
 DEMIRE Deutsche Mittelstand Real Estate AG Conference Call Full Year Results 2017 26 Disclaimer This document is for informational purposes only. This document is not intended to form the basis of any
INTERIM REPORT ON THE 3RD QUARTER GROWING CASHFLOWS
 INTERIM REPORT 2017 ON THE 3RD QUARTER GROWING CASHFLOWS 2 Group financials Group financials 3 GROUP FINANCIALS in EUR m 01 / 01 09 / 30 / 2017 01 / 01 09 / 30 / 2016 Income statement key figures Rental
Prime Office REIT-AG EXCELLENCE IN GERMAN REAL ESTATE. Roadshow FY 2011 results Zurich, London, Frankfurt, Brussels, Paris and Amsterdam April 2012
 Prime Office REIT-AG EXCELLENCE IN GERMAN REAL ESTATE Roadshow FY 2011 results Zurich, London, Frankfurt, Brussels, Paris and Amsterdam April 2012 0 Disclaimer The statements contained herein may include
CAPTURE CHANCES DRIVE INNOVATION
 CAPTURE CHANCES DRIVE INNOVATION LEG Immobilien AG 9 November 2018 9M-2018 Results Disclaimer While the company has taken all reasonable care to ensure that the facts stated in this presentation are accurate
FINANCIAL RESULTS Q3 2018
 FINANCIAL RESULTS Q3 2018 November 14, 2018 OVERVIEW & INVESTMENT HIGHLIGHTS Chapter 01 Kapitel Titel ADO THE PURE PLAY BERLIN RESIDENTIAL SPECIALIST Investment highlights 1 Berlin residential pure play
CONFERENCE CALL HALF-YEAR FINANCIAL REPORT AUGUST 2017
 CONFERENCE CALL HALF-YEAR FINANCIAL REPORT 207 6 AUGUST 207 RETAIL TURNOVER H 207 RETAILERS Retail sector % change to 206 rent-to-sales ratio in % % of sales % of space Department stores -.4 6.3 7.3 3.0
Growing Assets Q Figures
 2014 Growing Assets Q1 2014 Figures CONTENT Content 22 I. TAG Highlights FY 2013 / Q1 2014 3 II. TAG Strategy/ Efficiency: Growth and Margins 5 III. TAG Achievements: Vacancy reduction / rent increases
BERLINSIDERS HALF YEAR FINANCIAL REPORT
 2 0 1 7 BERLINSIDERS HALF YEAR FINANCIAL REPORT 2017 KEY FIGURES HALF YEAR FINANCIAL REPORT 2017 KEY FIGURES KEY BALANCE SHEET FIGURES In EUR thousand Jun 30, 2017 Dec 31, 2016 Fair value of properties
Next Generation Real Estate. HY 2008 Figures. Colonia Real Estate AG HY 2008 Figures 15 th of August 2008 Cologne
 Next Generation Real Estate HY 2008 Figures Colonia Real Estate AG HY 2008 Figures 15 th of August 2008 Cologne Focused and Integrated Business Model Colonia Real Estate AG Investments Management Principal
2017 HALF YEAR 25 JULY 2017
 2017 HALF YEAR RESULTS 25 JULY 2017 Strong financial results and robust balance sheet Driving performance through operational excellence and disciplined capital allocation High quality pipeline of growth
CORESTATE Capital Group A Leading Real Estate Investment Manager
 CORESTATE Capital Group A Leading Real Estate Investment Manager H1 2017 Earnings Presentation 16 August 2017 Page 1 CORESTATE Capital Holding S.A. Disclaimer This presentation contains forward-looking
CAPTURE CHANCES DRIVE INNOVATION
 CAPTURE CHANCES DRIVE INNOVATION LEG Immobilien AG 8May 2018 Q1-2018 Results Disclaimer While the company has taken all reasonable care to ensure that the facts stated in this presentation are accurate
FINANCIAL RESULTS Q2 2018
 FINANCIAL RESULTS Q2 2018 August 15, 2018 OVERVIEW & INVESTMENT HIGHLIGHTS Chapter 01 Kapitel Titel ADO THE PURE PLAY BERLIN RESIDENTIAL SPECIALIST Investment highlights A focused residential portfolio(,4)
Continuing the growth story: Acquisition of Brack Capital Properties. February 2018
 Continuing the growth story: Acquisition of Brack Capital Properties February 2018 Disclaimer This document has been prepared by ADLER Real Estate Aktiengesellschaft (the Company ) and is the responsibility
Conference Call 1st quarter 2018
 Conference Call 1st quarter 2018 Dr. Rüdiger Mrotzek Hans Richard Schmitz Dr. Rüdiger Mrotzek Hans Richard Schmitz 25 April 2018 First quarter 2018 Highlights Berlin Positive operational business development
CONFERENCE CALL FY2016 PRELIMINARY RESULTS 8 MARCH 2017
 CONFERENCE CALL FY2016 PRELIMINARY RESULTS 8 MARCH 2017 RETAIL TURNOVER 2016 1 RETAILERS Retail sector % change in 2016 rent-to-sales ratio in % % of sales % of space Department stores -0.8 6.1 7.8 13.5
Company presentation April 2017
 Company presentation April 2017 CONTENT Content I. TAG overview and strategy 3 2 II. III. IV. TAG portfolio TAG return on capex TAG acquisitions and disposals 7 13 18 V. TAG financing structure 22 VI.
Q1 Results Conference Call May 29, 2008
 Q1 Results 2008 Conference Call May 29, 2008 Agenda Operational Update Financial Highlights Outlook 2 Agenda Operational Update Financial Highlights Outlook 3 Portfolio Overview Deutsche Wohnen Group Residential
Half Year Results Sirius Real Estate Limited Half Year Results 30 September 2015
 Half Year Results 2015 Sirius Real Estate Limited Half Year Results 30 September 2015 Who Are We We are the largest branded provider of mixed-use conventional and flexible workspace in Germany 2 Highlights
Trends in the Secondary Markets
 Trends in the Secondary Markets The Hidden Champions The Secondary Markets 1 1 Due to the high demand pressure and associated price rises in established office markets, smaller markets are becoming more
THREE MONTH FINANCIAL RESULTS 2016 MAY 19, 2016
 THREE MONTH FINANCIAL RESULTS 20 MAY 19, 20 01 OVERVIEW & INVESTMENT HIGHLIGHTS Overview ADO the pure-play Berlin residential specialist Investment highlights Key portfolio metrics (end of Q1 20) 1 2 3
CONDENSED INTERIM CONSOLIDATED FINANCIAL STATEMENTS FOR THE NINE MONTH PERIOD ENDED SEPTEMBER 30, 2016 Q Cologne
 CONDENSED INTERIM CONSOLIDATED FINANCIAL STATEMENTS FOR THE NINE MONTH PERIOD ENDED SEPTEMBER 30, 2016 Q3 2016 Cologne Bremen CONDENSED INTERIM CONSOLIDATED FINANCIAL STATEMENTS FOR THE NINE MONTH PERIOD
First Quarter 2017 Interim Statement
 DEMIRE Deutsche Mittelstand Real Estate AG First Quarter 2017 Interim Statement Fiscal Year January 1 Dezember 31 2017 Foreword of the Executive Board Dear Shareholders, With the quarterly statement for
LEG Immobilien AG Q1 Results 2014
 LEG Immobilien AG Q1 Results 2014 15 th May 2014 Disclaimer While the company has taken all reasonable care to ensure that the facts stated in this presentation are accurate and that the opinions contained
CONFERENCE CALL QUARTERLY STATEMENT 9M NOVEMBER 2017
 CONFERENCE CALL QUARTERLY STATEMENT 9M 207 6 NOVEMBER 207 RETAIL TURNOVER 9M 207 Retail sector % change to 206 rent-to-sales ratio in % % of sales % of space Department stores -0.5 6.2 7.4 3. Food -0.4
Condensed Interim Consolidated Financial Statements
 Condensed Interim Consolidated Financial Statements FOR THE NINE MONTH PERIOD ENDED SEPTEMBER 30, 2018 Berlin Munich Condensed Interim Consolidated Financial Statements FOR THE NINE MONTH PERIOD ENDED
Group interim report as of 30 June Creating today the city of tomorrow
 Creating today the city of tomorrow Contents 2 Group key figures 3 Group interim management report 18 Group interim financial statements 35 Further information 2 Deutsche Wohnen SE Group key figures Group
Deutsche Annington Immobilien SE
 Deutsche Annington Immobilien SE Roadshow Frankfurt, 3 rd November 2014 Rolf Buch, CEO Dr. A. Stefan Kirsten, CFO Contents German Market 3 Operating performance 9M 2014 and Outlook 5 Group strategy 13
Interim report, January to March 2016
 Akelius Residential Property AB (publ) Interim report, January to March 2016 Rental income grew by 6.8 percent to SEK 1,115 million Operating surplus grew by 4.9 percent to SEK 547 million Change in property
Housing as a commodity? Operative behavior of German publicly listed housing organizations Presenter: Prof. Dr. Stefan Kofner, MCIH Tirana, 05.
 Housing as a commodity? Operative behavior of German publicly listed housing organizations Presenter: Prof. Dr. Stefan Kofner, MCIH Tirana, 05. September, 2017 1. Publicly listed housing organizations
Germany Property Refocus on Fundamentals; Initiating on German Residential Property
 INDUSTRY NOTE Germany Property & Real Estate Germany Property Germany Property Refocus on Fundamentals; Initiating on German Residential Property Key Takeaway With the sector down by 2 from peak valuations
Performance at a glance
 Interim Report 1-9/2014 Usable space by usage type *) as of Performance at a glance 73.3% Residential 26.7% Commercial *) Fair value allocation as commercial or residential is based on the majority use
2015 CONSOLIDATED FINANCIAL STATEMENTS FOR THE YEAR ENDED DECEMBER 31,
 2015 CONSOLIDATED FINANCIAL STATEMENTS FOR THE YEAR ENDED DECEMBER 31, CONTENT Board of Directors Report 02-45 Independent Auditors Report 46-47 Consolidated statement of comprehensive income 48-49 Consolidated
Deutsche Wohnen SE. Full Year Results 2018 Conference Call 26 March 2019
 Deutsche Wohnen SE Full Year Results 2018 Conference Call 26 March 2019 Agenda 01 02 03 04 Highlights Market and Portfolio Financials and Outlook Appendix deutsche-wohnen.com 2 Highlights FY 2018 Operating
CPI PROPERTY GROUP first-time investment grade rating by Moody s, issuance of Eurobonds and initiation of large-scale refinancing operation
 Press Release Luxembourg, 27 November 2017 CPI PROPERTY GROUP first-time investment grade rating by Moody s, issuance of Eurobonds and initiation of large-scale refinancing operation Capital markets and
INTERIM FINANCIAL REPORT. Third Quarter of 2014
 INTERIM FINANCIAL REPORT Third Quarter of 2014 DEUTSCHE ANNINGTON IMMOBILIEN SE INTERIM FINANCIAL REPORT FOR THE THIRD QUARTER OF 2014 CONTENTS 1 Key Figures 9M 2014 9M 2013 Change (%) million Rental income
Deutsche Wohnen SE.» Company presentation. November 2017
 Deutsche Wohnen SE» Company presentation November 2017 1 » Content 1 Deutsche Wohnen at a Glance 2 German Residential Real Estate Market 3 Portfolio and Business Segments 4 Key Financials 5 Strategic Focus
Summary 1-2. Chairman's and Managing Director's report 3-9. Independent auditor s review report 10
 REPORT AND ACCOUNTS June 2018 INDEX Page Summary 1-2 Chairman's and Managing Director's report 3-9 Independent auditor s review report 10 Condensed Consolidated Statements of Financial Position 11-12 Condensed
HALF YEAR REPORT January 1 June 30, 2007
 HALF YEAR REPORT January 1 June 30, 2007 CONTENTS Summary 3 Interim Management Report / Results and Core Data 4 Deutsche Wohnen Shares 7 Merger with the GEHAG Group 8 Outlook 11 Key Figures 12 Consolidated
Content 1. Management report for the Unaudited Interim Financial Report Unaudited Interim Financial Statements a. Balance Sheet as at June 30,
 Vonovia Finance B.V. (formerly: Deutsche Annington Finance B.V.), Amsterdam Unaudited Interim Financial Report 2015 Content 1. Management report for the Unaudited Interim Financial Report 2015 2. Unaudited
TLG S TENDER OFFER FOR WCM: BUILDING THE LEADING GERMAN COMMERCIAL REAL ESTATE PLATFORM
 MAY 207 TLG IMMOBILIEN AG TLG S TENDER OFFER FOR WCM: BUILDING THE LEADING GERMAN COMMERCIAL REAL ESTATE PLATFORM DISCLAIMER This presentation is for information purposes only and neither constitutes an
conwert Immobilien Hold (unchanged) Target: Euro (unchanged)
 Target: Euro (unchanged)") conwert Immobilien Hold (unchanged) Target: Euro 16.16 (unchanged) 05 May 17 Price (Euro) 16.50 52 weeks range 17.39 / 12.51 Record year 2016 with Euro 80m FFO I and 50% increase in net profit Hold and
conwert Immobilien Hold (unchanged) Target: Euro 16.16 (unchanged) 05 May 17 Price (Euro) 16.50 52 weeks range 17.39 / 12.51 Record year 2016 with Euro 80m FFO I and 50% increase in net profit Hold and
CORESTATE Capital. Preliminary Results FY Management Presentation. 20 February 2018
 CORESTATE Capital Management Presentation Preliminary Results FY 2017 20 February 2018 Disclaimer This presentation contains forward-looking statements that involve a number of risks and uncertainties.
CAPTURE CHANCES DRIVE INNOVATION
 CAPTURE CHANCES DRIVE INNOVATION LEG Immobilien AG 8 March 2018 FY-2017 Results Disclaimer While the company has taken all reasonable care to ensure that the facts stated in this presentation are accurate
10th Annual General Meeting. Vienna, 20 May 2011
 10th Annual General Meeting Vienna, 20 May 2011 Market overview and company development 2010 Earnings performance and balance sheet indicators 2010 Implementation of strategy Overview 1 st Quarter 2011
BUWOG GROUP COMPANY PRESENTATION DEUTSCHE BANK GERMAN, SWISS & AUSTRIAN CONFERENCE BERLIN 8 JUNE 2016
 BUWOG GROUP COMPANY PRESENTATION DEUTSCHE BANK GERMAN, SWISS & AUSTRIAN CONFERENCE BERLIN 8 JUNE 2016 HIGHLIGHTS 9M 2015/16 Highlights BUSINESS MODEL AUSTRIA & GERMANY ASSET MANAGEMENT RESIDENTIAL ONLY
CORESTATE Capital Holding Company presentation. January 2018
 CORESTATE Capital Holding Company presentation January 2018 Disclaimer This presentation contains forward-looking statements that involve a number of risks and uncertainties. Such statements are based
Memorandum of Understanding Signed with France s Largest Residential Landlord Société Nationale Immobilière (SNI) Assessing the Potential of European
 Assessing the Potential of European") Memorandum of Understanding Signed with France s Largest Residential Landlord Société Nationale Immobilière (SNI) Executive Summary Vonovia has signed a Memorandum of Understanding (MoU) with SNI, the
Memorandum of Understanding Signed with France s Largest Residential Landlord Société Nationale Immobilière (SNI) Executive Summary Vonovia has signed a Memorandum of Understanding (MoU) with SNI, the
ANNUAL RESULTS 2015 MARCH 22, 2016
 ANNUAL RESULTS 2015 MARCH 22, 2016 01 OVERVIEW & INVESTMENT HIGHLIGHTS Overview ADO the pure-play Berlin residential specialist Investment highlights 1 2 3 4 Berlin residential pure play with a 1.5bn quality
DEMIRE Deutsche Mittelstand Real Estate AG
 DEMIRE Deutsche Mittelstand Real Estate AG First in Secondary Locations April 2017 DEMIRE Deutsche Mittelstand Real Estate AG April 2017 Agenda and Presentation Team Section Page Company Overview 4 Andreas
CORESTATE Capital. Company Presentation. February 2018
 CORESTATE Capital Company Presentation February 2018 Disclaimer This presentation contains forward-looking statements that involve a number of risks and uncertainties. Such statements are based on a number
CONFERENCE CALL Quarterly Statement 3M MAY 2018
 CONFERENCE CALL Quarterly Statement 3M 08 6 MAY 08 SHOPPING CENTERS # Retail turnover 3M 08 RETAIL SECTOR % change in 08 rent-to-sales ratio in % DEPARTMENT STORES +. 6. 6.4 3. FOOD +.7 7.4 9.7 7.0 FASHION
CONSOLIDATED FINANCIAL STATEMENTS 2016
 CONSOLIDATED FINANCIAL STATEMENTS 2016 /Leipzig 1 2 /Halle CONSOLIDATED FINANCIAL STATEMENTS FOR THE YEAR ENDED DECEMBER 31, 2016 IMPRINT Publisher: Grand City Properties S.A. 24, Avenue Victor Hugo L-1750
Retail: Jacob-Winter-Platz, Dresden. Interim statement Q3/2017. WCM Beteiligungs- und Grundbesitz-Aktiengesellschaft [1]
![Retail: Jacob-Winter-Platz, Dresden. Interim statement Q3/2017. WCM Beteiligungs- und Grundbesitz-Aktiengesellschaft [1]](/thumbs/96/127570971.jpg "Retail: Jacob-Winter-Platz, Dresden. Interim statement Q3/2017. WCM Beteiligungs- und Grundbesitz-Aktiengesellschaft [1]") Retail: Jacob-Winter-Platz, Dresden Interim statement Q3/2017 WCM Beteiligungs- und Grundbesitz-Aktiengesellschaft [1] Consolidated key figures (IRFS) as at 30 September 2017 Revenue and income 1 January
Retail: Jacob-Winter-Platz, Dresden Interim statement Q3/2017 WCM Beteiligungs- und Grundbesitz-Aktiengesellschaft [1] Consolidated key figures (IRFS) as at 30 September 2017 Revenue and income 1 January
Fiscal year 2011 off to a strong start
 Fiscal year 2011 off to a strong start Peter Löscher, President and CEO Joe Kaeser, CFO Q1 FY 11 Analyst call January 25, 2011 Copyright Siemens AG 2011. All rights reserved. Safe Harbour Statement This
TAG Immobilien AG Q1-Q TAG I 1
 TAG Immobilien AG Q1-Q3 2011 Q1-Q3 2011 TAG I 1 Content I. Group overview page 3-5 TAG investment case, highlights Q3, Q4 Combined entity TAG Colonia II. Portfolio page 6-21 Overview Residential Salzgitter
Kempen conference. Amsterdam 30 May 2013
 Kempen conference Amsterdam 30 May 2013 Company snapshot Description Dutch REIT: NSI is a real estate asset management company and qualifies as fiscal investment institution under Dutch law (REIT) Full
Digital Realty Reports Second Quarter 2016 Results
 NEWS RELEASE Digital Realty Reports Second Quarter 2016 Results 7/28/2016 SAN FRANCISCO, July 28, 2016 /PRNewswire/ -- Digital Realty Trust, Inc. (NYSE: DLR), a leading global provider of data center,
0/0/0 255, 255, /60/ /221/221 30/60/ /153/ /177/ /217/47 116/222/ /204/ /62/152 0/159/147 M AY 17,
 M AY 17, 2017 1 2 ADO THE PURE PLAY BERLIN RESIDENTIAL SPECIALIST Investment highlights 1 2 3 4 Berlin residential pure play with a 2.3bn quality portfolio Efficient, fully integrated and scalable platform
Analyst Conference. Preliminary figures February 15, Dr. Eric Strutz Chief Financial Officer
 Analyst Conference Preliminary figures 2005 February 15, 2006 Dr. Eric Strutz Chief Financial Officer Highlights of 2005 Q4 `05 vs Q4 `04 FY 2005 vs 2004 Operating profit, 466 2.8 fold 1,717 +70% Net profit,
ACCENTRO Real Estate AG
 ACCENTRO Real Estate AG Germany s Market Leader in Residential Property Privatisation Company Presentation, 6th November 2018 Interim Financial Report for the 3rd quarter 2018, 30th September 2018 ACCENTRO
Retail: Potsdamer Strasse 51, Ludwigsfelde. Quarterly statement Q1/2017. WCM Beteiligungs- und Grundbesitz-Aktiengesellschaft
 Retail: Potsdamer Strasse 51, Ludwigsfelde Quarterly statement Q1/2017 WCM Beteiligungs- und Grundbesitz-Aktiengesellschaft WCM Key Figures (IFRS) as at 31 March 2017 1 January - 31 March 2017 1 January
S IMMO. Accumulate (old: Buy) Target: Euro (old: Euro 16.00)
 Target: Euro (old: Euro 16.00)") S IMMO Accumulate (old: Buy) Target: Euro 17.50 (old: Euro 16.00) 06 April 2018 Price (Euro) 16.50 52 weeks range 16.50 / 11.50 Key Data Country Austria Industry Real Estate Market Segment Prime Market
S IMMO Accumulate (old: Buy) Target: Euro 17.50 (old: Euro 16.00) 06 April 2018 Price (Euro) 16.50 52 weeks range 16.50 / 11.50 Key Data Country Austria Industry Real Estate Market Segment Prime Market
1Q2018 Results Presentation 10 May2018
 1Q2018 Results Presentation 10 May2018 Agenda About IREIT Global Key Highlights Portfolio Summary European Market Review Looking Ahead Appendix : Overview of Tikehau Capital 2 About IREIT Global About