Aggregate Supply and Demand Model
|
|
|
- Neil Hines
- 6 years ago
- Views:
Transcription
1 THE AGGREGATE MODEL
2 Aggregate Supply and Demand Model The AS-AD model helps us understand aggregate output (RGDP), employment, prices and the business cycle. Aggregate Demand shows the quantity of goods and services that households, firms, and the government want to buy at each price level. Aggregate Supply shows the quantity of goods and services that firms choose to produce and sell at each price level. Price Level 0 GDP Deflator LRAS SRAS AD Real GDP / Y quantity of aggregate output
3 Aggregate Demand
4 The Aggregate-Demand (AD) Curve The AD curve shows the quantity of goods & services that households, firms, the government, and foreigners want to buy at each price level. Y = C + I + G + Xn Inverse relationship between PL and Real GDP. If the price level: - Is high, real GDP is low - Is low real GDP is high Changes in price level cause a movement along the curve P 2 P 1 PL Y 2 Y 1 AD Y
5 The Slope of the AD Curve: Summary An increase in PL reduces the quantity of g&s demanded because: P 2 PL the wealth/real balance effect (C falls) P 1 the interest-rate effect (I falls) the net export/ exchange-rate effect (XN falls) Y 2 Y 1 AD Y
6 Why the AD Curve Slopes Downward PL The Wealth Effect / Real Balance Effect P 2 Suppose PL rises. The dollars people hold buy fewer g&s, so real wealth is lower. P 1 AD Result: C falls. Y 2 Y 1 Y
7 Why the AD Curve Slopes Downward The Interest-rate Effect Suppose PL rises. PL purchasing power decreases P 2 so people either save less or must borrow more to maintain their consumption reduction of the supply of P loanable money interest 1 rate rises ALSO, when the price level increases, lenders need to Y 2 charge higher nominal interest rates to get a REAL return on their loans. Higher interest rates Cand I falls. Y 1 AD Y
8 Why the AD Curve Slopes Downward The Net Export Effect / Exchange-Rate Effect Suppose PL rises. P 2 PL U.S. exports become more expensive to foreigners, who will then purchase fewer U.S. goods. Moreover, Americans buy more foreign goods as they now have become the cheaper substitute. P 1 Y 2 Y 1 AD Y Result: Xn falls.
9 Why the AD Curve Might Shift Any event that changes C, I, G, or Xn except a change in P will shift the AD curve. PL Example: A stock market boom makes households wealthier, C rises, the AD curve shifts right. A stock market crash makes households poorer, C falls, the AD curve shifts left. P 1 Y 1 AD 3 Y 2 AD 1 AD 2 Y
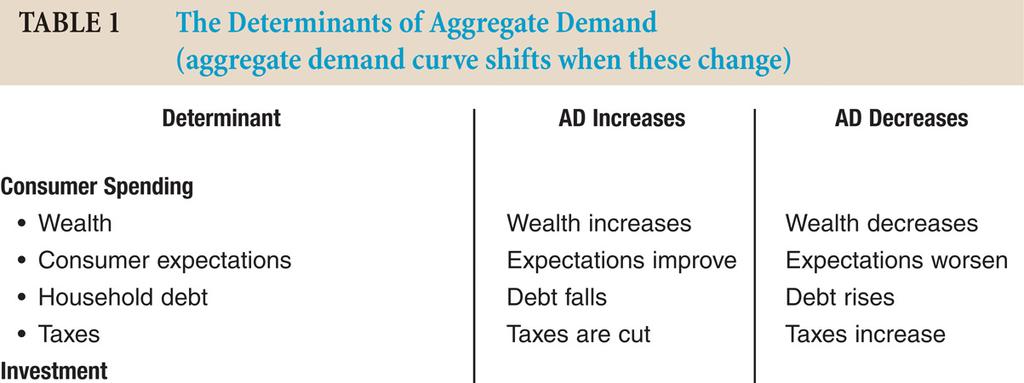
10 Why the AD Curve Might Shift Changes in C Income/wealth Changes in I PL Firms buy new computers, equipment, factories, etc. Changes in C and I Expectations, optimism/pessimism Interest rates Tax hikes/cuts/incentives AD 3 AD 1 AD 2 Y
11 Why the AD Curve Might Shift Changes in G Federal spending, e.g., defense State & local spending, e.g., roads, schools Changes in Xn PL Booms/recessions in countries that buy our exports Appreciation/depreciation of currency AD 3 AD 1 AD 2 Y
12
13 Aggregate Demand Consumers respond to high levels of debt by reducing their purchases of consumer goods. Price Level Component of AD? Consumption Change in AD? Increase or decrease? AD Resulting AD shift? 0 Real GDP
14 What happens to the AD curve if a ten-year-old investment tax credit expires. A. The AD curve shifts to the right. B. The AD curve shifts to the left. C. The economy moves down the AD curve. D. The economy moves up the AD curve Cengage Learning. All Rights Reserved. May not be copied, scanned, or duplicated, in whole or in part, except for use as permitted in a license distributed with a certain product or service or otherwise on a password-protected website for classroom use.
15 What happens to the AD curve if the U.S. exchange rate falls. A. The AD curve shifts to the right. B. The AD curve shifts to the left. C. The economy moves down the AD curve. D. The economy moves up the AD curve Cengage Learning. All Rights Reserved. May not be copied, scanned, or duplicated, in whole or in part, except for use as permitted in a license distributed with a certain product or service or otherwise on a password-protected website for classroom use.
16 What happens to the AD curve if a fall in prices increases the real value of consumers wealth. A. The AD curve shifts to the right. B. The AD curve shifts to the left. C. The economy moves down the AD curve. D. The economy moves up the AD curve Cengage Learning. All Rights Reserved. May not be copied, scanned, or duplicated, in whole or in part, except for use as permitted in a license distributed with a certain product or service or otherwise on a password-protected website for classroom use.
17 What happens State governments replace their sales taxes with new taxes on interest, dividends, and capital gains. A. The AD curve shifts to the right. B. The AD curve shifts to the left. C. The economy moves down the AD curve. D. The economy moves up the AD curve Cengage Learning. All Rights Reserved. May not be copied, scanned, or duplicated, in whole or in part, except for use as permitted in a license distributed with a certain product or service or otherwise on a password-protected website for classroom use.
18 Answers A. A ten-year-old investment tax credit expires. I falls, AD curve shifts left. B. The U.S. exchange rate falls. XN rises, AD curve shifts right. C. A fall in prices increases the real value of consumers wealth. Move down along AD curve (wealth-effect). D. State governments replace sales taxes with new taxes on interest, dividends, and capital gains. C rises, AD shifts right.
19 28 Aggregate Supply
20 The Aggregate-Supply (AS ) Curves The AS curve shows the quantity of goods and services that firms choose to produce and sell at each price level. AS is: upward-sloping in short run vertical in long run P LRAS SRAS In the SR, at least one input is fixed. Ex. wage contract and rental agreements. The LR is a period of time long enough for firms to change any of their inputs. Ex. Contracts can be renegotiated after they expire. Y
21 Short Run Aggregate Supply (SRAS) The SRAS curve is upward sloping. In the short run, nominal wages and resource prices will NOT increase ( sticky ) as price levels increase. If a firm makes 100 units that each sell for $1 and the only cost is $80 of labor. How much is profit? PL doubles and now the firm sells 100 units that sell for $2, TR=$200. How much is profit? P 2 P 1 P Y 1 Y 2 SRAS Y With higher profits, the firm has the incentive to increase production.
22 Change in Productivity Technology Human Capital skills, training, experience of workers Changes in Input Prices Why the SRAS Curve Might Shift Prices of domestic and imported resources Supply shocks Change in Actions of the Government (NOT Gov t Spending) Taxes/Subsidies Government Regulations P SRAS 3 Expectations for Inflation SRAS 1 SRAS 2 If suppliers think goods will sell at a higher price in the future, they will hold their inventory and the SRAS will shift left. Y


23 Shifts of the SRAS Factors That Shift the Aggregate Supply Curve 32 of 47 Shifts to the Right Increases in Aggregate Supply Lower costs lower input prices lower wage rates Economic growth more capital more labor technological change Public policy supply-side policies tax cuts deregulation Good weather Shifts to the Left Decreases in Aggregate Supply Higher costs higher input prices higher wage rates Stagnation capital deterioration Public policy waste and inefficiency over-regulation Bad weather, natural disasters, destruction from wars
24 Short-run Aggregate Supply Unions are more effective so that wage rates increase. Price Level AS Determinant of AS? Input costs or productivity? Change in AS? Increase or decrease? Resulting AS curve? 0 Real GDP


25 B A D A D B A A C A major increase in productivity. A 34
26 Why LRAS Is Vertical In the long run, wages and resource prices WILL increase as price levels increase. The firm has TR of $100 an uses $80 of labor and earns a profit of $20. P 2 PL LRAS In LR, if the PL doubles, workers will demand a COLA. P 1 Now TR=$200 and labor costs double to $160 Profit = $40, but REAL profit is unchanged. Y Y If REAL profit doesn t change the firm has no incentive to increase output. An increase in PL has no effect on the LRAS
27 LRAS determined by the economy s stocks of labor, capital, and natural resources, and the level of technology. The natural rate of output (Y N ) is the amount of output the economy produces when unemployment is at its natural rate. Y N is also called potential output or full-employment output. Why LRAS Is Vertical P 2 P 1 P LRAS Y N Y
28 Why the LRAS Curve Might Shift P LRAS 1 LRAS 2 Shifts when the quantity and quality of resources available change Discovery of new productive resources Increase in the population or labor force Improved production processes Growth of capital stock (investments made by firms). If LRAS shifts in either direction, SRAS shifts with it Y N Y N Y
29 The Long-Run Equilibrium In long-run equilibrium, AD = SRAS = LRAS, so PL LRAS PL = P E, SRAS Y = Y N, P E The economy is producing at the potential output and unemployment is at its natural rate. Y N AD Y
30 Short-run Equilibrium (its really disequilibrium) Short-run Equilibrium/Current Real GDP intersection of AD and SRAS Current output is greater than or less than the LRAS (potential GDP/full employment)
31 The Recessionary Gap The Short-Run Effects of Stable Aggregate Supply and a Decrease in Aggregate Demand The gap that exists whenever equilibrium real GDP per year is less than fullemployment real GDP as shown by the position of the LRAS curve P 1 P 2 P LRAS B A SRAS 1 AD 1 Y 2 Y N AD 2 Y
32 The Inflationary Gap The Effects of Stable Aggregate Supply with an Increase in Aggregate Demand The gap that exists whenever equilibrium real GDP per year is greater than fullemployment real GDP as shown by the position of the LRAS curve. Also causes demandpull inflation
33 Inflationary Gap Recessionary Gap
34 Cost-Push Inflation (Stagflation) Inflation caused by decreases in short-run aggregate supply P LRAS SRAS 2 P 2 B SRAS 1 P 1 A Y 2 Y N AD 1 Y
35
36
37
38 Practice Draw the AD-SRAS-LRAS diagram for the U.S. economy starting in a longrun equilibrium. A boom occurs in Canada. Use your diagram to determine the SR and LR effects on U.S. GDP, the price level, and unemployment.
39 Check for Understanding Describe the short -run effects of each of the following shocks on the aggregate price level and on aggregate output. a. The government sharply increases the minimum wage, raising the wages of many workers. b. Solar energy firms launch a major program of investment spending. c. Congress raises taxes and cuts spending. d. Severe weather destroys crops around the world.
Aggregate Supply and Demand Model
 THE AGGREGATE MODEL Aggregate Supply and Demand Model The AS-AD model helps us understand aggregate output (RGDP), employment, prices and the business cycle. Aggregate Demand shows the quantity of goods
Lesson 11 Aggregate demand and Aggregate Supply
 Lesson 11 Aggregate demand and Aggregate Supply Henan University of Technology Sino-British College Transfer Abroad Undergraduate Programme 0 In this lesson, look for the answers to these questions: What
Introduction. Over the long run, real GDP grows about 3% per year on average.
 Introduction Over the long run, real GDP grows about 3% per year on average. In the short run, GDP fluctuates around its trend. Recessions: periods of falling real incomes and rising unemployment Depressions:
Aggregate Demand and Aggregate Supply
 C H A P T E R 33 Aggregate Demand and Aggregate Supply Economics P R I N C I P L E S O F N. Gregory Mankiw Premium PowerPoint Slides by Ron Cronovich 2009 South-Western, a part of Cengage Learning, all
Aggregate Supply and Aggregate Demand
 Aggregate Supply and Aggregate Demand ECO 301: Money and Banking 1 1.1 Goals Goals Specific Goals Be able to explain GDP fluctuations when the price level is also flexible. Explain how real GDP and the
10. Oferta y demanda agregada
 10. Oferta y demanda agregada In this chapter, look for the answers to these questions: What are economic fluctuations? What are their characteristics? How does the model of aggregate demand and aggregate
Aggregate Demand & Aggregate Supply
 Aggregate Demand & Aggregate Supply 1 Aggregate Demand AD = C + I + G + NX The sum of planned consumption, investment, government, and net exports expenditures on final goods and services 2 Aggregate Demand
AP Econ Practice Test Unit 5
 DO NOT WRITE ON THIS TEST! AP Econ Practice Test Unit 5 Multiple Choice Identify the choice that best completes the statement or answers the question. 1. The marginal propensity to consume is equal to:
6. The Aggregate Demand and Supply Model
 6. The Aggregate Demand and Supply Model 1 Aggregate Demand and Supply Curves The Aggregate Demand Curve It shows the relationship between the inflation rate and the level of aggregate output when the
Equilibrium in AD-AS Model Problem Set
 Equilibrium in AD-AS Model Problem Set 1. Describe the short-run effects of each of the following shocks on the aggregate price level and on aggregate output. Illustrate using a properly-labeled graph.
Macroeonomics. 20 this chapter, Aggregate Demand and Aggregate Supply. look for the answers to these questions: Introduction. N.
 C H A T E R In 20 this chapter, look for the answers to these questions: Aggregate Demand and Aggregate Supply R I N C I L E S O F Macroeonomics N. Gregory Mankiw remium oweroint Slides by Ron Cronovich
Chapter 9 Introduction to Economic Fluctuations
 Chapter 9 Introduction to Economic Fluctuations facts about the business cycle how the short run differs from the long run an introduction to aggregate demand an introduction to aggregate supply in the
Aggregate Demand and Aggregate Supply
 Aggregate Demand and Aggregate Supply SLIDES PREPARED BY JUDITH SKUCE, GEORGIAN COLLEGE 1 In this chapter you will learn 8.1 What determines the shape of the aggregate demand curve and what factors shift
Archimedean Upper Conservatory Economics, October 2016
 Multiple Choice Identify the choice that best completes the statement or answers the question. 1. The marginal propensity to consume is equal to: A. the proportion of consumer spending as a function of
Introduction to Economic Fluctuations. Instructor: Dmytro Hryshko
 Introduction to Economic Fluctuations Instructor: Dmytro Hryshko 1 / 32 Outline facts about the business cycle how the short run differs from the long run an introduction to aggregate demand an introduction
Objectives AGGREGATE DEMAND AND AGGREGATE SUPPLY
 AGGREGATE DEMAND 7 AND CHAPTER AGGREGATE SUPPLY Objectives After studying this chapter, you will able to Explain what determines aggregate supply Explain what determines aggregate demand Explain macroeconomic
Aggregate Demand and Aggregate Supply
 Aggregate Demand and Aggregate Supply Aggregate Demand and Aggregate Supply The Learning Objectives in this presentation are covered in Chapter 20: Aggregate Demand and Aggregate Supply LEARNING OBJECTIVES
Econ 102 Discussion Section 8 (Chapter 12, 13) March 20, 2015
 March 20, 2015") Econ 102 Discussion Section 8 (Chapter 12, 13) March 20, 2015 The Multiplier and Shifting the Aggregate Expenditures Function The multiplier effect describes how changes in autonomous expenditures lead
Econ 102 Discussion Section 8 (Chapter 12, 13) March 20, 2015 The Multiplier and Shifting the Aggregate Expenditures Function The multiplier effect describes how changes in autonomous expenditures lead
Aggregate Supply and Demand
 Aggregate demand is the relationship between GDP and the price level. When only the price level changes, GDP changes and we move along the Aggregate Demand curve. The total amount of goods and services,
Name Date Per. Part 1: Aggregate Demand
 Name Date Per Part 1: Aggregate Demand 1. Aggregate means. When we use aggregates, we combine. Aggregate Demand is all the goods and services ( ) that buyers are willing and able to purchase at different
Lecture 22. Aggregate demand and aggregate supply
 Lecture 22 Aggregate demand and aggregate supply By the end of this lecture, you should understand: three key facts about short-run economic fluctuations how the economy in the short run differs from the
ophillips Curve Multiple Choice Identify the choice that best completes the statement or answers the question.
 ophillips Curve Multiple Choice Identify the choice that best completes the statement or answers the question. 1. If the natural rate of unemployment is 5%, and the actual rate of unemployment is 4%: A.
Karl Marx and Market Failure
 Unit 3 Karl Marx and Market Failure Krugman Module 74 pp. 723-726; Module 76 pp. 743-750; Module 77 pp.754-756; Module 78 pp. 761-770; Module 79 pp. 782-785 Modules 17-19 pp. 172 198 1 Greed is Good. -The
2.2 Aggregate demand and aggregate supply
 The business cycle Short-term fluctuations and long-term trend Explain, using a business cycle diagram, that economies typically tend to go through a cyclical pattern characterized by the phases of the
Aggregate to add up, aggregation usually implies that the things being added up are similar, but not exactly identical
 Macro Short-Run AS/AD Model Essentials Up to this point, our discussions of unemployment, inflation, output, and income have revolved around how we measure these indicators of economic performance. Now
Module 19 Equilibrium in the Aggregate Demand Aggregate Supply Model
 What you will learn in this Module: The difference between short-run and long-run macroeconomic equilibrium The causes and effects of demand shocks and supply shocks How to determine if an economy is experiencing
Lecture 12: Economic Fluctuations. Rob Godby University of Wyoming
 Lecture 12: Economic Fluctuations Rob Godby University of Wyoming Short-Run Economic Fluctuations Economic activity fluctuates from year to year. In some years, the production of goods and services rises.
Unit 3: Aggregate Demand and Supply and Fiscal Policy
 Unit 3: Aggregate Demand and Supply and Fiscal Policy 1 Aggregate Demand 2 What is Aggregate Demand? Aggregate means added all together. When we use aggregates we combine all prices and all quantities.
Chapter 9. Introduction to Economic Fluctuations
 Chapter 9 Introduction to Economic Fluctuations 0 1 Learning Objectives difference between short run & long run introduction to aggregate demand aggregate supply in the short run & long run see how model
Lecture 4. Short run economic fluctuations.
 MACROECONOMICS 2 Lecture 4. Short run economic fluctuations. The AD/AS model a short reminder. Joanna Siwińska - Gorzelak Time horizons in macroeconomics Time horizons in macroeconomics Long run: Prices
An Introduction to Basic Macroeconomic Markets
 An Introduction to Basic Macroeconomic Markets Full Length Text Part: Macro Only Text Part: 3 Chapter: 9 3 Chapter: 9 To Accompany Economics: Private and Public Choice 13th ed. James Gwartney, Richard
Introduction to Economic Fluctuations
 Chapter 9 Introduction to Economic Fluctuations slide 0 In this chapter, you will learn facts about the business cycle how the short run differs from the long run an introduction to aggregate demand an
Mankiw Chapter 10. Introduction to Economic Fluctuations. Introduction to Economic Fluctuations CHAPTER 10
 Mankiw Chapter 10 0 IN THIS CHAPTER, WE WILL COVER: facts about the business cycle how the short run differs from the long run an introduction to aggregate demand an introduction to aggregate supply in
Macroeconomics. Aggregate Demand and Aggregate Supply. Introduction. In this chapter, look for the answers to these questions: N.
 C H A T E R 15 Aggregate Demand and Aggregate Supply B R I E F R I N C I L E S O F Macroeconomics N. Gregory Mankiw remium oweroint Slides by Ron Cronovich 2010 South-Western, a part of Cengage Learning,
Disposable income (in billions)
") Section 4 version 2 Multiple Choice Identify the choice that best completes the statement or answers the question. 1. An increase in the MPC: A. increases the multiplier. B. shifts the autonomous investment
Section 4 version 2 Multiple Choice Identify the choice that best completes the statement or answers the question. 1. An increase in the MPC: A. increases the multiplier. B. shifts the autonomous investment
download instant at
 Exam Name MULTIPLE CHOICE. Choose the one alternative that best completes the statement or answers the question. 1) The aggregate supply curve 1) A) shows what each producer is willing and able to produce
Unit 3: Aggregate Demand and Supply and Fiscal Policy
 Unit 3: Aggregate Demand and Supply and Fiscal Policy 1 Demand and Supply Review 1. Define Demand and the Law of Demand. 2. Identify the three concepts that explain why demand is downward sloping. 3. Identify
Problem Set #5 Due in hard copy at beginning of lecture on Monday, April 8, 2013
 Name: Solutions Department of Economics Professor Dowell California State University, Sacramento Spring 2013 Problem Set #5 Due in hard copy at beginning of lecture on Monday, April 8, 2013 Important:
Lecture 4. Short run economic fluctuations.
 MACROECONOMICS 2 Lecture 4. Short run economic fluctuations. The AD/AS model a short reminder. Joanna Siwińska - Gorzelak Time horizons in macroeconomics Time horizons in macroeconomics Long run: Prices
Macroeconomics CHAPTER 10. Aggregate Supply and Aggregate Demand
 Macroeconomics CHAPTER 10 Aggregate Supply and Aggregate Demand What you will learn in this chapter: How the aggregate supply curve illustrates the relationship between the aggregate price level and the
Introduction. Aggregate Demand and Aggregate Supply. In this chapter, look for the answers to these questions:
 33 Aggregate Demand and Aggregate Supply R I N C I L E S O F ECONOMICS FOURTH EDITION N. GREGOR MANKIW remium oweroint Slides by Ron Cronovich 2008 update 2008 South-Western, a part of Cengage Learning,
The aggregate supply curve shows the relationship between the aggregate price level and the quantity of aggregate output in the economy.
 Chapter 32 The aggregate supply curve shows the relationship between the aggregate price level and the quantity of aggregate output in the economy. GDP Deflator can be used as a measure of the price level
AP Macroeconomics. Scoring Guidelines
 2018 AP Macroeconomics Scoring Guidelines College Board, Advanced Placement Program, AP, AP Central, and the acorn logo are registered trademarks of the College Board. AP Central is the official online
Webnote 228. Aggregate demand (AD) U-tube. Item hl sl Must Know Must know very well! Here are the details of what you need to know.
 U-tube. Item hl sl Must Know Must know very well! Here are the details of what you need to know.") Webnote 228 2.2 Aggregate demand and Big Questions: 1. What factors cause changes (shifts + movements) in AS and AD? 2. What can the AS/AD model show in the macro economy?. Draw + explain the 2 schools
Webnote 228 2.2 Aggregate demand and Big Questions: 1. What factors cause changes (shifts + movements) in AS and AD? 2. What can the AS/AD model show in the macro economy?. Draw + explain the 2 schools
Unit 3.3 Macroeconomic Models Unit Overview
 Unit 3.3 Unit Overview 3.3 Macroeconomic models Aggregate demand - components Aggregate supply >>short-run >>long-run (Keynesian versus neo-classical approach) Full employment level of national income
Putting AD and AS together to get Equilibrium Price Level and Output. Unit 3: Aggregate Demand and Supply and Fiscal Policy
 1 Unit 3: Aggregate Demand and Supply and Fiscal Policy 1 Shifters of Aggregate Demand = C + I + G + X Change in Consumer Spending Change in Investment Spending Change in Government Spending Net EXport
Aggregate Demand and Aggregate Supply
 Aggregate Demand and Aggregate Supply Chapter 19 Copyright 2001 by Harcourt, Inc. All rights reserved. Requests for permission to make copies of any part of the work should be mailed to: Permissions Department,
ECO 2013: Macroeconomics Valencia Community College
 ECO 2013: Macroeconomics Valencia Community College Exam 3 Fall 2008 1. The most important determinant of consumer spending is: A. the level of household debt. B. consumer expectations. C. the stock of
Practice Problems 30-32
 Practice Problems 30-32 1. The budget balance is calculated as: A. T G TR B. T + G TR C. T G + TR D. T + G + TR E. TR T G 2. The government budget balance equals: A. Taxes + Government purchases + Government
Economics 102 Discussion Handout Week 14 Spring Aggregate Supply and Demand: Summary
 Economics 102 Discussion Handout Week 14 Spring 2018 Aggregate Supply and Demand: Summary The Aggregate Demand Curve The aggregate demand curve (AD) shows the relationship between the aggregate price level
EQ: What happens to equilibrium price and quantity when there is a change in supply or demand?
 EQ: What happens to equilibrium price and quantity when there is a change in supply or demand? The main thing that affects Supply is production costs. Costs of factors of production affect supply: Employee
Real GDP Growth in the United States Introduction to Economic Fluctuations slide 2.
 Real GD Growth in the United States 10 ercent change from 4 quarters 8 earlier Average growth rate = 3.5% 6 4 2 0-2 -4 1960 1965 1970 1975 1980 1985 1990 1995 2000 Introduction to Economic Fluctuations
7 AGGREGATE SUPPLY AND AGGREGATE DEMAND* Chapter. Key Concepts
 Chapter 7 AGGREGATE SUPPLY AND AGGREGATE DEMAND* Key Concepts Aggregate Supply The aggregate production function shows that the quantity of real GDP (Y ) supplied depends on the quantity of labor (L ),
Macroeconomics 1 Lecture 11: ASAD model
 Macroeconomics 1 Lecture 11: ASAD model Dr Gabriela Grotkowska Lecture objectives difference between short run & long run aggregate demand aggregate supply in the short run & long run see how model of
Archimedean Upper Conservatory Economics, November 2016 Quiz, Unit VI, Stabilization Policies
 Multiple Choice Identify the choice that best completes the statement or answers the question. 1. The federal budget tends to move toward _ as the economy. A. deficit; contracts B. deficit; expands C.
Econ 102 Exam 2 Name ID Section Number
 Econ 102 Exam 2 Name ID Section Number 1. In a closed economy government spending was $30 billion, consumption was $70 billion, taxes were $20 billion, and GDP was $110 billion this year. Investment spending
Questions and Answers
 Questions and Answers Chapter 1 Q1: MCQ Aggregate demand 1. The aggregate demand curve: A) is up-sloping because a higher price level is necessary to make production profitable as production costs rise.
LECTURE 18. AS/AD in demand-deficient Ireland: Unemployment and Deflation
 LECTURE 18 AS/AD in demand-deficient Ireland: Unemployment and Deflation THE AGGREGATE SUPPLY CURVE Aggregate supply curve Each possible price level Quantity of goods & services All nation s businesses
1. You are right. When a fall in the value of the dollar against other currencies makes U.S. final
 AP Krugman Section 4 Problem Solutions 1. You are right. When a fall in the value of the dollar against other currencies makes U.S. final goods and services cheaper to foreigners, this represents a shift
Questions and Answers
 Questions and Answers Ch 1 (continued) Q1: MCQ Aggregate Demand 1) The aggregate demand curve shows A) total expenditures at different levels of national income. B) the quantity of real GDP demanded at
4: AGGREGATE D/S & FISCAL POLICY
 4: AGGREGATE D/S & FISCAL POLICY VOCABULARY (with some additional terms) Aggregate Demand curve that shows the amounts of real output that buyers collectively desire to purchase at each possible price
Principles of Macroeconomics Prof. Yamin Ahmad ECON 202 Spring 2007
 Principles of Macroeconomics Prof. Yamin Ahmad ECON 202 Spring 2007 Midterm Exam II Name Id # Instructions: There are two parts to this midterm. Part A consists of multiple choice questions. Please mark
Introduction to Economic Fluctuations
 CHAPTER 10 Introduction to Economic Fluctuations Modified for ECON 2204 by Bob Murphy 2016 Worth Publishers, all rights reserved IN THIS CHAPTER, OU WILL LEARN: facts about the business cycle how the short
PART XII: SHORT-RUN ECONOMIC FLUCTUATIONS AGGREGATE DEMAND AND AGGREGATE SUPPLY. Chapter 33
 1 PART XII: SHORT-RUN ECONOMIC FLUCTUATIONS AGGREGATE DEMAND AND AGGREGATE SUPPLY Chapter 33 What did we learn so far? Macroeconomics studies the economy as a whole It aims to explain economic events that
4. (Figure: Monetary Policy 1) If the money market is initially at E 2 and the central bank chooses
 If the money market is initially at E 2 and the central bank chooses") Name: Date: Use the following to answer questions 1-6. Figure: Monetary Policy 1 1. (Figure: Monetary Policy 1) If the money market is initially at E 1 and the central bank chooses to sell bonds, then:
Name: Date: Use the following to answer questions 1-6. Figure: Monetary Policy 1 1. (Figure: Monetary Policy 1) If the money market is initially at E 1 and the central bank chooses to sell bonds, then:
ECON 3010 Intermediate Macroeconomics Final Exam
 ECON 3010 Intermediate Macroeconomics Final Exam Multiple Choice Questions. (60 points; 2 pts each) #1. Which of the following is a stock variable? a) wealth b) consumption c) investment d) income #2.
ECON Drexel University Summer 2008 Assignment 2. Due date: July 29, 2008
 ECON 202-001 Drexel University Summer 2008 Assignment 2 Due date: July 29, 2008 Instructor: Yuan Yuan Name This homework has up to 10 points bonus. Question 1 (40 points, 2 points each): MULTIPLE CHOICE.
AGGREGATE DEMAND AGGREGATE SUPPLY
 AGGREGATE DEMAND 8 AND CHAPTER AGGREGATE SUPPLY A Way to View the Economy We can think of an economy as consisting of two major activities: buying and producing. When economists speak about aggregate demand,
ECON 3010 Intermediate Macroeconomics Chapter 10
 ECON 3010 Intermediate Macroeconomics Chapter 10 Introduction to Economic Fluctuations Facts about the business cycle GDP growth averages 3 3.5 percent per year C (consumption) and I (Investment) fluctuate
Aggregate Demand and Aggregate Supply with Policies. Premium PowerPoint Slides by Ron Cronovich, Updated by Vance Ginn
 C H A P T E R 33 & 34 Aggregate Demand and Aggregate Supply with Policies Economics P R I N C I P L E S O F N. Gregory Mankiw Premium PowerPoint Slides by Ron Cronovich, Updated by Vance Ginn 2009 South-Western,
Inflation and the Phillips Curve
 CHAPTER 33 Inflation and the Phillips Curve The first few months or years of inflation, like the first few drinks, seem just fine. Everyone has more money to spend and prices aren t rising quite as fast
Table 9-2. Base Year (2006) 2013 Product Quantity Price Price Milk 50 $2 $3 Bread 100 $3 $3.50
 2013 Product Quantity Price Price Milk 50 $2 $3 Bread 100 $3 $3.50") 1) The advice to "keep searching, there are plenty of jobs around here for which you are qualified," would be most appropriate for which of the following types of unemployment? A) frictional unemployment
1) The advice to "keep searching, there are plenty of jobs around here for which you are qualified," would be most appropriate for which of the following types of unemployment? A) frictional unemployment
Economics 102 Discussion Handout Week 14 Spring Aggregate Supply and Demand: Summary
 Economics 102 Discussion Handout Week 14 Spring 2018 Aggregate Supply and Demand: Summary The Aggregate Demand Curve The aggregate demand curve (AD) shows the relationship between the aggregate price level
Chapter 13: Aggregate Demand and Aggregate Supply Analysis
 Chapter 13: Aggregate Demand and Aggregate Supply Analysis Yulei Luo SEF of HKU March 20, 2016 Learning Objectives 1. Identify the determinants of aggregate demand and distinguish between a movement along
Name Date Per Part 1: Aggregate Demand
 Name Date Per Part 1: Aggregate Demand 1. Aggregate means. When we use aggregates, we combine. Aggregate Demand is all the goods and services ( ) that buyers are willing and able to purchase at different
Macro CH 29 sample questions
 Class: Date: Macro CH 29 sample questions Multiple Choice Identify the choice that best completes the statement or answers the question. 1. The relationship between real GDP and potential GDP over the
Aggregate Supply and Aggregate Demand
 Aggregate Supply and Aggregate Demand Econ 120: Global Macroeconomics 1 1.1 Goals Goals Specific Goals Define the expenditure multiplier and how to compute it. Explain how recessions and expansions can
Aggregate Demand and Aggregate Supply
 chapter: Krugman/Wells 28 Aggregate Demand and Aggregate Supply The following materials are taken from Chap. 28, Economics, 2 nd ed., Krugman and Wells(2009), Worth Palgrave MaCmillan. 1 of 58 WHAT YOU
A decrease in the price level makes consumers feel more wealthy, which in turn encourages them to spend more.
 The aggregate-demand curve: Why the aggregate-demand curve is downward slopping: The price level and consumption: The wealth effect The price level and investment: The interest-rate effect The price level
Principle of Macroeconomics, Summer B Practice Exam
 Principle of Macroeconomics, Summer B 2017 Practice Exam 1) If real GDP in a small country in 2015 is $8 billion and real GDP in the same country in 2016 is $8.3 billion, the growth rate of real GDP between
Monetary Policy Tools?
 EQ: What is the Federal Reserve System? In the U.S., the Federal Reserve System was established in 1913 to discharge the function of a central bank and provide a strengthened framework of regulatory control
Econ 102 Exam 2 Name ID Section Number
 Econ 102 Exam 2 Name ID Section Number 1. Suppose investment spending increases by $50 billion and as a result the equilibrium income increases by $200 billion. The investment multiplier is: A) 10. B)
Assignment 2 Deadline: July 2, 2005
 ECON 1010C Principles of Macroeconomics Instructor: Sharif F. Khan Department of Economics Atkinson College York University Summer 2005 Assignment 2 Deadline: July 2, 2005 Part A Multiple-Choice Questions
Unit 3 Exam Review. Formulas to Know: Output gap = YA YP/YP (x 100) MPC = Consumption/ Yd. MPS = Savings/ Yd
 MPC = Consumption/ Yd. MPS = Savings/ Yd") Unit 3 Exam Review Income and Expenditure 1. Explain relationship between MPC and the multiplier. Direct relationship, the higher the MPC, the greater the multiplier. 2. Understand the concept of autonomous
Unit 3 Exam Review Income and Expenditure 1. Explain relationship between MPC and the multiplier. Direct relationship, the higher the MPC, the greater the multiplier. 2. Understand the concept of autonomous
Aggregate Demand and Aggregate Supply. Chapter Objectives. AD AS Model
 10 Demand and Supply 10-1 Chapter Objectives Demand and the Factors That Cause it to Change. Supply and the Factors That Cause it to Change. How AD and AS Determine an Economy s and the Level of Real GDP.
1. The most basic premise of the aggregate expenditures model is that:
 1. The most basic premise of the aggregate expenditures model is that: A. The total output produced in the economy depends directly on the level of total spending B. The level of employment in the economy
Economic Fluctuations
 Sherif Khalifa Sherif Khalifa () Economic Fluctuations 1 / 39 Economy s output experiences short run fluctuations around the long run upward trend. Fluctuations in the economy s output are closely associated
Introduction. Learning Objectives. Chapter 11. Classical and Keynesian Macro Analyses
 Chapter 11 Classical and Keynesian Macro Analyses Introduction The same basic pattern has repeated four times in recent U.S. history: 1973-1974, 1979-1980, 1990, and 2001. First, world oil prices jump.
10 AGGREGATE SUPPLY AND AGGREGATE DEMAND* Chapt er. Key Concepts. Aggregate Supply1
 Chapt er 10 AGGREGATE SUPPLY AND AGGREGATE DEMAND* Aggregate Supply1 Key Concepts The aggregate supply/aggregate demand model is used to determine how real GDP and the price level are determined and why
A. What is the value of the tax increase multiplier if the MPC is.80? B. Consumption changes by 400 and disposable income by 100. What is the MPC?
 KOFA HIGH SCHOOL SOCIAL SCIENCES DEPARTMENT AP ECONOMICS EXAM PREP WORKSHOP # 3 > AGGREGATE DEMAND AND SUPY NAME : DATE : 1. Figure out the following multiplier questions : A. What is the value of the
AQA Economics AS-level
 AQA Economics AS-level Macroeconomics Topic 2: How the Macroeconomy Works 2.2 Aggregate demand and aggregate supply analysis Notes Aggregate demand is the total demand in the economy. It measures spending
AGGREGATE DEMAND. 1. Keynes s Theory
 AGGREGATE DEMAND 1. Keynes s Theory - John Maynard Keynes (1936) criticized classical theory for assuming that AS alone capital, labor, and technology determines national income proposed that low AD is
Instructions and Rules:
 Name: Honor Pledge Signature: Section: Due Date: 5 pm on Monday, 11/23 (Place inside box outside my office door) Instructions and Rules: This is a timed (1 hour no breaks), closed book, takehome exam.
Shanghai Livingston American School Quarterly / Trimester Plan 2
 Shanghai Livingston American School Quarterly / Trimester Plan 2 Concept / Topic To Teach: Specific Objectives: Week 1 Week 2 Week 3 Week 4 Unit 3 Module 16 INCOME AND EXPENDITURES Comprehend the nature
chapter: Aggregate Demand and Aggregate Supply Aggregate Demand The Aggregate Demand Curve The Aggregate Demand Curve
 >> chapter: 1 Demand and Supply Krugman/Wells WHAT YOU WILL LEARN IN THIS CHAPTER " How the demand curve illustrates the relationship between the and the quantity of output demanded in the economy " How
chapter: Aggregate Demand and Aggregate Supply 10(1 st ) or 12(2 nd ) ECON Feb. 1, 3, 5 1of Worth Publishers
 or 12(2 nd ) ECON Feb. 1, 3, 5 1of Worth Publishers") chapter: 10(1 st ) or 12(2 nd ) >> Aggregate Demand and Aggregate Supply ECON 2020-010 Feb. 1, 3, 5 2009 Worth Publishers 1of 58 Opening Example Who is the chairman of the Federal Reserve? Federal reserve:
chapter: 10(1 st ) or 12(2 nd ) >> Aggregate Demand and Aggregate Supply ECON 2020-010 Feb. 1, 3, 5 2009 Worth Publishers 1of 58 Opening Example Who is the chairman of the Federal Reserve? Federal reserve:
Textbook Media Press. CH 27 Taylor: Principles of Economics 3e 1
 CH 27 Taylor: Principles of Economics 3e 1 The Building Blocks of Keynesian Analysis Keynesian economics is based on two main ideas: a) aggregate demand is more likely than aggregate supply to be the primary
Economic Performance Indicators - Unemployment, CPI, GDP
 Supply and Demand law of demand income effect substitution effect change in quantity demanded vs. change in demand determinants of demand (TRIBE) normal vs. inferior goods supplied vs. change in supply
Chapter 9 Introduction to Economic Fluctuations
 art IV Business Cycle Theory: Short Run Chapter 9 Introduction to Economic Fluctuations Zhengyu Cai h.d. Institute of Development Southwestern University of Finance and Economics All rights reserved http://www.escience.cn/people/zhengyucai/index.html
Economic Fluctuations
 Sherif Khalifa Sherif Khalifa () Economic Fluctuations 1 / 30 Short-run economic fluctuations are often called business cycles. During periods of economic expansion, firms find that customers are plentiful