2014 Interim Results Presentation. 29 th July
|
|
|
- James Perkins
- 6 years ago
- Views:
Transcription

1 2014 Interim Results Presentation 29 th July
2 Stephen A. Carter Group Chief Executive Measured change 2
3 2014 Interim results agenda Measured Change New Divisional Operating Model Strengthening Executive Management Maintaining Operating Discipline H Financials Market Attractiveness Divisional Structure Targeted Acquisitions The Growth Acceleration Plan 3
4 Business review and operational planning Review Team Portfolio Analyst Portfolio Analyst Programme Director Project Manager Global Ops Exec IT Specialist Organisation Specialist Steering Committee Group CEO Director of Strategy Market Analysts Business Analysts Capabilities Team Knowledge Specialists Functional Liaison Group CFO AP Division CEO 2014 Market and Business Overview Informa Portfolio Evaluation 2015 Strategic Planning Financial Impact Implementation Planning 4

5 Business review and operational planning 5
6 New Divisional operating model Simplify Remove Create Define lines of accountability and authority internal and international boundaries and barriers greater focus around markets and customers clear lines of responsibility for Group functions versus Operational Business Academic Publishing Knowledge & Networking Global Exhibitions Business Intelligence 6 Global Support
7 Strengthened Executive Management Group CFO Group CEO Divisional CEO Academic Publishing Director Investor Relations, Corporate Comms & Brand Director Strategy, Business Planning & M&A Executive Management Team Divisional CEO Business Intelligence Divisional CEO Global Exhibitions 7 Director of Talent & Transformation Group General Counsel & Company Secretary Divisional CEO Knowledge & Networking
8 Gareth Wright Chief Financial Officer Maintaining operating discipline 8
9 2014 Interim results summary A robust Group trading performance Organic revenue growth 1.9% Adjusted operating profit 4.5% to 166.7m Adjusted EPS up 6.9% to 20.1p Maintained interim dividend at 6.4p Healthy balance sheet Targeted acquisition investment Full year expectations unchanged 9
10 Divisional summary Revenue H m H m Actual % Organic % Academic Publishing (0.2) 3.8 Business Intelligence (5.6) (6.6) Global Events Group total Adjusted Operating Profit Academic Publishing (2.2) 3.0 Business Intelligence (5.4) (8.3) Global Events Group total Adjusted Operating Margin % % Academic Publishing Business Intelligence Global Events Group total Restated for the change in accounting for joint ventures and discontinued operations 10
11 Income statement H m H m Revenue Adjusted operating profit Intangible asset amortisation 1 (45.8) (57.4) Other adjusting items (8.6) (11.5) Operating profit Net interest (11.6) (13.8) Loss on disposal (0.5) (3.0) Share of results of joint ventures Tax (20.7) (16.3) Discontinued operations - (114.7) Profit / (loss) for the period 79.5 (56.4) - Equity holders of the parent 78.4 (56.4) - Non-controlling interest Excludes software amortisation 2 Restated for the change in accounting for joint ventures and discontinued operations Adjusted EPS (diluted) 20.1p 18.8p 11
12 Operating cash flow H m H m Adjusted operating profit from continuing operations Depreciation of PP&E Amortisation Share-based payments EBITDA from continuing operations Net capital expenditure (7.0) (7.4) Working capital movement (60.9) (53.6) Operating cash flow from continuing operations Adjusted cash conversion 65% 69% Restructuring and reorganisation (6.0) (7.4) Net interest (12.6) (13.5) Taxation (25.3) (36.9) Free cash flow Restated for the change in accounting for joint ventures and discontinued operations
13 Net debt movement H m H m Net debt at 1 January (782.6) (802.4) Free cash flow Dividends (75.4) (75.3) Net acquisition spend (15.8) (60.8) Operating cash flow of discontinued operations (2.8) 1.1 Non-cash items (0.5) (0.5) Foreign exchange 17.6 (37.5) Net debt at 30 June (794.8) (923.4) Net debt/ebitda (using average exchange rates) 2.3x 2.4x 1 Restated for the change in accounting for joint ventures and discontinued operations 13
14 Balance sheet summary H m H m Intangibles and goodwill 2, ,493.5 Fixed assets Other non-current assets Current assets Net assets held for sale Deferred income (284.3) (294.3) Other current liabilities (230.2) (257.5) Net debt (794.8) (923.4) Other non-current liabilities (157.6) (186.8) Total 1, ,


15 Operational fitness Organisational Efficiency Product Refresh International Market Expansion Internal Engagement Operational Talent Enhanced Group Services 15
16 Maintaining operating discipline Enhanced Group Services Consolidation of Shared Service Centres to 3 hubs Improve effectiveness and efficiency of Shared Service Centre activities Post-acquisition integration and investment programme Operational Simplification Operating centre for Asia opened in Shanghai Single business and platform in TMT: Ovum M&A and Business Development into Group Strategy 16
17 Stephen A. Carter Group Chief Executive Accelerating growth
18 The Knowledge & Information Economy 69m people US tradeshow attendees in m The number of LinkedIn Community Groups in ZB 40ZB Amount of data worldwide $4.5bn Expenditure by US Association of Research Libraries in
19 Market attractiveness Market Category Market Size Market Growth Competitive Environment Business & Professional Information & Intelligence 65bn 3-5% Strength in established brands Competition specific to sub-verticals Academic Books & Journals 30bn 2-3% Trade Shows & Exhibitions 20bn 4-6% Conferences, Events & Training > 100bn 2-3% Stability for larger publishers Otherwise highly fragmented market High barriers to entry Competitive within verticals Ability to differentiate on content Highly localised competition 19
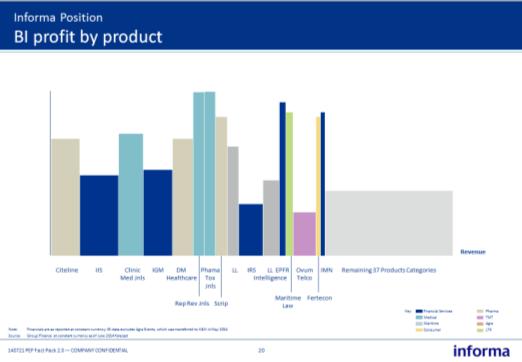
20 Portfolio discipline Knowledge & Information Economy Informa well positioned as a Group Market characteristics the features and functions of growth Measured change manage the transition and maintain operating focus Operational fitness drive simplification and efficiency Portfolio discipline process of continuous assessment 20
21 Divisional structure emerging action list Academic Publishing Business Intelligence Knowledge & Networking Global Exhibitions Mission Consolidate strong market positions Return to growth and accelerate via differential investment in key verticals Explore & exploit strength in Communities Accelerate growth in target geographies & verticals Fitness Accelerate innovation in format, functions & distribution Structure and operate as a single business Consolidate and simplify production across verticals Consolidate content-led assets Systematise & industrialise business processes Operate as a single, global business Sharpen process of identifying and exploiting market opportunities Growth Organic growth and bolt-on acquisitions Expand international market penetration Acquire to consolidate market positions Identify relevant adjacent opportunities Product refresh/innovation New launches Geo-cloning Fully leverage portfolio geocloning opportunity Selectively develop B2C opportunities Targeted acquisitions Informa Group 21 Portfolio management Operational fitness Investment discipline Strategy Management Leadership Talent & professional development Standard systems & software Shared Service support IP Management Brand & Communication


22 Divisional structure emerging action list Mission Fitness Growth Significant market positions in Academic Publishing Business Intelligence Knowledge & Networking large and growing markets Global : Exhibitions Drug development Consolidate strong market Return to growth and Explore & exploit strength Clinical trialling in Accelerate growth in target positions accelerate via differential Communities Maritime geographies & verticals investment in key verticals Agra TMT Structure and operate as a Consolidate content-led Financial services Operate as a single, global single business assets business Accelerate innovation in format, functions & distribution Organic growth and bolt-on acquisitions Expand international market penetration Consolidate and simplify production across verticals Acquire to consolidate market positions Identify relevant adjacent opportunities Systematise & Strong industrialise brands, customer Sharpen process of business processes promotion and retention identifying in core and exploiting products, e.g.: market opportunities Citeline Product refresh/innovation Lloyds List Fully leverage portfolio geocloning opportunity Agro New launches Ovum Selectively develop B2C Geo-cloning EPFR Global opportunities Targeted acquisitions Informa Group 22 Portfolio management Operational fitness Investment discipline Strategy Management Leadership Talent & professional development Standard systems & software Shared Service support IP Management Brand & Communication


23 Targeted acquisitions Global Exhibitions Vertical Consolidation Geographical Expansion Geo-Cloning Health & Nutrition Beauty Hobbyist/Fans Property & Real Estate US China Canada Brazil FanExpo Vitafoods Anti-Aging Medicine Cityscape 23
24 Measured investment programme m m - 90m phased over 3 years % - 90% capital expenditure Peak Group margin impact bps Largest investment into Business Intelligence 5 0 Production and Platform CRM Back Office/ Support Functions People Capabilities Other Programme management control Operating management discipline 24


25 The Growth Acceleration Plan Result Focus Simplification Leadership Enhanced growth and performance 25 Superior returns to shareholders Customer Experience Product refresh: Content, Format, Function, Workflow Priority markets Measured Change Manage Transition Maintain Operating Discipline Organic investment in capabilities and platforms Investment Restructure for growth and scale in priority markets Inorganic investment to accelerate drive to scale Accountability for performance Management Strengthen management capability Operating Model
26 Thank you

27 Appendices 27
28 Tax Profits m Tax m ETR % Statutory results* % Adjusted for: Restructuring and reorganisation costs Acquisition related costs Intangible asset amortisation Subsequent re-measurement of contingent consideration Loss on disposal of business Adjusted results* % * Results exclude the Group s share of results of joint ventures 28
29 Other adjusting items H m H m Amortisation of intangible assets Restructuring and reorganisation costs Acquisition related costs Subsequent re-measurement of contingent consideration Total
30 Deferred income H m H m Actual % Constant Currency % Academic Publishing (7.7) (1.9) Business Intelligence Global Events (6.7) 0.9 Group total (3.4)
31 Currency Major currencies Average Rates Closing Rates H H June 2014 June 2013 USD EUR Impact of a 1 cent movement on full year financials USD m EUR m Revenue Operating Profit Net Debt
32 Return on investment Last 3 years ROI on acquisitions % 2012 acquisitions - 1st year ROI acquisitions - 1st year ROI acquisitions - 1st year ROI 12.5 Return on Capital Employed (%) Group ROCE ROI is defined as tax-affected Adjusted EBITDA in the First Year post-acquisition, as a proportion of Total Consideration. Adjusted EBITDA is translated at the exchange rates in effect at the date of acquisition. ROCE: ((OP + interest income + adjusting items)*(1-tax rate) + other intangible amortisation)/(total assets current liabilities + ST debt + accumulated other intangible amortisation + accumulated goodwill impairment) 32
33 Sponsored ADR program Informa ADRs trade on the US over-the-counter (OTC) market Symbol IFJPY ISIN US45672B305 Ratio 1 ADR : 2 ORD Effective date 1 st July 2013 Underlying ISIN JE00B3WJHK45 Depositary Bank BNY Mellon For any questions relating to Informa ADRs, please contact BNY Mellon Lance Miller Tel: lance.miller@bnymellon.com 33
2013 Half-Year Results. 30 July 2013
 2013 Half-Year Results Peter Rigby: Adam Walker: Chief Executive Finance Director 30 July 2013 Introduction Peter Rigby H1 2013 Overview Underlying growth in continuing operations Disposal of non-core
2017 FULL YEAR RESULTS
 2017 FULL YEAR RESULTS WWW.INFORMA.COM DISCLAIMER This presentation contains forward-looking statements concerning the financial condition, results of operations and businesses of the Group. Although the
Key Highlights. Financial. Operational
 Press Release 29 July 2014 Informa PLC Half Year Results for the Six Months Ended 30 June 2014 2014 Strategy of Measured Change Delivers Robust Earnings Management Outlines Growth Acceleration Plan Key
Results for 12 Months to 31 December 2017
 Informa LEI: 5493006VM2LKUPSEDU20 Press Release 28 February 2018 Informa PLC Results for 12 Months to 31 December : Growth Acceleration Plan Completed 2018: Growth Continuation KEY FINANCIAL AND OPERATING
Informa PLC. Half-Year Results for Six Months to 30 June 2017
 Press Release 25 July 2017 Informa PLC Half-Year Results for Six Months to 30 June 2017 Full Year Performance on Track Following Integration of Penton and Continuing Operational and Financial Delivery
Continued Operational and Financial Progress in Peak Year of GAP investment
 Press Release 28 July 2016 Informa PLC Interim Results for Six Months to 30 June 2016 Continued Operational and Financial Progress in Peak Year of GAP investment KEY FINANCIAL HIGHLIGHTS Accelerating organic
July-September Experian plc. All rights reserved. Experian Public.
 July-September 2016 Overview Snapshot of Experian Revenue: US$4.6bn EBIT: US$1.2bn Market Cap*: c. 14bn In top 50 of FTSE-100 Employees: c.17,000 Offices in 37 countries Largest markets: US, Brazil, UK
Aegis Group plc. 17 March 2011
 Aegis Group plc 2010 Full Year Results 2010 Full Year Results 17 March 2011 Agenda Introduction John Napier, Chairman Aegis Group overview Jerry Buhlmann, CEO Divisional review Aegis Media - Jerry Buhlmann,
Informa PLC. Results for 12 Months to 31 December 2016
 Press Release 6 March 2017 Informa PLC Results for 12 Months to 31 December 2016 Year of Investment and Delivery as Growth Acceleration Plan produces third consecutive year of growth in Revenue, Adjusted
July-September Experian plc. All rights reserved. Experian Public.
 July-September 2015 Overview Snapshot of Experian Revenue: US$4.8 bn EBIT: US$1.3 bn Market Cap*: c. 12 bn In top 50 of FTSE-100 Employees: c.17,000 Offices in 39 countries Largest markets: US, Brazil,
Business Update. USPP Conference Miami. Luis Damasceno Group CFO Michael Williams Group Finance Director & Treasurer January 2019
 Business Update USPP Conference Miami Luis Damasceno Group CFO Michael Williams Group Finance Director & Treasurer 23-25 January 2019 www.alsglobal.com IMPORTANT NOTICE AND DISCLAIMER This presentation
Preliminary results for the year ended 31 March May 2018
 Preliminary results for the year ended 31 March 2018 17 May 2018 Strategic and operational overview Brian Cassin, Chief Executive Officer FY18 results highlights Financial progress Total revenue up 8%;
RELX Group interim results 2017 Erik Engstrom, CEO Nick Luff, CFO
 RELX Group interim results Erik Engstrom, CEO Nick Luff, CFO FORWARD-LOOKING STATEMENTS This presentation contains forward-looking statements within the meaning of Section 27A of the US Securities Act
2017 Full Year. Results Presentation. 21 February 2018
 2017 Full Year Results Presentation 21 February 2018 CAUTIONARY STATEMENT 2017 Full Year Results Slide 2 Full Year Highlights 2017 Full Year Results Presentation 8TH YEAR OF DOUBLE-DIGIT GROWTH 2017 FINANCIAL
2017 Full Year Results. Tuesday 21 November 2017
 2017 Full Year Results Tuesday 21 November 2017 Disclaimer Certain information included in the following presentation is forward looking and involves risks, assumptions and uncertainties that could cause
9 May Half Year Results
 9 May 2018 2018 Half Year Results Disclaimer Certain information included in the following presentation is forward looking and involves risks, assumptions and uncertainties that could cause actual results
Aegis Group plc Half Year Results. 27 August 2010
 Aegis Group plc 2010 Half Year Results 27 August 2010 Agenda Introduction John Napier, Chairman Aegis Group overview Jerry Buhlmann, CEO Divisional review Aegis Media - Jerry Buhlmann, CEO Synovate Robert
Financial Targets through 2022: Focus on Value Creation
 Financial Targets through 2022: Focus on Value Creation /////////// Capital Markets Day London, December 5, 208 Wolfgang Nickl CFO Bayer AG Disclaimer Cautionary Statements Regarding Forward-Looking Information
Wolters Kluwer 2018 Full-Year Results
 Wolters Kluwer 2018 Full-Year Results Nancy McKinstry CEO Kevin Entricken CFO February 20, 2019 2018 Full-Year Results 1 Forward-looking Statements This presentation contains forward-looking statements.
Responsible investment in growth
 Responsible investment in growth Issued: 17 June 2014 Legal notice This presentation has been prepared to inform investors and prospective investors in the secondary markets about the Group and does not
Half Year Results. for the six months ended 30 November January Chairman Chris Stone CEO Adam Palser CFO Brian Tenner
 Half Year Results for the six months ended 30 November 2017 16 January 2018 Chairman Chris Stone CEO Adam Palser CFO Brian Tenner Agenda Overview and strategy update Financial highlights Financial performance
Adjusted earnings per share were 54.1p (2016: 58.8p). Statutory results. Underlying. growth
. Statutory results. Underlying. growth") 34 Pearson plc Annual report and accounts We expect ongoing headwinds in our US higher education courseware business to be offset by improving conditions in our other businesses. Coram Williams Chief Financial
34 Pearson plc Annual report and accounts We expect ongoing headwinds in our US higher education courseware business to be offset by improving conditions in our other businesses. Coram Williams Chief Financial
Half-yearly results for six months ended 30 September November 2017
 Half-yearly results for six months ended 30 September 2017 15 November 2017 Strategic and operational overview Brian Cassin, Chief Executive Officer First-half results highlights Financial and strategic
31 March 2018 Audited Preliminary Results. 6 June 2018
 31 March 2018 Audited Preliminary Results 6 June 2018 1 Presentation Team Euan Fraser Chief Executive Officer Stuart McNulty UK Chief Executive Officer John Paton Chief Financial Officer Has led Alpha
ELECTROCOMPONENTS 2019 half-year financial results
 ELECTROCOMPONENTS 2019 half-year financial results 20 November 2018 SAFE HARBOUR This presentation contains certain statements, statistics and projections that are or may be forward-looking. The accuracy
Quarter ended 30 September Financial results & business update
 Quarter ended 30 September 2013 Financial results & business update 22 October 2013 Disclaimer Any remarks that we may make about future expectations, plans and prospects for the company constitute forward-looking
ESSENTRA STRATEGY REVIEW HIGHLIGHTS
 ESSENTRA STRATEGY REVIEW HIGHLIGHTS Interims presentation 28 JULY 2017 WHAT WAS SAID IN FEBRUARY Initial View of a good set of strategic positions: Leadership or #2 positions in virtually all Sustainable
2018 Full Year Results 20 November 2018
 2018 Full Year Results 20 November 2018 Disclaimer Certain information included in the following presentation is forward looking and involves risks, assumptions and uncertainties that could cause actual
Financial results & business update. Quarter ended 30 September October 2017
 Financial results & business update Quarter ended 30 September 2017 18 October 2017 Disclaimer 3 Any remarks that we may make about future expectations, plans and prospects for the company constitute forward-looking
Britvic plc Interim Results 2018
 Britvic plc Interim Results 2018 CEO SIMON LITHERLAND DELIVERING ON OUR STRATEGIC PRIORITIES AND VISION 2 OUR STRATEGY IS DELIVERING CONSISTENT RETURNS FOR SHAREHOLDERS GENERATE PROFITABLE GROWTH IN OUR
May/June Experian plc. All rights reserved. Experian Public.
 May/June 2015 Overview Snapshot of Experian Revenue: US$4.8 bn EBIT: US$1.3 bn Market Cap*: c. 12 bn In top 50 of FTSE-100 Employees: c.17,000 Offices in 39 countries Largest markets: US, Brazil, UK Corporate
Results for the year ended 31 December Driving sustainable growth
 Results for the year ended 31 December 2017 Driving sustainable growth 2017 Overview Headline profits up over 50% Reported +52% LFL +20% Continued strong LFL revenue growth from Healthcare divisions Marketing
INTERIM RESULTS 2015 FOR THE SIX MONTHS ENDING 30th JUNE 2015
 INTERIM RESULTS 2015 FOR THE SIX MONTHS ENDING 30th JUNE 2015 INTERIM RESULTS 2015 HIGHLIGHTS Organic revenue growth of 2%, lower than recent years as a result of: - Shift in phasing of revenues and trading
AEGIS GROUP PLC 2008 ANNUAL RESULTS. 19 March 2009
 AEGIS GROUP PLC 2008 ANNUAL RESULTS 19 March 2009 AGENDA OVERVIEW OF RESULTS John Napier FINANCIAL REVIEW Alicja Lesniak OUTLOOK John Napier Q&A Aegis Group plc Page 2 OVERVIEW OF RESULTS John Napier,
Financial results & business update. Quarter ended 30 September October 2016
 Financial results & business update Quarter ended 30 September 2016 19 October 2016 Disclaimer 3 Any remarks that we may make about future expectations, plans and prospects for the company constitute forward-looking
BBA Aviation. BBA Aviation 2017 Final Results
 BBA Aviation 2017 Strong execution in favourable market conditions Signature Significant progress on the commercial renegotiations Unique global network of 198 FBOs Investing for future growth Signature
Annual General Meeting of Shareholders
 Annual General Meeting of Shareholders Nancy McKinstry CEO and Chairman of the Executive Board April 20, 2007 Amsterdam Annual General Meeting of Shareholders April 20, 2007 - Amsterdam 1 Agenda Opening
Segmental operating profit 227.7m Down 17% 1. Reported earnings per share 59.8p Down 4%
 Highlights Revenue 1,649m Down 5% 1 Segmental operating profit 227.7m Down 17% 1 Segmental operating margins 13.8% Down 160bps Operating cash flow 2 246m Up 6% Reported earnings per share 59.8p Down 4%
Wolters Kluwer 2018 Half-Year Results
 Wolters Kluwer 2018 Half-Year Results Nancy McKinstry CEO Kevin Entricken CFO August 1, 2018 2018 Half-Year Results 1 Forward-looking Statements This presentation contains forward-looking statements. These
Income taxes (excluding non-trading items) (89.2) (89.5)
 (89.2) (89.5)") FINANCIAL REVIEW Delivering another year of solid performance + Group Key Performance Indicators pages 30-31 Financial Statements pages 138-202 The Group delivered another year of solid performance against
FINANCIAL REVIEW Delivering another year of solid performance + Group Key Performance Indicators pages 30-31 Financial Statements pages 138-202 The Group delivered another year of solid performance against
The Morgan Crucible Company plc Preliminary Results 20 th February 2007
 The Morgan Crucible Company plc 2006 Preliminary Results 20 th February 2007 Agenda Introduction Tim Stevenson 2006 preliminary financial results Kevin Dangerfield Our continuing progress in 2006 Mark
RPC GROUP PLC 2017 / 18 RESULTS
 RPC THE ESSENTIAL INGREDIENT RPC GROUP PLC 2017 / 18 RESULTS Supplemental Information 1 2018 RPC Group Plc. All Rights Reserved. Key figures Sales ( m) +36% Adjusted Operating Profit ( m) +38% Adjusted
DATATEC GROUP AUDITED PROVISIONAL RESULTS FOR THE YEAR ENDED 28 FEBRUARY 2018
 Technology Distribution Integration & Managed Services Consulting & Research AUDITED PROVISIONAL RESULTS FOR THE YEAR ENDED 28 FEBRUARY 2018 AGENDA Results summary, overview & strategic update Jens Montanana,
Preliminary results for the year ended 31 March 2014
 Preliminary results for the year ended 31 March 2014 7 May 2014 2014 Experian plc. All rights reserved. Experian and the marks used herein are service marks or registered trademarks of Experian plc. Other
Interim Results Presentation
 Interim Results Presentation May 2017 Chairman - Gerald Corbett 2 Agenda Simon Litherland Chief Executive Officer Successful delivery of our strategic priorities Mathew Dunn Chief Financial Officer Strong
BUILDING A BOLD AND SUSTAINABLE FUTURE
 BUILDING A BOLD AND SUSTAINABLE FUTURE 2018 HALF YEAR RESULTS 7 AUGUST 2018 PRESENTED BY: CHAIRMAN MARTIN LAMB CHIEF EXECUTIVE KEVIN HOSTETLER FINANCE DIRECTOR JONATHAN DAVIS Keeping the World Flowing
Financial results & business update
 Financial results & business update Quarter ended 31 March 2019 16 April 2019 Disclaimer Any remarks that we may make about future expectations, plans and prospects for the company constitute forward-looking
Wolters Kluwer 2016 Full-Year Results
 Wolters Kluwer 2016 Full-Year Results Nancy McKinstry CEO Kevin Entricken CFO February 22, 2017 2016 Full-Year Results 1 Forward-looking Statements This presentation contains forward-looking statements.
Temenos delivers good results across all metrics and reaffirms full year guidance
 Temenos delivers good results across all metrics and reaffirms full year guidance GENEVA, Switzerland, 22 October 2013 Temenos Group AG (SIX: TEMN), the market leading provider of mission-critical software
Financial results & business update. Quarter and year ended 31 December February 2016
 Financial results & business update Quarter and year ended 31 December 2015 11 February 2016 Disclaimer 3 Any remarks that we may make about future expectations, plans and prospects for the company constitute
November Rick Goings. Chairman & CEO
 November 2016 Rick Goings Chairman & CEO Forward looking statements We are making some forward looking statements today that use words like outlook or target or similar predictive words. Such forward looking
Quarter ended 30 June Financial results & business update
 Quarter ended 30 June 2013 Financial results & business update 29 July 2013 Disclaimer Any remarks that we may make about future expectations, plans and prospects for the company constitute forward-looking
HALF YEAR RESULTS PRESENTATION. 6 months ended 30 June 2015
 HALF YEAR RESULTS PRESENTATION 6 months ended 30 June 2015 6 August 2015 AGENDA 1 2 3 4 5 Group Highlights - Stuart Fletcher, CEO Segmental Results - Stuart Fletcher, CEO Financial Review - Evelyn Bourke,
Snapshot of Experian. Overview
 July September 2017 Overview Snapshot of Experian Total Revenue: US$4.3bn Benchmark EBIT: US$1.2bn Market Cap*: c. 16bn In top 50 of FTSE-100 Employees: c.16,000 Offices in 37 countries Largest markets:
June 2007 Informed Decisions; Smart Solutions
 Data Decisions Distribution June 2007 Informed Decisions; Smart Solutions 1 Contents 1. Strategic and financial summary for FY07 2. Introduction to Experian 3. Preliminary results presentation FY07 2 Strategic
Interim Results Presentation. 28 August 2017
 Interim Results Presentation 28 August 2017 Forward Looking Statements The information in this presentation has not been independently verified and does not purport to be comprehensive. One51 is not undertaking
Data Decisions Distribution. 10 September 2007 Bear Stearns Investor Luncheon
 Data Decisions Distribution 10 September 2007 Bear Stearns Investor Luncheon Introduction to Experian Paul Brooks, CFO 2 Understanding our business Data Decisions Distribution Proprietary ownership of
Financial results & business update. Quarter ended 31 March April 2018
 Financial results & business update Quarter ended 31 March 2018 18 April 2018 Disclaimer 3 Any remarks that we may make about future expectations, plans and prospects for the company constitute forward-looking
Interim Results. 19 July 2018
 Interim Results 19 July 2018 Mark Lewis Chief Executive Officer Trading in line with expectations, good progress on strategy Trading in line with expectations Helped households save 1.1bn Continued strong
Forward-looking statements
 Forward-looking statements Except for the historical information contained herein, the matters discussed in this statement include forward-looking statements. In particular, all statements that express
Second Quarter Calendar Year 2018 Financial Results August 9, 2018
 Second Quarter Calendar Year 2018 Financial Results August 9, 2018 Forward Looking Statements Certain statements in this presentation are "forward-looking statements." These statements relate to future
September Mike Poteshman. Executive VP & CFO
 September 2016 Mike Poteshman Executive VP & CFO Forward looking statements We are making some forward looking statements today that use words like outlook or target or similar predictive words. Such forward
DATATEC GROUP UNAUDITED INTERIM RESULTS FOR THE 6 MONTHS ENDED 31 AUGUST 2016
 Technology Distribution Integration & Managed Services Consulting & Research UNAUDITED INTERIM RESULTS FOR THE 6 MONTHS ENDED 31 AUGUST 2016 AGENDA Results summary, market conditions & operational strategy
TI Fluid Systems plc Half Year Results Presentation for TI Fluid Systems plc. 8 August 2018
 2018 Half Year Results Presentation for 8 August 2018 Disclaimer This presentation contains certain forward-looking statements with respect to the financial condition, results of operations and business
2015 Preliminary Results. 9 March 2016
 2015 Preliminary Results 9 March 2016 Ashley Almanza Group CEO Legal Disclaimer Certain statements in this document are forward-looking statements. These forward-looking statements speak only as at the
Temenos reports 16% revenue growth in Q3 and guides to full-year revenue growth of 5-14% - despite challenging environment
 Temenos reports 16% revenue growth in Q3 and guides to full-year revenue growth of 5-14% - despite challenging environment Geneva, Switzerland, 13 October, 2011 Temenos Group AG (SIX: TEMN), the market
Investor & Analyst Presentation
 Investor & Analyst Presentation FY18 H1 Results For the six monthsended 31 December 2017 15 th February 2018 Rebekah O Flaherty-CEO I Jonathan Kenny-CFO Agenda 1 2 3 4 5 6 Overview Strategic Priorities
Introduction Stephen Harris
 Introduction Stephen Harris Group Chief Executive 2 Agenda Highlights Financial review Business review Summary and Outlook 3 Highlights Results Highlights 14.9% growth in revenue (9.6% constant currency)
ITW Conference Call First Quarter 2013
 ITW Conference Call First Quarter 2013 April 23, 2013 SOLID GROWTH. STRONG RETURNS. BEST-IN-CLASS OPERATOR. Forward-Looking Statements Safe Harbor Statement This conference call contains forward-looking
Financial results & business update. Quarter and year ended 31 December February 2017
 Financial results & business update Quarter and year ended 31 December 2016 14 February 2017 Disclaimer 3 Any remarks that we may make about future expectations, plans and prospects for the company constitute
UDG Healthcare plc Interim Results Presentation FY17. London Stock Exchange, 23 rd May 2017
 UDG Healthcare plc Interim Results Presentation FY17 London Stock Exchange, 23 rd May 2017 Forward looking statements This Presentation has been prepared by UDG Healthcare plc and contains certain forward-looking
Wolters Kluwer 2017 Full-Year Results
 Wolters Kluwer 2017 Full-Year Results Nancy McKinstry CEO Kevin Entricken CFO February 21, 2018 2017 Full-Year Results 1 Forward-looking Statements This presentation contains forward-looking statements.
Unilever H Results
 Unilever H1 2011 Results Paul Polman CEO Jean-Marc Huët CFO James Allison Head of IR and M&A August 4 th 2011 Safe Harbour Statement This announcement may contain forward-looking statements, including
Results for the year ended 31 December February 2016 Capita plc
 Results for the year ended 31 December 2015 25 February 2016 Capita plc 1 Agenda Strategy and key highlights Andy Parker, Chief Executive Financial results Nick Greatorex, Group Finance Director Business
2Q 2017 Highlights and Operating Results
 2Q 2017 Highlights and Operating Results July 25, 2017 1 2Q 2017 Highlights and Operating Results Table of Contents Page(s) 1 Sales Overview and Highlights 4-5 2 NSS Overview 6-7 3 EES Overview 8-9 4 UPS
Earnings Release FY18 Q3
 Earnings Release FY18 Q3 Microsoft Cloud Powers Third Quarter Results REDMOND, Wash. April 26, 2018 Microsoft Corp. today announced the following results for the quarter ended 2018, as compared to the
Interim Results 2018/19
 Interim Results 2018/19 Martin Morgan, Executive Chairman Richard Amos, Chief Financial Officer London, 21 February 2019 Safe Harbour Statement This presentation and the subsequent question and answer
ANNOUNCEMENT OF FULL YEAR RESULTS For the year ended March 31, 2012
 May 31, 2012 Continuing operations 1 TATE & LYLE PLC ANNOUNCEMENT OF FULL YEAR RESULTS For the year ended March 31, 2012 2012 2011 Change (reported) Change (constant currency) 4 m $m 5 m $m 5 Sales 3 088
Quarter and year ended 31 December Financial results & business update
 Quarter and year ended 31 December 2013 Financial results & business update 18 February 2014 Disclaimer Any remarks that we may make about future expectations, plans and prospects for the company constitute
Introduction Stephen Harris
 Introduction Stephen Harris Group Chief Executive 2 Agenda Highlights Financial review Business review Summary and Outlook 3 Highlights Results 8.7% revenue growth to 368.0m 5% growth in headline operating
Investor Presentation
 Investor Presentation Full Year Results FY2018 Raj Naran, Managing Director and CEO, ALS Limited 28 May 2018 www.alsglobal.com IMPORTANT NOTICE AND DISCLAIMER This presentation has been prepared by ALS
1 st quarter 2015 results
 1 st quarter 2015 results continued improvement Jacques van den Broek, CEO Robert Jan van de Kraats, CFO Randstad Holding nv disclaimer & definitions Certain statements in this document concern prognoses
Amer Sports Interim Report January-September 2018
 1 (32) Amer Sports Corporation INTERIM REPORT October 25, at 1:00 p.m. Amer Sports Interim Report January-September NET SALES AND EBIT JULY-SEPTEMBER On 5 th September, as part of the strategy update,
ANNOUNCEMENT OF PRELIMINARY RESULTS
 The leading high service distributor to engineers worldwide ANNOUNCEMENT OF PRELIMINARY RESULTS YEAR ENDED 31 MARCH 2009 29 May 2009 Agenda Overview and current trading Ian Mason Financial performance
Financial results & business update. Quarter ended 30 June July 2017
 Financial results & business update Quarter ended 30 June 2017 19 July 2017 Disclaimer 3 Any remarks that we may make about future expectations, plans and prospects for the company constitute forward-looking
Income Statement. for the financial year ended 31 March 2011
 Income Statement for the financial year ended 31 March Continuing operations Revenue 5 1,220,183 1,141,964 Other income 6 3,776 2,350 Share of net loss of associate accounted for using the equity method
Introduction Stephen Harris
 Introduction Stephen Harris Group Chief Executive 2 Agenda Highlights Business review Financial review Summary Outlook 3 Highlights Results 6.7% revenue growth at constant currency, 5.6% at actual rates
HY 2018 Results Presentation August 28, 2018
 HY 2018 Results Presentation August 28, 2018 1 Today s speakers Bert Meulman, CEO CEO since 2004 Joined B&S in 1992, held several leadership positions Shareholding partner since 1995 Gert van Laar, CFO
Press release February 28, FULL-YEAR 2017 RESULTS Recurring Operating Income of 2.0bn Free cash flow (excluding exceptional items) of 950m
 of 950m") FULL-YEAR 2017 RESULTS Recurring Operating Income of 2.0bn Free cash flow (excluding exceptional items) of 950m Slowdown in Group like-for-like sales, at +1.6% in 2017 vs. +3.0% in 2016. Recurring Operating
FULL-YEAR 2017 RESULTS Recurring Operating Income of 2.0bn Free cash flow (excluding exceptional items) of 950m Slowdown in Group like-for-like sales, at +1.6% in 2017 vs. +3.0% in 2016. Recurring Operating
Ingenta plc interim results
 Ingenta plc interim results Ingenta plc (AIM: ING), ( Ingenta, the Company or the Group ) a leading provider of world-class software and services to the global publishing industry, today announces its
LafargeHolcim makes good progress in 2017; Strategy 2022 to drive growth. EPS 11.9% up on prior year excluding impairment and divestments
 Zurich, 07:00, March 2, 2018 LafargeHolcim makes good progress in 2017; Strategy 2022 to drive growth 4.7% growth in Net Sales on like-for-like basis Recurring EBITDA up 6.1% on like-for-like basis EPS
Mitie Group plc. The UK s leading Facilities Management business. Analyst Presentation H1 18/19 22 November 2018
 Mitie Group plc The UK s leading Facilities Management business Analyst Presentation H1 18/19 22 November 2018 Disclaimer This presentation may contain certain forward-looking statements, beliefs or opinions,
Availability, Reliability, Ease. 11 September 2018
 Availability, Reliability, Ease 11 September 2018 LEGAL NOTICE This presentation has been prepared to inform investors and prospective investors in the secondary markets about the Group and does not constitute
Basware grew SaaS revenues by 99% and continued to invest in enablers for the 2018 strategy
 Interim Report 1 (24) BASWARE INTERIM REPORT JANUARY 1 - JUNE 30, 2016 (IFRS) SUMMARY Basware grew SaaS revenues by 99% and continued to invest in enablers for the 2018 strategy January-June 2016: - Net
2017 Interim Results Presentation
 2017 Interim Results Presentation 28 th July 2017 www.morganadvancedmaterials.com Agenda Introduction and key highlights Pete Raby 2017 interim results Peter Turner Operational and strategic update Pete
J.P. MORGAN HEALTHCARE CONFERENCE. Robert Abernathy Chairman and CEO
 J.P. MORGAN HEALTHCARE CONFERENCE Robert Abernathy Chairman and CEO OVERVIEW FORWARD-LOOKING INFORMATION Certain matters in this presentation and conference call, including our 2016 outlook, expectations
2017 FULL YEAR RESULTS. February 28,
 2017 FULL YEAR RESULTS February 28, 2018 1 Disclaimer This presentation contains both historical and forward-looking statements. These forward-looking statements are based on Carrefour management's current
Investor Presentation November 2011
 Investor Presentation November 2011 For further information contact: aston.swift@intertek.com +44 (0)20 7396 3400 1 Cautionary statement regarding forward-looking statements This presentation contains
XYLEM INC. Q EARNINGS RELEASE FEBRUARY 1, 2018
 XYLEM INC. Q4 2017 EARNINGS RELEASE FEBRUARY 1, 2018 Q4 2017 EARNINGS RELEASE FORWARD-LOOKING STATEMENTS This presentation contains information that may constitute forward-looking statements. Forward-looking
Strategy Update 2018 Investor Presentation. 10 December 2018
 Strategy Update 2018 Investor Presentation 10 December 2018 Speakers Strategy Update Jeff Gravenhorst, Group CEO Financials Pierre-Francois Riolacci, Group CFO Q&A 2 Forward-looking statements This presentation