153.9EUR 19.6EUR 8.0EUR
|
|
|
- Nancy McKenzie
- 6 years ago
- Views:
Transcription


1 Nine Months Report 2017
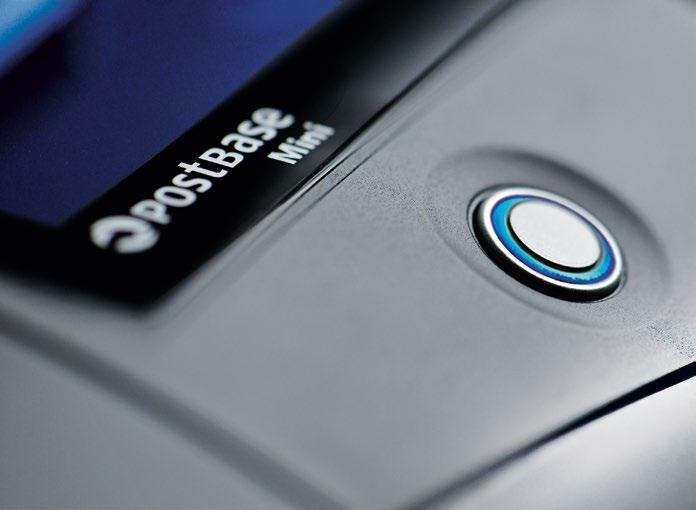
2 KENNZAHLEN KEY FIGURES DES ERSTEN QUARTALS 153.9EUR MILLION REVENUES 19.6EUR MILLION EBITDA 8.0EUR MILLION Free cash flow adjusted 2
3 FP IS AIMING AT 2020 TARGETS THE SUCCESS OF POSTBASE CONFIRMS THE ASSUMPTIONS OF THE ACT STRATEGY AND LEADS TO CONTINUOUS GROWTH IN MARKET SHARE: The success story of PostBase 100 and PostBase Mini continued in the third quarter of Hence, the assumptions of the ACT growth strategy were confirmed. The market changes are accelerating. In consequence, the demand for franking systems for small mail volumes is growing, while the demand for bigger systems is shrinking. The FP Group has increased its global market share especially in the strategic core markets US and France. EBITDA SLIGHTLY DOWN TO EUR 19.6 MILLION DUE TO ACT AND ONE-OFF EFFECTS: In line with planning, 2017 is impacted by the implementation of the ACT strategy. ACT costs amounted to EUR 2.6 million in the first nine months of the current fiscal year. Despite further one-off effects of EUR 1.0 million, the company reported an EBITDA of EUR 19.6 million in the first nine months of 2017 compared with EUR 20.6 million in the same period of The negative effects resulted mainly from concentrating the production-related activities at the Wittenberge site (EUR 0.5 million) and expenses in connection with the previously reported irregularities in the Mail Services segment (EUR 0.5 million). There was a positive effect of EUR 1.9 million from statute-barred liabilities. The euro s current strength against the US dollar, which is increasing year-on-year, is expected to continue to have a negative impact in the fourth quarter. Adjusted for currency effects, EBITDA came to EUR 20.0 million. FP FIT PROVIDES THE BASIS FOR PROFITABLE GROWTH CONCENTRATION ON STABILISATION AND REALIGNMENT OF THE MAIL SERVICES AND SOFTWARE PRODUCT SEGMENTS, ALONG WITH ACCELERATED TRANSFOR- MATION OF THE GROUP: As part of the successfully launched ACT strategy in 2016, the FP Group is stepping up its measures to enhance efficiency and is aiming to improve the Group s performance sustainably. Focusing on fiscal 2020, FP is increasing the pace significantly. The FP Group is continuing to systematically implement the measures entailed by ACT with undiminished vigour. Starting from an EBITDA margin of currently around 13%, FP intends to achieve an EBITDA margin of 17% with revenues of EUR 250 million by To do so it has enacted the ACT Structure & Organisation project, which will have a substantial and lasting positive effect on the EBITDA margin. The goal is to reduce complexity in the FP Group by creating improved and stable organisational structures for future tasks and to make the FP Group more dynamic. This necessitate measures will lead to expenses and investments in 2018, the year of action. Positive effects are expected during This project will concern the company structures, its locations, general processes, procedures and IT systems. The FP Group is still on course to achieve its medium-term targets by FP is aiming to double its revenues to around EUR 400 million with an EBITDA margin of 20% by FORECAST CONFIRMED The FP Group has confirmed its forecast for fiscal year 2017, based on the assumption of constant exchange rates, and anticipates a slight year-on-year increase in revenues and EBITDA and adjusted free cash flow at the level of the previous year. 3

4 RÜDIGER ANDREAS GÜNTHER CEO AND CFO In fiscal year 2016 we introduced a clear change of direction in FP s positioning with our ACT growth strategy. We are on the attack in our core business, we are developing new products and services for our customers and we are starting our digital transformation. In the first year of ACT 2017 we are focusing and working hard on implementing strategic projects and measures into practice. We will meet our targets for 2017 as announced and will achieve slightly higher revenues year-on-year, slightly higher EBITDA and adjusted free cash flow on the previous year s level despite a series of unexpected negative factors will be the year of action. We are not wasting any time. We have a clear focus on our medium- and long-term goals and want to improve our current EBITDA margin of currently around 13% to 17% with revenues of EUR 250 million by In 2018 we accelerate the implementation of our projects and measures and are also rolling out the ACT-project Structure & Organi sation. We are hereby making FP fit for the future - leading to noticeable non-recurring expenses. Adjusted positive effects are expected in We are aiming at doubling our revenues to around EUR 400 million with an EBITDA margin of 20% by FP INCREASES THE PACE AND IS IMPLEMENTING THE ACT GROWTH STRATEGY + 4


5 QUARTERLY REPORT FOR 3 / 2017 MANAGEMENT BOARD THOMAS GRETHE CSO With our PostBase product family, we are perfectly in line with the trends and are offering our customers products and services that are precisely geared towards their needs. Our core business with franking systems for small to medium volumes of mail is growing. With the PostBase 100 and PostBase Mini, which have proved to be bestsellers, we have launched exactly the right products on the market and are underlining the crucial advantage that FP has when it comes to innovation. We have come up with the right strategy at the right time. However, we are not resting as we want to become even faster and better. In 2017, we started to bring our sales organisation into line with specific changes in customers wishes and stepped up the expansion of our sales activities. We will see the first results of this in 2018, even if we have not yet completed our repositioning. I am convinced that our investment in the development of the PostBase product family and in the further expansion of sales will pay off when it comes to achieving our targets for 2020, we are convinced of it! SVEN MEISE CDO Digitalisation does not happen overnight this fact remains. However, FP has no time to lose. In 2017, we reviewed efficiency, quality and process stability in the Mail Services and Software segments in the interests of our customers and partners and implemented the first stabilisation and realignment measures. We are still at the beginning of this process. We suffered severe setbacks with the reported incidents in the Mail Services segment in the second quarter of 2017 in particular, and we are continuing to see the effects of the increasing competitive pressure in the third quarter. This led to a further decline in margins. We have begun to implement countermeasures here. It is vital that we continue our realignment quickly and consistently for this reason too. That includes the integration of the Mail Services and Software product segments. It is a key task for the coming fiscal year. At the same time, we will systematically tackle the IT infrastructure and gear research and development towards the requirements of digitalisation. 5
6 OVERVIEW OF THE FIRST NINE MONTHS OF 2017 OVERALL STATEMENT: THE FP GROUP RECORDS FURTHER REVENUES GROWTH AND CONFIRMS 2017 FORECAST The FP Group has continued the growth in revenues in the fiscal year 2017 to date. In the first nine months of 2017, the FP Group increased revenues by 3.0% to EUR million compared to previous year. EBITDA for the FP Group amounted to EUR 19.6 million, including negative currency effects of EUR 0.4 million, down slightly from EUR 20.6 million in the previous year. Apart from the currency effect, this was mainly due to weak margins in the Mail Services product segment and the sig - nificant rise in staff costs in connection with ACT measures. Despite the negative impact on results from these expense items, the FP Group confirms its forecast for fiscal year BUSINESS PERFORMANCE: POSITIVE DEVELOPMENT CONTINUES IN BUSINESS WITH FRANKING MACHINES The FP Group has recorded slight revenue growth of 0.6% in its traditional business with franking systems in the last nine months, which corresponds to revenues of EUR 94.9 million in the first three quarters of fiscal year The fact that British Pound remained relatively weak, coupled with the increasing strength of the euro against the US dollar, also constituted a challenge here. Negative currency effects had a total impact of EUR 1.0 million in the first nine months of As predicted, FP s success in the franking machine business was attributable to high demand for small franking systems. With the PostBase 100 and PostBase Mini, FP has responded in time to the change in demand from large to small franking systems, and is targeting the segment for small to medium mail volumes with products and services that are precisely tailored to customers needs. REVENUE GROWTH IN MAIL SERVICES Revenues in the Mail Services business increased by 9.8% to EUR 49.1 million. Despite ongoing strong revenue growth over the last five years, margins in the product segment remained weak, with profitability declining further in the first nine months of For this reason, FP brought forward the reorganisation planned in the context of ACT, as potential areas for enhancing efficiency and reducing costs were identified in an operational review. The Software segment achieved revenues of EUR 9.9 million after EUR 10.3 million in prior year. The reduction of revenues in the Software segments resulted primarily from a temporary loss of processed mail. 6
7 QUARTERLY REPORT FOR 3 / 2017 OVERVIEW OF THE FIRST NINE MONTHS OF 2017 RESULTS OF OPERATIONS: EBITDA OF EUR 19.6 MILLION IMPACTED BY ONE-OFF EFFECTS AND ACT COSTS EBITDA for the first nine months of 2017 totalled EUR 19.6 million including negative currency effects of EUR 0.4 million, down slightly on the previous year s figure of EUR 20.6 million. Along with higher currency effects, a significant increase in the cost of materials and staff costs had a strong negative impact on results. Income of EUR 1.9 million from statute-barred liabilities had a positive effect. The cost of materials increased by 7.2% mainly due to the increase in franking service business in Mail Services. As a result, the cost of purchased services increased by 14.9% to EUR 49.9 million in the first nine months of 2017, compared with EUR 43.4 million in the same period of the previous year. In contrast, expenses for raw materials, consumables and supplies declined to EUR 26.7 million compared with EUR 28.0 million in the previous year, despite the slight increase in revenues in the core business of franking and inserting. As a result, the cost of materials ratio increased by two percentage points to 49.8%. Staff costs rose from EUR 42.9 million in prior year to EUR 45.0 million, mainly due to the expansion of the international sales team and the professionalisation of administrative areas of the Group in connection with the ACT strategy (EUR 1.5 million). Other expenses decreased from EUR 25.9 million to EUR 24.3 million in the first nine months, despite one-time expenses of EUR 0.8 million as well as expenses in the amount of EUR 0.9 million within the ACT strategy. The release of liabilities in the amount of EUR 0.9 million due to the disappearance of the reasons let to an improvement of other operation expenses. Amortisations and depreciations developed largely in line with expectations during the first nine months, due to the modernisation of the product family, software investments and the acquisition of customer lists, and increased from EUR 12.5 million to EUR 14.6 million. In total, earnings before interests and taxes (EBIT) thus decline from EUR 8.1 million to EUR 5.0 million. Net interest results improve significantly from EUR 0.1 million prior year to EUR 0.5 million. This improvement resulted primarily from increased interest income from finance leases of EUR 1.1 million (previous year: EUR 0.8 million) and from non-recurring effects of tax-related interest income of EUR 0.5 million due to the successful completion of mutual tax agreement procedures in accordance with the EU Arbitration Convention (previous year: EUR 0.2 million). One-time interest expenses of EUR 0.3 million from ongoing tax audits had a negative impact. Income taxes amounted to EUR 2.0 million in the first nine months of 2017, compared with EUR 2.8 million in previous year. With EUR 3.4 million, consolidated net income was below EUR 5.2 million. Earnings per share (EPS) fell to EUR 0,21 (basic) and EUR 0.20 (diluted) in the first nine months of 2017, compared with EUR 0.31 and EUR 0.30 respectively in previous year. 7
8 OVERVIEW OF THE FIRST NINE MONTHS OF 2017 FINANCIAL POSITION AND NET ASSETS: ADJUSTED FREE CASH FLOW AT THE GOOD PRIOR YEAR LEVEL AS EXPECTED The FP Group pursues a focused investment strategy. Thanks to its new product portfolio, the FP Group has been successful on all key markets. In the first nine months of 2017, investment in ongoing business and in the implementation of the growth strategy amounted to EUR 12.0 million, compared with EUR 11.9 million in previous year. EUR 4.7 million of this amount was attributable to investments in rental equipment (previous year: EUR 5.1 million). In the first nine months of 2017, the FP Group invested a total of EUR 1.4 million in the acquisition of customer lists including leased products. In addition, the FP Group capitalised development costs of EUR 3.4 million (previous year: EUR 3.7 million). Cash outflows for investments of EUR 12.0 million were offset by cash inflows of EUR 16.6 million from cash flow from operating activities in the first nine months of Free cash flow thus declined to EUR 4.5 million, compared with EUR 5.2 million in previous year. Adjusted for investments in finance lease assets of EUR 2.1 million and the acquisition of customer lists in the United Kingdom, free cash flow amounted to EUR 8.0 million and thus remained stable year-onyear. Positive cash flow from operating activities is an important funding source for the FP Group, in addition to existing loan agreements with banks and finance lease contracts. Financial liabilities increased to EUR 40.2 million as at 30 September 2017, compared with EUR 38.4 million as at 31 December Cash and cash equivalents totalled EUR 21.5 million (31 December 2016: EUR 18.7 million). Net debt dropped to EUR 18.8 million as at 30 September 2017, compared to EUR 19.8 million at the end of FORECAST FP CONFIRMS FORECAST AND ANTICIPATES SLIGHT GROWTH IN REVENUES AND EBITDA AND ADJUSTED FREE CASH FLOW AT THE PRIOR YEAR LEVEL In the current fiscal year 2017, the FP Group is focusing on expanding its market share in the franking machine business and on implementing strategic projects, and the implementation of numerous FP Fit measures, which are generally leading to a significant rise in staff costs. Despite additional expenses from the Mail Services product segment the FP Group confirms its forecast for 2017 as a whole, based on the assumption of constant exchange rates. The company anticipates a slight increase in revenues and EBITDA and an adjusted free cash flow at prior year level. All of these disclosures are based on the information available at the end of the third quarter of The FP Group wishes to point out that the planning data as stated may differ from the actual figures subsequently recorded. 8
9 QUARTERLY REPORT FOR 3 / 2017 OVERVIEW OF THE FIRST NINE MONTHS OF 2017 SIGNIFICANT EVENTS A significant and reportable event after 30 September 2017 was the start of the share buyback programme. On 9 October 2017, the Management Board of Francotyp-Postalia Holding AG decided, with the approval of the Supervisory Board, to exercise the authorisation resolved upon at the Annual General Meeting on 11 June 2015 to acquire treasury shares in accordance with section 71 (1) no. 8 of the German Stock Corporation Act (Aktiengesetz AktG) and to acquire up to 475,000 shares (corresponding to max. 2.91% of the company s share capital), probably during the period from 12 October 2017 to 12 January 2018, whereby the repurchase of up to 475,000 shares is limited to a maximum total purchase price of EUR 3 million. The purpose of the purchase is to use the treasury shares acquired to service subscription rights that have been issued under stock option plans and have been or will be exercised. 9

10 CONSOLIDATED FINANCIAL STATEMENTS 11 CONSOLIDATED STATEMENT OF COMPREHENSIVE INCOME + for the first nine month of CONSOLIDATED BALANCE SHEET 14 CONSOLIDATED CASH FLOW STATEMENT 16 CONSOLIDATED STATEMENT OF CHANGES IN EQUITY Please note that there may be rounding differences compared to exact mathematical figures (monetary units, percentages, etc.).
11 QUARTERLY REPORT FOR 3 / 2017 CONSOLIDATED FINANCIAL STATEMENTS CONSOLIDATED STATEMENT OF COMPREHENSIVE INCOME CONSOLIDATED STATEMENT OF COMPREHENSIVE INCOME FOR THE PERIOD FROM 1 JANUARY TO 30 SEPTEMBER 2017 in thousand euro rd quarter rd quarter Revenues 153, ,376 49,447 49,059 Increase / decrease in inventories of finished goods and work in progress , ,814 49,523 49,710 Other own work capitalised 7,870 8,920 2,746 2,431 Other income 3,306 2,210 2, Cost of materials a) Expenses for raw materials, consumables and supplies 26,691 28,019 8,512 9,477 b) Cost of purchased services 49,900 43,429 16,294 14,203 Staff costs 76,591 71,448 24,806 23,680 a) Wages and salaries 38,174 36,530 12,507 12,232 b) Social security contributions 5,957 5,631 1,850 1,718 c) Expenses for pensions and other benefits ,985 42,933 14,689 14,201 Amortisation, depreciation and write-downs 14,598 12,502 4,767 4,180 Other expenses 24,383 25,963 8,047 8,953 Net interest income a) Interest and similar income 1, b) Interest and similar expenses 1,160 1, Other financial result a) Other financial income 640 4, b) Other finance costs 789 4, Income taxes 1,996 2, Consolidated net income 3,380 5,266 1,252 1,258 Other comprehensive income Foreign currency translation of financial statements of foreign entities 3,697 2,341 1, of which taxes of which reclassified to consolidated net income Adjustment of provisions for pensions and partial retirement obligations in accordance with IAS 19 (rev. 2011) Cash flow hedges reclassified to profit or loss of which taxes Other comprehensive income after taxes 3,456 2,341 1, Total comprehensive income 76 2, Consolidated net income, of which: 3,380 5,266 1,252 1,258 Consolidated net income attributable to the shareholders of FP Holding 3,380 4,924 1,252 1,149 Consolidated net income attributable to non-controlling interests Total comprehensive income, of which 76 2, Total comprehensive income attributable to the shareholders of FP Holding 76 2, Total comprehensive income attributable to non-controlling interests Earnings per share (basic, in EUR) Earnings per share (diluted, in EUR)
12 FRANCOTYP-POSTALIA HOLDING AG CONSOLIDATED STATEMENT OF FINANCIAL POSITION AS AT 30 SEPTEMBER 2017 ASSETS in thousand euro NON-CURRENT ASSETS Intangible assets Intangible assets including customer lists 22,450 22,117 Goodwill 8,494 8,494 Development projects in progress and advance payments 3,693 4,265 34,638 34,876 Property, plant and equipment Land, land rights and buildings 2,847 3,044 Technical equipment and machinery 4,908 4,729 Other equipment, operating and office equipment 4,450 4,348 Leased products 19,780 23,807 Finance lease assets 1,438 3,103 Advance payments and assets under construction ,814 39,346 Other assets Associates Other equity investments Finance lease receivables 10,594 9,375 Other non-current assets ,943 9,723 Tax assets Deferred tax liabilities 2, ,767 84,811 CURRENT ASSETS Inventories Raw materials, consumables and supplies 4,400 5,187 Work in progress Finished goods and merchandise 5,958 5,457 11,035 11,196 Trade receivables 17,749 18,966 Other assets Finance lease receivables 4,066 3,169 Income taxes receivable 5,806 6,480 Derivative financial instruments Other current assets 14,803 15,557 24,748 25,292 Securities Cash and cash equivalents 30,185 26,394 84,400 82, , ,338 12
13 QUARTERLY REPORT FOR 3 / 2017 CONSOLIDATED FINANCIAL STATEMENTS CONSOLIDATED STATEMENT OF FINANCIAL POSITION LIABILITIES in thousand euro EQUITY Equity attributable to shareholders of the parent company Issued capital 16,301 16,215 Capital reserves 34,746 34,620 Stock option reserve 1,291 1,179 Loss carried forward 17,543 20,794 Consolidated net income after minority interests 3,380 5,857 Total other equity 4,588 1,131 33,588 35,946 NON-CURRENT LIABILITIES Provisions for pensions and similar obligations 16,973 17,054 Other provisions 1, Financial liabilities 39,906 37,530 Other liabilities Deferred tax liabilities 1, ,424 56,257 CURRENT LIABILITIES Tax liabilities 4,930 3,635 Provisions 7,093 7,969 Financial liabilities Trade payables 11,145 10,612 Other liabilities of which telepostage EUR 25,746 thousand (previous year: EUR 28,119 thousand) 49,667 52,008 73,155 75, , ,338 13
14 FRANCOTYP-POSTALIA HOLDING AG CONSOLIDATED CASH FLOW STATEMENT FOR THE PERIOD FROM 1 JANUARY TO 30 SEPTEMBER 2017 in thousand euro CASH FLOW FROM OPERATING ACTIVITIES Consolidated net income 3,380 5,266 Net income tax recognised in profit or loss 1,996 2,845 Net interest income recognised in profit or loss Amortisation, depreciation and write-downs on non-current assets 14,598 12,502 Decrease ( ) / increase (+) in provisions and tax liabilities 1,045 1,454 Loss (+) / gain (-) on the disposal of non-current assets Decrease (+) / increase (-) in inventories, trade receivables and other assets not attributable to investing or financing activities (without finance leases) 2,262 2,009 Decrease (+) / increase (-) in finance lease receivables 2,116 2,947 Decrease (-)/ increase (+) in trade payables and other liabilities 1) not attributable to investing or financing activities 2, Other non-cash income Public grants not yet received 0 1,012 Interest received 1, Interest paid 1, Income taxes received 1,011 Income taxes paid 1, Cash flow from operating activities 16,557 17, Cash flow from investing activities Payments for the capitalisation of development costs 3,315 3,565 Payments for capitalised interest for development costs Proceeds from disposals of non-current assets 12 0 Payments for investments in intangible assets 1,488 1,227 Payments for investments in property, plant and equipment 7,192 6,962 Cash flow from investing activities 12,020 11,876 1) Postage credit balances managed by the FP Group of EUR 9,420 thousand (previous year: EUR 8,267 thousand) are deducted from cash and other liabilities. Securities held as current assets are included in cash and cash equivalents in the amount of EUR 683 thousand (previous year: EUR 688 thousand). 14
15 QUARTERLY REPORT FOR 3 / 2017 CONSOLIDATED FINANCIAL STATEMENTS CONSOLIDATED CASH FLOW STATEMENT in thousand euro Cash flow from financing activities Payments for distributions to shareholders 2,606 1,923 Bank loan repayments 6 33,126 Repayments of finance lease liabilities 1,030 1,305 Proceeds from finance lease liabilities Proceeds from the sale of treasury shares Proceeds for the issue of new shares Proceeds from the assumption of bank loans 2,470 32,336 Cash flow from financing activities 608 3,754 Cash and cash equivalents 1) Change in cash and cash equivalents 3,929 1,492 Change in cash and cash equivalents due to currency translation 1,136 1,076 Cash and cash equivalents at beginning of period 18,655 15,928 Cash and cash equivalents at end of period 21,448 16,345 1) Postage credit balances managed by the FP Group of EUR 9,420 thousand (previous year: EUR 8,267 thousand) are deducted from cash and other liabilities. Securities held as current assets are included in cash and cash equivalents in the amount of EUR 683 thousand (previous year: EUR 688 thousand). 15
16 FRANCOTYP-POSTALIA HOLDING AG CONSOLIDATED STATEMENT OF CHANGES IN EQUITY FOR THE PERIOD FROM 1 JANUARY TO 30 SEPTEMBER 2017 in thousand euro Issued capital Capital reserves Stock option reserve Treasury shares Consolidated net income As at ,160 34,937 1, ,871 Consolidated net income ,924 Foreign currency translation of financial statements of foreign entities Other comprehensive income Total comprehensive income ,924 Stock option settlement Distributions ,923 As at ,160 34,678 1, ,870 As at ,215 34,620 1, ,937 Consolidated net income ,380 Foreign currency translation of financial statements of foreign entities Adjustment of provisions for pensions in accordance with IFRS Cash flow hedges Other comprehensive income Total comprehensive income ,380 Distributions ,606 Stock option settlement As at ,301 34,746 1, ,163 16
17 QUARTERLY REPORT FOR 3 / 2017 CONSOLIDATED FINANCIAL STATEMENTS CONSOLIDATED STATEMENT OF CHANGES IN EQUITY Total other equity Currency translation adjustment Net investments in foreign operations Adjustment due to IAS 19 Difference due to acquisition of minority interests Reserve from hedging transactions Equity attributable to FP Holding Non-controlling interests Total 3, , ,713 1,519 35, , ,266 2, , ,341 2, , ,341 2, , , , ,923 1, , ,732 1,861 36,593 2, , , , , ,380 3, , , , , ,456 3, , , , ,570 33, ,588 17
18 FURTHER INFORMATION INFORMATION ABOUT THIS QUARTERLY REPORT This document complies with new guidelines for quarterly reporting in accordance with section 51 a of the Regulations of the Frankfurt Stock Exchange. As a result of amendments to European law, the legal obligation for listed companies to issue quarterly financial reports was revoked in Germany in In future, companies will have the possibility to publish a condensed quarterly report in this way for the first and third quarters of a fiscal year. INFORMATION ABOUT THE COMPANY The FP Group, which has its headquarters in Berlin, provides businesses and authorities with innovative solutions for secure and efficient communications. In addition to systems for franking and inserting mail, the company s range currently comprises services such as the collection of business mail and software solutions. Thanks to its 90-year history, the FP Group boasts a unique combination of organically grown mail processing expertise and digital know-how. The company has branches in many developed countries and has a global market share of more than 10% in the area of franking machines. In the 2016 fiscal year, the FP Group generated over EUR 200 million in revenues. It aspires to double revenues to around EUR 400 million by As part of the ACT strategy, the company will be on the attack in the core business, provide additional products services to its customers and press ahead with its digital transformation. IMPRINT INVESTOR RELATIONS / PUBLIC RELATIONS Sabina Prüser Prenzlauer Promenade Berlin Germany Tel: +49 (0) Fax: +49 (0) s.prueser@francotyp.com D s.prueser@francotyp.d .de Internet: CONCEPT AND DESIGN IR-ONE, Hamburg TEXT Hillermann Consulting, Hamburg PHOTOGRAPHY Markus Altmann SPECIAL THANKS Hauptstadt-Gym, Berlin 18
19 + FRANCOTYP- POSTALIA HOLDING AG Prenzlauer Promenade Berlin Germany Telephone: +49 (0) Telefax: +49 (0) Internet:
GERMAN MAILGENEERING. 1 / 2018 Quarterly report
 GERMAN MAILGENEERING 1 / 2018 Quarterly report Key Figures REVENUE BY QUARTER (in EUR thousand) 60,000 50,000 51,302 49,015 49,059 53,593 55,480 CAGR 3.4%* 48,941 49,447 52,475 52,978 40,000 30,000 20,000
GERMAN MAILGENEERING. 3 / 2018 Quarterly report
 GERMAN MAILGENEERING 3 / 2018 Quarterly report Key Figures REVENUE BY QUARTER (in EUR thousand) 60.000 49,059 53,593 55,480 48,941 49,447 52,475 52,978 51,789 49,520 50.000 40.000 30.000 20.000 12.1 12.4
ERSTEN QUARTALS +4.1 % REVENUES climbs to EUR million 12.7EUR MILLION EBITDA 6.7 EUR MILLION. Sound adjusted free cash flow
 HALF-YEARLY FINANCIAL REPORT 2017 KENNZAHLEN KEY FIGURES DES ERSTEN QUARTALS +4.1 % REVENUES climbs to EUR 104.4 million 12.7EUR MILLION EBITDA 6.7 EUR MILLION Sound adjusted free cash flow Revenue grows
FP GROUP UNAUDITED FINANCIAL STATEMENTS 9M 2017
 FP GROUP BERLIN 16 NOVEMBER 2017 FP GROUP UNAUDITED FINANCIAL STATEMENTS Q1 2017 AIMING AT THE GOALS FOR 2020 BERLIN 18 MAY 2017 FP-FRANCOTYP.COM 2 GROWING REVENUES ACT ASSUMPTIONS CONFIRMED REVENUES 153.9m
FP GROUP PRELIMINARY RESULTS 2017 / OUTLOOK 2018
 FP GROUP / OUTLOOK 2018 BERLIN 1 MARCH 2018 FP HAS DELIVERED ON ITS PROMISES IN 2017 REVENUE, EBITDA TARGETS MET, FREE CASHFLOW TARGET EXCEEDED PROMISED Revenue slight increase* (2016: 203.0 m) PROMISED
UNAUDITED FINANCIAL STATEMENTS Q FP GROUP INVESTORS' DAY MANAGEMENT BOARD OF FRANCOTYP-POSTALIA HOLDING AG BERLIN 28 MAY 2015
 UNAUDITED FINANCIAL STATEMENTS Q1 2015 FP GROUP INVESTORS' DAY MANAGEMENT BOARD OF FRANCOTYP-POSTALIA HOLDING AG BERLIN 28 MAY 2015 DISCLAIMER This report contains forward-looking statements on the business
FP GROUP FINANCIAL STATEMENTS H1 2017
 FP GROUP BERLIN 24 AUGUST 2017 FP GROUP ACCELERATES ACT GROWTH STRATEGY INCREASE OF REVENUES REVENUES 104.4m EBITDA 12.7m ADJ. FCF* 6.7m Revenues up by 4.1% Franking machine business plus 2.4% Mail Services
FP GROUP FINANCIAL RESULTS - 9M 2018
 FP GROUP FINANCIAL RESULTS - 9M 2018 BERLIN 15 NOVEMBER 2018 TRANSFORMATION CREATES ADDITIONAL POSITIVE DYNAMICS AT FP 9M 2018: Revenue and Earnings Growth Continue as Announced REVENUE* 157.3 m +2.2%
FP GROUP PRELIMINARY RESULTS 2016 / OUTLOOK 2017
 FP GROUP PRELIMINARY RESULTS 2016 / OUTLOOK 2017 BERLIN 2ND MARCH 2017 THE LETTER IS HERE TO STAY FP demonstrates strength With new strategy ACT FP will realise potentials We are kick-starting FP s future
FP GROUP FINANCIAL RESULTS FIRST QUARTER 2018
 FP GROUP FINANCIAL RESULTS FIRST QUARTER 2018 BERLIN 17 MAY 2018 FP MAINTAINS ITS TRANSFORMATION PATH IN Q1 2018 Q1 2018: One of the strongest quarters in FP history REVENUE* 54,9 m -1,0% EBITDA** 8.7
UNAUDITED FINANCIAL STATEMENTS HALF-YEAR 2014 // FP GROUP MANAGEMENT BOARD OF FRANCOTYP-POSTALIA HOLDING AG BIRKENWERDER 28 AUGUST 2014
 UNAUDITED FINANCIAL STATEMENTS HALF-YEAR 2014 // FP GROUP MANAGEMENT BOARD OF FRANCOTYP-POSTALIA HOLDING AG BIRKENWERDER 28 AUGUST 2014 DISCLAIMER This report contains forward-looking statements on the
FP GROUP FINANCIAL RESULTS FIRST HALF YEAR 2018
 FP GROUP FINANCIAL RESULTS FIRST HALF YEAR 2018 BERLIN 23 AUGUST 2018 AFTER 18 MONTHS OF ACT-STRATEGY: FP RECORDS POSITIVE HALF-YEAR RESULTS H1 2018: Revenue and Earnings Growth Continue REVENUE* 107.9
INTERIM REPORT I/2012. mail CommunICatIon of the future
 INTERIM REPORT I/2012 mail CommunICatIon of the future key figures for the 1st Quarter 2012 Figures in accordance with consolidated financial statements in EUR million 1.1. 31.3.2012 1.1. 31.3.2011 Changes
francotyp-postalia holding ag Interim report III / 2010 franking inserting software solutions mail services our expertise for your mail
 francotyp-postalia holding ag Interim report III / 2010 franking inserting software solutions mail services our expertise for your mail key figures to the 3rd quarter 2010 Figures in accordance with consolidated
FP GROUP ACT STRATEGY
 FP GROUP ACT STRATEGY LONDON FEBRUARY 2017 THE LETTER IS STILL ALIVE FP AT A GLANCE Founded 1923 as Franking Machine Manufacturer; public listed since 2006 Headquarters in Berlin, worldwide more then 1,000
FP-GROUP Unaudited Results Half-Year Report 2012
 FP-GROUP Unaudited Results Half-Year Report 2012 Management Board of Francotyp-Postalia Holding AG DISCLAIMER This report contains forward-looking statements on the business development of the Francotyp-
Francotyp-Postalia Holding AG QUARTERLY FINANCIAL REPORT QUARTERLY FINANCIAL REPORT FOR Q1 2008
 1 Francotyp-Postalia Holding AG QUARTERLY FINANCIAL REPORT Q12008 Q12008 OVERVIEW FRANCOTYP-POSTALIA GROUP 1 ST QUARTER 1 ST QUARTER 2008 2007 Figures in accordance with consolidated financial statements
YHY2007 // HALF-YEARLY FINANCIAL REPORT. Francotyp-Postalia Holding AG HALF-YEARLY FINANCIAL REPORT 2007
 Y Francotyp-Postalia Holding AG YHY2007 // HALF-YEARLY FINANCIAL REPORT HY2007 HY2007 FRANCOTYP-POSTALIA HOLDING AG // Overview HY HY 2 nd Quarter 2 nd Quarter FRANCOTYP-POSTALIA GROUP 2007 2006 2007 2006
Q Francotyp-Postalia Holding AG QUARTERLY FINANCIAL REPORT QUARTERLY FINANCIAL REPORT FIRST QUARTER 2007 Q12007
 1 Francotyp-Postalia Holding AG QUARTERLY FINANCIAL REPORT Q1 2007 Q12007 Q12007 FRANCOTYP-POSTALIA HOLDING AG UNTERNEHMENS- ENTWICKLUNG Overview 1 ST QUARTER 1 ST QUARTER FRANCOTYP-POSTALIA GROUP 2007
HALF-YEARLY FINANCIAL REPORT 2009 Francotyp-Postalia Holding AG
 HALF-YEARLY FINANCIAL REPORT 2009 Francotyp-Postalia Holding AG YOUR MAIL MANAGEMENT COMPANY 2 TO THE SHAREHOLDERS KONZERN-MEHRJAHRESÜBERSICHT OVERVIEW FRANCOTYP-POSTALIA-GROUP 923 EBITDA (Mio. EUR) 10.2
KEY FIGURES TOM TAILOR GROUP
 #TTGRESET I N T E R I M S TAT E M E N T A S AT 31 M A R C H 2017 Key Figures TOM TAILOR GROUP KEY FIGURES TOM TAILOR GROUP EUR million Q1 2017 Q1 2016 Revenue 218.9 218.9 0.0% TOM TAILOR Retail 64.8 63.9
Quarterly Report 03/2018
 Q3 Quarterly Report 03/2018 CENTROTEC The European Energy-Saving Company Highlights > Positive business development in German heating and ventilation market; CHP market well below expectations > Group
AHLERS AG, HERFORD Interim Report Q3 2013/14
 AHLERS AG, HERFORD Interim Report Q3 2013/14 2 INTERIM REPORT Q3 2013/14 AHLERS AG INTERIM REPORT Q3 2013/14 (December 1, 2013 to August 31, 2014) BUSINESS PERFORMANCE IN THE FIRST NINE MONTHS OF FISCAL
Group Half-Yearly Financial Report April 1 September 30, 2015 P&I Personal & Informatik AG
 Group Half-Yearly Financial Report April 1 September 30, 2015 P&I Personal & Informatik AG KEY FIGURES AND HIGHLIGHTS 2 KEY FIGURES IFRS KEY FIGURES FOR THE GROUP Apr. 1 - Sept. 30, 2015 Apr. 1 - Sept.
Orell Füssli Half-year Financial Report 2013
 Orell Füssli Half-year Financial Report 2013 editorial Editorial Dear shareholder, In the first six months of this year Orell Füssli registered only a slight improvement in operating earnings (EBIT) and
THE NEW FREEDOM IN BUSINESS COMMUNI CATIONS.
 THE NEW FREEDOM IN BUSINESS COMMUNI CATIONS. Interim report Q3 2018 KEY FIGURES Business customers 20,000 + Development of seats 305,000 + Revenue 9 months 2018 EUR 31.2 M Share of recurring revenue 81
Basware grew SaaS revenues by 99% and continued to invest in enablers for the 2018 strategy
 Interim Report 1 (24) BASWARE INTERIM REPORT JANUARY 1 - JUNE 30, 2016 (IFRS) SUMMARY Basware grew SaaS revenues by 99% and continued to invest in enablers for the 2018 strategy January-June 2016: - Net
Net income for the period % %
 QUARTERLY STATEMENT Q3 2018 Key figures KION Group overview in million Q3 2018 Q3 2017 * Change Q1 Q3 2018 Q1 Q3 2017 * Change Order intake 2,060.3 1,847.2 11.5% 6,369.3 5,699.5 11.8% Revenue 1,895.9 1,832.4
9-Month Report of FJA AG
 www.fja.com 9-Month Report of FJA AG 01.01.2008-30.09.2008 Contact FJA AG Elsenheimerstrasse 65 80687 Munich GERMANY Investor Relations Phone: + 49 89 76901-274 or -7002 Fax: + 49 89 7698813 Email: investor.relations@fja.com
N O R M A G R O U P S E
 NORMA GROUP SE Overview of Key Figures Q3 2017 1 Q3 2016 1 Q1 Q3 2017 1 Q1 Q3 2016 1 Order situation Oder book (Sep 30) EUR millions 322.7 282.7 Income statement Revenue EUR millions 244.4 216.6 763.4
Stock exchange release
 1 (17) Stock exchange release 27 April at 8:10 am INTERIM REPORT OF COMPTEL CORPORATION 1 JANUARY - 31 MARCH Net sales on last year s level Backlog increased by 10.1 Key figures for the First Quarter of
1 January 31 March 2018
 TALENOM PLC. BUSINESS REVIEW JANUARY MARCH 2018 (UNAUDITED): STRONG GROWTH CONTINUED, PROFITABILITY ROSE SIGNIFICANTLY - NET SALES UP BY 18.1%, EBIT UP BY 42.4% 1 January 31 March 2018 Talenom is an accounting
Quarterly Statement January 1 to March 31, 2016 Dräger Group
 Quarterly Statement January 1 to March 31, 2016 Dräger Group THE DRÄGER GROUP over the past five years 2012 2013 2014 2015 2016 Order intake million 550.9 571.3 544.6 615.3 599.6 Net sales million 529.3
Quarterly Financial Report 30 September 2017
 Quarterly Financial Report 30 September 2017 Aumann AG, Beelen Welcome Note from the Managing Board Dear fellow shareholders, After a highly successful first half of the year, the third quarter of 2017
for the 1st Quarter from January 1 to March 31, 2017
 Quarterly STATEMENT for the 1st Quarter from January 1 to March 31, 2017 Wherever you go. gigaset 1 st Quarterly statement 2017 key figures millions 01/01/-03/31/2017 01/01/-03/31/2016 1 Consolidated revenues
INTERIM REPORT
 INTERIM REPORT 1.9.2010-28.2.2011 2 Vaahto Group For the period September 1, 2010 February 28, 2011 Vaahto Group s turnover for September 1, 2010, to February 28, 2011, was 24.9 million euros (compared
Francotyp-Postalia Holding AG. Financial Statements 2008 Analysts Conference 28 April 2009
 Francotyp-Postalia Holding AG Financial Statements 2008 Analysts Conference 28 April 2009 Francotyp-Postalia (FP) at a Glance Overview FP-Group covers the entire value chain in the outbound mail market
1. Consolidated balance sheet Inventories Consolidated income statement Consolidated statement of comprehensive income 50
 1. Consolidated balance sheet 48 12. Inventories 63 2. Consolidated income statement 49 13. Trade receivables 63 3. Consolidated statement of comprehensive income 50 14. Other current assets 64 4. Consolidated
Geratherm Medical AG Half-yearly report Jan.-June 2010
 Geratherm Medical AG Half-yearly report 2010 2 GERATHERM AT A GLANCE Group financial ratio Jan.-June 2010 Jan.-June 2009 Change Turnover 7,997 keur 6,345 keur 26.0% Including export share 6,946 keur 5,086
Half-yearly Financial Report. 1 January - 30 June 2018
 Half-yearly Financial Report 1 January - 30 June 2018 Quarterly Financial Report Table of contents Table of contents LPKF Laser & Electronics AG at a glance... 3 Chairman's Statement... 4 Interim Management
Temenos reports very strong Q3 results, full year guidance raised and share buyback announced
 Temenos reports very strong Q3 results, full year guidance raised and share buyback announced GENEVA, Switzerland, 18 October 2017 Temenos Group AG (SIX: TEMN), the software specialist for banking and
GROUP QUARTERLY STATEMENT AS AT 30 SEPTEMBER
 GROUP QUARTERLY STATEMENT AS AT 30 SEPTEMBER 2017 CONTENT BUSINESS PERFORMANCE 1 OVERVIEW OF KEY GROUP FIGURES 2 EARNINGS PERFORMANCE 4 FINANCIAL POSITION 6 CASH FLOW 8 SIGNIFICANT EVENTS IN THE REPORTING
Basware expects its net sales and operating profit (EBIT) for 2015 to grow compared to 2014.
 for 2015 to grow compared to 2014.") Interim Report 1 (21) BASWARE INTERIM REPORT JANUARY 1 SEPTEMBER 30, 2015 (IFRS) SUMMARY Revenue developed favourably with key markets growing 95 percent January September 2015: - Net sales EUR 104 200
Interim Report 1 (21) BASWARE INTERIM REPORT JANUARY 1 SEPTEMBER 30, 2015 (IFRS) SUMMARY Revenue developed favourably with key markets growing 95 percent January September 2015: - Net sales EUR 104 200
Quarterly Financial Report. 1 January - 31 March 2018
 Quarterly Financial Report 1 January - 31 March 2018 Quarterly Financial Report Table of contents Table of contents LPKF Laser & Electronics AG at a glance... 3 Chairman's Statement... 4 Interim Management
Quarterly Statement 1 st quarter 2018
 Quarterly Statement 1 st quarter 2018 Selected figures (unaudited) Sales and result 01/01-03/31/2018 01/01-03/31/2017 Change Sales (KEUR) 2,782 3,095-10% EBITDA (KEUR) -1,588-1,665 +5% EBIT (KEUR) -1,998-2,151
Strong finish to the year
 full year report, entraction holding ab 1 january 31 december Strong finish to the year, october december Net sales amounted to SEK 86.6 (108.7) million, a decline of 20.3%. Disregarding the currency effect
2006 FULL YEAR RESULTS. March / April 2007
 2006 FULL YEAR RESULTS March / April 2007 DISCLAIMER Safe Harbour Statement This presentation contains forward-looking statements (made pursuant to the safe harbour provisions of the Private Securities
GROUP QUARTERLY STATEMENT AS AT 30 SEPTEMBER
 GROUP QUARTERLY STATEMENT AS AT 30 SEPTEMBER 2016 CONTENT BUSINESS PERFORMANCE 1 OVERVIEW OF KEY GROUP FIGURES 3 EARNINGS PERFORMANCE 5 FINANCIAL POSITION 7 CASH FLOW 8 SIGNIFICANT EVENTS IN THE REPORTING
QUARTERLY FINANCIAL REPORT FOR Q Francotyp-Postalia Holding AG QUARTERLY FINANCIAL REPORT
 3 Francotyp-Postalia Holding AG QUARTERLY FINANCIAL REPORT Q32008 Q32008 FRANCOTYP-POSTALIA HOLDING AG OVERVIEW FRANCOTYP-POSTALIA GROUP Jan. 1 Jan. 1 Sept. 30, Sept. 30, 3 RD QUARTER 3 RD QUARTER 2008
Jan.-March Result per share pursuant to DVFA* 0.18 EUR 0.02 EUR >100.0 %
 Geratherm Medical AG Interim Report 1 st Quarter of 2010 2 GERATHERM AT A GLANCE Group financial ratio Jan.-March 2009 Jan.-March 2008 Change Turnover 3,958 3,113 27.2 % Including export share 3,417 2,386
QUARTERLY FINANCIAL REPORT MARCH 31, 2015
 QUARTERLY FINANCIAL REPORT MARCH 31, 2015 MBB SE, Berlin MBB in figures Page 1 MBB in figures Three months 2015 2014 Δ 2015 / (unaudited) 2014 IFRS IFRS Earnings figures thou thou % Revenue 60,241 55,618
Interim Report. 1 January to 30 June
 Interim Report 1 January to 30 June 14 01 CONTENTS INTERIM MANAGEMENT REPORT 3 Results of Operations of the Group 3 Financial Position and Net Assets of the Group 4 Other Disclosures 5 Opportunities and
ELISA STOCK EXCHANGE RELEASE 01 AUGUST 2008 AT 8.30 am ELISA S INTERIM REPORT JANUARY-JUNE 2008
 ELISA STOCK EXCHANGE RELEASE 01 AUGUST 2008 AT 8.30 am ELISA S INTERIM REPORT JANUARY-JUNE 2008 Second quarter 2008 Revenue was EUR 372 million (393) EBITDA excluding non-recurring items was EUR 109 million
Interim management statement
 Interim management statement 1st to 3rd quarter of 2017 FIRST TO THIRD QUARTER AT A GLANCE DEUTZ Group: Overview 7 9/2017 7 9/2016 1 9/2017 1 9/2016 New orders 370.8 258.1 1,173.8 935.3 Unit sales (units)
BMW Group Corporate Communications
 18 March 2008 BMW Group heading towards a successful year in 2008 Adjusted pre-tax earnings will be above last year s level All-time high sales volume levels expected for all three brands Munich. The BMW
COMMIT DELIVER AND I N T E R I M S T A T E M E N T AS AT 3 0 SEP TEM B ER
 COMMIT AND DELIVER I N T E R I M S T A T E M E N T AS AT 3 0 SEP TEM B ER 2 0 1 8 Key Figures TOM TAILOR GROUP KEY FIGURES TOM TAILOR GROUP EUR million Revenue Q3 2017 Change relative Q1 Q1 Q3 2017 Change
Quarterly Financial Report. 1 January - 30 September 2017
 Quarterly Financial Report 1 January - 30 September 2017 Quarterly Financial Report Table of contents Table of contents LPKF Laser & Electronics AG at a glance... 3 Spokesman's Statement... 4 Interim Management
Interim Financial Report (IFRS) Consolidated Statement of Profit or Loss
 Consolidated Statement of Profit or Loss") Interim Financial Report (IFRS) Consolidated Statement of Profit or Loss Revenue 142,541 126,034 Cost of sales (115,781) (110,593) Gross Profit 26,760 15,441 Distribution costs (7,390) (6,827) General
Interim Financial Report (IFRS) Consolidated Statement of Profit or Loss Revenue 142,541 126,034 Cost of sales (115,781) (110,593) Gross Profit 26,760 15,441 Distribution costs (7,390) (6,827) General
INTERIM FINANCIAL REPORT H Company Announcement no. 704
 INTERIM FINANCIAL REPORT H1 2018 Company Announcement no. 704 1 August 2018 Selected financial and operating data for the period 1 January - 30 June 2018 (DKKm) Q2 2018 Q2 2017 YTD 2018 YTD 2017 Net revenue
INTERIM FINANCIAL REPORT Third quarter 2013 Company Announcement No. 521
 INTERIM FINANCIAL REPORT Third quarter 2013 Company Announcement No. 521 29 October 2013 Selected financial and operating data for the period 1 January - 30 September 2013 Q3 2013 Q3 2012 YTD 2013 YTD
annual results
 Press release www.steria.com Paris, France, 28 February 2014 2013 1 annual results Strong year-end momentum spells bright prospects for 2014 Order intake in the fourth quarter set off the Group s growth
Management s Review. LM Group Holding A/S Q Interim Report. Summary
 Management s Review Summary LM Group Holding A/S and its subsidiaries ( LM Wind Power, the Company or the Group ) are pleased to announce continued strong quarterly performance in Q3 2015. Sales for the
January to September Interim Statement
 January to September 2017 Interim Statement Summary of consolidated results Sales EUR K 65,927 53,100 24.2 % Operating performance EUR K 65,927 53,446 23.4 % Total operating revenue EUR K 69,055 54,928
Half-Year Report 2010
 Half-Year Report 2010 Hügli Holding AG, Steinach Key figures in brief million CHF Jan.-June Variance in Jan.-June Key figures of the group 2010 CHF local currency 2009 Sales 196.0 1.6% 4.6% 192.9 Operating
BUILDING THE FUTURE TOGETHER HALF YEAR REPORT AS OF JUNE 30, 2017
 HALF YEAR REPORT AS OF JUNE 30, 2017 BUILDING THE FUTURE TOGETHER To our shareholders Patrik Heider, Spokesman of the Executive Board and CFOO The Nemetschek Group has continued on its course of dynamic
Q3 Earnings Release/2003
 This publication is available in Danish and English. In case of any discrepancies, the Danish version shall be the governing text. November 5, 2003 Announcement No. 18 Q3 Earnings Release/2003 At a meeting
KCE Electronics Public Company Limited and its subsidiaries
 Statements of financial position Consolidated financial Separate financial 31 December 31 December 31 December 31 December Assets Note 2014 2013 2014 2013 Current assets Cash and cash equivalents 7 463,016,990
ASIAKASTIETO GROUP PLC. Interim Report 1 January 30 June 2015
 ASIAKASTIETO GROUP PLC Interim Report 1 January 30 June 2015 Asiakastieto Group Plc Työpajankatu 10 A P.O.Box 16 FI-00581 Helsinki Tel. +358 10 270 7000 investors.asiakastieto.fi Asiakastieto Group s interim
INTERIM REPORT JANUARY - JUNE 2011
 INTERIM REPORT JANUARY - JUNE INTERIM GROUP MANAGEMENT REPORT RIB SOFTWARE AG INTERIM GROUP MANAGEMENT REPORT A. BUSINESS AND GENERAL ENVIRONMENT Development of the world economy and effects on IT investments
Report on the first half of fiscal 2009
 Report on the first half of fiscal 2009 Table of Contents 3 Letter to the Shareholders 4 Management Report 8 Interim Financial Statement 9 Consolidated income statement for the period 01.01.2009 30.06.2009
Fourth quarter and full year 2017 results
 Fourth quarter and full year 207 results FINANCIAL AND OPERATIONAL HIGHLIGHTS Financial summary Q4 '7 Revenue of 220 million (Q4 '6: 266 million) Gross margin of 59% (Q4 '6: 58%) EBITDA of 37 million (Q4
Orders received in CHF million. Sales in CHF million. EBIT in CHF million. Capital expenditures in CHF million
 Semi-Annual Report 2 Rieter. Semi-Annual Report. Rieter at a glance Rieter at a glance Orders received in Sales in EBIT in Capital expenditures in HY1 15 HY2 15 HY1 16 HY1 15 HY2 15 HY1 16 HY1 15 HY2 15
Statement on the first 9 months of 2018
 Statement on the first of 2018 Landsberg am Lech, 30 October 2018 2 RATIONAL AG Statement on the first of 2018 RATIONAL AG on a successful path again in the third quarter of 2018 10% growth in sales revenues
PRESS RELEASE. Sales came to million in 2009, down 0.5% compared with 2008, or down 0.3% at constant exchange rates.
 2009: A ROBUST PERFORMANCE IN A PARTICULARLY CHALLENGING ENVIRONMENT Current operating margin1 maintained at 25.7% of sales 2009 dividend: 3.80 euros per share Full-year sales virtually unchanged: -0.3%
Revenue up 5%; operating profit up 22%
 2018 annual figures press release 1/11 Revenue up 5%; operating profit up 22% Recurring revenue grew by 20% Groenlo, the Netherlands, 14 February 2019 Highlights of the 2018 financial year Revenue grew
METSÄ BOARD CORPORATION HALF YEAR FINANCIAL REPORT JANUARY-JUNE 2016
 METSÄ BOARD CORPORATION HALF YEAR FINANCIAL REPORT JANUARY-JUNE 2016 Half year financial report 1 January 30 June 2016 4 August 2016 at 12:00 noon Page 1/30 METSÄ BOARD CORPORATION S OPERATING RESULT EXCLUDING
Interim Report as of September 30, NorCell Sweden Holding 2 AB (publ) Group
 Group") Interim Report as of September 30, 2015 NorCell Sweden Holding 2 AB (publ) Group FOR IMMEDIATE RELEASE Date: November 3, 2015 Time: 07:30 CET IMPORTANT INFORMATION For investors and prospective investors
Interim Report as of September 30, 2015 NorCell Sweden Holding 2 AB (publ) Group FOR IMMEDIATE RELEASE Date: November 3, 2015 Time: 07:30 CET IMPORTANT INFORMATION For investors and prospective investors
INTERIM FINANCIAL REPORT First quarter 2013 Company Announcement No. 493
 INTERIM FINANCIAL REPORT First quarter 2013 Company Announcement No. 493 30 April 2013 Selected financial and operating data for the period 1 January 31 March 2013 2013 2012 Revenue 10,981 10,819 Gross
Quarterly Statement as of September 30, 2017
 Quarterly Statement as of September 30, 2017 7 Group Key Figures in millions Q3/2017 Q3/2016 Change 9M/2017 9M/2016 Change Group Segments 3) Revenues Liquidity and financial position Share-related key
17 Semi-Annual Report We Enable Energy
 17 Semi-Annual Report We Enable Energy Von Roll s order intake came to CHF 186.4 million in the first half of 2017. Sales amounted to CHF 176.8 million. EBIT amounted to CHF 7.3 million. Von Roll generated
Well prepared 9M Report 2017
 Well prepared 9M Report 2017 Key share data Ticker / ISIN AM3D / DE000A111338 Letter from the CEO Dear shareholders, customers, business partners and colleagues, Number of shares 17,980,867 Closing price
Improved profitability as simplification measures reduce cost
 K E N D R I O N N. V. I N T E R I M R E P O R T 2 0 1 6 1 8 A u g u s t 2 0 1 6 Improved profitability as simplification measures reduce cost - Revenue for Q2 2016 stable at EUR 114.1 million (Q2 2015:
TRAINERS' HOUSE GROUP'S INTERIM REPORT FOR 1 JANUARY 30 JUNE 2013
 TRAINERS' HOUSE GROUP'S INTERIM REPORT FOR 1 JANUARY 30 JUNE 2013 January June 2013 in brief (the figures are figures for the company s continuing operations) Net sales amounted to EUR 5.5 million (EUR
Interim Report January March
 2018 Interim Report January March KPIs In CHF million, except where indicated 31.3.2018 31.3.2017 Change Revenue and results Net revenue 1 2,885 2,831 1.9% Operating income before depreciation and amortisation
ELISA STOCK EXCHANGE RELEASE 24 OCTOBER 2008 AT 8.30 am ELISA S INTERIM REPORT JANUARY-SEPTEMBER
 ELISA STOCK EXCHANGE RELEASE 24 OCTOBER 2008 AT 8.30 am ELISA S INTERIM REPORT JANUARY-SEPTEMBER Third quarter 2008 Revenue was EUR 374 million (394) EBITDA was EUR 129 million (132), EBIT EUR 77 million
STOCK EXCHANGE RELEASE 29 AUGUST 2018 at 9:00 hrs
 DIGITALIST GROUP INTERIM REPORT 1 JANUARY - 30 JUNE 2018 DIGITALIST 2018 INTERNATIONALIZING GROWTH SUMMARY April June 2018 (figures for 2017 in brackets): Turnover EUR 6.2 million (EUR 4.7 million), growth
Quarterly statement Q3 2017
 The Next Smart Device: The Car! Quarterly statement Q3 2017 July 1 to September 30, 2017 Further growth and improved profitability Sales +9.3% to 61.6 million Euro Demand for Elmos products remains positive.
SIX-MONTH REPORT 2018
 SIX-MONTH REPORT 2018 KAP at a glance GROUP KEY FIGURES in millions 01/01-06/30/ 2018 01/01-06/30/ 2017 2017 External revenue 228.6 215.9 407.5 Personnel expenses 52.1 46.3 97.7 Investments 14.4 8.9 24.6
ASSETS 31 December December 2016
 Condensed Consolidated Interim Balance Sheet as at 31 December 2017 ASSETS 31 December 2017 31 December 2016 Current Assets Cash and Cash Equivalents 7.132 5.159 Financial Investments 736 1.228 Trade Receivables
Financial section. rec tic el // a n n u a l r e po rt
 04 // Financial section 79 04 rec tic el // a n n u a l r e po rt 2 0 0 8 // Table of contents I. // DEFINITIons 81 II. // FINANCIAL STATEMENTS 82 II.1. Consolidated income statement 82 II.2. Consolidated
Income Statement. for the financial year ended 31 March 2011
 Income Statement for the financial year ended 31 March Continuing operations Revenue 5 1,220,183 1,141,964 Other income 6 3,776 2,350 Share of net loss of associate accounted for using the equity method
OPEN INNOVATIVE FOCUSED SOLID
 OPEN INNOVATIVE FOCUSED SOLID QUARTERLY STATEMENT AS OF MARCH 31, 2018 To our shareholders Patrik Heider, Spokesman of the Executive Board and CFOO The Nemetschek Group began the 2018 fiscal year according
FINANCIAL REPORT 3RD QUARTER ST NINE MONTHS 2017
 QUARTERLY FINANCIAL REPORT 3RD QUARTER 2017 1ST NINE MONTHS 2017 Positive earnings trend continued in the third quarter Outlook specified 3rd quarter Organic sales growth driven by higher volumes (4 percent)
Press Release. Outlook
 Press Release October 26, 2018 Signify reports third quarter sales of EUR 1.6 billion, improvement in operational profitability by 150 bps to 12.0% and free cash flow to EUR 64 million 2018 1 Sales of
Consolidated Statement of Profit or Loss (in million Euro)
") Consolidated Statement of Profit or Loss (in million Euro) Q3 2015 Q3 2016 % change 9m 2015 9m 2016 % change Revenue 661 625-5.4% 1,974 1,873-5.1% Cost of sales (453) (415) -8.4% (1,340) (1,239) -7.5%
Consolidated Statement of Profit or Loss (in million Euro) Q3 2015 Q3 2016 % change 9m 2015 9m 2016 % change Revenue 661 625-5.4% 1,974 1,873-5.1% Cost of sales (453) (415) -8.4% (1,340) (1,239) -7.5%
RESULTS FOR Significant strategic advances in 2007, resumption dividend payment
 PRESS RELEASE KENDRION N.V. RESULTS FOR 2007 26 FEBRUARY 2008 Significant strategic advances in 2007, resumption dividend payment - Significant headway made with strategy of Focused Acceleration, including
Consolidated Statement of Profit or Loss (in million Euro)
") Consolidated Statement of Profit or Loss (in million Euro) Q1 2016 Q1 2017 % change Revenue 603 588-2.5% Cost of sales (408) (396) -2.9% Gross profit 195 192-1.5% Selling expenses (84) (86) 2.4% Research
Consolidated Statement of Profit or Loss (in million Euro) Q1 2016 Q1 2017 % change Revenue 603 588-2.5% Cost of sales (408) (396) -2.9% Gross profit 195 192-1.5% Selling expenses (84) (86) 2.4% Research
Second Quarter Results 2013
 Second Quarter Results 2013 12 July 2013 ELISA STOCK EXCHANGE RELEASE 12 JULY 2013 AT 8:30am ELISA S INTERIM REPORT JANUARY - JUNE 2013 Second quarter 2013 PPO companies consolidated as of 1 May 2013 Revenue
Q30 Third 8 QuarTer Trading update 2008
 Q308 Third Quarter Trading UPDATE 2008 key figures FIG. 1, PAGE 6/7 net sales and ebit margin IN KEUR 8,000 6,000 4,589 5,006 5,207 5,511 5,488 6,707 7,512 7,644 7,200 7,635 8,329 20 % 15 % 4,000 10 %
FRANCOTYP-POSTALIA HOLDING AG. The Digital Mailroom
 FRANCOTYP-POSTALIA HOLDING AG The Digital Mailroom ANNUAL REPORT 2014 What are the distinctive characteristics of a Digital Mailroom? * FACTS AND FIGURES Efficiency. For customers communication. * WHETHER