SRV - Constructively different
|
|
|
- Jasmine Clark
- 6 years ago
- Views:
Transcription
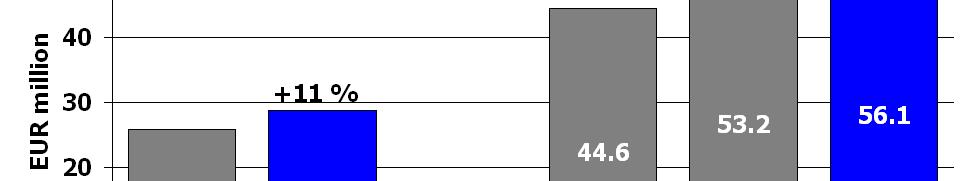
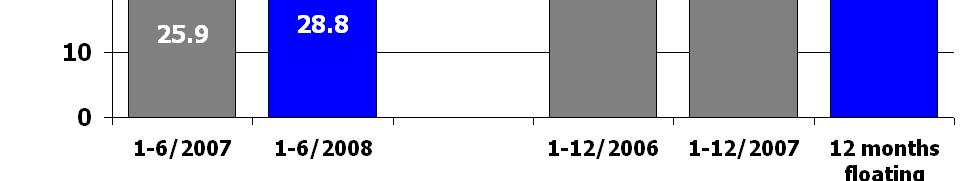
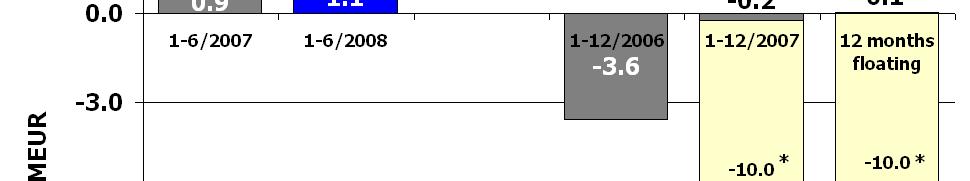
1 SRV - Constructively different Quarterly Report January- June 2008 Eero Heliövaara August 19th, 2008 SRV JULKINEN Hannu Linnoinen 1
2 SRV s successful first half of the year Group s operating profit grew by 74.9 per cent Business Premise construction still going strong Revenue +29.9%, operating profit margin 9.2 (4.3) Contract for Helsinki Music Centre was signed in June Order backlog back to the level on the turn of the year Housing business area still flat The market has clearly slowed down, selling times have prolonged, number of start-ups has decreased Housing sales in Q2 improved somewhat on Q1 Significant business launches in Russia EUR 60 million investment in St. Petersburg to start a mega project Significant progress in many projects The hotel in Ekaterinburg was sold in July, positive effect on profit later SRV JULKINEN Hannu Linnoinen 2 2
3 1-6/2008 in brief 1-6/ / 2007 change, % change, MEUR 1-12/ 2007 Revenue % Operating Profit % Operating Profit, % 6.3% 4.0% 2.7% Financial income and expenses, total % Profit before taxes % Net profit for the period % Earnings per share. EUR Number of shares outstanding (million) % Order backlog % Equity ratio, % SRV JULKINEN Hannu Linnoinen 3 3
4 4-6/2008 in brief 4-6/ / 2007 change, % 1-3/ / 2007 Revenue % Operating Profit % Operating Profit, % 6.4% 4.8% 6.1% 2.9% Financial income and expenses, total % Profit before taxes % Net profit for the period % Earnings per share. EUR Number of shares outstanding (million) % SRV JULKINEN Hannu Linnoinen 4 4


5 SRV Group SRV JULKINEN Hannu Linnoinen 5 5


6 Business Premises SRV JULKINEN Hannu Linnoinen 6 6


7 Housing SRV JULKINEN Hannu Linnoinen 7 7
8 SRV s developer contracting residential production in Finland Developer contracting residential production in Finland (units) 1-6/ / 2007 change, units 4-6/ / / 2007 Start-ups Sold Completed Completed and unsold 1) Under construction 1) ) at the end of the period SRV JULKINEN Hannu Linnoinen 8 8
9 Housing market in Helsinki Metropolitan area * Around 500 unsold, completed residential units (SRV 52) ** Housing production, total , , , ,184 * Under construction 2,239 Around 20 per cent more residential units for sale than last year Structural housing shortage is building up in the Helsinki Metropolitan area Sources: * etuovi.com (15 August 2008) and ** Statistics Finland SRV JULKINEN Hannu Linnoinen 9 9


10 International SRV JULKINEN Hannu Linnoinen 10 10
11 Order backlog 600 EU R million International Housing Business /06 6/06 9/06 12/06 3/07 6/07 9/07 12/07 3/08 6/08 SRV JULKINEN Hannu Linnoinen 11 11
12 Business outlook for 2008 Construction of business premises is estimated to remain at its present level this year. Selling times of residences have lengthened in Finland, demand d has decreased d and the demand d is estimated t to focus on projects that are close to completion. Russia s strong economic growth is set to support the development of International Operations. The volume and nature of the order backlog support the level of revenue and earnings in 2008 and provide a favourable basis for the operating profit trend. The sale of the Park Inn hotel in Ekaterinburg is estimated to bring in operating profit of EUR 13 million in the latter part of the year. Due to uncertainties concerning housing sales, revenue in 2008 is expected to remain on the 2007 level. The group s operating profit is anticipated to outperform 2007 by a substantial margin, and the Q operating profit is expected to surpass the Q operating profit. SRV JULKINEN Hannu Linnoinen 12 12
13 Market SRV JULKINEN Hannu Linnoinen 13 13


14 Business Premise market in Finland Plenty of offices will be completed in Helsinki metropolitan area in 2008 and 2009 no signs of fall in rental levels l vacancy rates still on healthy level competition in construction tightens added value and potential through development Commercial construction has steadied growth in large-volume retail has snapped low vacancy rates structural demand in shopping centres Brisk logistics construction has continued low vacancy rates Property prices have levelled off good projects sell well still financing tightens number of transactions has decreased SRV JULKINEN Hannu Linnoinen 14 14


15 Residential market in Finland Stand-by atmosphere in residential market number of completed, unsold residential units has slightly decreased in the first part of the year 1,413 units in June 2008, 1,451 units at the beginning of the year selling times have prolonged big regional differences apartments in city centres sell possible decline in interest level and tax cuts may dissolve pent-up demand structural demand in growth locations SRV JULKINEN Hannu Linnoinen 15 15


16 Real estate and construction market in Russia Strong growth in real estate market in Russia Estimated growth of Russian economy +7.6% in 2008 Structural development in real estate market rental levels are rising investors yield requirements have levelled off number of investors grows steadily Shortage of modern premises in Moscow and St. Petersburg, in particular tenant demand and interest in investing remain high SRV JULKINEN Hannu Linnoinen 16 16


17 Major developer contracting projects under construction Volume Ownership Completion Business premises Keilaniemi HTC 39,200 m2 sold to MEAG 8/2007 1/2009 Park Inn hotel in Ekaterinburg 160 rooms 100 %, sold 7/2008 completed Keravanportti-business premises 7,200 m2 REFF I Ky, sold 3/2008 8/2008 Kuninkaanportti-business premises 4,300 m2 100 % 9/2009 Kamppiparkki parking garage 500 spaces 100% 11/2008 Etmia, offices + parking Moscow 14,000 m2 50 % 2008 Mitischi, shopping centre Moscow 100,000 m2 25% 07/08 contract EUR 107 million 12/2008 final investment decision Housing Espoon Vallikallion Helmi 67 units 100 % spring/2009 Vantaan Ulrikanhuippu 46 units 51 % spring/2009 Töölön Oscar, phase 1 65 units 100 % fall/2009 Papula, Vyborg 36 units 100 % 12/
 completion at the end of 2008, tenant search in progress Mytischi")
 8.")


 completion o at the end of 2008 Park Inn hotel (Ekaterinburg) hotel")
18 Development of business and projects in Russia Etmia II office project (Moscow) completion at the end of 2008, tenant search in progress Mytischi shopping centre (Moscow) commercialisation continues, contract signed final investment decision by the end of 2008 Area development (St. Petersburg) 8.5 hectares, office and commercial premises EUR 50 million invested, development and construction starts in 2009 Eurograd - logistics area (St. Petersburg) ownership raised to 49 per cent, majority by the end of 2008 construction starts by the end of 2008 Further renovation of Rezidor hotels (St. Petersburg) Pulkovskaya and Pribaltiskaya hotels Papula housing project (Vyborg) completion o at the end of 2008 Park Inn hotel (Ekaterinburg) hotel property sold 7/
19 SRV Constructively different Thank you! 19
20 SRV s strategy SRV JULKINEN Hannu Linnoinen 20 20


21 Success is based on 20 years of experience Own property development Project management implementation Committed personnel Managing the business as one entity 21 21

22 Business focus Finland A leading commercial constructor Focus on growth centres and increasingly i on residential construction Oulu Tampere Turku Helsinki Tallinn Riga Vyborg St. Petersburg Moscow Russia >60 completed projects Moscow and St. Petersburg region and other large cities Focus on commercial construction Yekaterinburg Nizhniy Kazan Novgorod Samara The Baltic countries >70 completed projects Focus on commercial construction Selective residential projects Vilnius 22


23 Basis for Competitiveness Project development Project management model SRV Approach 23
24 SRV Approach SRV SRV Approach Malli Customer Network SRV Needs and changes in operational environment Use of property Subcontractor Network 24

25 Diversified business portfolio Proper rty Deve elopmen nt Business Premises Housing International Shopping centers, retail parks Offices and hotels Logistics centers Apartments t in city centers Terraced house projects Shopping centers Offices and hotels Logistics centers 25
26 Flexible capacity flexible structure 26
27 SRV's operational models 27


28 SRV s financial targets Annual average growth of 15 % in Group revenue in the medium term Annual average growth of more than 30 % in the International business area Equity ratio at least 30 % To increase the Operating profit margin to 8 % in the medium to long term 28
29 SRV Quarterly Report January June 2008 Appendices 29
30 Group key figures IFRS IFRS IFRS IFRS IFRS Group key figures 1-6/ 1-6/ change, change, 4-6/ 4-6/ 1-12/ (EUR million) MEUR % Revenue Operating profit Financial income and expenses, total Profit before taxes Net profit for the period Order backlog Operating profit, % Net profit, % Equity ratio, % Net interest bearing debt Gearing, % Return on investment, % 1) Return on equity, % 1) Earnings per share, EUR 2) Equity per share, EUR 2) Weighted average number of shares outstanding ) In calculating the key ratio only the profit for the period has been annualised. 2) Key figures per share have been adjusted to reflect the increase in the number of shares, which came into effect on 11 April 2007 (split), the rights issue on 11 June 2007 and the rights issue and cancellation of treasury shares in connection with the merger of the SRV Henkilöstö Oy on 28 September 2007 and purchases of own shares 30
31 Key figures (1) IFRS IFRS IFRS IFRS IFRS 1-6/ / / / / 2007 Revenue EUR million Operating profit EUR million Operating profit, % of revenue % Profit before taxes EUR million Profit before taxes, % of revenue % Net profit attributable t bl to equity holders of the parent company EUR million Return on equity 1 % Return on investment 1 % Invested capital EUR million Equity ratio % Net interest-bearing debt EUR million Gearing ratio % Order backlog Personnel on average Property, plant and equipment investments EUR million Property, plant and equipment investments, % of revenue %
32 Key figures (2) IFRS IFRS IFRS IFRS IFRS 1-6/ / / / / 2007 Earnings per share, share issue adjusted 2 EUR Equity per share, share issue adjusted 2 EUR Dividend per share, share issue adjusted EUR Dividend payout ratio % Dividend yield % Price per earnings ratio Share price development Share price at the end of the period EUR Average share price EUR Lowest share price EUR Highest share price EUR Market capitalisation at the end of the period EUR million Trading volume 1, Trading volume % Weighted average number of shares outstanding 1, Number of shares outstanding at the end of the period 1, ) In calculating the key ratio only the profit for the period has been annualised 2) Key figures per share have been adjusted to reflect the increase in the number of shares, which came into effect on 11 April 2007 (split), the rights issue on 11 June 2007 and the rights issue and cancellation of treasury shares in connection with the merger of the SRV Henkilöstö Oy on 28 September 2007 and purchases of own shares 32
33 Consolidated income statement Consolidated income statement (EUR million) IFRS IFRS IFRS IFRS IFRS 1-6/ 1-6/ change, change, 4-6/ 4-6/ 1-12/ MEUR % Revenue Other operating income Change in inventories of finished goods and work in progress Use of materials and services Employee benefit expenses Depreciation and impairments i Other operating expenses Operating profit Financial income Financial expenses Financial income and expenses, total Profit before taxes Income taxes Net profit for the period Attributable to Equity holders of the parent company Minority interest Earnings per share calculated on the profit attributable to equity holders of the parent company (undiluted and diluted) 1) ) Key figures per share have been adjusted to reflect the increase in the number of shares, which came into effect on 11 April 2007 (split), new issue of shares on 11 June 2007 and the new issue of shares and the cancellation of treasury shares in connection with the merger of the SRV Henkilöstö Oy on 29 September 2007 and purchases of own shares 33
34 Consolidated balance sheet: Assets ASSETS Consolidated Balance Sheet IFRS IFRS change IFRS (EUR million) % Non-current assets Property, plant and equipment Goodwill Other intangible assets Other financial assets Receivables Deferred tax assets Non-current assets, total Current assets Inventories Trade and other receivables Current tax receivables Cash and cash equivalents Current assets, total ASSETS, TOTAL
35 Consolidated balance sheet: Equity and liabilities EQUITY AND LIABILITIES Consolidated Balance Sheet IFRS IFRS change IFRS (EUR million) % Equity attributable to equity holders of the parent company Share capital Invested free equity fund Translation differences , Fair value reserve Retained earnings Equity attributable to equity holders of the parent company, total Minority interest Equity, total Non-current liabilities Deferred tax liabilities Provisions Interest-bearing liabilities Other liabilities Non-current liabilities, total Current liabilities Trade and other payables Current tax payables Provisions Interest-bearing liabilities Current liabilities, total Liabilities, total EQUITY AND LIABILITIES
36 Changes in Group equity 1-6/2008 Equity attributable to the equity holders of the parent company Share Invested Translationed value (EUR million) capital m equity dff differ- Retai- Fair IFRS Share premiu free reserve earnings reserve fund ences Total Minority interest Total equity Equity on Translation differences Net gains on availablefor-sale financial assets Other changes Net income recognised directly in equity Net profit for the period Total income and expenses for the period Dividends paid Purchase of treasury shares Equity on
37 Inventories Inventories IFRS IFRS change, IFRS (EUR million) % Raw materials and consumables Work in progress Land areas and plot-owning companies Shares in completed housing corporations and real estate t companies Advance payments Other inventories Inventories, total
38 Group and Segment information by quarter SRV Group IFRS IFRS IFRS IFRS IFRS IFRS (EUR million) 4-6/ / / / / /2007 Revenue Operating profit Financial income and expenses, total Profit before taxes Order backlog 1) Earnings per share, eur Equity per share, eur 1) Share price, eur 1) Equity ratio, % 1) Net interest bearing debt 1) Gearing, % 1) ) at the end of the period 38
39 Revenue and operating profit by quarter Revenue IFRS IFRS IFRS IFRS IFRS IFRS (EUR million) 4-6/ / / / / /2007 Business Premises Housing International Other Operations Eliminations Group, total Operating profit IFRS IFRS IFRS IFRS IFRS IFRS (EUR million) 4-6/ / / / / /2007 Business Premises Housing International Other Operations Eliminations Group, total Operating profit IFRS IFRS IFRS IFRS IFRS IFRS (%) 4-6/ / / / / /2007 Business Premises Housing International Group, total
40 Order backlog, invested capital and residential production in Finland by quarter Order backlog IFRS IFRS IFRS IFRS IFRS IFRS (EUR million) Business Premises Housing International Group, total Invested capital IFRS IFRS IFRS IFRS IFRS IFRS (EUR million) Business Premises Housing International Other and eliminations Group, total Residential production IFRS IFRS IFRS IFRS IFRS IFRS in Finland (units) 4-6/ / / / / /2007 Start-ups Sold Completed Completed and unsold 1) Under construction 1) ) at the end of the period 40
41 Segments: Assets, liabilities and invested capital Assets IFRS IFRS change, change, IFRS (EUR million) MEUR % Business Premises Housing International Other Operations Eliminations Group, total Liabilities IFRS IFRS change, change, IFRS (EUR million) MEUR % Business Premises Housing International Other Operations Eliminations Group, total Invested capital IFRS IFRS change, change, IFRS (EUR million) MEUR % Business Premises Housing International Other operations and eliminations Group, total
42 Unbuilt land areas and land acquisition commitments Land reserve Business International Housing 30 June 2008 Operations Operations Total Unbuilt land areas and land acquisition commitments Building rights*, m 2 138, , ,000 1,117,000 Capital invested incl. commitments, EUR million Land development agreements Building rights*, m 2 411, , , ,000 * * Building rights include also the estimated building rights/construction volume of unzoned land reserves and land areas covered by agreements in projects that are wholly or partly owned by SRV 42
43 Personnel Personnel by business area 30 June June 2007 Share of Group personnel, 30 June 2008, % Business Premises Housing International Other Operations Group, total Non-salaried % Salaried % 43
44 Shareholders Shareholder Number of shares % of shares and votes Kokkila Ilpo ,9 % Kolpi Investments Oy ,1 % Heliövaara Eero ,2 % Keskinäinen Työeläkevakuutusyhtiö Varma ,1 % Kuntien Eläkevakuutus ,7 % Linnoinen Hannu ,7 % Alfred Berg Finland Sijoitusrahasto it t ,5% Fondita Nordic Micro Cap Placeringsfond ,4 % Valtion Eläkerahasto ,3 % Veritas Eläkevakuutusosakeyhtiö ,2 % Nieminen Timo ,1% Sundholm Göran ,9 % Stiftelsen För Åbo Akademi ,8 % Keskinäinen Eläkevakuutusyhtiö Ilmarinen ,7 % Maa- Ja Vesitekniikan Tuki Ry ,6 % Alfred Berg Optimal Sijoitusrahasto ,5 % Suomen Itsenäisyyden Juhlarahasto ,4 % Laakkonen Mikko Kalervo ,4 % Ålandsbanken Nordic Value ,4 % SRV Kalusto Oy ,4% 20 largest shareholders ,2 % Nominee registration ,4 % Other shareholders *) ,4 % *) includes own shares owned by SRV Group Plc 44
45 Calculation of key figures Gearing ratio, % = 100 x Return on equity, % = 100 x Return on investment, % = 100 x Equity ratio, % = 100 x Net interest-bearing debt Total equity Profit before taxes - income taxes Total equity. average Profit before taxes + interest and other financial i expenses Invested capital. average Total equity Total assets - advances received Invested capital = Total assets - non-interest bearing debt - deferred tax liabilities provisions Net interest bearing debt = Interest bearing debt - cash and cash equivalents Earnings per share, share issue adjusted Equity per share, share issue adjusted = = Net profit for the period attributable to equity holders of the parent company Weighted average number of shares outstanding Shareholders' equity attributable to equity holders of the parent company Number of shares outstanding at the end of the period. share issue adjusted Price per earnings ratio Share price at the end of the period = Earnings per share. share issue adjusted Dividend payout ratio, % = 100 x Dividend per share. share issue adjusted Earnings per share. share issue adjusted Dividend yield, % Dividend per share. share issue adjusted = 100 x Share price at the end of the period. share issue adjusted Average share price Market capitalisation at the end of the period Trading volume = = = Number of shares traded in euros during the period Number of shares traded during the period Number of shares outstanding at the end of the period x share price at the end of the period Number of shares traded during the period and in relation to the weighted average number of shares outstanding 45
Roadshow Oslo 5 September 2012
 Lemminkäinen Corporation Roadshow Oslo 5 September 212 CFO Robert Öhman IR Kati Sundström Contents Lemminkäinen in brief and financial development Strategy 21-213 and strategy update H1/212 result and
Interim Report January March Kari Kauniskangas, President and CEO
 Interim Report January March 2017 Kari Kauniskangas, President and CEO Contents 1 Group development in Q1/2017 2 Housing Finland and CEE 3 Housing Russia 4 Business Premises and Infrastructure 5 Financial
Financial Year February 2009 Kari Inkinen, President and CEO Robert Öhman, CFO
 Financial Year 2008 6 February 2009 Kari Inkinen, President and CEO Robert Öhman, CFO Year 2008 in a nutshell Financial position Property market Operational review Year 2009 Appendix 2 Year 2008 in a nutshell
Financial Results Q November 2012
 Financial Results Q3 2012 2 November 2012 Conference call 11.00 am EET Dial-in number: +44 (0)20 3364 5381 Webcast available on our website: Investors > performance > results and presentations Agenda 1.
Order backlog grows to EUR 1.7 billion, REDI project weakens profitability
 Order backlog grows to EUR 1.7 billion, REDI project weakens profitability Interim report 1-6/2018, SRV Group Plc 19th July 2018 Juha Pekka Ojala, CEO Ilkka Pitkänen, CFO Agenda Urbanisation and SRV H1
SATO. large. investments in rented homes
 SATO large investments in rented homes Interim report 1 January 30 June 2011 SATO mission SATO is a provider of good housing strategic aims constantly improving services for the customer average 12% annual
Good revenue growth continued; Q3 operating profit somewhat down on Q3 2010
 STOCKMANN GROUP S INTERIM REPORT Q3/2011 Stockmann Group, Interim report 1 January - 30 September 2011 Good revenue growth continued; Q3 operating profit somewhat down on Q3 2010 July - September 2011:
The REDI shopping centre opened in September, pushed earnings into the red. Order backlog EUR 1.7 billion
 The REDI shopping centre opened in September, pushed earnings into the red. Order backlog EUR 1.7 billion Interim report 1-9/2018, SRV Group Plc 25 October 2018 Juha Pekka Ojala, CEO Ilkka Pitkänen, CFO
Financial Results Year February 2013
 Financial Results Year 2012 1 February 2013 Agenda 1. Performance highlights and our priorities Kari Inkinen 2. Market Update Kari Inkinen 3. Financials Erik Hjelt 4. Business Update Kari Inkinen 2 Performance
CONSTI S HALF-YEAR FINANCIAL REPORT JANUARY JUNE 2016 ORDER BACKLOG REACHED A RECORD HIGH
 CONSTI S HALF-YEAR FINANCIAL REPORT JANUARY JUNE 2016 ORDER BACKLOG REACHED A RECORD HIGH 4 6/2016 highlights (comparison figures in parenthesis 4 6/): Net sales EUR 64.8 (63.4) million; growth 2.3% EBITDA
Key figures 7-9/ /2009 Index
 STOCKMANN plc Interim report 27.10.2010 at 8.00 STOCKMANN plc INTERIM REPORT 1 JANUARY 30 SEPTEMBER 2010 STOCKMANN S OPERATING PROFIT GREW SOMEWHAT The Stockmann Group s third-quarter revenue was up by
LEMMINKÄINEN S INTERIM REPORT, 1 JANUARY 30 JUNE
 [1] LEMMINKÄINEN S INTERIM REPORT, 1 JANUARY 30 JUNE 2012: Improvement in comparable earnings for the review period. Strong performance in infrastructure construction in Finland. January-June 2012, compared
- Net sales 24.5 MEUR - EBIT 2.9 MEUR (margin 12%) - Profit before taxes 2.7 MEUR - Net Profit 1.9 MEUR - Earnings per share 0.
 - Profit before taxes 2.7 MEUR - Net Profit 1.9 MEUR - Earnings per share 0.") 1 INTERIM REPORT 1-6/2005 INTERIM REPORT 1-6/2005 KEY FIGURES 1-6/2005 - Net sales 24.5 MEUR - EBIT 2.9 MEUR (margin 12%) - Profit before taxes 2.7 MEUR - Net Profit 1.9 MEUR - Earnings per share 0.14
1 INTERIM REPORT 1-6/2005 INTERIM REPORT 1-6/2005 KEY FIGURES 1-6/2005 - Net sales 24.5 MEUR - EBIT 2.9 MEUR (margin 12%) - Profit before taxes 2.7 MEUR - Net Profit 1.9 MEUR - Earnings per share 0.14
WorldReginfo - f9407b99-fb4f-43e9-a9b5-be52277a52a9
 Interim Report January 1 September 30, 2015: Net debt continued to decrease, focus shifted towards profitability Unless otherwise noted, the figures in brackets refer to the corresponding period in the
Interim Report 1 3/2018
 Q1 Interim Report 1 3/2018 1 Interim Report January 1 March 31, 2018 Interim Report January 1 March 31, 2018: Integration progressing, result was modest Unless otherwise noted, the figures in brackets
Continuously improved performance in Stockmann Retail and Real Estate Group s operating result negatively impacted by Lindex
 Interim report Q3 2017 2 STOCKMANN S INTERIM REPORT Q3 2017 STOCKMANN plc, Interim report 27.10.2017 at 8:00 EET Continuously improved performance in Stockmann Retail and Real Estate Group s operating
Technopolis Plc Roadshow with Nordea
 Technopolis Plc Roadshow with Nordea Zürich, Geneva and Paris 19-20 June, 2017 Technopolis in Brief We are an international chain of multiuser business campuses established in 1982 in Oulu, Finland We
Financial Results Q Kari Inkinen, President and CEO Erik Hjelt, CFO Pia Arrhenius, SVP, IR
 Financial Results Q2 2009 Kari Inkinen, President and CEO Erik Hjelt, CFO Pia Arrhenius, SVP, IR Introduction Market review Business overview Financial overview Appendix 2 Overview of reporting segments
REVENUE GREW, MODEST PROFITABILITY: SRV S INTERIM REPORT 1 JANUARY 30 SEPTEMBER 2012
 1 (30) SRV GROUP PLC INTERIM REPORT 7 November, 8.30 a.m. EET REVENUE GREW, MODEST PROFITABILITY: SRV S INTERIM REPORT 1 JANUARY 30 SEPTEMBER Reporting period 1 January 30 September in brief: SRV s revenue
LEHTO GROUP PLC BALANCE SHEET BOOK 1 Jan to 31 Jan. 2015
 LEHTO GROUP PLC BALANCE SHEET BOOK 1 Jan. 2015 to 31 Jan. 2015 CONTENTS Annual report from the Board of Directors 2015 3 Consolidated statement of comprehensive income, IFRS.. 11 Consolidated balance sheet,
A Strong Year for Technopolis
 A Strong Year for Technopolis Full Year 2017 Results Technopolis Plc Keith Silverang, CEO Key Messages on Full Year 2o17 Revised strategy well received execution started immediately Macroeconomic tailwind
Lehto Group Plc s half-year financial report 1 January 30 June Net sales up by 64.7%, operating profit 8.6% of net sales in January-June
 Lehto Group Plc s half-year financial report 1 January 30 June 2017 Net sales up by 64.7%, operating profit 8.6% of net sales in January-June This half-year financial report has been prepared in accordance
Interim Report 1 Jan 30 Jun August 2008 Kari Inkinen, President and CEO Robert Öhman, CFO
 Interim Report 1 Jan 30 Jun 2008 7 August 2008 Kari Inkinen, President and CEO Robert Öhman, CFO Financial review Market overview Operational review Business areas Appendix 2 Financial review Market overview
SATO Interim report
 SATO Interim report 1.1.-30.6.2008 SATO Interim report 1.1. 30.6.2008 Summary of the period 1-6/2008 (1-6/2007) The Group s turnover was 125.8 (129.7) million euros and operating profit was 36.8 (32.2)
New strategy well under way, operating profit up in the second quarter
 Interim Report Q2 2015 2 STOCKMANN S INTERIM REPORT Q2 2015 STOCKMANN plc, Interim Report 29.4.2015 at 8.00 EET New strategy well under way, operating profit up in the second quarter April-June 2015: Consolidated
Interim report 1 Jan - 30 Sep Kari Inkinen CEO
 Interim report 1 Jan - 30 Sep 2007 Kari Inkinen CEO 1 2 Market review GDP growth % Finland Euro Area United States Japan 7 6 5 4 3 2 1 0-1 -2-3 1997 1998 1999 2000 2001 2002 2003 2004 2005 2006* 2007**
SATO Interim report
 Interim report 1.1. 30.9.2007 SATO Interim report 1.1. 30.9.2007 Summary of the period 1-9/2007 (1-9/2006) The Group s turnover was 201.5 (213.6) million euros. Profit before taxes was 27.5 (32.9) million
Nokian Tyres plc Stock exchange bulletin 9 May 2007 at 9:00 a.m.
 Nokian Tyres plc Stock exchange bulletin 9 May 2007 at 9:00 a.m. INTERIM REPORT FOR NOKIAN TYRES PLC JANUARY - MARCH 2007 New products and Russia accelerated growth 1(15) The Group's net sales were up
Financial Results Q May 2012
 Financial Results Q1 2012 4 May 2012 Conference call 11.00 am EET Dial-in number: +44 (0)20 3450 9987 Webcast available at our website: Investors > performance > results and presentations Agenda Performance
SATO Interim report
 SATO Interim report 1.1.-30.9.2008 SATO Interim report 1.1. 30.9.2008 Summary of the period 1-9/2008 (1-9/2007) The Group s turnover was 183.4 million euros (191.7) and operating profit was 54.8 (50.3)
The order backlog rose to EUR 1.8 billion, cash flow positive despite the loss-making result
 1 (26) SRV GROUP PLC S FINANCIAL STATEMENT RELEASE 1 JANUARY - 31 DECEMBER 2018 The order backlog rose to EUR 1.8 billion, cash flow positive despite the loss-making result January-December 2018 in brief:
Good intake of new orders in the beginning of the year, but revenue and operative operating profit declined
 1 (23) SRV S INTERIM REPORT 1 JAN. 31 MAR. 2018 Good intake of new orders in the beginning of the year, but revenue and operative operating profit declined January-March 2018 in brief: Revenue declined
Interim Report January September 2013
 Interim Report January September 2013 Juhani Pitkäkoski President and CEO November 1, 2013 Contents Financial development Development by business Financial position Market outlook and guidance July September
Results for 1-6/2015. August 20, 2015
 Results for 1-6/2015 August 20, 2015 Q2 in Brief A Strong Performance Occupancy remained strong at 94.1* (93.5)% Net sales up 11.3% & EBITDA up 17.8% EBITDA margin at 56.4 (53.3)% Service revenues up 18.1%
Turnaround is proceeding as planned
 INTERIM REPORT 1 Jan 30 Sep 2014 Turnaround is proceeding as planned Lemminkäinen Interim Report 1 Jan 30 Sep 2014: Turnaround is proceeding as planned January September 2014 (1-9/2013) Net sales totalled
Harvia Plc Half-year financial review
 Harvia Plc Half-year financial review January-June 2018 16 August 2018 Tapio Pajuharju, CEO Ari Vesterinen, CFO Content 1. January June 2018 in brief 2. Harvia s strategy 3. Financials Tapio Pajuharju
Interim Report 1 Jan 31 Mar Kari Inkinen, President and CEO Robert Öhman, CFO
 Interim Report 1 Jan 31 Mar 2008 Kari Inkinen, President and CEO Robert Öhman, CFO Result Q1/2008 Market overview Sponda s operations in Q1/2008 Business areas Appendix 2 Result Q1/2008 Market overview
SATO Interim report
 Interim report 1.1. 30.6.2007 SATO Interim report 1.1. 30.6.2007 Summary of the period 1-6/2007 the Group s turnover was 140.5 (1.1. 30.6.2006: 152.8) million euros profit before taxes was 18.7 (24.8)
LEHTO GROUP PLC BUSINESS REVIEW, 1 JANUARY 31 MARCH Net sales up by 29.5%, operating profit was 8.5% of net sales
 LEHTO GROUP PLC BUSINESS REVIEW, 1 JANUARY 31 MARCH 2017 Net sales up by 29.5%, operating profit was 8.5% of net sales This is not an interim report as specified in the IAS 34 standard. The company complies
MEUR 4-6/11 4-6/10 1-6/11 1-6/
 1 INTERIM REPORT 1-6/2011 AFFECTO PLC -- INTERIM REPORT -- 2 AUGUST 2011 at 9.30 AFFECTO PLC'S INTERIM REPORT 1-6/2011 GROUP KEY FIGURES MEUR 4-6/11 4-6/10 1-6/11 1-6/10 2010 Net sales 32.6 28.4 62.7 54.2
The Group s adjusted operating result back to profit in Q3
 Interim report Q3 2018 2 STOCKMANN S INTERIM REPORT Q3 2018 STOCKMANN plc, Interim report 26.10.2018 at 8:00 EET The Group s adjusted operating result back to profit in Q3 July-September 2018, continuing
All-time high revenue; Q4 operating profit up 22.1 per cent on 2010
 Financial Statements Bulletin 2011 2 STOCKMANN S FINANCIAL STATEMENTS BULLETIN 2011 STOCKMANN plc, Financial Statement Bulletin 9.2.2012 at 8.00 EET All-time high revenue; Q4 operating profit up 22.1 per
977 2, % 8,196 8, % Net gearing 27.5% 34.5% 27.5% 34.5% Equity ratio 52.6% 47.8% 52.6% 47.8%
 Digia s fourth quarter 2012: Operating profit slightly better than expected, despite effects of Qt acquisition and one-off costs of finalised personnel negotiations Summary January-December Consolidated
Financial statements Financial statements 2016 Lehto Group Plc
 Financial statements 2016 Innovator in construction sector Economically driven construction Digitalization Urbanization Needs for renovation and changes Ecology and energy efficiency Cost-efficiency Aging
Change % 7-9/ / 2017
 CONSTI S INTERIM REPORT JANUARY SEPTEMBER 2017 9 November 2017 at 8:30 am NET SALES GREW, RESULT WAS A DISAPPOINTMENT 7-9/2017 highlights (comparison figures in parenthesis 7-9/2017): Net sales 77.8 (70.6)
Healthy Operational Performance
 Healthy Operational Performance Half-Year Financial Report 2018 Technopolis Plc Keith Silverang, CEO Key Messages on First Half 2o18 Like-for-like net sales and EBITDA up 3.4% and 4.4%, respectively Occupancy
Net sales grew by 64.2% from the previous year to EUR million. Operating profit was EUR 61.5 million, or 10.4% of net sales.
 Lehto Group Plc s financial statement bulletin 1 January 31 December 2017 Net sales grew by 64.2% from the previous year to EUR 594.1 million. Operating profit was EUR 61.5 million, or 10.4% of net sales.
Interim report 1 January 31 March
 2007 Interim report 1 January 31 March 2/15 - INTERIM REPORT JANUARY 1 - MARCH 31, 2007 Net sales totaled MEUR 28.9 (MEUR 26.5), up 9% on the comparison period. Operating profit, MEUR 1.9 (MEUR 1.1), and
EXEL COMPOSITES PLC INTERIM REPORT at 9.00 a.m. 1 (13)
") EXEL COMPOSITES PLC INTERIM REPORT 23.10. at 9.00 a.m. 1 (13) Exel Composites Plc s Interim Report for January 1 September 30, Q3 in brief - Net sales were 18.0 MEUR (Q3/: 19.0 MEUR) - Operating profit
EXEL COMPOSITES PLC INTERIM REPORT 23.10. at 9.00 a.m. 1 (13) Exel Composites Plc s Interim Report for January 1 September 30, Q3 in brief - Net sales were 18.0 MEUR (Q3/: 19.0 MEUR) - Operating profit
Sponda Financial Results Q November 2015
 Sponda Financial Results Q3 2015 3 November 2015 1. Highlights for the Period Kari Inkinen 2. Strategy Implementation Pia Arrhenius 3. Business environment and Business Update Kari Inkinen 4. Financials
Financial Results Q August 2012
 Financial Results Q2 2012 3 August 2012 Agenda 1. Performance highlights and our priorities Kari Inkinen 2. Market Update Kari Inkinen 3. Financials Erik Hjelt 4. Business Update Kari Inkinen 2 1. Performance
Interim Report q2. 1 January - 30 JUNE The Group s order book rose 33%, standing at. Consolidated net sales in the review period
 2011 Interim Report q2 1 January - 30 JUNE 2011 The Group s order book rose 33%, standing at MEUR 111 (MEUR 84) at the end of June. Consolidated net sales in the review period increased 44% to MEUR 301
Net sales EUR million, up 20.7%. Operating profit EUR 37.2 million, or 5.2% of net sales
 Lehto Group Plc s financial statement bulletin 1 January 31 December 2018 Net sales EUR 721.5 million, up 20.7%. Operating profit EUR 37.2 million, or 5.2% of net sales This report has been prepared in
INTERIM REPORT 1 JANUARY 30 SEPTEMBER SATO s profitable growth continued
 INTERIM REPORT 1 JANUARY 30 SEPTEMBER SATO s profitable growth continued Contents Strategy... 4 SATO Corporation Interim report 1 Jan - 30 Sep... 5 The business climate... 5 President and CEO Erkka Valkila...
Technopolis Plc. Q3 Interim Report, 2017: Growth Continues into the Second Half. Keith Silverang, CEO October 31, 2017
 Technopolis Plc Q3 Interim Report, 2017: Growth Continues into the Second Half Keith Silverang, CEO Key Messages on Jan-Sep 2o17 Macroeconomic tailwind continues Growth continues at a more moderate pace
LEHTO GROUP PLC BUSINESS REVIEW 1 JANUARY 30 SEPTEMBER Net sales up by 30.7% operating profit was 10.5% of net sales
 LEHTO GROUP PLC BUSINESS REVIEW 1 JANUARY 30 SEPTEMBER 2016 Net sales up by 30.7% operating profit was 10.5% of net sales This is not an interim report as specified in the IAS 34 standard. The company
Interim Report 1 3/2017
 Interim Report 1 3/2017 1 Interim Report January 1 March 31, 2017 Interim Report January 1 March 31, 2017: Result improved, strong cash flow Unless otherwise noted, the figures in brackets refer to the
INTERIM REPORT H1/2018
 INTERIM REPORT H1/2018 MIKA VIRTANEN, CEO ILKKA MIETTINEN, CFO 16 AUGUST 2018 ROBIT A GENUINE GROWTH COMPANY GROWTH COMPANY ~26% p.a. 19 ~150 Organic and structural growth Sales growth of last 12 years
Lemminkäinen Interim Report 1 January 30 June 2013:
 Lemminkäinen Interim Report 1 January 30 June 2013: Profitability challenges especially in international operations; Lemminkäinen to cut costs by EUR 30 million. Lemminkäinen Interim Report 1 Jan 30 June
FINANCIAL STATEMENTS 2015
 FINANCIAL STATEMENTS 2015 2 FINANCIAL STATEMENTS Report of the Board of Directors... 3 Key financial indicators... 15 Calculation of key figures...16 Share and shareholders... 17 IFRS Consolidated financial
CONSTI INTERIM REPORT 1 January 31 March 2018 NET SALES AND ORDER BACKLOG GREW Q April 2018 at 8.30 a.m.
 CONSTI INTERIM REPORT 1 January 31 March 2018 27 April 2018 at 8.30 a.m. NET SALES AND ORDER BACKLOG GREW 1 3/2018 highlights (comparison figures in parenthesis 1 3/2017): Net sales 62.3 (57.3) million
Oriola KD Corporation January September Eero Hautaniemi President and CEO
 Oriola KD Corporation January September 2006 Eero Hautaniemi President and CEO Oriola KD Corporation pro forma review 1 January 30 September 2006 Oriola KD Corporation was listed on the Helsinki Exchanges
Ramirent s Year Kari Kallio, CEO Annual General Meeting 9 April 2008, Pörssisali
 Ramirent s Year 2007 Kari Kallio, CEO Annual General Meeting 9 April 2008, Pörssisali Ramirent in Brief Leading equipment rental company in Northern, Central and Eastern Europe Net Sales of EUR 634 million
RAMIRENT GROUP INTERIM REPORT
 RAMIRENT GROUP Interim report january JUNE 2008 Q2 LIVE AUDIOCAST AND CONFERENCE CALL ON 15 AUGUST, 2008 AT 10:00 AM LOCAL TIME A briefing for investment analysts and the press will be arranged on Friday
A Solid Start to the Year
 A Solid Start to the Year Q1/2018 Results Technopolis Plc Keith Silverang, CEO Key Messages on Q1/2o18 Comparable net sales and EBITDA up over 5%, year-on-year Occupancy rates continued to rise Service
RESULT JANUARY-JUNE 2006, August 8th. Mr. Kim Gran, President and CEO
 RESULT JANUARY-JUNE 2006, August 8th Mr. Kim Gran, President and CEO 1 CONTENTS Result H1 2006 Page Key figures 3 Operating profit per quarter 4 Market situation 5 Nokian Tyres H1 2006 6 Net sales by product
Financial Statements 2007
 Financial Statements 2007 2007 Teleste Corporation Financial Statements 2007 Net sales grew by 22.9% amounting to EUR 125.1 (101.8) million Operating profit improved by 35.1% standing at EUR 13.2 (9.8)
DIGIA'S FINAL QUARTER 2015: CONTINUED STRONG NET SALES GROWTH (12.2%)
") DIGIA PLC FINANCIAL STATEMENT RELEASE, 4 FEBRUARY 2016 AT 08:00 DIGIA'S FINAL QUARTER 2015: CONTINUED STRONG NET SALES GROWTH (12.2%) Summary January-December Consolidated net sales EUR 107.9 (97.4) million,
DIGIA PLC FINANCIAL STATEMENT RELEASE, 4 FEBRUARY 2016 AT 08:00 DIGIA'S FINAL QUARTER 2015: CONTINUED STRONG NET SALES GROWTH (12.2%) Summary January-December Consolidated net sales EUR 107.9 (97.4) million,
Lehto Group Plc s half-year financial report 1 January 30 June Net sales up by 36.4%, operating profit 4.7% of net sales in January-June
 Lehto Group Plc s half-year financial report 1 January 30 June 2018 Net sales up by 36.4%, operating profit 4.7% of net sales in January-June This half-year financial report has been prepared in accordance
Lemminkäinen. Carnegie Construction seminar President and CEO Casimir Lindholm
 Lemminkäinen Carnegie Construction seminar President and CEO Casimir Lindholm Lemminkäinen in brief Strategy Segment overview Outlook and guidance 2 23 August 2017 Carnegie Construction seminar / CEO Casimir
Harvia Plc Interim report
 Harvia Plc Interim report January-September 2018 14 November 2018 Tapio Pajuharju, CEO Ari Vesterinen, CFO Content 1. January September 2018 in brief 2. Harvia s strategy 3. Financials Tapio Pajuharju
Func Food Group Financial Release / Q1 2018
 Func Food Group Financial Release / Q1 2018 Func Food Group Financial Release / Q1 2018 Func Food Group / Q1 2018 3 FUNC FOOD GROUP IN BRIEF Func Food Group ( FFG ) is a Nordic wellness company, which
HALF-YEAR REVIEW JANUARY-JUNE 2018
 HALF-YEAR REVIEW JANUARY-JUNE 2018 1-6/2018 (1-6/2017) Total revenue 8,1 M (5,3 M ) 10 8 6 4 2 0 1-6/2017 1-6/2018 Value of investment properties 301,6 M (205,1 M ) Occupancy rate 100 % Value of portfolio
FINANCIAL STATEMENTS Stockmann Group 14 February 2018
 FINANCIAL STATEMENTS 2017 Stockmann Group 14 February 2018 HIGHLIGHTS IN 2017 Group s gross margin 55.8% (55.7) Group s adjusted operating result, EUR mill. 12.3 (30.9) Fair value of properties, EUR mill.
YIT CORPORATION FINANCIAL STATEMENTS BULLETIN Feb 6, 2009 at 8:00 am
 YIT CORPORATION FINANCIAL STATEMENTS BULLETIN Feb 6, 2009 at 8:00 am 1 YIT's financial statements for 2008: REVENUE INCREASED, OPERATING PROFIT DECREASED - QUICK MEASURES TAKEN TO REACT TO MARKET CHANGES
Interim report Q Vesa Korpimies President and CEO
 Interim report Q1 2008 Vesa Korpimies President and CEO 2 May 2008 Q1 in brief Net Sales of EUR 24.1 (28.8) million Operating Profit of EUR 1.4 (3.5) million Operating Profit of Exel Composites EUR 2.9
AFFECTO PLC -- FINANCIAL STATEMENTS BULLETIN FEBRUARY 2013 at MEUR 10-12/ /
 1 FINANCIAL STATEMENTS BULLETIN 2012 AFFECTO PLC -- FINANCIAL STATEMENTS BULLETIN -- 14 FEBRUARY 2013 at 12.30 Affecto Plc's Financial Statements Bulletin 2012 Group key figures MEUR 10-12/12 10-12/11
Previously Scanfil estimated that its turnover for 2018 will be EUR million and the operating profit will amount to EUR million.
 Interim Report 1-9/2018 Scanfil Group s Interim Report January September 2018 July September 2018: Stabilizing growth. July September 2018 - Turnover totalled to EUR 131.5 million (Q3 2017: 130.8) - Operating
CONSTI GROUP PLC INTERIM REPORT 1 JANUARY 30 SEPTEMBER 2017
 CONSTI GROUP PLC INTERIM REPORT 1 JANUARY 30 SEPTEMBER 2017 Interim CEO Esa Korkeela Building renovation specialist www.consti.fi Contents Highlights and Group performance Cash flow and financial position
GROUP S RESULT MORE THAN DOUBLED ORDERS RECEIVED INCREASED 65 PERCENT NET SALES INCREASED 43 PERCENT
 TURNOVER AND PROFITABILITY Teleste s growth that began during the previous year s last tertial continued also during this year s first tertial. Orders received increased 65.5 percent to 33.4 million euros.
Lehto Group Plc s financial statement bulletin 1 January 31 December Net sales grew by 31% and profitability improved from the previous year
 Lehto Group Plc s financial statement bulletin 1 January 31 December 2016 Net sales grew by 31% and profitability improved from the previous year This report has been prepared in accordance with the IAS
Sponda Plc s interim report January September 2013
 1.1. 30.9.2013 Sponda owns, leases and develops business properties in the Helsinki metropolitan area and the largest cities in Finland. Sponda s operations are organised into four business units: Investment
Lemminkäinen. Carnegie Construction seminar President and CEO Casimir Lindholm
 Lemminkäinen Carnegie Construction seminar President and CEO Casimir Lindholm Lemminkäinen in brief Strategy Segment overview Outlook and guidance 2 24 August 216 Carnegie Construction seminar / CEO Casimir
SOK CORPORATION. Interim Report 1 January 30 June 2009
 SOK CORPORATION Interim Report 1 January 30 June 2009 1 DEVELOPMENT OF THE ECONOMIC ENVIRONMENT The total production of the global economy will decrease this year, and the recession is the worst since
Detection Technology. Financial statements. and Board of Directors report
 Detection Technology Financial statements and Board of Directors report 2016 2 Detection Technology Board of Directors report 2016 Board of Directors report Financial year 2016 in brief The 2016 financial
ORDER BACKLOG GROWS TO A RECORD HIGH SRV S FINANCIAL STATEMENT RELEASE 1 JANUARY 31 DECEMBER 2012
 1 (33) SRV GROUP PLC FINANCIAL STATEMENT RELEASE 13 February 2013, 8:30 a.m. EET ORDER BACKLOG GROWS TO A RECORD HIGH SRV S FINANCIAL STATEMENT RELEASE 1 JANUARY 31 DECEMBER Reporting period 1 January
Annual General Meeting Sponda Plc. 18 March 2013 Finlandia Hall
 Annual General Meeting Sponda Plc 18 March 2013 Finlandia Hall Composition of the Board of Directors of Sponda Plc Lauri Ratia (Chairman) Arja Talma Erkki Virtanen Raimo Valo Klaus Cawén Tuula Entelä 2
BUSINESS REVIEW Q1/2018 / CRAMO PLC Q1
 BUSINESS REVIEW /2018 / CRAMO PLC 1 BUSINESS REVIEW /2018 / CRAMO PLC STRONG FIRST QUARTER FOR BOTH DIVISIONS - KBS INFRA INCLUDED FROM 1 ST OF MARCH JANUARY MARCH 2018 Sales EUR 175.3 (162.9) million,
26 October LASSILA & TIKANOJA PLC: INTERIM REPORT 1 JANUARY 30 SEPTEMBER 2016
 26 October 2016 1 LASSILA & TIKANOJA PLC: INTERIM REPORT 1 JANUARY 30 SEPTEMBER 2016 - Net sales for the third quarter increased by 4.0% to EUR 166.0 million (EUR 159.6 million), operating profit was EUR
RAKENTAJAIN KONEVUOKRAAMO OYJ'S INTERIM REPORT 1-9/2004
 10.11.2004 10:30 RAKENTAJAIN KONEVUOKRAAMO OYJ'S INTERIM REPORT 1-9/2004 RAKENTAJAIN KONEVUOKRAAMO OYJ'S INTERIM REPORT 1-9/2004 - Turnover for Q3/2004: EUR 21.3 million (15.5) - Profit before extraordinary
P O R T L R U A A N A-RAKENNUSMIES OYJ
 A N N U A L R E P O R T 1 9 9 8 A-RAKENNUSMIES OYJ A-RAKENNUSMIES IN BRIEF A-Rakennusmies Oyj is the largest company in Finland renting and selling construction machinery and equipment. A-Rakennusmies
Financial Statements Release 2018
 14 February 2019 Jani Nieminen, CEO Erik Hjelt, CFO Financial Statements Release 2018 Kojamo plc Agenda Summary of year 2018 Financial development Outlook, financial targets and dividend policy Lauri Korpisen
New steps taken in strategy implementation, further slight improvement of operating result
 Interim Report Q3 2015 2 STOCKMANN S INTERIM REPORT Q3 2015 STOCKMANN plc, Interim Report 28.10.2015 at 8.00 EET New steps taken in strategy implementation, further slight improvement of operating result
LASSILA & TIKANOJA PLC: INTERIM REPORT 1 JANUARY 31 MARCH 2016
 27.4.2016 1 LASSILA & TIKANOJA PLC: INTERIM REPORT 1 JANUARY 31 MARCH 2016 - Net sales for the first quarter EUR 160.7 million (EUR 157.3 million) - Operating profit EUR 6.8 million (EUR 6.5 million) -
Func Food Group Financial Release / Q2 2018
 Func Food Group Financial Release / Q2 2018 Func Food Group Financial Release / Q2 2018 Func Food Group / Q2 2018 3 FUNC FOOD GROUP IN BRIEF Func Food Group ( FFG ) is a Nordic wellness company, which
Scanfil Plc Financial Report
 Scanfil Plc Financial Report 1 12/2018 Scanfil Group s Financial Statements for 1 January 31 December 2018 Year 2018: Strong growth and profitability development October December 2018 Turnover totalled
Lehto Group Plc. Report by the Board of Directors Financial Statements 2016
 2016 Lehto Group Plc Report by the Board of Directors Financial Statements 2016 Contents REPORT BY THE BOARD OF DIRECTORS 1 FINANCIAL STATEMENTS 15 Consolidated statement of comprehensive income, IFRS
Revenio Group Corporation's Interim Report January 1 September 30, 2013
 Published: 2013 10 22 08:00:00 CEST Revenio Group Corporation: Interim Report January 1 September 30, 2013 REVENIO HEALTH TECH CONTINUES ON A GROWTH TRACK, POSITIVE DEVELOPMENT EXPECTED ALSO FOR THE REST
Good result in Construction Services - Residential sales improved from Q3/11
 Good result in Construction Services - Residential sales improved from Q3/11 Financial Statements 2011 Timo Lehtinen CFO Hanna-Maria Heikkinen, Vice President, Investor relations YIT 1 Road show February
INTERIM REPORT Q2/2013 August 8, 2013 CEO Magnus Rosén CFO Jonas Söderkvist
 INTERIM REPORT Q2/2013 August 8, 2013 CEO Magnus Rosén CFO Jonas Söderkvist Agenda Highlights Q2 and 1-6/2013 Market outlook Segment review Financial review Company overview Appendix Agenda 2 Highlights