Global Connections Public Company Limited. Opportunity day Q1/2012 Performance Announcement May 14 th, 2012
|
|
|
- Bonnie Gaines
- 5 years ago
- Views:
Transcription
1 Global Connections Public Company Limited Opportunity day Q1/2012 Performance Announcement May 14 th,
2 Today Content Company Overview Plastic and Petrochemical Industry Q1/2012 Performance IR report & Investment Highlight Q&A 2
3 Company Overview Listed to SET 6 th Dec.2005 GC has been founded since 1994 by 5 experienced management MB Total Revenue 3,272 2,665 3,678 3,792 GC is the distributor of 32 leading producers of plastics and petrochemical raw materials from around the world ,091 Most of these producers are among the top 3 in the world in that product in terms of technology & production capacity. GC Revenue During Sales growth in 2011 YoY QoQ Value 3.49% 27.33% Quantity 4.64% 25.06% Year GC is not an ordinary distributor. On top of ordinary distribution role, GC provide technical advice and useful information to customers since GC position itself to be Your best partner for solution and service in Industrial raw material supply. 3
4 GC s role and positioning in the market Leads the differentiation Economy of Scale to Suppliers Suppliers S1 S2 S3 S4 S5 Sn ) Global Connections Public Co., Ltd. Provided Logistic : Warehousing, small delivery, and repacking Sales & Marketing : Closely contact to end markets/customers Technical Services : Troubleshooting / Product and Market Development Financing & structuring solution : Extending our expertise to customer Customers C1 C2 C3 C4 C5 Cn Economy of Scope to Customers 4
5 Where we are in the value chain of Thai Petrochemical Industry Petrochemical and plastic producers Upstream Intermediate Downstream Compounders End users Olefin&Aromatic Producers Monomer producers (MEG, VCM) Polymer producers (PP, PE, PVC) Global Connections Compounders Master batch producers Converters 5
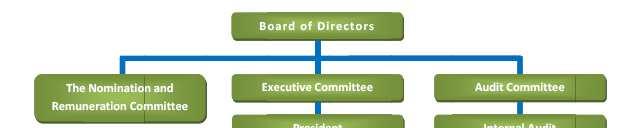
6 Organization Chart 6
7 Major Shareholders Free FloatOverview As of 19/04/2012 Minor Shareholders (Free float) 780 Overview As of 19/04/2012 Total Shareholders 854 % Shares in Minor Shareholders (% Free float) 30.98% Rank Major Shareholders as of 21/04/2011 # Shares % Shares 1 Mr. Somchai Kulimakin 44,499, Mr. Aikachai Sirijantanan 28,470, Mr. Sumruay Tichachol 27,125, Mr. Bhiya Jriyasetapong 26,125, Mr. Somkiat Terdtultaveedey 9,200, Mr. Siri Thirawattanawong 8,226, Sub total 143,646, More Liquidity for GC s Stock 7
8 Corporate Value Ethics Integrity Professional & Focus Partnership Strive for better 8
9 Company History Current Start business with commodity plastic Diversify company portfolio from commodity to specialty plastic Create sustainable growth being the best partner for solution and service in industrial raw material supply 1996 Distributing agent of SCG Plastics Co., ltd. and Eastman Chemical, which was the start of specialty product distribution GC was established by 5 founders with initial registered capital of 2 MB Distributing agent of DuPont Performance Polymers and Chi Mei Corporation 1998 Distributing agent of OCV Reinforcement Co., Ltd 2004 Distributing agent of ExxonMobil and Rio Tinto Mineral Asia Pte., Ltd Distributing agent of Siam Polystyrene (Thailand) Co., ltd. and Cabot Plastic Hong Kong Ltd Distributing agent of Nanocor Inc Distributing agent of BST Elastomers Co., Ltd Distributing agent of DIC International Chemicals PTE Ltd Distributing agent of Miliken Chemical, Imerys Meneral, Timcal Ltd Listed company and paid-up capital to 200 MB
10 Corporate Strategy Maintain existing strong market positioning Become solid partner with supplier and customer Offer total professional solution Be leader in advanced technology product Grow towards the growing industries Develop new application/market from initial stage 10
11 2012 Corporate Strategy Knowledge Organization : -Build atmosphere, Record experience and expertise, Transfer knowledge to others Electronic Aided Management : - Simple understanding, Effective practice, Efficient process Experience Leverage : - Explore new endeavor, Develop new platform Performance Oriented : - Competitiveness, Staff retention, Fair treatment 11


 - Tire & Rubber House - Ink - Flexible Hose/Tube")
12 GC Business Unit BU1 COMMODITY POLYMER BU2 SPECIALTY & ENGINEERING POLYMER BU3 SPECIALTY CHEMICALS & INTERMEDIATE 1. Polyolefin 2. PET & PVC 3. Specialty Polyolefin 1. Engineering Plastics 2. Industrial Products 1. Additives & Adhesives 2. Petro Chemicals & Intermediate - Automotive parts Car & Motorcycle : Interior and exterior parts Console, Bumper, Door trim, Body side Engine covered, Muffler covered, Trunk tray, Liner, etc. - Electronic and Appliance Parts Washing machine, Refrigerator, Air-Con, Fan - Transparency packaging - Cosmetic packaging - Office equipment - Compounding &color Master batch - Resin Producers - Refinery plant - Industrial product - Packaging Product - Adhesive Product (Solvent based, HMA) - Tire & Rubber House - Ink - Flexible Hose/Tube - Woven bag, Film - Toys, Furniture Plastic Pallet - House ware - Road Marking Paint - Industrial product -Tape & Label PSA
13 Marketing Structure GC Business Unit BU1 COMMODITY POLYMER Polyolefins PE: HDPE, LDPE, LLDPE (C4,C8) PP: Homo, Block Copo, Random PVC PET PU BU2 SPECIALTY & ENGINEERING POLYMER Nylon, POM, PBT, TEEE, PCT, LCP, PC Black/White MB EPDM, Butyl EO, EB Plastomer, PP-Plastomer TPVs, TPU PETG/PCTG, CA PS, HIPS, ABS, SAN, SBC TPE, FR, Reinforcement compound Talc, Zinc Borate FR, Nano-Clay Glass Fiber EVA for HMA, Hydrocarbon Resin BU3 SPECIALTY CHEMICALS & INTERMEDIATE Plastic Additive Intermediate chemical
14 Automotive E&E Appliance Packaging Toys & Stationery Personal Care Products Industrial Market furniture, construction, shoes, adhesive, Road marking
15 Plastic and Petrochemicals Industry 15

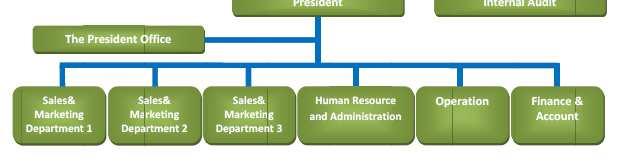
16 Crude Oil Price Chart
17 17


18 Key Strategic Market Automotive E&E Appliance Packaging Toys & Stationery Personal Care Products Industrial Market furniture, construction, shoes, adhesive, Road marking
19 Thailand Auto Production 2012 (E) 2012 (Mar) ,000, ,560 1,457,795 1,645, ,378 1,391,728 1,301,149 1,193,885 1,125, , , , , ,761 Car Production Forecast of 2012 around 2 Mil Unit more than 30% from the last year. Production in Q1/2012 is 499,560 units, 6.52% increase from year The factories in the flood area are recovered about 73% (bangkokbiznews) 0 500,000 1,000,000 1,500,000 2,000,000 Source : Thailand Automotive Institute

20 Thailand Auto Production Source: THE OFFICE OF INDUSTRIAL ECONOMICS 20
21 Plastic in Auto Industry 21

 GDP = 6% (2%for Q1) Export decline = 4% Inflation = 3.")
22 Economic Growth Rate by The National Economic and Social Development Board 2011 Source : Office of The National Economic and Social Development Board GDP = 0.1% Export Growth = 16.4% Inflation rate = 3.8% 2012 Growth Forecast GDP = % Export = 17% Inflation = % Updated from BOT (11/5/2012) GDP = 6% (2%for Q1) Export decline = 4% Inflation = 3.39% Capacity Utilization Automotive from 31.7% in Q4 11 to 97.0% in Q1 12 Electronics was from 35.4% to 56.8% only. 22
23 Fire Incident at BSTE Facility in Maptaphut The fire incident at BSTE facility in Maptaphut Industrial Estate in Rayongon 5 th of May There are 11 fatalities and 141 injury cases BSTE is declaring force majeure and expect the downtime of the BR Unit of 6 months and the SBR unit of 2 months 23
24 Q1/2012 Performance 24
25 Statements of Comprehensive Income Unit : Million Baht Actual Q Change Sales 1, , % COGS 1, % Gross Profit % Selling & Admin Expenses % Loss on diminution in value of inventories (2.00) % EBITDA % Depreciation % Interest Expense % Profit Before Other Income % Other Income % Gain (Loss) on exchange rate % Profit before Tax % Tax % Net Profit % 25
26 Sales Structure BU3 BU2 BU1 Sales Quantity '000 T BU3 BU2 BU1 Sales Quantity in Percentage 0% 0% 0% 0% 0% 23% 21% 20% 22% 22% 77% 79% 80% 78% 78% 100% 80% 60% 40% 20% 0% Q1_ Q1_2012 BU3 BU2 BU1 4,500 4,000 3,500 3,000 3, ,055 Sales Value 3,662 3, , ,157 1,357 BU3 BU2 BU1 100% 80% 60% Sales Value in Percentage 2% 2% 2% 0% 0% 31% 31% 32% 36% 37% 2,500 2,000 1,500 1,000 2, ,779 2,426 2,416 1, % 20% 67% 67% 66% 64% 63% Q1_2012 0% Q1_
27 Gross Profit Structure BU3 BU2 BU1 Gross Profit By BU BU3 BU2 BU1 Gross Profit in Percentage % 16 80% % % 20% % 30 (2) -20% Q1_2012 7% 8% 7% 1% 57% 46% 60% 62% 59% 35% 46% 34% 37% 43% -2% Q1_2012 No. of Supplier BU1 10 BU2 16 BU3 6 50% 40% 30% 20% 10% 0% -10% -20% -30% -40% -50% -60% Gross Profit Margin by BU 31.1% 26.2% 25.5% 27.5% 14.1% 11.5% 14.6% 12.4% 10.4% 4.0% 5.2% 4.0% 4.1% 4.3% -50.0% Q1_2012 BU3 BU2 BU1 27
28 Statements of Comprehensive Income Highlights Revenue (Million Baht) Profit Margin , Revenue & Net Profit 2, ,678 3, Profitability Ratio 1, Q1_2012 Revenue Net Profit Q1_2012 Gross Profit Margin (%) Net Profit Margin (%) ROE (%) ROE Revenue and Net Profit In Q1/2012, sales increased from Q1/2011 around 3% due to the gradual economic recovery from heavy flooding across the country in Q4/2011. Profit Margin GC s gross profit margin of Q1/2012 has been decreasing due to higher competition as well as slow moving products sold out with negative margin. GC s net profit margin of Q1/2012 has been increasing from This was due to the loss on exchange rate and higher corporate income tax rate in
29 Statements of Financial Position Unit : Million Baht Asset 31/3/ /12/2011 Change % Trade Receivables % Inventory % Net Fixed Assets % Total Assets 1, , % Liabilities Short Term Loan % Trade Payables % Total Liabilities % Equity Paid up Capital % Share Premium % Retained Earnings % Total Equity % 29
30 Statements of Financial Position Highlight Debt to Equity Ratio D/E ratio is relatively lower. D/E ratio drop less than 2.0 which was decreased after IPO proceeds. However, the higher D/E ratio in Q1/2012 was resulting from the increase in short-term loan and trade payables Q1_ Current Ratio Continuous increase in current ratio GC current ratio has been improving to higher than 1.0x since GC got more working capital from IPO proceed. This higher liquidity can reduce GC s financial costs Q1_
31 CASH FLOW STATEMENTS FOR THE THREE-MONTH PERIODS ENDED 31 MARCH 2012 AND 2011 (Unit : Thousand Baht) Cash flows from operating activities Profit before tax 33,738 52,025 Adjustments to reconcile profit before tax to net cash provided by (paid from) operating activities : 6,496 5,965 Profit from operating activities before changes in operating assets and liabilities 40,234 57,990 Operating assets (increase) decrease Trade and other receivables (208,352) (180,933) Inventories (95,836) (69,995) Other current assets (7,656) (2,508) Other non-current assets 0 (15) Operating liabilities increase (decrease) Trade and other payables 111,070 94,089 Other current liabilities (1,007) (719) Cash flows used in operating activities (161,547) (102,091) Cash paid for interest expenses (3,898) (2,082) Cash paid for corporate income tax (11) (16) Net cash flows used in operating activities (165,456) (104,189) 31
32 CASH FLOW STATEMENTS (continued) FOR THE THREE-MONTH PERIODS ENDED 31 MARCH 2012 AND 2011 (Unit : Thousand Baht) Cash flows from investing activities Acquisition of equipment (280) (1,670) Proceeds from sales of motor vehicles Net cash flows used in investing activities (280) (1,524) Cash flows from financing activities Increase in short-term loans from financial institutions 143, ,680 Cash paid for liabilities under finance lease agreements (647) (1,162) Net cash flows from financing activities 142, ,518 Net increase (decrease) in cash and cash equivalents (22,798) 805 Cash and cash equivalents at beginning of period 41,387 26,394 Cash and cash equivalents at end of period 18,589 27,199 32
33 120% 100% 80% 60% 74% Dividend Payout Ratio 84% 83% 80% Dividend Payment Record Dividend Payout 99% To be top 50 dividend yield stock with continuous growth Positioning of GC Stock Operation Dividend Payment X-Date Price with X-Date Dividend Yield Period Ending (BPS.) Date before on x-date (cal. from before X-Date Price) 31-Dec A pr A pr % 30-Jun Sep A ug % 31-Dec A pr A pr % 30-Jun Sep A ug % 31-Dec A pr A pr % 30-Jun Sep A ug % 31-Dec A pr A pr % 30-Jun Sep A ug % 31-Dec A pr Mar % 30-Jun Sep A ug % 33
34 Dividend Payment Record Operation Dividend Payment X-Date Price with X-Date Dividend Yield Period Ending (BPS.) Date before on x-date (cal. From before X-Date Price) 31-Dec Apr Apr % 30-Jun Sep Aug % 31-Dec Apr Apr % 30-Jun Sep Aug % 31-Dec Apr Apr % 30-Jun Sep Aug % 31-Dec Apr Apr % 30-Jun Sep Aug % 31-Dec Apr Mar % 30-Jun Sep Aug % 31-Dec Apr-07 9-Mar % 30-Jun Sep Aug % 31-Dec Apr Mar % Regular Dividend payment with high yield. 34


35 Source : SET News on March 13, 2012 GC s ranking at 22 nd -Dividend Paid 80MB -Dividend Yield 8.03% 35
36 Dividend Yield 12.00% 10.00% 8.93% 10.45% 9.13% 9.78% 8.84% 8.00% 5.69% 7.30% 6.00% 4.53% 4.00% 4.67% 5.48% 3.28% 3.80% 2.00% 1.72% 0.00% 4.26% 2.80% 2.14% 2.56% 0.93% 1.00% -0.79% 2.40% -2.00% Dividend Yield Average Inf. Rate* Average Int. Rate* Remark * Both of the rate are collected from Bank of Thailand (BOT) Average interest rate is a deposit interest rate for 12 months Annualize in
37 Investor Relations Report 3 Month price Performance GC Average Petro Industrial P/E Ratio Dvd Yield ROE Source: SET s website as of April 30, 2012 Stock Price Unit : BPS SET INDEX Closing Price Month Q1-12 Q1-11 Apr-12 1,400,000 1,200,000 1,000, , , , ,000 0 Volume Trade (3 months) 1,267,300shares on17 Feb12 Volume (share) High Low Average Stock Volume Unit : Shares per day Month Q1-12 Q1-11 Apr-12 High 1,267,300 1,479, ,300 Low 1,600 7,500 5,600 Average 97, , ,053 Total 6,022,000 12,804,000 2,346,900 37
38 Investment Highlight A Leading and fast-growing with best solutions and service provider in Thai plastic and petrochemical Industry Exclusive distributorship from most of the world leading producers. Visionary, experienced, hands-on management team, Long term relation : Trade partner and also Financial Institute partner Diversified and well balanced sources of revenue from various industries Systematic risk control : Bad debt, foreign exchange exposure, price fluctuation No Fixed Cost ; due to all investment financing by long term loan (120 MB) already paid with in 4 years (2008) and no plan to investment in near term Regular Dividend payment with high yield. (Fully statutory reserve) Top 50 s dividend payment of SET Listing Companies Good Corporate Governance : with very good level in 2011 (Corporate Governance Report of Thai Listed Companies excellenct ) 38
39 Thank you, Questions are welcome 39
Global Connections Public Company Limited. Q1/2013 Performance Announcement Presentation May 2013
 Global Connections Public Company Limited Q1/2013 Performance Announcement Presentation May 2013 1 Today Content Company Overview Plastic and Petrochemical Industry Q1/2013 Performance IR report & Investment
The Siam Cement Public Company Limited Management s Discussion and Analysis (MD&A) Consolidated Financial Results: Q2/10 and H1/10
 Consolidated Financial Results: Q2/10 and H1/10") The Siam Cement Public Company Limited Management s Discussion and Analysis (MD&A) Consolidated Financial Results: Q2/10 and H1/10 Q2/10 Net Profit of 7,295 MB, up 6% q-o-q and 7% y-o-y. H1/10 Net Profit
The Siam Cement Public Company Limited Management s Discussion and Analysis (MD&A) Consolidated Financial Results: Q2/10 and H1/10 Q2/10 Net Profit of 7,295 MB, up 6% q-o-q and 7% y-o-y. H1/10 Net Profit
Economic outlook. Bangkok Bank position. Strategic priorities and targets
 20110603 1 Topics 1 2 3 Economic outlook Bangkok Bank position Strategic priorities and targets 2 GDP growth outlook remains strong 6 Baht trn 4 +2.5% 2.3% +7.8% +4 5% +3.0% 2 0 2008 2009 2010 2011f 1Q11(A)
Westlake Chemical Corporation. Acquisition of Eastman s Polyethylene Business and Ethylene Pipeline October 10, 2006
 Westlake Chemical Corporation Acquisition of Eastman s Polyethylene Business and Ethylene Pipeline October 10, 2006 Forward-Looking Statements Statements made during this presentation contain forward-looking
Meetings with Investors January, 2012
 2011 Leader: Building Material & Fixtures Sector Ranked Gold Class: 2011, 2010, 2009, 2008 DJSI member since: 2004 Ranking by SAM Meetings with Investors January, 2012 Agenda Slide 2 Snapshot Strategy
PTTGC Opportunity Day Q Performance
 PTTGC Opportunity Day Q2 2018 Performance 22 August 2018 1 Disclaimer This presentation includes forward-looking statements that are subject to risks and uncertainties, including those pertaining to the
Financial Summary. Mitsui Chemicals, Inc. November 1, Results of the 1 st Half of FY2018 & Outlook for FY2018
 Financial Summary Results of the 1 st Half of FY2018 & Outlook for FY2018 Mitsui Chemicals, Inc. November 1, 2018 FY2018 indicates the period from April 1, 2018 to March 31, 2019. Contents 1.
INEOS STYROLUTION. Q1/ 2018 Investor Earnings Call
 INEOS STYROLUTION Q1/ 2018 Investor Earnings Call Disclaimer The following presentation includes forward-looking statements, within the meaning of the US securities laws, based on our current expectations
CONTENTS I. FINANCIAL HIGHLIGHTS II. COMMON STOCK INFORMATION III. FINANCIAL SUMMARY IV. CONSOLIDATED FINANCIAL STATEMENTS V. SEGMENT INFORMATION
 Fact Fact Fact Book Book Book 2015 May 2015 2 2 CONTENTS I. FINANCIAL HIGHLIGHTS II. COMMON STOCK INFORMATION III. FINANCIAL SUMMARY IV. CONSOLIDATED FINANCIAL STATEMENTS V. SEGMENT INFORMATION VI. PRODUCTION
Novel High Performance Polymers
 Novel High Performance Polymers Peter Heydasch, Dow Europe GmbH Dubai PlastPro April 23 rd to 25 th, 2007 Trademark of The Dow Chemical Company ( Dow ) or an affiliated company of Dow Page 1 Monomers and
Huhtamaki roadshow presentation. Investor Relations Q1 2009
 Huhtamaki roadshow presentation Investor Relations 2009 Huhtamaki in brief A leading manufacturer of consumer and specialty packaging with head office in Espoo, Finland Net sales EUR 2.3 billion in 65
August 8, 2018 Jefferies Industrial Conference
 August 8, 2018 Jefferies Industrial Conference Trademark of Trinseo S.A. or its affiliates Trademark of Trinseo S.A. or its affiliates 1 Introductions & Disclosure Rules Introductions Chris Pappas, President
Polyplex (Thailand) Public Limited Company
 Public Limited Company") Polyplex (Thailand) Public Limited Company Presentation at the SET Opportunity Day Monday, 19 th March 2012 Website : www.polyplexthailand.com Contents BOPET Film Industry Polyplex group Polyplex Competitive
Polyplex (Thailand) Public Limited Company Presentation at the SET Opportunity Day Monday, 19 th March 2012 Website : www.polyplexthailand.com Contents BOPET Film Industry Polyplex group Polyplex Competitive
Signet Industries Ltd BSE Scrip Code:
 Signet Industries Ltd BSE Scrip Code: 512131 Comm. Trading & Distribution September 21, 2012 Equity Statistics Current Market Price Rs. 52 Week High / Low Rs. Market Capitalisation Rs. crores Free Float
Financial Report The 1st Half of FY2015 (From Apr. 1 to Sep. 30, 2014)
") Financial Report The 1st Half of FY2015 (From Apr. 1 to Sep. 30, ) November 6, Statement of Income (Consolidated) for 6 Months ended, 2013 Amount Percentage (JPY100m) Net sales 1,534 1,484 50 3 % Elastomer
Financial Report The 1st Half of FY2015 (From Apr. 1 to Sep. 30, ) November 6, Statement of Income (Consolidated) for 6 Months ended, 2013 Amount Percentage (JPY100m) Net sales 1,534 1,484 50 3 % Elastomer
Sri Trang Agro-Industry Public Company Limited
 Sri Trang Agro-Industry Public Company Limited Management Discussion and Analysis, Q1 2017 12 th May 2017 STA : The World s Leading Natural Rubber Player Financial result overview In Q1 2017, Natural rubber
Huhtamaki roadshow presentation. Investor Relations Copenhagen Jan 8, 2010
 Huhtamaki roadshow presentation Investor Relations Copenhagen Jan 8, 2010 Huhtamaki in brief A leading manufacturer of consumer and specialty packaging with head office in Espoo, Finland Net sales EUR
Financial Report 1st Quarter of FY2016 (From Apr. 1 to Jun. 30, 2016)
") Financial Report 1st Quarter of (From Apr. 1 to Jun. 30, 2016) July 27, 2016 Statement of Income (Consolidated) for 3 Months ended June 30, 2016 Percentage Net sales 700 760-60 -8 % Comparative analysis
Financial Report 1st Quarter of (From Apr. 1 to Jun. 30, 2016) July 27, 2016 Statement of Income (Consolidated) for 3 Months ended June 30, 2016 Percentage Net sales 700 760-60 -8 % Comparative analysis
Financial Results for FY2017. (Ended March 31, 2018)
") Financial Results for (Ended March 31, 2018) Apr. 27, 2018 Statement of Income (Consolidated) for 12 Months ended Mar. 31, 2017 Amount Rate Remarks (JPY100m) Net sales 3,327 2,876 451 16 % Comparative
Financial Results for (Ended March 31, 2018) Apr. 27, 2018 Statement of Income (Consolidated) for 12 Months ended Mar. 31, 2017 Amount Rate Remarks (JPY100m) Net sales 3,327 2,876 451 16 % Comparative
Financial Results for FY2016 (Ended March 31, 2017)
") Financial Results for (Ended March 31, 2017) Apr. 28, 2017 Statement of Income (Consolidated) for 12 Months ended Mar. 31, 2017 Amount Percentage Remarks (JPY100m) Net sales 2,876 2,956-80 -3 % Comparative
Financial Results for (Ended March 31, 2017) Apr. 28, 2017 Statement of Income (Consolidated) for 12 Months ended Mar. 31, 2017 Amount Percentage Remarks (JPY100m) Net sales 2,876 2,956-80 -3 % Comparative
Financial Summary. Mitsui Chemicals, Inc. May 12, Results of FY2016 & Outlook for FY2017. Copyright 2017 Mitsui Chemicals, Inc.
 Financial Summary Results of & Outlook for FY2017 Mitsui Chemicals, Inc. May 12, 2017 indicates the period from April 1, 2016 to March 31, 2017. Contents 1. Results of (April 1, 2016 March 31,
LyondellBasell Acquisition of A. Schulman
 LyondellBasell Acquisition of A. Schulman Creating an Advanced Polymer Solutions Leader February 15, 2018 1 Cautionary Note Regarding Forward-looking Statements The statements in this communication relating
Global Styrene Butadiene Rubber (SBR) Market Study ( )
 Market Study ( )") Global Styrene Butadiene Rubber (SBR) Market Study (2014 2025) Table of Contents 1. INTRODUCTION 1.1. Introduction to SBR Market Product Description Properties Industry Structure Value Chain Market Dynamics
Global Styrene Butadiene Rubber (SBR) Market Study (2014 2025) Table of Contents 1. INTRODUCTION 1.1. Introduction to SBR Market Product Description Properties Industry Structure Value Chain Market Dynamics
2011 Leader: Building Material & Fixtures Sector Ranked Gold Class: 2011, 2010, 2009, 2008 DJSI member since: 2004 Ranking by SAM
 2011 Leader: Building Material & Fixtures Sector Ranked Gold Class: 2011, 2010, 2009, 2008 DJSI member since: 2004 Ranking by SAM UBS GEM Conference New York City Nov 28-29, 2011 Agenda Slide 2 Snapshot
Financial Summary Results of the First Half of FY2012 & Forecast for FY2012
 Financial Summary Results of the First Half of & Forecast for Mitsui Chemicals, Inc. November 1,, 2012 indicates the fiscal year starting on April 1, 2012 and ending on March 31, 2013 Contents
Economic outlook. Bangkok Bank position. Strategic priorities and targets
 20110721 1 Topics 1 2 3 Economic outlook Bangkok Bank position Strategic priorities and targets 2 GDP growth outlook remains strong 6 Baht trn 4 +2.5% 2.3% +7.8% +4 5% +3.2% +2.6% 2 0 2008 2009 2010 2011f
KASIKORNBANK. Investor Presentation. Monthly Economic Information By KASIKORN RESEARCH CENTER. June 2017
 KASIKORNBANK Investor Presentation Monthly Economic Information By KASIKORN RESEARCH CENTER June 7 For further information, please contact Investor Relations Unit or visit our website at www.kasikornbankgroup.com
PEER GROUPS CMP MARKET CAP EPS P/E (X) P/BV(X) DIVIDEND Company Name (Rs.) Rs. in mn. (Rs.) Ratio Ratio (%)
 P/BV(X) DIVIDEND Company Name (Rs.) Rs. in mn. (Rs.) Ratio Ratio (%)") BUY CMP 71.65 Target Price 85.00 CAPRIHANS INDIA LTD Result Update (PARENT BASIS): Q1 FY16 SEPTEMBER 9 th 2015 ISIN: INE479A01018 Index Details Stock Data Sector Plastic Products BSE Code 509486 Face Value
BUY CMP 71.65 Target Price 85.00 CAPRIHANS INDIA LTD Result Update (PARENT BASIS): Q1 FY16 SEPTEMBER 9 th 2015 ISIN: INE479A01018 Index Details Stock Data Sector Plastic Products BSE Code 509486 Face Value
Analyst Conference Q1/13 Wednesday, April 24, 2013
 Analyst Conference Q1/13 Wednesday, April 24, 2013 Business restructuring slide 2 SCG SCG Cement - Building Materials SCG Chemicals SCG Paper SCG Investment 1. Mr. Kajohndet Sangsuban President SCG Cement-Building
Revised October 17, 2016
 Revised October 17, 2016 60 ISM Manufacturing Purchasing Managers Index (September 2015 September 2016) 58 56 54 52 50 48 46 44 42 Sept-15 Oct Nov Dec Jan-16 Feb Mar Apr May Jun Jul Aug Sept Purchasing
Financial Summary Results of Nine Months of FY2012 & Forecast for FY2012
 Financial Summary Results of Nine Months of & Forecast for Mitsui Chemicals, Inc. February 5,, 2013 indicates the fiscal year starting on April 1, 2012 and ending on March 31, 2013 Contents 1.Results
Advanced Petrochemical Co.
 Advanced Petrochemical Co. Initiation of Coverage Recommendation Overweight Fair Value (SAR) 57.25 Price as of May 10, 2016 42.74 Expected Return 01.1% Company Data Tadawul Symbol 2330.SE 52 Week High
Key developments and outlook
 1/17 Key developments and outlook Economic growths in 2016 and 2017 remain close to the previous assessment. Better-than-expected merchandise exports and private consumption compensate for weaker-than-expected
Summary of Consolidated Financial Results for First Quarter of FY2018
 Summary of Consolidated Financial Results for First Quarter of Aug 2, 2018 Mitsui Chemicals, Inc. 1. Summary of Income Statement Net sales Operating income Ordinary income Profit attributable to owners
Macroeconomic Assessment. 30 April 2015
 Macroeconomic Assessment 30 April Source : Office of Agricultural Economics, calculated by Bank of Thailand Supply Side Policy Team Tel. 0 2283 6190 2 200 150 100 50 0 (%YoY) P = Preliminary Data H1 H2
Company Fundamentals
 Plastic Products November 01, 2012 CMP Rs. 14.4 BSE Code 531287 BSE ID NATPLASTI High/Low 1Y (Rs.) 18.70/13.40 Average Volume (3M) 1,075 Market Cap (Rs. Cr.) 8 Shareholding % Sep-12 Jun-12 Promoters 48.51
! " " # #$ %" $ & # '(()
") )4() - &! " " # #$ %" $ & # '(()!" # $% &# ' %% % * +!, -+. /0, '(( 1 ()*+,-./0+1,-2".34,4-5$ % % % 6 3 % %6 % 7 %8 9 '% $ ' %'% ::; '%
)4() - &! " " # #$ %" $ & # '(()!" # $% &# ' %% % * +!, -+. /0, '(( 1 ()*+,-./0+1,-2".34,4-5$ % % % 6 3 % %6 % 7 %8 9 '% $ ' %'% ::; '%
Monthly Economic Insight
 Monthly Economic Insight Prepared by : TMB Analytics Date: 22 February 2018 Executive Summary Synchronized global economic growth continued to brighten global economic outlook and global trade outlook.
1H of FY2013 (Apr. to Sep.) Earnings Presentation (Overview)
 Earnings Presentation (Overview)") 1 1H of FY2013 (Apr. to Sep.) Earnings Presentation (Overview) 1 Overview of 1H FY2013 Results [Billion, except for reference] 1H FY2013 1H FY2012 Difference 1H FY2013 Forecast Announced Aug. 1, 2013 Net
1 1H of FY2013 (Apr. to Sep.) Earnings Presentation (Overview) 1 Overview of 1H FY2013 Results [Billion, except for reference] 1H FY2013 1H FY2012 Difference 1H FY2013 Forecast Announced Aug. 1, 2013 Net
Consolidated Financial Results FY2017: Full-Year Ended December 31
 Securities Code:4631 Consolidated Financial Results FY: Full-Year Ended December 31 February 2018 2 Contents Quarterly trends in segment results (Reference) 2 Summary of financial results 3 Segment results
Market Capitalization $37.6 Billion
 BUY HOLD SELL A+ A A- B+ B B- C+ C C- D+ D D- E+ E E- F Annual Dividend Rate BUY BUY RATING SINCE 09/28/2004 TARGET PRICE $45.29 BUSINESS DESCRIPTION Provides chemical, plastic and agricultural products
EASTMAN CHEMICAL COMPANY EMN January 26, :30 PM EDT. Table of Contents. TABLE 1 Statements of Earnings 1. TABLE 2 Other Sales Information 2-3
 FINANCIAL INFORMATION January 26, 2006 For use in the Eastman Chemical Company Conference Call at 8:00 AM (EDT), January 27, 2006. Table of Contents Item Page TABLE 1 Statements of 1 TABLE 2 Other Sales
Financial Summary. Mitsui Chemicals, Inc. February 5, Results for 3 rd Quarter of FY2018 & Outlook for FY2018
 Financial Summary Results for 3 rd Quarter of FY2018 & Outlook for FY2018 Mitsui Chemicals, Inc. February 5, 2019 FY2018 indicates the period from April 1, 2018 to March 31, 2019. Contents 1.
3Q17 Results Investor Presentation
 3Q17 Results Investor Presentation 09/11/2017 Ethylene Naphtha spread averaged US$ 681/ton in 3Q17 Ethylene Naphtha spread averaged US$ 705/ton in 2Q17 Ethylene-naphtha spreads decreased by 3% from the
The Chemours Company Goldman Sachs Basic Materials Conference. May 17, 2017
 The Chemours Company Goldman Sachs Basic Materials Conference May 17, 2017 Safe Harbor Statement and Other Matters This presentation contains forward-looking statements, within the meaning of the federal
Monthly Report on the Corporate Goods Price Index ( Preliminary Figures for August 2017 )
") Research and Statistics Department Bank of Japan Report on the Corporate Goods Price Index The Producer Price Index was und from the previous. The Export Price Index (contract currency ) rose 0.6 percent
Research and Statistics Department Bank of Japan Report on the Corporate Goods Price Index The Producer Price Index was und from the previous. The Export Price Index (contract currency ) rose 0.6 percent
11-Year Consolidated Financial Highlights
 11-Year Consolidated Financial Highlights As of March 31, 2017 2007.3 2008.3 2009.3 2010.3 Net Sales ( million) 1,376,958 1,487,496 1,660,162 1,415,718 Operating Profit ( million) 162,315 70,048 65,204
Financial Report For the year ended March 31, 2014 (April 1, 2013 to March 31, 2014)
") Financial Report For the year ended March 31, 2014 (April 1, 2013 to March 31, 2014) May 8, 2014 Statement of Income (Consolidated) for 12 Months ended Mar.31, 2014 FY2013 FY2012 Amount Percentage (JPY100m)
Financial Report For the year ended March 31, 2014 (April 1, 2013 to March 31, 2014) May 8, 2014 Statement of Income (Consolidated) for 12 Months ended Mar.31, 2014 FY2013 FY2012 Amount Percentage (JPY100m)
CIS DOWNSTREAM SUMMIT 20 Th Annual
 1 CIS DOWNSTREAM SUMMIT 20 Th Annual H.Alimorad Investment Director / National Petrochemical Company (NPC) Board Member of Persian Gulf Petrochemical Industries Company (PGPIC) 2 Iran 2 nd largest economy
The Siam Cement Public Company Limited
 Management s Discussion and Analysis Consolidated Financial Results: Q4/05 and FY2005 Business Overview FY2005 Net Profit of 32,236 MB, down 12% y-o-y. Equity Income from Associated Companies in FY2005
INEOS STYROLUTION KEVIN MCQUADE, CEO. INEOS Investor Day, May 3rd - 4th, 2016
 INEOS STYROLUTION KEVIN MCQUADE, CEO INEOS Investor Day, May 3rd - 4th, 2016 Agenda Business overview Business strategy Financial performance Current trading and outlook 2 BUSINESS OVERVIEW 3 INEOS Styrolution
Financial Summary Results of the First Half of FY2011
 Financial Summary Results of the First Half of & Outlook for Mitsui Chemicals, Inc. November 2,, 2011 indicates the fiscal year starting on April 1 of 2011 and ending on March 31 of 2012 Contents
Summary of Consolidated Financial Results for Second Quarter of FY2014
 Summary of Consolidated Financial Results for Second Quarter of FY2014 1. Summary of Income Statement Net sales Operating income Ordinary income (loss) Net income (loss) Comprehensive income 18.9 21.3
Thailand Macroeconomic Assessment Bank of Thailand, June Jun. (%MoM) -0.3% -4.2% +1.3% (%) (%MoM)
 -0.3% -4.2% +1.3% (%) (%MoM)") Thailand Macroeconomic Assessment Bank of Thailand, June Farm income increased due mainly to higher farm prices while farm production remained low. Manufacturing production expanded slightly from the previous
Thailand Macroeconomic Assessment Bank of Thailand, June Farm income increased due mainly to higher farm prices while farm production remained low. Manufacturing production expanded slightly from the previous
INVESTOR RELATIONS Review 2011 Main Business Activities 2011 Outlook Appendices
 0 INVESTOR RELATIONS 2011 2011 Review 2011 Main Business Activities 2011 Outlook Appendices 0 1. 2011 Review 2011 Overview Sales & Operating Income Achieved the record high sales of KRW 6,457.4 billion
2Q/2011 2Q/2010 1Q/2011
 (Revised) PTT Chemical Public Company Limited Management's Discussion and Analysis Financial Result for the second quarter of 2011 1. Executive Summary In the second quarter of 2011, PTT Chemical Public
(Translation) PTT Global Chemical Public Company Limited Management's Discussion and Analysis Financial Result for Year 2011
 PTT Global Chemical Public Company Limited Management's Discussion and Analysis Financial Result for Year 2011") PTT Global Chemical Public Company Limited Management's Discussion and Analysis Financial Result for Year 2011-1 PTT Global Chemical Public Company Limited and its subsidiaries ( the Company ) was formed
PTT Global Chemical Public Company Limited Management's Discussion and Analysis Financial Result for Year 2011-1 PTT Global Chemical Public Company Limited and its subsidiaries ( the Company ) was formed
PETKİM PETROKİMYA HOLDİNG A.Ş. ANALYST PRESENTATION 14 August 2009
 PETKİM PETROKİMYA HOLDİNG A.Ş. ANALYST PRESENTATION 14 August 2009 2 AGENDA PETROCHEMICAL INDUSTRY & PETKİM OPERATIONAL ACTIVITIES FINANCIAL RESULTS GROWTH PLAN 3 AGENDA PETROCHEMICAL INDUSTRY & PETKİM
Q Operational and Financial Results. 15 May 2018
 Q1 2018 Operational and Financial Results 15 May 2018 DISCLAIMER The information contained herein pertaining to SIBUR (the "Company") has been provided by the Company solely for use at this presentation.
THIRD QUARTER FISCAL YEAR 2018 Earnings Conference Call & Presentation. August 7, 2018 at 9:00 a.m. CT (10:00 a.m. ET)
") THIRD QUARTER FISCAL YEAR 2018 Earnings Conference Call & Presentation August 7, 2018 at 9:00 a.m. CT (10:00 a.m. ET) 1 Third Quarter Fiscal Year 2018 Welcome to Nexeo s Earnings Conference Call and Presentation
THIRD QUARTER FISCAL YEAR 2018 Earnings Conference Call & Presentation August 7, 2018 at 9:00 a.m. CT (10:00 a.m. ET) 1 Third Quarter Fiscal Year 2018 Welcome to Nexeo s Earnings Conference Call and Presentation
PTT Global Chemical Public Company Limited. FY 2014 Management Discussion and Analysis. (Translation) EXCELLENCE CREATES SUSTAINABLITIY
 EXCELLENCE CREATES SUSTAINABLITIY") PTT Global Chemical Public Company Limited FY 2014 Management Discussion and Analysis (Translation) EXCELLENCE CREATES SUSTAINABLITIY Executive Summary In 2014 PTT Global Chemical Public Company Limited
PTT Global Chemical Public Company Limited FY 2014 Management Discussion and Analysis (Translation) EXCELLENCE CREATES SUSTAINABLITIY Executive Summary In 2014 PTT Global Chemical Public Company Limited
Vietnam Looking Forward
 Looking Forward 1 in Regional Perspectives Compared to its regional peers, economy, although the smallest in size, is the most dynamic in terms of growth. GDP growth (%) USD 395 Bn 8.0 7.0 6.0 5.0 4.0
Bank of America Global Agriculture and Chemicals Conference
 Bank of America Global Agriculture and Chemicals Conference Sergey Vasnetsov SVP, Strategic Planning & Transactions March 2, 2016 Cautionary Statement The statements in this presentation relating to matters
Financial Summary Results of Nine Months of FY2011 & Outlook for FY2011
 Financial Summary Results of Nine Months of & Outlook for Mitsui Chemicals, Inc. February 3,, 2012 indicates the fiscal year starting on April 1, 2011 and ending on March 31, 2012 Contents 1.Results
Public Expose 2013 PT Chandra Asri Petrochemical Tbk
 Public Expose 2013 PT Chandra Asri Petrochemical Tbk Jakarta, 18 December 2013 Contents I. Company At a Glance II. III. Petrochemical Industry Updates Financial & Operational Performance IV. Strategic
Advisory Desk. TVS Srichakra Ltd. BUY CMP. `355 Target Price `468. Investment rationale. Outlook and valuation. Investment Period 12 Months
 Ltd. Ltd. (TVSSL), a part of TVS Group, is a leading manufacturer of two and three-wheeler tyres with a 25% market share. Two-wheeler demand growth (~16% yoy YTD) continues to be insulated from the current
SunVic Chemical, a leading manufacturer of chemicals for industrial/consumer products, launches S$46.5 million IPO
 30 Raffles Place #20-02 Caltex House Singapore 048622 Tel : +65 6846 1800 Fax : +65 6846 1900 FOR IMMEDIATE RELEASE CONTACT INFORMATION August Consulting Tel: 6733 8873 Fax: 6733 9913 YAP Meng Lee menglee@august.com.sg
Siamgas and Petrochemicals Public Company Limited. Presentation for Investors & Analysts. Quarter 4, 2013
 Siamgas and Petrochemicals Public Company Limited Presentation for Investors & Analysts Quarter 4, 2013 Disclaimer The information contained in this presentation is for information purposes only and does
Second Quarter 2017 Financial Results August 3, 2017
 Second Quarter 2017 Financial Results August 3, 2017 Trademark of Trinseo S.A. or its affiliates Introductions & Disclosure Rules Introductions Chris Pappas, President & CEO Barry Niziolek, Executive Vice
LyondellBasell Industries NV
 March 12, 2015 LyondellBasell Industries NV Current Recommendation Prior Recommendation Underperform Date of Last Change 11/09/2011 Current Price (03/11/15) $85.11 Target Price $89.00 NEUTRAL (LYB-NYSE)
Financial Summary. Mitsui Chemicals, Inc. Aug 2, Results of the 1 st Quarter of FY2018 & Outlook for FY2018
 Financial Summary Results of the 1 st Quarter of FY2018 & Outlook for FY2018 Mitsui Chemicals, Inc. Aug 2, 2018 FY2018 indicates the period from April 1, 2018 to March 31, 2019. Contents 1. Results
Company Overview. Financial Performance
 Dec-14 Jan-15 Feb-15 Mar-15 Apr-15 May-15 Jun-15 Jul-15 Aug-15 Sep-15 Oct-15 Nov-15 CMP: 25.20 December 30, 2015 Stock Details BSE code 524440 BSE ID CAMEXLTD Face value ( ) 10 No of shares (m) 10.2 52
Company Focus. Polyplex (Thailand) Thailand. FV Bt3.04 SET: (Downgrade from Buy)
 Thailand. FV Bt3.04 SET: (Downgrade from Buy)") Thailand DBS Group Research. Equity FV Bt3.04 SET: 694.09 (Downgrade from Buy) Price Target : 1-year Bt3.00 (prev. Bt5.82) Reason for Report : Company visit ANALYST Vichitr Kuladejkhuna, CFA 66 (0) 2657
Thailand DBS Group Research. Equity FV Bt3.04 SET: 694.09 (Downgrade from Buy) Price Target : 1-year Bt3.00 (prev. Bt5.82) Reason for Report : Company visit ANALYST Vichitr Kuladejkhuna, CFA 66 (0) 2657
2.1 Supply. Bank of Thailand, January Nominal Farm Income. Manufacturing Production Index (MPI)
") Bank of Thailand, uary 2.1 Supply Farm income continually increased but concentrated in certain crops and regions. Service sector continued to expand, especially for tourism-related activities on the back
Bank of Thailand, uary 2.1 Supply Farm income continually increased but concentrated in certain crops and regions. Service sector continued to expand, especially for tourism-related activities on the back
Analyst Conference Q3/13 Wednesday, October 30, 2013
 Analyst Conference Q3/13 Wednesday, October 3, 213 AGENDA slide 2 I. Consolidated Results - Q3/13 Consolidated Results - 9M/13 Summary - Financial Updates II. SCG Cement - Building Materials III. SCG Chemicals
SITHAI-0501/58. Subject : Explanation on Financial Information of the 1 st Quarter of Dear : President The Stock Exchange of Thailand
 SITHAI-0501/58 Subject : Explanation on Financial Information of the 1 st Quarter of 2015 Dear : President The Stock Exchange of Thailand May 15, 2015 We refer to our financial information of Q1/2015 already
Investor Presentation. For 2016
 Investor Presentation For 216 Bangkok Bank 1. Operating Environment 2. Our Financial Results 216 3. Bangkok Bank s Position 4. Our Key Focus & Strategy 2 The Thai Economy: Steady Trend of Moderate Recovery
It s made for Sleep. It s a Sealy.
 TM It s made for Sleep. It s a Sealy. Forward-Looking Statements This document contains forward-looking statements within the meaning of the safe harbor provisions of the Securities Litigation Reform Act
IRPC Public Company Limited and its Subsidiaries Management Discussion and Analysis (MD&A) For Quarter 2/2009
 For Quarter 2/2009") IRPC Public Company Limited and its Subsidiaries Management Discussion and Analysis (MD&A) For Quarter 2/ 1. Operating Performance Consolidated Income Statement 2Q09 2Q08 Change 1Q09 Change Sales Revenue
IRPC Public Company Limited and its Subsidiaries Management Discussion and Analysis (MD&A) For Quarter 2/ 1. Operating Performance Consolidated Income Statement 2Q09 2Q08 Change 1Q09 Change Sales Revenue
Contact Person: Fuyuhiko Kubota, General Manager, Corporate Communication Department TEL: Net sales Operating profit Ordinary profit
 May 10, 2018 Consolidated Financial Report for Year ended March 31, 2018 Toyobo Co., Ltd. Stock Code: 3101 Listed on the First Section of the TSE URL http://www.toyobo-global.com/ir/ Representative: Seiji
2009 Hankook Tire 4th Quarter Result 2010 BusinessTarget IR
 2009 Hankook Tire 4th Quarter Result 2010 BusinessTarget IR 2010.01.15 English Ver. The information in this presentation is based upon management forecasts and reflects prevailing conditions and our views
Supply. Nominal Farm Income. Economic and Monetary Conditions, Febuary Real Farm Income. Manufacturing Production Index (MPI)
") Economic and Monetary Conditions, Febuary Supply Farm income continued to contract, attributed mainly to decreased agricultural prices which outweighed the expansion in agricultural production. Manufacturing
Economic and Monetary Conditions, Febuary Supply Farm income continued to contract, attributed mainly to decreased agricultural prices which outweighed the expansion in agricultural production. Manufacturing
Supplementary Information on Financial Summary for the Nine Months of FY2014
 Supplementary Information on Financial Summary for the Nine Months of FY2014 Mitsui Chemicals, Inc. February 4, 2015 Contents 1) Consolidated Financial Highlights of the Nine Month of FY2014 1 2) Increase/Decrease
Morgan Stanley Global Chemicals Conference Sergey Vasnetsov Senior Vice President, Strategic Planning and Transactions November 2012
 Morgan Stanley Global Chemicals Conference Sergey Vasnetsov Senior Vice President, Strategic Planning and Transactions November 212 Cautionary Statement The information in this presentation includes forward-looking
Fourth Quarter and Full Year 2017 Financial Results February 19, 2018
 Fourth Quarter and Full Year 2017 Financial Results February 19, 2018 Trademark of Trinseo S.A. or its affiliates Introductions & Disclosure Rules Introductions Chris Pappas, President & CEO Barry Niziolek,
Taiwan Prosperity Chemical Corporation. 2Q/2013 Investors Conference
 Taiwan Prosperity Chemical Corporation 2Q/20 Investors Conference September, 20 TPCC Disclaimer The forward-looking statements contained in this presentation are subject to risks and uncertainties and
Financial Results for First Half of Fiscal 2008
 Financial Results for First Half of Fiscal Bridgestone Corporation August 8, 1 Business and Financial Performance 2 Consolidated Results for First Half of Fiscal Reference February 08 Announcement 1H Projection
Vol. 5 : August Forward to Complex Refinery. The Bangchak Petroleum Public Company Limited
 Vol. 5 : August 2008 Forward to Complex Refinery The Bangchak Petroleum Public Company Limited Contents Editor s Note 2 Oil Price Situation 2Q 08 3 2Q 08 Performance Summary Product Quality Improvement
Investor Presentation. For 2017
 Investor Presentation For 2017 Bangkok Bank 1. Operating Environment 2. Our Key Focus and Position 3. Our Financial Result 2017 2 For 2018, global economic expansion is synchronous with rising global investment
ROADSHOW WITH UOB KAY HIAN : INVESTOR PRESENTATION
 ROADSHOW WITH UOB KAY HIAN : INVESTOR PRESENTATION SEPTEMBER 13, 2016 Disclaimer This presentation includes forward-looking statements that are subject to risks and uncertainties, including those pertaining
2.1 Supply. Nominal Farm Income. Bank of Thailand, October 2017
 Bank of Thailand, October 2.1 Supply Farm income contracted from both decreased agricultural prices and output. Manufacturing production remained unchanged from the same period last year. The overall services
Financial Summary. Mitsui Chemicals, Inc. Results of FY2012 & Forecast for FY2013. Copyright 2013 Mitsui Chemicals, Inc.
 Financial Summary Results of FY2012 & Forecast for FY2013 Mitsui Chemicals, Inc. May 10,, 2013 FY2012 indicates the fiscal year starting on April 1, 2012 and ending on March 31, 2013 Contents
MRF BUY. Performance Highlights. CMP `9,407 Target Price `11,343. Company Update Automobile. Key financials
 Company Update Automobile February 22, 212 MRF Performance Highlights Y/E Sept. (` cr) 1QSY12 1QSY11 % chg (yoy) 4QSY11 % chg (qoq) Net sales 2,875 2,167 32.7 2,62 9.8 EBITDA 258 243 5.9 181 42.6 EBITDA
Bando Chemical Industries, Ltd.
 Consolidated Business Results for the First Half of Fiscal 2011 November 4, 2011 Bando Chemical Industries, Ltd. 0 First Half Financial Summary for the Fiscal Year Ending March 31, 2012 1 (1)Settlement
KAP INDUSTRIAL HOLDINGS LIMITED UNAUDITED RESULTS FOR THE SIX MONTHS ENDED 31 DECEMBER 2018
 KAP INDUSTRIAL HOLDINGS LIMITED INTEGRATED INTO EVERY DAY INTRODUCTION JAAP DU TOIT CHAIRMAN AGENDA INTRODUCTION JAAP DU TOIT UNAUDITED INTERIM RESULTS FOR THE SIX STRATEGY MONTHS IMPLEMENTATION ENDED
Andhra Petrochemicals Ltd BSE Scrip Code:
 Andhra Petrochemicals Ltd BSE Scrip Code: 500012 Crude Oil February 12, 2016 Current Market Price Rs. 52 Week High/Low Rs. Market Capitalisation Free Float Dividend Yield % Equity Statistics Rs. Crores
Supply. Bank of Thailand, December Nominal Farm Income. Real Farm Income. Manufacturing Production Index (MPI)
") Bank of Thailand, December Supply Farm income continued to decline from decreased agricultural prices which outweighed the expansion in agricultural production Manufacturing production expanded from the
Bank of Thailand, December Supply Farm income continued to decline from decreased agricultural prices which outweighed the expansion in agricultural production Manufacturing production expanded from the
Sri Trang Agro-Industry Public Company Limited
 Sri Trang Agro-Industry Public Company Limited Management Discussion and Analysis, Q3 2013 14 th November 2013 STA : A World Leading Natural Rubber Player Financial result overview Our strategic plan to
PetroChem Wire. Post-Harvey resin update
 PetroChem Wire Post-Harvey resin update PetroChem Wire Samantha Hartke, Product Manager September 2017 Agenda PetroChem Wire: Who we are Harvey: Olefins production losses Harvey: Polyolefins production
Sep 2017 = 21.9 Bn USD Ex. Gold = 20.6 Bn USD. H1 H2 Q1 Q2 Q3 Aug Sep %MoM
 1 Aug = 21.0 Bn USD Ex. Gold = 20.0 Bn USD Source: Compiled from Customs Department s data P = Preliminary data Sep = 21.9 Bn USD Ex. Gold = 20.6 Bn USD P P Share %YoY P P H1 H2 Q1 Q2 Q3 Aug Sep %MoM sa