INTERIM REPORT AS AT JUNE 30, 2013
|
|
|
- Shauna Thomas
- 5 years ago
- Views:
Transcription


1 INTERIM REPORT AS AT JUNE 30,
2 Boralex is a power producer whose core business is dedicated to the development and the operation of renewable energy power stations. Currently, the Corporation operates an asset base with an installed capacity of almost 500 MW in Canada, the Northeastern United States and France. Boralex is also committed under power development projects, both independently and with Canadian and European partners, to add approximately 550 MW of power that will be put in service by the end of With more than 200 employees, Boralex is known for its diversified expertise and in-depth experience in four power generation types wind, hydroelectric, thermal and solar. Boralex s shares and convertible debentures are listed on the Toronto Stock Exchange under the ticker symbols BLX and BLX.DB, respectively. boralex.com HEAD OFFICE 36 Lajeunesse Street Kingsey Falls, Québec Canada J0A 1B0 Telephone: Fax: BUSINESS OFFICES Montréal 772 Sherbrooke Street West Montréal, Québec Canada H3A 1G1 Telephone: Fax: Vancouver Robson Street Vancouver, British Columbia Canada V6E 1B5 Telephone: Lille 2, rue du Priez Lille France Telephone : 33 (0) Fax: 33 (0) Marseille 25, rue de la République Marseille France Telephone: 33 (0) Fax: 33 (0)
3 Interim Management's Discussion and Analysis 2 As at June 30, 2013 Table of Contents DESCRIPTION OF BUSINESS 2 INTRODUCTORY COMMENTS TO THE INTERIM MANAGEMENT'S DISCUSSION AND ANALYSIS 3 GROWTH STRATEGY AND KEY DEVELOPMENTS IN RECENT FISCAL YEARS 4 KEY EVENTS AFFECTING BORALEX'S RESULTS, FINANCIAL POSITION AND POSITIONING IN 2013 COMPARED WITH SEASONAL FACTORS 7 FINANCIAL HIGHLIGHTS 11 NON-IFRS MEASURES 12 ANALYSIS OF OPERATING RESULTS FOR THE THREE-MONTH PERIOD ENDED JUNE 30, ANALYSIS OF OPERATING RESULTS FOR THE SIX-MONTH PERIOD ENDED JUNE 30, GEOGRAPHIC AND SEGMENT BREAKDOWN OF RESULTS OF CONTINUING OPERATIONS FOR SIX-MONTH PERIOD ENDED JUNE 30, 2013 AND REVIEW OF OPERATING SEGMENTS 21 CASH FLOWS 30 FINANCIAL POSITION 32 OUTLOOK AND DEVELOPMENT OBJECTIVES 34 FINANCIAL INSTRUMENTS 35 COMMITMENTS AND CONTINGENCIES 36 RISK FACTORS AND UNCERTAINTIES 36 CHANGE IN ACCOUNTING ESTIMATE 36 CHANGE IN ACCOUNTING POLICIES 37 FUTURE CHANGES IN ACCOUNTING POLICIES 37 INTERNAL CONTROLS AND PROCEDURES 37 SUBSEQUENT EVENT 38 1 BORALEX 2013 Interim Report 2
 in Canada, the Northeastern United States and France.")
4 Description of Business Boralex Inc. ( Boralex or the Corporation ) is a power producer whose core business is dedicated to the development and the operation of renewable energy power stations. Currently, the Corporation operates an asset base with a total installed capacity of nearly 500 megawatts ( MW ) in Canada, the Northeastern United States and France. Boralex is also committed under power development projects, both independently and with Canadian and European partners, to add 550 MW of power that will be put in service by the end of Nearly all of the Corporation's operating assets as well as all the sites under development benefit from long-term power sales contracts with fixed and indexed prices. With more than 200 employees, Boralex is known for its diversified expertise and in-depth experience in four power generation types. Boralex currently operates a 286 MW wind power portfolio in Canada and France. In recent years, Boralex has become one of the most experienced wind power producers in France, where it currently generates 196 MW of power with an additional 88 MW in total in projects. Boralex has also entered the wind power market in Canada with 90 MW of installed capacity in Ontario. In Québec, the Corporation is working independently or with partners on the development of wind farms with a total installed capacity of 440 MW, slated for commissioning by the end of These projects include the Seigneurie de Beaupré wind farms, which is currently one of Canada's largest wind farms under development. Phase 1 of this project with a total installed capacity of 272 MW will be commissioned at the end of Boralex has nearly two decades of expertise in hydroelectric power generation. The Corporation owns and operates 136 MW of hydro assets in the United States, Québec and British Columbia, where it will commission a new 22 MW power station in early Boralex owns two thermal power stations with a total installed capacity of 49 MW, comprising a 14 MW natural gas cogeneration power station in France and a 35 MW wood-residue power station in Québec. Boralex diversified its energy portfolio with the addition of a solar power facility with an installed capacity of 5 MW located in France. The following charts provide information about the makeup of the Corporation's energy portfolio as at June 30, 2013: TOTAL: 476 MW Boralex's shares, 35% of which are held by Cascades Inc. ( Cascades ), and convertible debentures are listed on the Toronto Stock Exchange under the ticker symbols BLX and BLX.DB, respectively. 2 BORALEX 2013 Interim Report 2
5 Introductory Comments to the Interim Management's Discussion and Analysis General This interim Management's Discussion and Analysis ( MD&A ) reviews the operating results for the three- and six-month periods ended June 30, 2013, compared with the corresponding periods of 2012, and the cash flows for the three- and six-month periods, 2013 compared with the corresponding periods of 2012, as well as the Corporation's financial position as at June 30, 2013 compared with December 31, This MD&A should be read in conjunction with the unaudited interim condensed consolidated financial statements and accompanying notes appearing in this interim report, as well as with the audited consolidated financial statements and accompanying notes appearing in the most recent Annual Report for the year ended December 31, Additional information about the Corporation, including the annual information form, previous annual reports, MD&As and audited consolidated financial statements, as well as press releases, is published separately and is available on the Boralex ( and SEDAR ( websites. In this MD&A, Boralex or the Corporation means, as applicable, either Boralex and its subsidiaries and divisions or Boralex or one of its subsidiaries or divisions. The information contained in this MD&A reflects all material events up to August 6, 2013, the date on which the Board of Directors approved the interim MD&A and the unaudited interim condensed consolidated financial statements. Unless otherwise indicated, the financial information presented in this MD&A, including tabular amounts, is prepared in accordance with International Financial Reporting Standards ( IFRS ) which, as of January 1, 2011, constitute Canadian generally accepted accounting principles ( GAAP ) under Part I of the CICA Handbook. The unaudited interim condensed consolidated financial statements included in this interim MD&A have been prepared according to IFRS applicable to the preparation of interim financial statements, IAS 34, Interim Financial Reporting, and contain comparative figures for This interim MD&A also contains information derived from non-ifrs measures, as discussed under Non-IFRS Measures. All financial information presented in this MD&A, as well as tabular information, is in Canadian dollars. Notice Concerning Forward-Looking Statements The purpose of this MD&A is to help the reader understand the nature and importance of changes and trends as well as the risks and uncertainties that may affect Boralex's operating results and financial position. Accordingly, some of the statements contained in this analysis, including those regarding future results and performance, are forward-looking statements based on current expectations, within the meaning of securities legislation. These statements are characterized by the use of positive or negative verbs, such as plan, anticipate, evaluate, estimate, believe and other related expressions. They are based on Boralex management's expectations, estimates and assumptions as at August 6, Boralex would like to point out that, by their very nature, forward-looking statements involve risks and uncertainties such that its results or the measures it adopts could differ materially from those indicated by or underlying these statements, or could have an impact on the degree of realization of a particular projection. The main factors that could lead to a material difference between the Corporation's actual results and the projections or expectations set forth in the forward-looking statements include, but are not limited to, the general impact of economic conditions, raw material price increases and availability, currency fluctuations, volatility in the selling price of electricity, the Corporation's financing capacity, negative changes in general market conditions and regulations affecting the industry, as well as other factors described in Outlook and Development Objectives and Risk Factors and Uncertainties in the Corporation's Annual Report for the year ended December 31, Unless otherwise specified by the Corporation, the forward-looking statements do not take into account the possible impact on its activities, transactions, non-recurring items or other exceptional items announced or occurring after the statements are made. There can be no assurance as to the materialization of the results, performance or achievements as expressed or implied by forward-looking statements. The reader is cautioned not to place undue reliance on such forward-looking statements. Unless required to do so under applicable securities legislation, Boralex management does not assume any obligation to update or revise forward-looking statements to reflect new information, future events or other changes. 3 BORALEX 2013 Interim Report 2

6 Growth Strategy and Key Developments in Recent Fiscal Years Over the past few years, Boralex has strived to lay the foundations of above-average, balanced and sustainable growth by pursuing its key goals of enhancing the value of its asset base, securing steady and predictable revenue and cash flow streams, and lowering its business risk exposures. As a result, the Corporation has made the following strategic choices: Target the acquisition and development of renewable energy assets covered by long-term indexed fixed-price power sales contracts; Prioritize renewable energy assets with above-average profit margins, particularly wind, hydroelectric and solar power; and Focus development initiatives on Canada and France. Key achievements under Boralex's growth and positioning strategy since fiscal 2009 are discussed below: The wind power segment expanded significantly with the installed capacity operated by Boralex increasing to 286 MW from 108 MW in December These operating assets located in France (196 MW) and Canada (90 MW) are fully covered by long-term power sales contracts. In addition, the Corporation is currently developing, independently or with partners, various wind power projects totalling 528 MW, comprising 88 MW in France and 440 MW in Canada, slated for commissioning from the end of fiscal 2013 to the end of fiscal Boralex's total net interest in all these projects, which are all covered by long-term power sales contracts, amounts to 334 MW. Backed by its significant financial resources, the Corporation is currently pursuing other acquisition targets consisting of wind power assets in operation and under development in Canada and France; All of the trust units of the Boralex Power Income Fund (the Fund ) were acquired in November 2010, increasing Boralex's energy portfolio by a fully contracted installed capacity of 190 MW (131 MW, excluding the Dolbeau power station sold in April 2012 and the Kingsey Falls thermal power station that discontinued operations on November 30, 2012), mainly comprising, at acquisition, nearly 100 MW in excellent hydroelectric assets; Boralex entered the solar power market in June 2011 with the commissioning of its first solar power station with an installed capacity of 5 MW located in Southwestern France. To-date, the facility has met management expectations with its contribution while allowing Boralex to develop expertise in this segment; and The relative weight of the thermal power segment and assets with non-contracted capacity in Boralex's energy portfolio was scaled back, mainly following the sale in December 2011 of U.S. wood-residue power stations with a total installed capacity of 186 MW, which were not covered by sales contacts and sold their electricity in the Northeastern United States open market. In line with Boralex's target positioning, the cash proceeds of approximately $81 million (net of taxes) from this sale were partly used to acquire operating assets and development projects in the wind and hydroelectric power segments. Also, in 2011 and 2012, two thermal power stations located in Québec discontinued their operations, namely the Dolbeau wood-residue power station and the Kingsey Falls natural gas power station, while in 2013, the Corporation disposed of a non-strategic business unit in the thermal power segment. Growth Path (1) Last 12 months (2) This data is consolidated in accordance with IFRS, except for the Seigneurie de Beaupré Phases I and II (owned at 50%) which are proportionally consolidated for projection purposes. Under IFRS, these projects are accounted for using the equity method. 4 BORALEX 2013 Interim Report 2
 In operation (2) Pro forma, including Boralex's net interest of 550 MW in development projects (3) Based on annual production in MWh As the above charts show, Boralex's strategic decisions made")
7 Impact of Recent Developments on the Makeup of Boralex's Energy Portfolio These charts show changes in all sites owned as at June 30, 2013 compared with the end of previous fiscal years. (1) In operation (2) Pro forma, including Boralex's net interest of 550 MW in development projects (3) Based on annual production in MWh As the above charts show, Boralex's strategic decisions made in recent fiscal years have substantially transformed and enhanced its positioning. Since the end of fiscal 2009, Boralex's long-term contracted portion of installed capacity in operation grew from 51% to 96%. If Boralex's net interest in projects under development is taken into account, this proportion increases to approximately 98%, ensuring higher and more predictable future profits and cash flows. From a segment perspective, these developments mainly resulted in a higher relative weight of the wind, hydroelectric and solar power segments, which generate higher profit margins than Boralex's thermal power segment. Together, the three segments now account for 90% of assets in operation, and will reach 94% in 2015 after the wind power sites and the hydroelectric power station currently under development are commissioned, without reflecting expansion projects that could be carried out by the Corporation in its target markets over the coming quarters and years. In contrast, the thermal power segment's share of Boralex's overall installed capacity fell from 57% in 2009 to 10%, and will be marginal in 2015, in accordance with the Corporation's decision to reduce the relative weight of its thermal power segment. One of the main benefits of this trend is that the Corporation's results will become more stable and predictable by reducing its exposure to fluctuations in the cost and potential scarcity of raw materials used in the thermal power stations, namely natural gas and wood residue. Developments over recent fiscal years have strengthened the Corporation's geographic positioning in Canada, where 37% of Boralex's installed capacity in operation is now located, compared with 10% in The United States and France account for 18% and 45%, respectively, of the Corporation's installed capacity in operation. Accordingly, Boralex now enjoys greater geographic balance in its revenue streams as well as reduced exposure to currency fluctuations. As indicated in the above chart, the Canadian market share should reach 54% with the commissioning of projects under development, which does not reflect, however, potential expansion transactions that the Corporation could complete in both France and Canada. 5 BORALEX 2013 Interim Report 2
8 Key Events Affecting Boralex's Results, Financial Position and Positioning in 2013 compared with 2012 Shutdown of Power Production at the Kingsey Falls Power Station (Québec, Canada) On November 30, 2012, the day its power sales contract with Hydro-Québec expired, the 31 MW natural gas cogeneration power station in Kingsey Falls, Québec shut down its power production operations. For fiscal 2013 as a whole, compared with fiscal 2012, the shutdown will give rise to a shortfall of approximately $10 million in thermal power segment EBITDA and Boralex's consolidated EBITDA, which management expects to be offset, however, by expansion in the wind power segment on a consolidated level, as discussed below. Acquisition of St-Patrick Wind Power Site (France) in 2012 and Commissioning of New Wind Power Sites in Canada and in France in 2013 On June 28, 2012, Boralex acquired St-Patrick wind farm located in France, a 34.5 MW facility already in operation. In 2013, the site will contribute to the Corporation's results for the entire year, compared with only six months in In addition, near the close of fiscal 2013, Boralex and its partners will commission wind power sites totalling 312 MW, namely two wind power sites in France, La Vallée (32 MW) and Vron (8 MW), as well as Phase I of the Seigneurie de Beaupré wind farm (272 MW) in Québec. Boralex's net interest in these new energy assets will be 176 MW. Although the new sites will make a contribution to 2013 results during a few months only, this expansion will have a significant impact on fourth quarter results, given particularly the scale of Phase I of the Seigneurie de Beaupré wind farm. As mentioned previously, the contribution of St-Patrick wind farm for the full year and the commissioning of new sites in the fourth quarter should offset the impact on fiscal 2013 results stemming from the shutdown of the Kingsey Falls thermal power station. Besides, this expansion of the wind power segment will deliver the added benefit of enhanced geographic diversification for Boralex, due particularly to its positioning in Québec, in addition to diversifying its technological expertise in operating a range of wind turbine types. New Production Sites Currently under Development in Canada and in France In addition to the wind power projects described previously, Boralex is currently investing, independently or with partners, in the development of other energy assets to be commissioned in 2014 and While these projects will not make a contribution to 2013 results, they will have an impact on cash flows and the Corporation's financial position during the current fiscal year. The projects are described below: In Canada: 22 MW Jamie Creek hydroelectric power station in British Columbia (2014); 68 MW Phase II of the Seigneurie de Beaupré wind farm in Québec (2014); 25 MW wind power project, Témiscouata I, developed in collaboration with the Regional County Municipality ( RCM ) of Témiscouata in Québec (2014); 25 MW wind power project developed in collaboration with the RCM of La Côte-de-Beaupré in Québec (2015); and 50 MW Témiscouata II wind power project in Québec (2015). In France: Fortel-Bonnières and St-François wind power projects with 24 MW, respectively (2014). Projects under development are described in greater detail in the sections of this MD&A describing the different operating segments. TO SUM UP, over the last few quarters, and more specifically since the beginning of fiscal 2013, financial returns from Boralex's development strategy were: - Growth of the Corporation's profit margin resulting from the increased share of more profitable sectors in its energy portfolio - wind and hydroelectric power - combined with sound performance by these sectors; - A stabilizing impact on results by these sectors, due to the geographic diversification of their assets; and - In spite of the scale of investments for the period, maintaining a solid cash position and reasonable debt through significant and steady fund inflows from operations. 6 BORALEX 2013 Interim Report 2
9 Seasonal Factors Three-month periods ended Twelve-month period ended (in thousands of dollars, except MWh, per share amounts and number of shares outstanding) September 30, 2012 December 31, 2012 March 31, 2013 June 30, 2013 June 30, 2013 POWER PRODUCTION (MWh) Wind power stations 110, , , , ,201 Hydroelectric power stations 86, , , , ,940 Thermal power stations 83,815 66,051 70,879 7, ,936 Solar power station 2, ,079 1,788 5,914 REVENUES FROM ENERGY SALES 282, , , ,894 1,509,991 Wind power stations 12,540 25,124 23,598 20,384 81,646 Hydroelectric power stations 7,456 13,860 14,113 15,691 51,120 Thermal power stations 12,173 12,654 12,546 3,268 40,641 Solar power station ,554 EBITDA 33,021 52,063 50,736 40, ,961 Wind power stations 9,563 21,363 19,875 15,569 66,370 Hydroelectric power stations 7,510 9,541 11,284 12,532 40,867 Thermal power stations 2,408 2,601 4,668 (1,070) 8,607 Solar power station ,182 20,251 33,829 36,209 27, ,026 Corporate and eliminations (4,025) (3,902) (2,956) (4,544) (15,427) NET EARNINGS (LOSS) ATTRIBUTABLE TO SHAREHOLDERS OF BORALEX 16,226 29,927 33,253 23, ,599 Continuing operations (8,167) 542 4,007 (1,685) (5,303) Discontinued operations ,045 NET EARNINGS (LOSS) PER SHARE (BASIC AND DILUTED) ATTRIBUTABLE TO SHAREHOLDERS OF BORALEX (7,601) 1,238 4,168 (1,063) (3,258) Continuing operations ($0.22) $0.01 $0.11 ($0.04) ($0.14) Discontinued operations $0.02 $0.02 $0.02 $0.06 CASH FLOWS FROM OPERATIONS ($0.20) $0.03 $0.11 ($0.02) ($0.08) In dollars* 6,870 14,118 22,954 17,775 61,717 Per share (basic)* $0.18 $0.37 $0.61 $0.47 $1.63 Weighted average number of shares outstanding (basic) 37,730,162 37,732,568 37,735,065 37,740,004 37,734,431 * As the scheduled payment date of the $8.3 million interest on the convertible debentures was on June 30, a Sunday, the payment was made on the following business day on July 2, BORALEX 2013 Interim Report 2
10 Three-month periods ended Twelve-month period ended (in thousands of dollars, except MWh, per share amounts and number of shares outstanding) September 30, 2011 December 31, 2011 March 31, 2012 June 30, 2012 June 30, 2012 POWER PRODUCTION (MWh) Wind power stations 94, , , , ,891 Hydroelectric power stations 148, , , , ,087 Thermal power stations 92, , ,323 41, ,952 Solar power station 1,942 1,017 1,329 1,940 6,228 REVENUES FROM ENERGY SALES 337, , , ,631 1,629,158 Wind power stations 11,328 22,461 20,647 16,345 70,781 Hydroelectric power stations 11,615 15,982 13,986 12,445 54,028 Thermal power stations 12,368 17,584 22,242 9,285 61,479 Solar power station ,758 EBITDA 36,198 56,492 57,451 38, ,046 Wind power stations 8,160 18,440 16,977 13,082 56,659 Hydroelectric power stations 8,513 11,386 10,644 9,056 39,599 Thermal power stations 2,928 4,100 8,395 1,154 16,577 Solar power station ,427 20,411 34,325 36,511 24, ,262 Corporate and eliminations (3,723) (4,024) (3,169) (5,155) (16,071) NET EARNINGS (LOSS) ATTRIBUTABLE TO SHAREHOLDERS OF BORALEX 16,688 30,301 33,342 18,860 99,191 Continuing operations (6,315) 3,536 4,826 (6,035) (3,988) Discontinued operations (893) 4,651 2, ,215 NET EARNINGS (LOSS) PER SHARE (BASIC) ATTRIBUTABLE TO SHAREHOLDERS (7,208) 8,187 7,149 (5,901) 2,227 Continuing operations ($0.17) $0.10 $0.13 ($0.16) ($0.10) Discontinued operations ($0.02) $0.12 $0.06 $0.16 NET EARNINGS (LOSS) PER SHARE (DILUTED) ATTRIBUTABLE TO SHAREHOLDERS ($0.19) $0.22 $0.19 ($0.16) $0.06 Continuing operations ($0.17) $0.10 $0.12 ($0.16) ($0.11) Discontinued operations ($0.02) $0.12 $0.06 $0.16 CASH FLOWS FROM OPERATIONS ($0.19) $0.22 $0.18 ($0.16) $0.05 In dollars 9,572 17,613 21,849 5,507 54,541 Per share (basic) $0.25 $0.47 $0.58 $0.15 $1.45 Weighted average number of shares outstanding (basic) 37,745,598 37,725,898 37,726,689 37,727,077 37,731,340 8 BORALEX 2013 Interim Report 2
11 The Corporation's operations and results are partly subject to seasonal cycles and other cyclical factors that vary by segment. Since nearly all of Boralex facilities have long-term indexed fixed-price power sales contracts, seasonal cycles mainly affect the total volume of power generated by the Corporation. Only four hydroelectric power stations in the United States, accounting for only 4% of the Corporation's total installed capacity in operation, are not covered by long-term sales contracts. Operating volumes at Boralex facilities are influenced by the following seasonal factors, depending on their specific power generation method. Wind For the 286 MW of Boralex's wind power assets currently in operation, wind conditions are usually more favourable in the winter, which falls during Boralex's first and fourth quarters, both in France and Canada. However, in winter there is a greater risk of lower production caused by weather conditions, such as icing. In general, management estimates that approximately 60% of annual production in its wind power segment is generated in the first and fourth quarters and 40% in the second and third quarters. Following the development projects completed since 2009 and described previously, the wind power segment is now Boralex's largest segment in terms of installed capacity, revenues, EBITDA and cash flows. The segment is expected to account for an increasing share of the Corporation's energy portfolio in the coming years as wind farms that Boralex is developing independently or with partners in Canada and in France are gradually commissioned. These facilities will total 528 MW, of which Boralex's net interest represents 334 MW. The commissioning of these facilities will increase the installed capacity of wind power assets in operation fully owned by Boralex to approximately 620 MW by the end of fiscal 2015, excluding potential acquisitions of other assets in operation or under development. In particular, this expansion will intensify the impact of the seasonality on this type of power generation on Boralex's overall performance, such that an increasing proportion of the Corporation's revenues will be generated in the first and fourth quarters. Hydroelectric For Boralex's hydroelectric assets totalling 136 MW, power output depends on water flow, which in Canada and the Northeastern U.S. tends to be at a maximum in spring and generally good in the fall, which are Boralex's second and fourth quarters. Historically, water flow tends to decrease in winter and summer. In general, management estimates that approximately 60% of annual production in its hydroelectric power segment is generated in the second and fourth quarters and 40% in the first and third quarters. Note that apart from four hydroelectric power stations whose water flow is regulated upstream yet not under the Corporation's control, Boralex's other hydroelectric facilities do not have reservoirs that would permit water flow regulation during the year. As previously discussed, four U.S. power stations are not covered by long-term power sales contracts. These facilities have an installed capacity of 21 MW, which currently accounts for 15% of the hydroelectric power segment's total installed capacity and 4% of Boralex's total installed capacity. Since these power stations sell their power on the open market in the State of New York, they are more vulnerable to seasonal fluctuations which, in addition to influencing power production volumes, also have an impact on selling prices obtained. They are partly influenced by seasonal demand, which is traditionally higher during winter and summer. Historically, power stations obtain generally higher average prices during these periods. Moreover, the price of natural gas, which is highly volatile, has a significant influence on electricity selling prices in the State of New York. Thermal Boralex owns and operates two thermal power stations for an aggregate 49 MW of installed capacity. Of the two, the Senneterre power station in Québec, Canada is fuelled by wood-residue and is covered by a Hydro-Québec power sales contract expiring in An agreement has been entered into with Hydro-Québec under which the Senneterre power station will produce power six months per year during 2012 and 2013, from December to March and in July and August. The Corporation is currently in discussion with Hydro-Québec to determine terms of operation of this power station for Boralex also operates a natural gas-fired power station located in Blendecques, France. Its sales contract with Électricité de France ( EDF ), a state corporation, expired on March 31, 2013, but was extended up to April 30, 2013 at EDF's request. The power station is expected to resume operations in November 2013, once the Corporation completes the process to enter into a new power sales contract. To that end, the Corporation filed an application with the French government for a power purchase obligation certificate and believes it is well placed to sign a new 12-year agreement in the next few months, with the final business terms of the agreement to be confirmed by the French government. Meanwhile, as in previous years, steam for the power station's industrial client will be produced using an auxiliary boiler during the period of suspension of the cogeneration operations, namely from May to November BORALEX 2013 Interim Report 2
12 Solar The Corporation's only solar power station (5 MW) currently in operation is located in Southwestern France. For this facility, which benefits from a long-term power sales contract, sunlight conditions are usually more favourable in the spring and summer, which fall during Boralex's second and third quarters. In view of these weather conditions, management estimates that approximately 65% of the annual production at its solar power station will be generated in the second and third quarters. TO SUM UP, although seasonal and other cyclical factors have a certain impact on Boralex's performance, this is mitigated by the fact that, following the main events in recent years, namely the significant expansion of the wind power segment, the acquisition of the Fund, the commissioning of a solar power station and the sale of our U.S. wood-residue power stations, nearly all of the Corporation's revenues are now generated by assets with indexed fixed-price sales contracts. The Corporation also capitalizes on solid diversification in its power generation sources and favourable geographic positioning. Furthermore, Boralex gives priority to sound capital management to ensure financial health and flexibility to effectively manage the seasonality of its business. These factors will contribute to strong, stable results for Boralex in the coming years. 10 BORALEX 2013 Interim Report 2
13 Financial Highlights Three-month periods Six-month periods (in thousands of dollars, except MWh, per share amounts and number of shares outstanding) POWER PRODUCTION (MWh) Wind power stations 166, , , ,241 Hydroelectric power stations 197, , , ,969 Thermal power stations 7,191 41,981 78, ,304 Solar power station 1,788 1,940 2,867 3,269 REVENUES FROM ENERGY SALES 373, , , ,783 Wind power stations 20,384 16,345 43,982 36,991 Hydroelectric power stations 15,691 12,445 29,804 26,431 Thermal power stations 3,268 9,285 15,814 31,528 Solar power station ,277 1,406 EBITDA 40,141 38,905 90,877 96,356 Wind power stations 15,569 13,082 35,444 30,059 Hydroelectric power stations 12,532 9,056 23,816 19,701 Thermal power stations (1,070) 1,154 3,598 9,549 Solar power station ,088 1,218 27,737 24,015 63,946 60,527 Corporate and eliminations (4,544) (5,155) (7,500) (8,323) NET EARNINGS (LOSS) ATTRIBUTABLE TO SHAREHOLDERS OF BORALEX 23,193 18,860 56,446 52,204 Continuing operations (1,685) (6,035) 2,322 (1,211) Discontinued operations ,459 NET EARNINGS (LOSS) PER SHARE (BASIC AND DILUTED) ATTRIBUTABLE TO SHAREHOLDERS OF BORALEX (1,063) (5,901) 3,105 1,248 Continuing operations ($0.04) ($0.16) $0.06 ($0.03) Discontinued operations $0.02 $0.02 $0.06 CASH FLOWS FROM OPERATIONS ($0.02) ($0.16) $0.08 $0.03 In dollars* 17,775 5,507 40,729 27,356 Per share (basic)* $0.47 $0.15 $1.08 $0.73 Weighted average number of shares outstanding (basic) 37,740,004 37,727,077 37,737,548 37,726,883 * As the scheduled payment date of the $8.3 million interest on the convertible debentures was on June 30, a Sunday, the payment was made on the following business day on July 2, 2013 Statement of Financial Position Data As at June 30, As at December 31, (in thousands of dollars) Total assets 1,298,918 1,229,871 Debt* 549, ,186 Convertible debentures 227, ,299 Total equity 377, ,369 * Including non-current debt and current portion of debt. 11 BORALEX 2013 Interim Report 2
14 Non-IFRS Measures In order to assess the performance of its assets and reporting segments, Boralex uses EBITDA, cash flows from operations, the ratio of net debt, adjusted EBITDA and adjusted net earnings (loss), as performance measures. Management believes that these measures are widely accepted financial indicators used by investors to assess the operational performance of a company and its ability to generate cash through operations. These non-ifrs measures are drawn primarily from the unaudited interim condensed consolidated financial statements, but do not have a standardized meaning under IFRS; accordingly, they may not be comparable to similarly named measures used by other companies. EBITDA Investors should not view EBITDA as an alternative measure to, for example, net earnings, or as a measure of operating results, which are IFRS measures. EBITDA is reconciled to the most comparable IFRS measure, namely, net earnings (loss) attributable to shareholders of Boralex, in the following table: Three-month periods Six-month periods (in thousands of dollars) Net earnings (loss) attributable to shareholders of Boralex (1,063) (5,901) 3,105 1,248 Net earnings from discontinued operations (622) (134) (783) (2,459) Non-controlling shareholders 42 (264) 472 (151) Income tax expense (recovery) (176) (1,723) 2, Net loss (gain) on financial instruments (876) 822 (673) 485 Foreign exchange loss (gain) (138) 10 (146) 131 Financing costs 12,595 12,096 25,019 24,199 Impairment of property, plant and equipment and intangible assets Other gains (48) (82) Amortization 13,213 13,954 26,714 27,890 EBITDA 23,193 18,860 56,446 52,204 Cash flows from operations Cash flows from operations are equal to net cash flows related to operating activities before change in non-cash items related to operating activities. Management uses this measure to assess cash flows generated by the Corporation's operations and its capacity to finance its expansion through those funds. In light of the seasonal nature of the Corporation's operations and development activities, changes in non-cash items can vary considerably. In addition, development activities result in significant changes in Trade and other payables during the construction period, as well as an initial injection of working capital at project start-up. Accordingly, the Corporation considers it more representative not to integrate changes in non-cash items in this performance measure. Investors should not consider cash flows from operations as an alternative measure to cash flows related to operating activities, which is an IFRS measure. Cash flows from operations are reconciled to the most comparable IFRS measure, namely, net cash flows related to operating activities, in the following table: Three-month periods Six-month periods (in thousands of dollars) Net cash flows related to operating activities 31,754 13,238 54,201 46,312 Change in non-cash items related to operating activities 13,979 7,731 13,472 18,956 CASH FLOWS FROM OPERATIONS* 17,775 5,507 40,729 27,356 *As the scheduled payment date of the $8.3 million interest on the convertible debentures was on June 30, a Sunday, the payment was made on the following business day on July 2, BORALEX 2013 Interim Report 2
15 Net Debt Ratio The Corporation defines net debt as follows: As at June 30, As at December 31, (in thousands of dollars) Non-current debt 444, ,616 Current portion of debt 104,548 98,570 Borrowing costs, net of accumulated amortization 9,099 7,263 Less: Cash and cash equivalents (122,214) (107,138) Restricted cash (6,107) (5,063) Net debt 430, ,248 The Corporation defines total book capitalization as follows: As at June 30, As at December 31, (in thousands of dollars) Total equity 377, ,369 Net debt 430, ,248 Convertible debentures 227, ,299 Convertible debenture issuance costs, net of accumulated amortization 3,862 4,164 Deferred taxes on convertible debentures 5,158 5,158 Imputed interest calculated on convertible debentures (6,578) (5,251) Total book capitalization 1,037, ,987 The Corporation computes the ratio of net debt as follows: As at June 30, As at December 31, (in thousands of dollars) Net debt 430, ,248 Total book capitalization 1,037, ,987 NET DEBT RATIO 41.4 % 42.1 % Adjusted EBITDA The following two tables reconcile wind segment and consolidated EBITDA as reported in the financial statements with adjusted EBITDA: Three-month periods Six-month periods (in thousands of dollars) EBITDA - Wind power segment 15,569 13,082 35,444 30,059 Specific item: Non-EBITDA items included in the Share in earnings (loss) of the Joint Venture ,029 (100) ADJUSTED EBITDA - WIND POWER SEGMENT 16,439 13,084 36,473 29,959 Three-month periods Six-month periods (in thousands of dollars) EBITDA - Consolidated 23,193 18,860 56,446 52,204 Specific items: Non-EBITDA items included in the Share in earnings (loss) of the Joint Venture ,029 (100) Professional fees incurred in connection with acquisitions in France and Canada ADJUSTED EBITDA - CONSOLIDATED 24,185 19,694 57,604 52, BORALEX 2013 Interim Report 2
16 Adjusted Net Earnings (Loss) The following table reconciles net earnings (loss) attributable to shareholders of Boralex as reported in the financial statements with adjusted net earnings (loss): Three-month periods Six-month periods (in thousands of dollars) Net earnings (loss) attributable to shareholders of Boralex (1,063) (5,901) 3,105 1,248 Net earnings from discontinued operations (622) (134) (783) (2,459) Specific items*: Impairment of property, plant and equipment and intangible assets Professional fees incurred in connection with acquisitions in France and Canada ADJUSTED NET EARNINGS (LOSS) - CONSOLIDATED (1,401) (5,478) 2,612 (162) * Net of income taxes Specific Items for the Three-Month Periods Ended June 30, 2013 and 2012 Adjusted EBITDA During the second quarter, 2013, two specifics items impacted Boralex's EBITDA, namely $0.9 million in items not related to EBITDA included in the Share in earnings (loss) of the Joint Venture (arising mainly from the Joint Venture's ineffective financial instruments) and $0.1 million in professional fees incurred in connection with the acquisition of two wind power projects in Canada (one in Ontario and one in British Columbia). During the same quarter of 2012, Boralex incurred $0.8 million in specific expenses consisting of professional fees arising from a series of acquisitions in France. These amounts gave rise to adjustments to EBITDA, as they do not represent operations inherent to power generation for Boralex. Adjusted Net Loss The following specific items impacted the Corporation's net earnings (loss) for the three-month period, 2013: A $0.6 million after-tax gain attributable to discontinued operations, consisting of the U.S. wood-residue power stations that Boralex sold to a third party in December Note that under the terms of the sales transaction, Boralex is entitled until the end of 2014 to receive 50% of sale proceeds from the renewable energy certificates (RECs) of said power stations in excess of a defined threshold; A $0.2 million after-tax impairment loss on the property, plant and equipment of a non-strategic unit in the thermal power segment, which was divested by Boralex. The purpose of the impairment charge was to bring the unit's book value in line with the sale price agreed to with the purchaser; and The aforementioned professional fees totalling an after-tax amount of $0.1 million. Accordingly, aggregate specific items for the second quarter of 2013 had a $0.3 million net favourable impact on net loss for the period. In the corresponding quarter, 2012, Boralex recorded various specific items which had a $0.4 million net unfavourable impact on net loss, including an after-tax amount of $0.6 million in professional fees and an after-tax gain of $0.1 million from the sale of RECs from discontinued operations. Specific Items for the Six-Month Periods Ended June 30, 2013 and 2012 Adjusted EBITDA For the six-month periods, 2013 and 2012, the specific items impacting EBITDA were the same as those in the three-month periods, more specifically, items not related to EBITDA included in the Share in earnings (loss) of the Joint Venture (favourable amount of $1.0 million in 2013 and an unfavourable amount of $0.1 million in 2012), and professional fees of $0.1 million in 2013 and $0.8 million in 2012 incurred in connection with various acquisitions. Adjusted Net Earnings (Loss) In reporting net earnings for the first six months of fiscal 2013, Boralex recorded a $0.8 million after-tax gain stemming from net earnings from discontinued operations, whose favourable effect was partially offset, however, by impairment losses on assets and the aforementioned professional fees, for a total after-tax amount of $0.3 million. During the same period in 2012, various specific items had a $1.4 million net favourable impact on net earnings (loss), including a $2.5 million after-tax net gain reflected through net earnings from discontinued operations stemming in large part from the sale of RECs produced by the power stations in 2011, but sold in the marketplace in the first quarter of 2012, which remained property of Boralex under the transaction. This gain was reduced by a $0.5 million after-tax impairment loss on various items of property, plant and equipment and intangible assets as well as by an after-tax total of $0.6 million in the aforementioned professional fees. 14 BORALEX 2013 Interim Report 2
17 Analysis of Operating Results for the Three-Month Period Ended June 30, 2013 The following table shows major changes in adjusted net loss from continuing operations attributable to shareholders of Boralex: Adjusted net loss (in thousands of dollars) Per share (in $, basic) THREE-MONTH PERIOD ENDED JUNE 30, 2012 (5,478) ($0.15) Change: Adjusted EBITDA 3,623 $0.10 Amortization 741 $0.02 Financing costs (499) ($0.01) Foreign exchange 148 Financial instruments 1,698 $0.05 Other gains 48 Income tax (1,376) ($0.04) Non-controlling shareholders (306) ($0.01) THREE-MONTH PERIOD ENDED JUNE 30, 2013 (1,401) ($0.04) For the three-month period, 2013, excluding specific items described in the previous section, Boralex reported an adjusted net loss of $1.4 million or $0.04 per share compared with an adjusted net loss of $5.5 million or $0.15 per share for the same quarter of the previous year. As is discussed in greater detail in this section, this improvement of $4.1 million or $0.11 per share resulted from the following: A $3.6 million increase in adjusted EBITDA driven by recent expansion and the wind power segment's good showing overall, as well as by improved results in the hydroelectric power segment; A $1.8 million favourable change in net gains and losses on financial instruments and foreign exchange gains and losses; and A $0.7 million decline in amortization expense. In the aggregate, these items readily offset the increase in financial costs and the unfavourable change in income taxes. The following table shows major changes in revenues from energy sales and adjusted EBITDA: (in thousands of dollars) Revenues from energy sales Adjusted EBITDA THREE-MONTH PERIOD ENDED JUNE 30, ,905 19,694 Power station commissioned* 2,906 2,563 Shutdown of the Kingsey Falls thermal power station (6,556) (1,555) Pricing Volume 3,848 3,316 Translation of self-sustaining subsidiaries (exchange rate effect) Maintenance (812) Development - prospecting 324 Other 6 (118) THREE-MONTH PERIOD ENDED JUNE 30, ,141 24,185 * Addition of St-Patrick wind farm acquired on June 28, 2012 Revenues from Energy Sales For the quarter, 2013, Boralex reported revenues from energy sales totalling $40.1 million compared with $38.9 million for the same period in The shutdown of the Kingsey Falls power station in November 2012 generated an impact of $6.6 million, partly offset by the additional $2.9 million contributed by St-Patrick wind farm acquired on June 28, Excluding these two units, Boralex's existing power stations generated revenues totalling $37.2 million, up $4.9 million or 15.2% from $32.3 million for the same period of the previous year. This growth was fuelled primarily by a $3.8 million favourable volume effect stemming in large part from the hydroelectric segment, with further contributions from the wind and thermal power segments. In addition, higher average selling prices in the wind and hydroelectric power segments had a $0.6 million favourable effect on consolidated revenues. There was a $0.5 million favourable change in consolidated revenues as a result of foreign exchange rate fluctuations, owing more specifically to the appreciation of the euro against the Canadian dollar. In total, Boralex generated 373,894 MWh of electricity in the second quarter of 2013, up 9.4% from 341,631 MWh for the same period of Excluding the Kingsey Falls power station, quarterly output was up 24.0% due to the addition of St-Patrick power station coupled with a 16.2% rise in production by existing assets. 15 BORALEX 2013 Interim Report 2
18 Other Income Other income, consisting mainly of management fees, totalled $0.4 million in the second quarter of 2013 compared with $0.2 million in the same period of the previous year. Adjusted EBITDA and Adjusted EBITDA Margin Consolidated adjusted EBITDA for the second quarter of 2013 amounted to $24.2 million, up $4.5 million or 22.8% year over year. Excluding the $1.6 million impact attributable to the Kingsey Falls power station, quarterly adjusted EBITDA grew $6.0 million or 33.1% due to the following favourable items: A $2.6 million additional contribution from the new St-Patrick wind farm; A $3.3 million favourable volume effect; The aforementioned $0.6 million favourable price effect; A $0.3 million decrease in development and prospecting costs; and A $0.2 million favourable foreign exchange effect. Together, these items readily offset the $0.8 million increase in maintenance costs originating primarily from the French wind farms and the Senneterre thermal power station, as well as the $0.1 million total net unfavourable change in miscellaneous items. Adjusted EBITDA margin as a percentage of revenues for the second quarter of 2013 improved significantly to 60.3% from 50.6% for the same period of The upward trend in our profit margin reflects the higher weight of the wind and hydroelectric power segments in Boralex's energy portfolio and consolidated revenues, due to the combined effect of the acquisition of St-Patrick power station, the favourable overall performance of the wind and hydroelectric power segments and the shutdown of the Kingsey Falls thermal power station. Amortization and Impairment of Property, Plant and Equipment and Intangible Assets Amortization expense for the second quarter of 2013 fell $0.7 million year over year to $13.2 million. The impact of adding St-Patrick wind farm was offset by the shutdown of the Kingsey Fall thermal power station and by certain other favourable items, including the extension of the useful life of certain components in the wind power segment and the change in the amortization of the boiler at the Blendecques, France thermal power station due to the renewal of its power sales contract with EDF. As discussed in Specific Items for the Three-Month Periods Ended June 30, 2013 and 2012, we recall that in the second quarter of 2013, Boralex recorded a $0.3 million pre-tax impairment loss on property, plant and equipment and intangible assets of a non-strategic unit that was sold. Financing Costs, Foreign Exchange Loss (Gain) and Net Loss (Gain) on Financial Instruments Financial costs for the second quarter of 2013 climbed $0.5 million to $12.6 million, owing primarily to the acquisition of St-Patrick wind farm and the appreciation in the euro. However, those items were partially mitigated by the decrease in other liabilities contracted in France and the debt related to the Thames River wind power site in Canada. Boralex recorded a $0.1 million foreign exchange gain and a $0.9 million net gain on financial instruments in the second quarter of 2013, representing a total favourable change of $1.8 million compared with the same period of the previous year. Note that Net loss (gain) on financial instruments consists mainly of the ineffective portion of financial instruments. Although all of the financial instruments used by Boralex are highly effective, they always include a very small ineffective portion. Adjusted Net Loss Attributable to Shareholders of Boralex Excluding the specific items in the two comparative periods, Boralex reported an adjusted net loss for the three-month period ended June 30, 2013 of $1.4 million or $0.04 per share (basic and diluted), compared with an adjusted net loss of $5.5 million or $0.15 per share (basic and adjusted) for the same quarter of the previous year. TO SUM UP, once again, the results for the second quarter confirm the benefits of Boralex's expansion strategy centered on developing its two promising segments - wind and hydroelectric power - as well as the geographical diversification of its operations. Building on the momentum from previous quarters, these strategic directions have driven a significant increase in consolidated adjusted EBITDA margin, in addition to allowing the wind and hydroelectric power segments to maintain favourable performance, despite changing climate conditions experienced in their various markets. 16 BORALEX 2013 Interim Report 2
19 Analysis of Operating Results for the Six-Month Period Ended June 30, 2013 The following table shows major changes in adjusted net earnings (loss) from continuing operations attributable to shareholders of Boralex: Adjusted net earnings (loss) (in thousands of dollars) Per share (in $, basic) SIX-MONTH PERIOD ENDED JUNE 30, 2012 (162) Change: Adjusted EBITDA 3,539 $0.09 Amortization 1,176 $0.03 Financing costs (820) ($0.02) Foreign exchange 277 $0.01 Financial instruments 1,158 $0.03 Other gains 82 Income tax (2,089) ($0.06) Non-controlling shareholders (549) ($0.01) SIX-MONTH PERIOD ENDED JUNE 30, ,612 $0.07 For the six-month period, 2013, excluding specific items, Boralex reported a $2.8 million year-over-year improvement in net adjusted earnings, which totalled $2.6 million or $0.07 per share. The main drivers of this growth, discussed in greater detail below, were the same as those that drove performance in the second quarter. The following table shows major changes in revenues from energy sales and adjusted EBITDA: (in thousands of dollars) Revenues from energy sales Adjusted EBITDA SIX-MONTH PERIOD ENDED JUNE 30, ,356 52,936 Power station commissioned* 5,779 4,958 Shutdown of Kingsey Falls thermal power station (17,271) (6,410) Pricing 1,413 1,413 Volume 3,057 2,303 Capacity premiums Translation of self-sustaining subsidiaries (exchange rate effect) Raw material costs (156) Maintenance (263) Development - prospecting (78) Other (128) 1,622 SIX-MONTH PERIOD ENDED JUNE 30, ,877 57,604 * Addition of St-Patrick wind farm acquired on June 28, 2012 Revenues from Energy Sales For the six-month period, 2013, Boralex reported revenues from energy sales totalling $90.9 million compared with $96.4 million for the same period in This decline resulted from the shutdown of the Kingsey Falls power station which has generated a $17.3 million impact year to date, including nearly $11 million in the first quarter. However, this event was largely offset by the $5.8 million contribution of St-Patrick wind farm coupled with a $6.0 million or 7.6% increase in revenues from the other Boralex power stations to $85.1 million from $79.1 million for the same period last year. Growth in revenues from existing power stations was fuelled by a $3.1 million favourable volume effect, a $1.4 million favourable price effect, a $0.9 million increase in capacity premiums and a $0.8 million favourable foreign exchange effect, owing primarily to the fluctuation of the euro relative to the Canadian dollar. Boralex generated a total of 785,353 MWh of electricity in the first half of 2013 compared with 796,783 MWh in Excluding the Kingsey Falls power station, output for the first six months of 2013 grew 12.5% due to the addition of St-Patrick power station, as well to a 5.7% increase in output at existing power stations. 17 BORALEX 2013 Interim Report 2
20 Other Income Other income, consisting mainly of management fees, totalled $0.8 million in the first half of 2013 compared with $0.3 million in the previous year. Adjusted EBITDA and Adjusted EBITDA Margin Consolidated adjusted EBITDA for the first six months of fiscal 2013 amounted to $57.6 million, up $4.7 million or 8.8% from the same period of Excluding the $6.4 million impact attributable to the Kingsey Falls power station, year-to-date EBITDA for power stations currently in operation rose $11.1 million or 23.8% due to the following favourable items: An additional contribution of $5.0 million from St-Patrick wind farm; A $2.3 million favourable volume effect originating primarily in the hydroelectric and wind power segments, combined with a $0.9 million increase in capacity premiums; A $1.4 million favourable price effect; A $0.4 million favourable foreign exchange effect; and A $1.6 million favourable change in other items, consisting primarily of a $1.6 million reversal of a provision in the first quarter to reflect an amendment to the employee bonus plan. The above favourable items readily offset the increases in maintenance costs, raw material costs, and development and prospecting costs of $0.4 million, $0.2 million and $0.1 million, respectively. Year-to-date EBITDA margin as a percentage of revenues rose to 63.4% in 2013 from 55.0% in Amortization and Impairment of Property, Plant and Equipment and Intangible Assets Amortization expense for the first half of 2013 fell $1.2 million to $26.7 million compared with the same period of 2012, as the impact of the addition of St-Patrick wind farm was offset by the shutdown of the Kingsey Falls thermal power station and the other favourable items discussed in the section on second-quarter results. As discussed in Specific Items in the Six-Month Periods Ended June 30, 2013 and 2012, Boralex recorded a $0.3 million pre-tax impairment loss on property, plant and equipment in the second quarter of 2013, compared with a $0.8 million pre-tax impairment loss on various items of property, plant and equipment and intangible assets recorded in the first quarter of Financing Costs, Foreign Exchange Loss (Gain) and Net Loss (Gain) on Financial Instruments Year-to-date financing costs rose by $0.8 million to $25.0 million due to the impact of the acquisition of St-Patrick wind power site, partly offset by the decrease in the other liabilities contracted in France and the debt related to the Thames River wind power site in Canada. Boralex recorded a $0.1 million foreign exchange gain and a $0.7 million net gain on financial instruments in the first half of 2013, representing a total favourable change of $1.4 million compared with the foreign exchange loss and net loss on financial instruments recognized in the same period a year earlier. Adjusted Net Earnings (Loss) Attributable to Shareholders of Boralex Excluding the specific items in the two comparative periods, Boralex reported adjusted net earnings for the six-month period ended June 30, 2013 totalling $2.6 million or $0.07 per share, compared with an adjusted net loss of $0.2 million or nil per share for the same period of the previous year. TO SUM UP, despite the shortfall resulting from the closure of the Kingsey Falls power station, Boralex grew its adjusted EBITDA and EBITDA margin thanks to strong growth in the wind power segment and a good showing by the hydroelectric power segment. In light of year-to-date results and projects in advanced stages of development, management continues to expect that for fiscal 2013 as a whole, the shortfall resulting from the shutdown of the Kingsey Falls power station will be more than offset by expansion in the wind power segment, including the commissioning of new sites totalling 312 MW in the fourth quarter, in which Boralex's net share will amount to 176 MW. Building on the momentum from previous quarters, this trend will enhance the positive outcomes of Boralex's strategic positioning in terms of profit margins, cash flows and geographic diversification. 18 BORALEX 2013 Interim Report 2
21 Geographic and Segment Breakdown of Results of Continuing Operations for the Six-Month Period Ended June 30, 2013 and 2012 Segment Breakdown The following is a discussion of changes in segment breakdown of revenues and EBITDA for the six-month period, 2013 compared with the same period of Wind For the first six months of 2013, revenues in the wind power segment grew 18.9% compared with the same period of 2012, boosting its share of consolidated revenues to 48.4% from 38.4% one year ago. Growth in this segment's weight was driven, on one hand, by the addition of the new St-Patrick site coupled with revenue growth at existing power stations, and on the other, by the shutdown of the Kingsey Falls thermal power station on November 30, In the wind power segment, year-to-date EBITDA rose 17.6%, accounting for 55.4% of consolidated EBITDA (before the corporate segment and eliminations) compared with 49.8% for the first half of 2012, thereby confirming the segment's position as Boralex's largest source of EBITDA. The segment's EBITDA margin exceeded the average of Boralex's aggregate assets, amounting to approximately 80.5% for the first half of 2013 (83.1% excluding the Share in loss of the Joint Venture), compared with 81.4% one year ago. With Boralex's net share of wind power projects under development set to add nearly 334 MW to its total net contracted capacity, the segment's top contribution to operating profitability stands to grow as of the end of 2013, enhancing the Corporation's average profit margin. Hydroelectric For the first six months of 2013, revenues in the hydroelectric segment were up 12.9% from the same period of 2012, boosting its share of consolidated revenues to 32.8% from 27.4% for the first half of Apart from revenue growth, the cause of the hydroelectric power segment's higher relative weight from a consolidated revenue standpoint was the thermal power segment's decline in weight owing to the closure of the Kingsey Falls power station. Year-to-date hydroelectric power segment EBITDA rose 20.8% to account for 37.2% of consolidated EBITDA (before the corporate segment and eliminations) compared with 32.6% of consolidated EBITDA for first half of As a percentage of revenues, segment EBITDA margin for the first half of 2013 rose to 79.9% from 74.6% for the same period of Thermal The thermal power segment accounted for 17.4% of consolidated revenues for the six-month period, 2013, compared with 32.7% for the corresponding period of 2012, due to the shutdown of the Kingsey Falls power station. For the same reason, this segment's year-to-date share of consolidated EBITDA (before the corporate segment and eliminations) stood at 5.6% compared with 15.7% for the first half of the previous year. EBITDA margin for the first half of 2013 fell to 22.8% from 30.2% for the 2012 period. 19 BORALEX 2013 Interim Report 2

22 Solar Boralex's only solar power site generated EBITDA of $1.1 million on revenues of $1.3 million for the first half of 2013, representing an EBITDA margin of 84.6%. In the same period of 2012, EBITDA and revenues totalled $1.2 million and $1.4 million, respectively, with a margin of 85.7%. This slight change resulted from a normal decline in the rate of irradiation. The solar power segment, which currently accounts for only a marginal share of Boralex's energy portfolio, generated 1.4% of revenues and 1.7% of consolidated EBITDA (before the corporate segment and eliminations) in the first six months of Geographic Breakdown Geographically, Boralex's revenues from energy sales for the six-month period, 2013 were broken down as follows: 39.5% in Canada compared with 52.4% in the 2012 period; 19.6% in the United States compared with 15.4% in the 2012 period; and 40.9% in France compared with 32.2% in the 2012 period. The decrease in the Canadian assets' relative share of revenues resulted primarily from the shutdown of the Kingsey Falls power station, and the higher relative weight of the European market following the addition of St-Patrick wind farm. The increase in the share of revenues from the United States reflected the significant revenue growth reported by the U.S. hydroelectric power stations in the second quarter, as well as the decrease in the relative weight of the thermal power segment. 20 BORALEX 2013 Interim Report 2
23 Review of Operating Segments Wind Power Stations The following table shows major changes in revenues from energy sales and adjusted EBITDA: (in thousands of dollars) Three-month periods ended Revenues from energy sales Adjusted EBITDA Revenues from energy sales Six-month periods ended Adjusted EBITDA JUNE 30, ,345 13,084 36,991 29,959 Power station commissioned* 2,906 2,563 5,779 4,958 Pricing Volume Translation of self-sustaining subsidiaries (exchange rate effect) Maintenance (426) (434) Other (25) 138 (100) 796 JUNE 30, ,384 16,439 43,982 36,473 * Addition of St-Patrick wind farm acquired on June 28, 2012 The results for the second quarter and first six months of 2013 not only reaffirm the wind power segment's traditional role as a significant growth and profitability driver for Boralex but also highlight the benefits of its geographic diversification in France and Canada. Operating Results for the Three-Month Period The wind power segment reported respective increases for the second quarter, 2013 of 20.3%, 24.7% and 25.6% in production, revenues and adjusted EBITDA compared with the same period of These results arose primarily from the acquisition of operating St-Patrick wind farm on June 28, 2012, as well as from the favourable performance of existing power stations, particularly the Thames River facility in Canada. Quarterly power production totalled 166,992 MWh compared with 138,836 MWh for the second quarter of 2012, due to the addition of St-Patrick power station with an installed capacity of 34.5 MW, coupled with a 3.2% increase in production at existing power stations. In Canada, production was up 16.3% due to better wind conditions than in the same quarter a year earlier and maintaining very high equipment availability. In France, production grew 22.5% with the addition of St-Patrick power station, whose contribution continues to meet management's expectations. However, despite maintaining satisfactory availability rates, the Corporation reported a slight easing in quarterly production at the other French wind power stations, down by an aggregate 4.3% year over year, owing to less favourable wind conditions than in spring Wind power segment revenues for the second quarter of 2013 totalled $20.4 million, compared with $16.3 million for the same period a year earlier. This growth of $4.1 million or 25.2% was attributable to the $2.9 million contribution from St-Patrick power station and a $1.1 million or 6.9% rise in revenues generated by existing power stations. Canadian wind farms stepped up their revenue contribution by 17.1% primarily through production increases. In France, wind power facilities reported revenue growth of 30.0% due to the addition of St-Patrick power station. Revenues generated by existing wind farms in France held steady from the same quarter of the previous year. Adjusted EBITDA for the second quarter amounted to $16.4 million, up $3.3 million or 25.6% from $13.1 million for the same period last year. As shown in the previous table, this growth was driven in large part by the $2.6 million contribution from the new St-Patrick power station, as well as favourable changes in production, selling prices and foreign exchange rates. Conversely, maintenance costs increased by $0.4 million. Adjusted EBITDA margin stood at 80.6%, compared with 80.0% for the second quarter of EBITDA at power stations in France was up 31.3%, including St-Patrick wind farm, but fell 3.7% excluding the latter, under the combined effect of lower production and higher maintenance costs. However, these items were largely offset by the rise in their average selling price, the non-recurrence of certain expenses incurred in 2012 and the favourable foreign exchange effect. In Canada, EBITDA growth for the quarter stood at 18.5% considering only wind farms in operation, owing primarily to higher production. 21 BORALEX 2013 Interim Report 2
24 Operating Results for the Six-Month Period For the six months, 2013, the wind power segment reported growth rates of 15.0% for production, 18.9% for revenues and 21.7% for adjusted EBITDA compared with the same six-month period of 2012, while adjusted EBITDA margin increased from 81.0% to 82.9%. Power production increased to 358,020 MWh from 311,241 MWh for the previous year, primarily due to the addition of St-Patrick site while the power output from all the existing sites was stable. Electricity production at sites in France (excluding St-Patrick site) declined 3.2% due to more severe icing conditions in the first quarter of 2013 followed by less favourable wind conditions in the second quarter, compared with the previous year. The Canadian sites recorded a 4.0% increase in their output for the first six months of 2013 with good wind conditions in the second quarter more than offsetting the less favourable conditions in the first quarter. Climatic variations in the different regions over the previous quarters resulted in stable overall performance for the wind power segment, demonstrating the benefits of geographic diversification. Cumulative wind power revenues increased to $44.0 million from $37.0 million for the previous year. This $7.0 million increase is attributable to the $5.8 million contribution from St-Patrick site combined with a 3.3% growth in combined revenues from existing facilities. Revenues grew 5.1% in Canada, driven primarily by the volume effect. In France, revenues increased by 31.1%, including St-Patrick site, while revenues from existing facilities grew 1.7%, mainly as a result of higher average selling prices and exchange rate fluctuations. Adjusted EBITDA for the first six months of 2013 increased by $6.5 million or 21.7% to $36.5 million from $30.1 million for the previous year. Besides the $5.0 million contribution from St-Patrick site, this performance stemmed from improved profitability of existing sites, in both Canada and France, where EBITDA rose by 5.9% and 4.5%, respectively, driven by the same principal factors discussed in the comments on second quarter results. Development Projects and Recent Events As of the date of this MD&A, Boralex had entered into long-term power sales contracts, independently or with partners, for wind power projects totalling 528 MW, consisting of 440 MW in Québec, Canada and 88 MW in France. Boralex's net share of all projects totals 334 MW, comprising 246 MW in Canada and 88 MW in France. The Canadian projects are slated for commissioning between the fourth quarter of 2013 and the fourth quarter of 2015 and include one of the largest wind farm currently under development in Canada and the largest project undertaken by Boralex, namely Phase I of the Seigneurie de Beaupré wind farms totalling 272 MW (net share of 136 MW for Boralex). The four projects currently being developed by Boralex in France are slated for commissioning between fall 2013 and the end of Wind power projects under development in Canada are described below. 1. In 2011, Boralex and its partner Gaz Métro Limited Partnership set up an equally owned joint venture, the Seigneurie de Beaupré 2 and 3 wind farms General Partnership ( the Joint Venture ) to build and operate Phase 1 of the Seigneurie de Beaupré wind farms with an installed capacity of 272 MW. Boralex management is pleased that construction of this large-scale wind farm, currently involving more than 500 workers, is within budget and schedule, and that work will be completed in fall A road network of over 110 km has been built and most of the 126 towers have been erected. In July 2013, a crucial stage was reached when, after a number of years of planning and efforts, the Seigneurie de Beaupré transformer substation, one of the largest of its kind in Canada, was completed and connected to Hydro-Québec's distribution grid. Note that, despite a general strike in Québec's construction industry lasting five days in June, the Corporation kept to the initial schedule of commissioning planned in December The expertise and skills acquired by Boralex's team in the commissioning and operation of the Thames River wind power site in Ontario are invaluable to the successful commissioning of the Seigneurie de Beaupré sites. Note that the Joint Venture has financing available in the amount of $725 million, comprising a two-year construction loan of $590 million, which will be converted into a term loan amortized over 18 years after the start of commercial operations, together with short-term facilities totalling $135 million. In November 2011, the Joint Venture also entered into interest rate swap transactions to set a significant portion of the financing rate for its Seigneurie de Beaupré wind power project. These financial instruments have interest rates ranging from 3.18% to 3.22%. 2. Boralex and its partner Gaz Métro Limited Partnership are also working together to implement a second phase of the Seigneurie de Beaupré site with a 68 MW capacity, scheduled for commissioning in December In May 2013, the partners formed another joint venture, the Seigneurie de Beaupré 4 wind farm General Partnership, with an ownership interest of 50% for Boralex, to continue the construction activities and subsequently to operate Phase II. Accordingly, as of the third quarter of fiscal 2013, Boralex's share in the development costs related to this project will be recognized in the investment account Interests in Joint Ventures, similarly to Boralex's interest in the Joint Venture, instead of under Development Projects in Boralex's statement of financial position. In January 2013, this 68 MW project was authorized by the Ministère du Développement durable, de l'environnement, de la Faune et des Parcs and work began in May The financing of the debt portion should be finalized by the end of summer Apart from the site's significant advantages regarding wind and environmental conditions and existing infrastructure, the future wind farm will enjoy a performance boost from logistical synergies to be achieved during its construction and subsequent operation. 22 BORALEX 2013 Interim Report 2

25 3. In June 2011, two community wind farm projects developed jointly by Boralex and the Québec RCMs of Témiscouata and La Côte-de-Beaupré secured 20-year power sales contracts with Hydro-Québec. These wind farms, with a capacity of 25 MW each, are to be commissioned late in 2014 and in 2015, respectively. The environmental approval process for the Témiscouata project is already underway while the process for the Corporation's La Côte-de-Beaupré project will start by the end of On March 27, 2012, during the first quarter of fiscal 2012, Boralex signed a 20-year power supply contract with Hydro-Québec for a 50 MW wind farm project. The project is expected to be commissioned in late 2015 and will be developed in the Témiscouata RCM on a site adjacent to the above-mentioned community wind farm project. The environmental approval process started at the end of the second quarter of In France, Boralex currently has four wind power sites under development totalling 88 MW: 1. The 32 MW La Vallée wind power project in the department of Indre, France, acquired in November 2012, will be commissioned in fall 2013 and includes 16 Gamesa G90 wind turbines rated at 2 MW each. Opting for this technology will allow Boralex to expand its wind turbine operating expertise to different models. All of the power generated will be sold to EDF under 15-year contracts. The long-term financing for the project was completed with a French banking consortium in two tranches in January and April In addition, to reduce its exposure to rate movements, the Corporation has entered into interest rate financial swaps covering 100% of the loan payable. 2. On June 28, 2012, Boralex acquired three fully authorized wind farm projects from InnoVent SAS ( InnoVent ) with a total capacity of 56 MW: Vron, an 8 MW site to be commissioned in fall 2013, as well as Fortel-Bonnières and St-François, two sites totalling 48 MW to be commissioned in Given that these projects are located in Northern France, these new sites, for which EDF has a long-term purchase obligation, will further strengthen Boralex's geographic diversification in all the main regions of France. The construction of Vron is near completion and and financing has been finalized. For the Fortel-Bonnières and St-François sites, Boralex has already selected its wind turbine supplier and signed the maintenance contract. Construction is underway and the Corporation is currently negotiating a financing arrangement that should be finalized in the third quarter of Lastly, Boralex has entered into a five-year agreement with InnoVent to secure options to acquire 130 MW in additional wind farm projects currently under development by InnoVent. The following table shows Boralex's wind power projects currently under development together with the percentage of Boralex's ownership interest in each project. Outlook For fiscal 2013, notwithstanding the potential impact of external factors such as currency fluctuations and weather conditions, wind power segment performance will benefit in particular from the contribution for the full year compared with six months in 2012 of St-Patrick site, whose performance since acquisition has met initial expectations. Wind power segment performance will also benefit from the partial contribution of new sites to be commissioned in Québec and France by the end of 2013, in particular the 272 MW Phase I of Seigneurie de Beaupré whose contribution will be considerable given its large scale. Lastly, segment performance will continue to be supported by unrelenting efforts to optimize wind turbine availability and performance, leveraging in particular the team's expertise in preventive and corrective maintenance and remote management of wind turbines. Boralex's wind power segment will remain its key growth driver over the longer term. Over and above its 334 MW share of the contracted capacity now under development in Canada and France (see accompanying table), Boralex currently has the financial resources to fund the equity portion of wind power projects totalling approximately 100 MW of additional capacity. Boralex's objective is to double its installed capacity and EBITDA by the end of The Corporation will continue seeking opportunities to acquire new wind power projects in Canada and Europe, including operational sites and projects in advanced stages of development with potential for near-term commissioning. 23 BORALEX 2013 Interim Report 2
26 Canada Québec is the second largest wind power producer among the Canadian provinces, after Ontario, with more than 1,700 MW of installed capacity, accounting for more than 26% of total installed capacity in Canada. On May 10, 2013, the Québec government announced its commitment to continue developing the province's wind power potential by attributing 800 MW in new projects, mainly projects to be launched by local communities in partnership with private investors, similarly to certain projects currently under development by Boralex and its partners. Boralex believes it is well positioned to benefit from this initiative, especially since the Corporation and its partners have exclusive development rights to the high-potential Seigneurie de Beaupré site on which facilities with additional capacity of nearly 500 MW could be installed in the short term. Témiscouata is another favourable area for developing wind power projects. Following the success of its first facility in Ontario where it has been operating the 90 MW Thames River facility since 2009, Boralex intends to strengthen its presence in this large market with attractive development opportunities. The Corporation is currently negotiating an acquisition in Ontario and expects to complete it in the near future. Boralex also expects to close another acquisition soon in British Columbia, another target market for the expansion of its wind power segment in Canada. France In Europe, Boralex will continue to focus primarily on the French market, due in particular to the solid market share and credibility that Boralex has built in that market over the past decade. Moreover, France's new government has reiterated the country's commitment to increase the share of renewable energy in French national power output to 20% by That said, management would like to draw attention to a potential risk regarding the continuity of the current rate for purchasing electricity from onshore wind power facilities in France. As it was set by ministerial decree in 2008, EDF has been obliged since then to buy power generated by onshore wind power operators at a set rate. In spring 2012, following administrative proceedings instituted by opponents of wind power, the French Council of State held that, although the tariff was not unreasonable under French law, the tariff decree may have violated European law, as it constituted government assistance non-disclosed to the European Commission, and reserved its decision by referring the matter to the European Court of Justice. This instance is expected to rule that the said tariff decree constituted in fact non-disclosed government assistance under the established procedure. Under the circumstances, France's Ministry of Ecology and Energy is preparing to undertake necessary measures to issue a new decree, whose terms may or may not differ from the previous rate. If a new decree is issued, Boralex management is of the opinion that the difference in rates would not be significant. Although this situation creates some uncertainty that could incite banks to delay their investments in new wind power projects, Boralex is confident about the outcome of this issue, given in particular, the commitment of the French government to develop EDF's wind power business. The French government has also urged EDF to accelerate the process of entering into wind power sales contracts, which follow the signing of a connection agreement. Boralex's management considers the wind power segment's medium- and long-term outlook to be highly favourable, due to: Its strong balance sheet; The scope and quality of its projects with long-term power sales contracts currently under development; The Corporation's highly skilled, multidisciplinary and entrepreneurial team that is constantly on the lookout for the best development opportunities; Solid alliances forged in Europe and North America to accelerate its development; and Boralex's growing reputation in world financial markets as a credible, highly efficient developer and operator of increasingly large-scale wind power facilities. 24 BORALEX 2013 Interim Report 2
27 Hydroelectric Power Stations The following table shows major changes in revenues from energy sales and EBITDA: (in thousands of dollars) Three-month periods ended Revenues from energy sales EBITDA Revenues from energy sales Six-month periods ended EBITDA JUNE 30, ,445 9,056 26,431 19,701 Pricing ,237 1,237 Volume 2,826 2,826 1,875 1,875 Capacity premiums Translation of self-sustaining subsidiaries (exchange rate effect) Maintenance costs Other (42) 50 (37) 159 JUNE 30, ,691 12,532 29,804 23,816 The following table shows recent and historical statistical data concerning hydroelectric power segment production: (1) HYDROELECTRIC PRODUCTION (MWh) Three-month periods : Actual 197, ,874 Historical average (1) 188, ,631 Six-month periods : Actual 346, ,969 Historical average (1) 342, ,283 Annual historical average (1) 623, ,297 The historical average is calculated using all production data available for each power station up to the end of Boralex's previous fiscal year. Historical averages include all of Boralex's power stations currently in operation. The results of the second quarter and first six months of fiscal 2013 underscore the hydroelectric segment's traditional role as a significant and reliable generator of profits for Boralex and highlight the contribution of its geographic positioning to performance stability. Operating Results for the Three-Month Period The hydroelectric segment reported growth in production, revenues and EBITDA of 24.6%, 26.1% and 38.4%, respectively, for the second quarter of fiscal 2013 while EBITDA margin improved to 79.9% in 2013 from 72.8% in This good performance stems primarily from improved productivity in U.S. power stations following much better water flow conditions than in Second quarter production totalled 197,923 MWh, up 24.6% from the same quarter in 2012 and 5.0% higher than the historical average recorded by the hydroelectric segment for this period of the year. The strong growth over 2012 stemmed primarily from U.S. power stations. In addition to exceeding their historical average of 5.1%, the production of these power station surged 43.5% over the previous year mainly as a result of untypically low water flow conditions in the Northeastern United States in spring 2012 for that period of the year. Production at Canadian power station was 2.2% higher than in the previous year, beating the historical average by 4.9%. Hydroelectric segment revenues for the second quarter of 2013 amounted to $15.7 million compared with $12.4 million for the same period of Revenues of Canadian power stations grew 4.2%, driven by the combined effect of higher output and selling price indexation. U.S. power stations increased their revenues by 46.1%, driven mainly by the volume effect and higher capacity premiums. Moreover, U.S. power station revenues were bolstered by the favourable impact of the U.S. dollar's strengthening against the Canadian currency and above all, an increase in the average electricity selling prices obtained in the Northeastern United States open market by the four U.S. power stations not covered by power sales contracts. EBITDA amounted to $12.5 million compared with $9.1 million for the previous year. The $3.4 million increase stemmed primarily from the 59.5% growth in EBITDA at U.S. power stations. EBITDA at Canadian facilities rose 14.4%. These results were driven by the same factors underlying revenue growth combined with decreases in maintenance costs and certain other expenses at Canadian power stations. Operating Results for the Six-Month Period The hydroelectric segment reported growth in production, revenues and EBITDA of 7.6%, 12.8% and 20.9%, respectively, for the first six months of fiscal 2013 while EBITDA margin improved to 79.9% in 2013 from 74.5% in While the Canadian power stations maintained their performance throughout the period, good water flow conditions at U.S. power stations in the second quarter largely offset less favourable conditions that reduced production in the first quarter. 25 BORALEX 2013 Interim Report 2
28 Accordingly, hydroelectric segment production totalled 346,396 MWh for the first six months of 2013, up 7.6% from 321,969 MWh for the same period in 2012, but was only 1.1% higher than the historical average for the first half year. Production at Canadian power stations was 1.5% higher than in the previous year, beating the historical average by 9.6%. Although 11.3% higher than in 2012, output at U.S. power stations was 3.1% below the historical average owing to low water flow conditions in the first quarter and production shutdowns caused by mechanical failures at the two power stations during the same quarter. Cumulative revenues amounted to $29.8 million compared with $26.4 million in 2012 and were up 3.8% in Canada as a result of selling price indexation and slightly higher production. Cumulative revenues grew 19.7% in the United States, stemming primarily from a volume effect of $1.7 million, a favourable price effect of $1.0 million resulting from a sharp rise in average electricity selling price on the New York State market, and to a lesser extent, higher capacity premiums and a favourable foreign exchange effect. The same factors, combined with decreases in maintenance costs and certain other expenses, bolstered hydroelectric segment EBITDA by $4.1 million to $23.8 million for the first six months of 2013, from $19.7 million in All power stations contributed to this performance although EBITDA growth was stronger in the United States for the reasons previously mentioned. Projects under Development and Outlook Boralex is currently developing a 22 MW run-of-river hydroelectric power station project, namely the Jamie Creek power station near Gold Bridge in British Colombia, Canada. Construction of this power station started in fall 2012 with a view to commercial commissioning in 2014, and financing was completed in August Jamie Creek is expected to generate approximately 70,000 MWh of power annually and is covered by a 40-year power purchase agreement with BC Hydro that also contains a 20-year renewal option for the Corporation. By the end of 2016, Boralex will have completed the work required at the Buckingham power station in Québec, Canada to comply with the Dam Safety Act. Concurrently with this work, management is still reviewing various investment scenarios aimed at expanding the power station's current installed capacity by up to 10 MW. Boralex is currently reviewing various acquisition opportunities to grow its hydroelectric segment, particularly in Ontario and British Colombia. With over twenty years' experience in hydroelectric power, a skilled team and high-quality assets, Boralex believes it is poised to make further inroads into the hydroelectric market. The Corporation has a large hydroelectric power base with good geographic distribution, attractive profit margins, and steady and predictable cash flows. This balanced profile softens the impact on segment results of weather or economic conditions, including fluctuations in open market selling prices in the United States, and U.S. and Canadian dollar exchange rate movements. Given the quality of our assets and the ongoing maintenance program underway at all Boralex hydroelectric power stations, there is no indication that production will not be in line with historical averages. In addition, the Canadian power stations will continue benefitting from indexation under power sales contracts, as well as from capacity premiums, throughout the initial contract term. 26 BORALEX 2013 Interim Report 2
29 Thermal Power Stations The following table shows major changes in revenues from energy sales and EBITDA: (in thousands of dollars) Three-month periods ended Revenues from energy sales EBITDA Revenues from energy sales Six-month periods ended EBITDA JUNE 30, ,285 1,154 31,528 9,549 Shutdown of Kingsey Falls power station (6,556) (1,555) (17,271) (6,458) Pricing (42) (42) (497) (497) Volume 504 (28) 1, Translation of self-sustaining subsidiaries (exchange rate effect) 87 (1) Capacity premiums (13) (13) Raw material costs 10 (156) Maintenance (490) (300) Development - prospecting Other 3 (217) JUNE 30, ,268 (1,070) 15,814 3,598 The main development in this segment during the three- and six-month periods, 2013 was the impact of the shutdown of the Kingsey Falls natural gas cogeneration power station in Québec on November 30, 2012 when its power sales contract expired. This impact resulted in revenue shortfalls of $6.6 million and $17.3 million, respectively, for the second quarter and the six-month period. The impact on EBITDA was $1.6 million and $6.5 million, respectively, for the three- and six-month periods, Operating Results for the Three-Month Period The thermal power segment generated 7,191 MWh of electricity in the second quarter of 2013 compared with 1,812 MWh for the same quarter of the previous year (excluding the Kingsey Falls power station). The Senneterre wood-residue power station in Québec was shut down during the two comparative periods pursuant to the agreement entered into with Hydro-Québec under which the power station will produce power only from December to March and in July and August during fiscal 2012 and The Blendecques natural gas power station in France operated its cogeneration equipment only five months per year, from November to March, between 2005 and 2012, given the ceiling price stipulated in its initial power sales contract with EDF. As a result, this power station was shut down during the entire second quarter of fiscal However, in 2013, following a new agreement with EDF, the power station stopped generating power only at the end of April. The change in electricity production for the thermal power segment in the second quarter resulted from this additional month. As the Blendecques power station continues to supply steam to its industrial client using an auxiliary boiler when the cogeneration equipment is shut down, steam production showed little change between the second quarters of 2012 and Excluding the Kingsey Falls power station from the 2012 results, thermal power segment revenues for the quarter grew $0.5 million to $3.3 million, as a result of the additional output generated by the Blendecques power station in April 2013, combined with the $0.1 million favourable impact of the euro's strengthening against the Canadian dollar. The segment reported negative EBITDA of $1.1 million compared with negative EBITDA of $0.4 million in the same quarter of 2012 (again excluding the Kingsey Falls power station). This $0.7 million unfavourable change stemmed from increases in maintenance costs and other expenses at the Senneterre power station. The Blendecques power station improved its performance slightly following a decrease in certain costs. Operating Results for the Six-Month Period For fiscal 2013 to date, excluding the Kingsey Falls power station, the thermal power segment has stepped up its electricity production by 26.1% to 78,070 MWh from 61,915 MWh last year. This growth was driven mostly by significantly improved productivity at the Senneterre power station during the first quarter relative to the previous year, due in particular to higher raw material availability and quality, resulting in improved equipment efficiency and fewer stoppages. The Blendecques power station also reported higher production, with the additional month of operations in the second quarter more than offsetting the slight decline in electricity production in the first quarter. Its steam production was stable compared with the previous year. Thermal power segment revenues for the first six months of 2013 rose by $1.6 million or 10.9% to $15.8 million from $14.3 million for the same period in 2012 (excluding the Kingsey Falls power station), driven essentially by the Senneterre power station whose revenues grew $1.4 million due to increases in production volume and capacity premiums. Revenues at the Blendecques power station rose slightly, stemming mostly from the $0.7 million favourable impact of the euro's strengthening, although the change in revenues was affected by the sharp fall in the average steam selling price. 27 BORALEX 2013 Interim Report 2
30 Last, the segment generated cumulative EBITDA of $3.6 million, up $0.5 million from $3.1 million in 2012 (excluding Kingsey Falls), owing to the Senneterre power station's solid performance in the first quarter. In addition to the favourable volume effect and higher capacity premiums, this power station benefited from lower raw material costs arising partly from a better combustion rate. The Blendecques power station reported a $0.4 million decline in EBITDA as a result of lower steam prices combined with substantially higher raw material costs following the renewal of its supply contract under less favourable terms than previously. These unfavourable items were however partially offset by the favourable foreign exchange impact and decreases in, or the non-recurrence of, certain costs incurred by this power station in Outlook Since 2011, Boralex has considerably reduced the relative weight of the thermal power segment in its energy portfolio. While thermal power is not a preferred development target under Boralex's growth strategy, the Corporation is still open to business opportunities that may arise in the sector, provided the assets are covered by long-term power sales and raw material supply contracts, and meet Boralex's market position and performance objectives. In particular, as discussed below, Boralex is planning significant investments to upgrade the Blendecques power station and extend its useful life. Canada For fiscal 2013 as a whole, the shutdown of cogeneration operations at the Kingsey Falls power station will give rise to a shortfall of approximately $10 million in thermal power segment EBITDA and Boralex's consolidated EBITDA, which management expects to be offset, however, by expansion in the wind power segment on a consolidated level. This will lead in particular to further reductions in the thermal power segment's contribution to the Corporation's overall results. In fiscal 2013, under the agreement entered into with Hydro-Québec, the Senneterre power station will produce electricity during six months only, as in Profitability at this facility should be at least comparable to 2012 levels, given the safeguard provisions in the agreement. The Corporation is currently in discussions with Hydro-Québec concerning the operating arrangements for fiscal 2014 and thereafter. France In recent months, given that the power sales contract covering the Blendecques facility expired in March 2013, Boralex has been in talks with EDF to enter into a new power sales contract under terms and conditions allowing the Corporation to modernize its cogeneration power station while meeting its performance requirements. This investment is required to secure a 12-year power purchase agreement with a binding purchase rate. The project, which has secured the support from the power station's industrial steam client, would require an investment of about 6 million. Boralex's management feels that efforts to secure a new agreement are proceeding positively and, as a result, is hopeful it will reach a favourable outcome that would make it possible to significantly extend the power station's useful life while enhancing efficiency. Notwithstanding the above, the Corporation will be able to continue operating the power station for a period of at least one year as from November 1, 2013 under an agreement with EDF. 28 BORALEX 2013 Interim Report 2
31 Solar Power Station The following table shows major changes in revenues from energy sales and EBITDA: (in thousands of dollars) Three-month periods ended Revenues from energy sales EBITDA Six-month periods ended Revenues from energy sales EBITDA JUNE 30, ,406 1,218 Pricing Volume (67) (67) (177) (177) Translation of self-sustaining subsidiaries (exchange rate effect) Maintenance (4) (6) Other (1) 22 (1) 8 JUNE 30, ,277 1,088 Operating Results for the Three-Month Period The Avignonet-Lauragais solar power station, in Southwestern France, generated 1,788 MWh in the second quarter of 2013 compared with 1,940 MWh in the same quarter of This decrease in production resulted from a decline of approximately 9% in average irradiation between the two comparative periods. The unfavourable volume effect on the power station's quarterly revenues and EBITDA was partially offset however by a favourable foreign exchange effect and selling price indexation. Quarterly revenues and EBITDA amounted to $0.8 million and $0.7 million, respectively, for a profit margin of 88.5%. Operating Results for the Six-Month Period For the six months, 2013, the solar power station generated 2,867 MWh, compared with 3,269 MWh for the same period of 2012, due to a decline of approximately 9% in average irradiation, which was offset however by increased solar panel performance. This drop in production output had a $0.2 million unfavourable effect on cumulative revenues and EBITDA, which amounted to $1.3 million and $1.1 million, respectively, for a profit margin of 85.2%. Note that a gradual decline in solar equipment productivity is a normal phenomenon in the life cycle of this type of production facility. Since the mid-june 2011 commissioning, productivity and profitability at Boralex's first solar power station have met management's expectations. While the facility's contribution to the Corporation's consolidated results remains marginal, Boralex's management believes its satisfactory performance to be a reflection of the intrinsic quality of this first solar project with regard to choice of technology, location and contractual benefits, as well as growing expertise within the Boralex team. Outlook Broadly speaking, Boralex expects its solar power station to generate an average of approximately 5,000 MWh of electricity for the first ten years, with an average EBITDA margin expected to range from 80% to 85% over the period. Solar power is a growth industry with market rules and government directions to be worked out in the years to come. Boralex believes this clean and abundant source of renewable energy has great potential, particularly as performance is gradually improved through technological breakthroughs, thereby lowering the cost of equipment. In addition to the European market, more specifically France, where Boralex has built a skilled solar project development team, the Corporation takes a keen interest in Ontario, which could offer great potential for Boralex's first Canadian foray in this niche market. 29 BORALEX 2013 Interim Report 2
32 Cash Flows Three-month periods Six-month periods (in thousands of dollars) Net cash flows related to operating activities 31,754 13,238 54,201 46,312 Net cash flows related to investing activities (48,514) (32,100) (58,646) (35,635) Net cash flows related to financing activities 19,665 15,473 15,488 3,409 Cash related to discontinued operations 968 (1,232) 1,066 (5,479) Translation adjustment on cash and cash equivalents 2, ,967 (196) NET CHANGE IN CASH AND CASH EQUIVALENTS 6,477 (4,303) 15,076 8,411 CASH AND CASH EQUIVALENTS - END OF THE PERIOD 122, , , ,114 Operating Activities During the first six months of fiscal 2013, Boralex reported $40.7 million or $1.08 per share in cash flows from operations compared with $27.4 million or $0.73 per share for the same period of Excluding non-cash items from net earnings (loss) for both comparative periods, the $13.4 million increase in cash flows from operations resulted primarily from the increase in EBITDA, interest payments of $8.3 million on convertible debentures made in July rather than June 30, 2013 and the $1.0 million decrease in taxes paid. The change in non-cash items related to operating activities freed up an additional $13.5 million in cash (compared with $19.0 million for 2012). The cash inflow in 2013 resulted in large part from a $15.4 million decrease in Trade and other receivables, owing primarily to the Corporation's seasonal business cycle and the sale of shares of Resolute Forest Products valued at $3.0 million as at December 31, Operating activities generated cash flows totalling $54.2 million for the first half of fiscal 2013, compared with $46.3 million for the same period of the previous year. Investing Activities Fiscal 2013 year-to-date investing activities required cash outflows of $58.6 million, detailed as follows: $48.7 million for various acquisitions of new items of property, plant and equipment, including approximately $32.3 million in furtherance of wind power projects in France, more specifically the Corporation's La Vallée and Vron wind farms slated to enter into production shortly, and $12.5 million for the construction of the Jamie Creek hydroelectric power station in British Columbia. The balance of investments, amounting to approximately $3.9 million, was devoted to maintenance and asset improvements in the various operating segments and the corporate segment; A total of $8.9 million invested in various development projects, primarily in the wind power segment in Canada, including $6.6 million in furtherance of wind power projects in Québec, $1.5 million in furtherance of a wind power project in Ontario and $0.8 million for a wind power project in British Columbia; and An injection of $1.0 million into restricted cash in connection with various wind power projects in France, mainly the Corporation's La Vallée wind farm. Financing Activities During the first six months of fiscal 2013, financing activities generated total net cash inflows of $15.5 million. The Corporation contracted $29.1 million in new non-current debt, primarily to finance its La Vallée wind power project in France. Conversely, the Corporation repaid $14.0 million on existing non-current debt in France and Canada. Moreover, on June 27, 2013, Boralex closed US$90 million in long-term financing secured by two of its U.S. power stations. In addition to repaying the former debt of US$70.7 million encumbering those assets, this non-recourse financing will allow the Corporation to set aside the necessary reserves and free up certain funds to support its development. The US$90 million loan will bear interest at an annual rate of 3.51% and will be fully amortized by semi-annual payments over a 12-year period. Funds will be drawn on the maturity date of the current debt, that is, September 3, 2013, subject to certain customary conditions. Discontinued Operations For the six-month period, 2013, discontinued operations generated $1.1 million in cash inflows compared with cash outflows of $5.5 million for the same period in Net Change in Cash and Cash Equivalents Total cash movements for the first six months of fiscal 2013 resulted in a $15.1 million increase in cash and cash equivalents to $122.2 million as at June 30, 2013 compared with $107.1 million as at December 31, BORALEX 2013 Interim Report 2
33 TO SUM UP, cash flows for the first six months of the current fiscal year highlight the gradual expansion in Boralex's capacity to generate cash flows from operations, owing to its tight focus on operations covered by power sales contracts with fixed and indexed pricing which generate superior profit margins. Furthermore, they reflect the use, in line with management's commitment, of the Corporation's significant financial resources to develop its two strategic segments - wind and hydroelectric power - in which the Corporation has invested over $55 million year to date. Boralex will commission a contracted installed capacity in which its net interest will total an additional 176 MW by late 2013, 117 MW in 2014 and 63 MW in 2015, not including the other projects recently added and those in the pipeline for future quarters. 31 BORALEX 2013 Interim Report 2
34 Financial Position The following table shows condensed information from the Consolidated Statements of Financial Position: As at June 30, As at December 31, (in thousands of dollars) ASSETS Cash and cash equivalents 122, ,138 Restricted cash 6,107 5,063 Other current assets 39,716 55,139 CURRENT ASSETS 168, ,340 Property, plant and equipment 733, ,024 Other intangible assets 262, ,115 Miscellaneous non-current assets 134, ,392 NON-CURRENT ASSETS 1,130,881 1,062,531 TOTAL ASSETS 1,298,918 1,229,871 LIABILITIES CURRENT LIABILITIES 180, ,764 Non-current debt 444, ,616 Other non-current liabilities 296, ,122 NON-CURRENT LIABILITIES 741, ,738 TOTAL LIABILITIES 921, ,502 EQUITY TOTAL EQUITY 377, ,369 TOTAL LIABILITIES AND EQUITY 1,298,918 1,229,871 Summary of Significant Changes Apart from the exchange rate effect and Boralex's normal seasonal business cycle, the changes in the Corporation's financial position from December 31, 2012 to June 30, 2013 mainly reflect the investments and financing arrangements tied to ongoing development of its wind and hydroelectric power projects. Assets Boralex's total assets rose $69.0 million or 5.6% during the first six months of 2013 to $1,298.9 million as at June 30, 2013 from $1,229.9 million as at December 31, The increase resulted primarily from non-current assets, given that total current assets remained relatively unchanged from the past fiscal year-end. In particular, investments aimed at expanding the Corporation's operational base boosted the value of property, plant and equipment and intangible assets by $45.0 million and $9.0 million, respectively (net of amortization for the period). Working Capital As at June 30, 2013, Boralex reported a temporary working capital deficit of $12.1 million with a ratio of 0.93:1 compared with a working capital deficit of $5.4 million and a ratio of 0.97:1 as at December 31, This resulted from classifying the $74.8 million U.S. note maturing on September 3, 2013 under Current portion of debt, which, as discussed in the previous section, will be refinanced on that date by the new US$90 million long-term debt contracted on June 27, Excluding this $74,8 million note from Current portion of debt, the Corporation would have reported a working capital surplus of $62.6 million as at June 30, 2013 with a ratio of 1.59:1. Total Debt and Equity The Corporation's total debt, consisting of non-current debt, the current portion of non-current debt and the liability component of convertible debentures, rose to $777.1 million as at June 30, 2013 from $748.5 million as at December 31, 2012, primarily as a result of debt contracted to finance the Corporation's La Vallée wind power project, net of repayments made during the period on its existing debt. Geographically, as at June 30, 2013, 47% of the Corporation's non-current debt was in France, 14% in the United States and 39% in Canada, compared with 44%, 14% and 42%, respectively, as at December 31, Net debt, as defined under Non-IFRS Measures, amounted to $430.0 million as at June 30, 2013 compared with $417.2 million as at December 31, Between those two dates, total equity grew $34.8 million to $377.2 million from $342.4 million. As a result, the net debt ratio, as defined under Non-IFRS Measures, has improved since the end of the past fiscal year, falling to 41.4% as at June 30, 2013 from 42.1% as at December 31, BORALEX 2013 Interim Report 2
35 Information about the Corporation's Equity Instruments As at June 30, 2013, Boralex's capital stock consisted of 37,747,134 issued and outstanding Class A shares (37,734,895 as at December 31, 2012) and stock options outstanding numbered 2,102,969, of which 1,609,395 were exercisable. During the first six months of fiscal 2013, 4,512 shares were issued in connection with the conversion of 564 debentures and 7,727 shares were issued on exercise of stock options held by an officer. As at June 30, 2013, Boralex had 2,446,923 issued and outstanding convertible debentures (2,447,487 as at December 31, 2012). From July 1, 2013 to August 6, 2013, no new shares were issued on exercise of stock options and 592 new shares were issued in connection with the conversion of 74 debentures. Related Party Transactions The Corporation has entered into a management agreement with an entity controlled by Bernard Lemaire, a director of Cascades, an entity exercising significant influence over the Corporation, and his family. For the six-month period, 2013, revenues derived from the agreement amounted to $0.3 million ($0.3 million for the corresponding period of 2012). The Corporation has entered into a four-year consulting agreement with Bernard Lemaire, a director of Cascades, an entity exercising significant influence over the Corporation. The agreement amounts to $0.1 million per year and began in May Cascades provides the Corporation with various IT, engineering, transportation, maintenance and building repair services. For the six-month period, 2013, these services amounted to $0.6 million ($0.5 million for the corresponding period of 2012). Transactions with the Joint Venture During the six-month period, 2013, the Corporation's Share in loss of the Joint Venture amounted to $1.1 million. The interest rate swaps entered into by the Joint Venture fully hedge the interest rate risk arising from the hedged debt. However, the theoretical application of the IFRS for purposes of measuring ineffectiveness can sometimes produce unexpected even counter-intuitive results, in particular, when integrating counterparty credit risk. Under IFRS, any ineffective portion of financial instruments is to be recognized in earnings (loss). The $2.2 million loss for the six-month period, 2013 reported in the financial statements of the Joint Venture (Boralex's share amounted to $1.1 million) resulted from the recognition of a $1.7 million expense for an ineffective financial instrument. It is important to note that as the ineffective financial instrument had a notional amount of $551.7 million, the $1.7 million amount represents a loss of only 0.3%. TO SUM UP, despite substantial investments during the first six months of fiscal 2013, Boralex ended the period with a higher cash position than six months earlier as well as slightly lower total net debt. These positive trends are concrete benefits of the strategy in place at Boralex since 2009 aimed at supporting significant and steady cash flows from operations, which in turn, are conducive to maintaining a solid cash position and sound capital structure. 33 BORALEX 2013 Interim Report 2
36 Outlook and Development Objectives Outlook For fiscal 2013, Boralex's management expects to maintain strong operating profitability due to the full-year contribution of St-Patrick wind power station, compared with six months in 2012, and the commercial commissioning, by late 2013, of new energy assets in which Boralex's net share will total 176 MW. This expansion is expected to readily offset the shortfall created by the electricity production shutdown at the Kingsey Falls thermal power station since November It will deliver the added benefit of enhanced geographic diversification for Boralex due in particular to its implementation in Québec and all regions of France, in addition to diversifying its technological skill-sets pertaining to the operation of a range of wind turbine types. Above all, fiscal 2013 will be a year of transition into superior growth and profitability. In 2014, the Corporation will benefit from the full contribution of assets commissioned in 2013, in particular Phase I of the Seigneurie de Beaupré wind farms, in addition to commissioning other projects in Québec and France in which Boralex's net share will total 117 MW. Fiscal 2015 will mark the commissioning of other projects currently under development by the Corporation, representing the net addition of 63 MW to Boralex's wholly owned assets. To support execution of its various development projects, Boralex has a solid statement of financial position, including a cash position of $128.3 million as at June 30, In light of the expertise it has demonstrated for many years in the development, financing, construction, commissioning and profitable operation of increasingly large-scale energy assets, Boralex is confident it will be able to successfully complete all of its projects currently under development. With projects totalling about 100 MW in the Corporation's pipeline and the commissioning of sites under development, Boralex will be poised to double the size of its operations and EBITDA by the end of 2016 without new capital subscriptions, or in other words, without diluting the interests of current shareholders. Development Objectives and Competitive Strengths While keeping a close eye on international developments in green and renewal energy production, Boralex will continue seeking acquisition projects, mainly in Canada and France. The Corporation is primarily targeting projects in advanced stages of development or assets already in operation, provided they are all covered by long-term power sales contracts, to secure steady and predictable cash flows. More specifically, its expansion targets are as follows: The wind power segment, primarily in Québec, Ontario, British Columbia and France; The hydroelectric segment in Québec and British Columbia; and The solar power segment in Ontario and France. Boralex believes its solid presence in those markets is conducive to further expansion and that current business conditions are ripe for further strategic growth through acquisitions, especially in light of the financing options available and the quality and attractive pricing of wind turbines available on the market. As well, the currently sluggish state of the global economy continues to prompt energy asset developers and operators to carve out assets for sale. Boralex intends to continue focusing on just such opportunities. Boralex believes it commands a strong competitive edge to continue seizing existing market opportunities in terms of asset quality and available development projects, in line with its strategy. The Corporation's main strengths reside in its robust finances, its growing capacity to generate cash from operations and its targeted development approach, as well as a solid multidisciplinary team and its entrepreneurial culture. They provide for agile, well-orchestrated business acquisitions as opportunities arise as well as competent execution of increasingly large-scale projects while meeting budgets, deadlines and financial performance targets. To support its growth projects and maintain current and future operational endeavors, Boralex will continue to strengthen its business model by: Maintaining comprehensive in-house expertise in developing and operating renewable energy production assets, supported by leading-edge management tools; A disciplined and targeted development approach based on meeting financial performance targets in step with the risks inherent in each project; and Assuring sound capital management and retaining sufficient financial flexibility to seize potential growth opportunities and ensure uninterrupted access to capital markets. TO SUM UP, Boralex has set a target of doubling the size of its operational base and its EBITDA by the end of 2016, without diluting the interest of current shareholders. In the short, mid and long terms, the Corporation intends to continue set itself apart as one of the scant few Canadian and global producers devoted entirely to developing and operating renewable energies, particularly by its capacity to achieve high operational and earnings growth. To meet its growth goals, Boralex will remain a solid and innovative company, driven by clear objectives with rigorous attention to meeting target returns and guided by a long-term vision setting out its sources of production, its target markets and its approach to project development. 34 BORALEX 2013 Interim Report 2
37 Financial Instruments Foreign Exchange Risk Generally, as regards operating cash flows generated by foreign subsidiaries, the Corporation is not significantly exposed to currency fluctuations, as its subsidiaries are self-sustaining foreign operations and typically keep liquid assets in their country of origin to pursue their development. However, the Corporation does not anticipate any short-term capital expenditures to expand its U.S. asset base. In light of the foregoing and due to excess cash generated by its U.S. subsidiaries, the Corporation is currently studying a number of medium-term hedging strategies and intends to implement the selected strategy over the next few quarters. In connection with Canadian project development, certain future expenditures may be in foreign currencies. Where applicable, the Corporation's objective is to protect its anticipated return on equity by purchasing hedging instruments to eliminate volatility in expected expenditures and, in turn, stabilize significant costs such as turbines. Price Risk In the Northeastern United States, a portion of the Corporation's power production is sold at market prices or under short-term contracts and is accordingly subject to fluctuations in electricity prices. Electricity prices vary according to supply, demand and certain external factors, including weather conditions, and the price from other sources of power. As a result, prices may fall too low for the power stations to yield an operating profit. As at June 30, 2013, our power stations in France and Canada, as well as those in Middle Falls, Hudson Falls and South Glens Falls, have long-term power sales contracts, the vast majority of which are subject to partial or full indexation clauses tied to inflation. Consequently, only 4% of Boralex's installed capacity is exposed to price risk. Interest Rate Risk As at June 30, 2013, approximately 44% of non-current debt issued bears interest at variable rates. A sharp increase in interest rates in the future could affect the liquid assets available for the Corporation's development projects. However, since the Corporation uses interest rate swaps, its exposure to interest rate fluctuations is reduced to only 4% of total debt. As at June 30, 2013, the nominal balance of these swaps stood at $363.7 million ( million and $125.0 million) while their unfavourable fair value was $37.6 million ( 14.3 million and $18.0 million). The non-current debt and interest rate swaps do not include those reported in the Joint Venture's financial statements in which Boralex has a share of 50%. The Corporation does not plan to sell these instruments, since they were entered into to reduce the Corporation's risk related to interest rate fluctuations, and fully intends to make every reasonable effort to protect the anticipated return on those projects. As a result, the fact that fair value is unfavourable only indicates that forward interest rates have fallen and has no bearing on the effectiveness of the instrument as part of the Corporation's risk management strategy. All of these contracts qualify for hedge accounting. 35 BORALEX 2013 Interim Report 2
38 Commitments and Contingencies All commitments and contingencies are discussed in Boralex's annual MD&A for the fiscal year ended December 31, However during the six-month period, 2013, the Corporation concluded the following new commitments : Maintenance Contracts (a) For two of the wind power projects under development in France with a 48 MW capacity acquired at the time of the June 28, 2012 business combination, Fortel-Bonnières and St-François, the Corporation has entered into maintenance contracts with General Electric. The contracts have an initial term of five years and require net additional commitments of 3.9 million ($5.3 million) payable as from the commercial commissioning of sites slated for 2014, contingent on the closing of project financing by the third quarter of 2013, in respect of which a letter of intent has already been signed. Construction Contracts (b) For the Jamie Creek hydroelectric project in British Columbia with a 22 MW installed capacity acquired on October 25, 2012, the Corporation has entered into contracts for the construction and installation of the hydroelectric power station. Expenditures will be made according to the percentage of completion. As at June 30, 2013, the Corporation had additional net commitments of $4.2 million. (c) The Corporation has entered into a construction contract for the 68 MW Seigneurie de Beaupré 4 wind farm General Partnership located in Québec. Expenditures will be made according to the percentage of completion. As at June 30, 2013, Boralex's share in the net commitments of the entity was $13.8 million. (d) For two of the wind power projects under development in France with a 48 MW capacity acquired at the time of the June 28, 2012 business combination, Fortel-Bonnières and St-François, the Corporation has entered into wind turbine purchase and installation contracts with General Electric, contingent on the closing of project financing by the third quarter of 2013 in respect of which a letter of intent has already been signed. Expenditures will be made according to the percentage of completion. As at June 30, 2013, the Corporation had net additional commitments of 37.6 million ($51.5 million). Joint Venture (e) In January 2013, the Joint Venture entered into a contract to purchase tracked vehicles. As at June 30, 2013, the Corporation's share in the net commitments of the Joint Venture was $0.7 million. Risk Factors and Uncertainties Risk Factors Boralex has not observed any significant changes regarding the risks to which it is subject, and which are discussed under Risk Factors and Uncertainties in Boralex's annual MD&A for the year ended December 31, Main Sources of Uncertainty Relating to Management's Key Estimates and Judgments The preparation of financial statements in conformity with IFRS requires management to make estimates and judgments that can materially affect the recognized amounts of revenues, expenses, comprehensive income, assets and liabilities, and the information reported in the unaudited interim condensed consolidated financial statements. Management determines its estimates based on a number of factors, namely its experience, current events and measures the Corporation could subsequently take, as well as other assumptions it deems reasonable given the circumstances. By their nature, these estimates are subject to estimation uncertainty and actual results may differ from them. Underlying estimates and assumptions are periodically reviewed and the impact of any changes is recognized immediately. Items in question are presented in the Corporation's audited annual consolidated financial statements for the year ended December 31, Change in Accounting Estimate Change in Useful Life of a Wind Power Site Component As of January 1, 2013, the Corporation changed the useful life of a component for certain wind turbine models. The estimated life, which was formerly 10 years, was increased to 20 years, which now represents the estimated useful life for these models. This change in accounting estimate arose from new information obtained, as well as more experience regarding the component's estimated useful life. This change in estimate was recorded prospectively. The estimated annual impact of this change in accounting estimate is a decrease of approximately $1.2 million in annual amortization expense for future periods. The impact of this change for the six-month period, 2013 is a $0.6 million decrease in amortization expense. 36 BORALEX 2013 Interim Report 2
39 Change in Accounting Policies IAS 32, Financial Instruments: Presentation (Revised 2011) In December 2011, the IASB revised IAS 32, Financial Instruments: Presentation, to clarify the existing requirements for offsetting financial instruments in the statement of financial position. The revised IAS 32 will be effective for the fiscal years of the Corporation beginning on or after January 1, 2014, with earlier adoption permitted. The Corporation adopted this amended standard as at January 1, 2013 and this change had no impact on the Corporation's unaudited interim condensed consolidated financial statements. IAS 34, Interim Financial Reporting This amended standard requires that comprehensive income be classified by nature and enhances disclosure requirements for financial instruments. The Corporation adopted this amended standard as at January 1, 2013 and this change had no impact on the Corporation's unaudited interim condensed consolidated financial statements. Future Changes in Accounting Policies IFRS 9, Financial Instruments IFRS 9, Financial Instruments, issued in November 2009, addresses classification and measurement of financial assets and replaces the multiple category and measurement models in IAS 39, Financial Instruments: Recognition and Measurement, with a new measurement model comprising only two categories: amortized cost and fair value through profit or loss. In October 2010, the IASB amended this standard to provide guidelines on the classification and measurement of financial liabilities. Companies that elect to measure their debt at fair value must recognize changes in fair value resulting from changes to their own credit risk through Other comprehensive income instead of the statement of earnings. This standard is required to be applied for accounting periods beginning on or after January 1, 2015, with earlier adoption permitted. The Corporation has not yet assessed the impact of the standard or determined whether it will adopt the standard early. Internal Controls and Procedures In accordance with National Instrument , Certification of Disclosure in Issuers' Annual and Interim Filings, disclosure controls and procedures have been designed to provide reasonable assurance that the information that must be presented in Boralex's interim and annual reports is accumulated and communicated to management on a timely basis, including the Chief Executive Officer and the Chief Financial Officer, so that appropriate decisions can be made regarding disclosure. Internal control over financial reporting has also been designed to provide reasonable assurance regarding the reliability of financial reporting and the preparation of financial statements in accordance with IFRS. The Chief Executive Officer and the Chief Financial Officer have evaluated the effectiveness of Boralex's disclosure controls and procedures as of December 31, 2012, as well as the effectiveness of Boralex's internal control over financial reporting as of the same date and have concluded that they are adequate and effective. During the second quarter, 2013, no changes were made to internal control over financial reporting or disclosure controls and procedures that have materially affected, or are reasonably likely to materially affect, internal controls and procedures. 37 BORALEX 2013 Interim Report 2
40 Subsequent Event Seigneurie de Beaupré 4 On July 5, 2013, the Corporation transferred assets amounting to $6.4 million to the Seigneurie de Beaupré 4 wind farm GP, located in Canada, as a capital contribution in exchange for partnership units. In May 2013, in connection with the Seigneurie de Beaupré 4 wind farm project, Boralex entered into a partnership agreement with a subsidiary of Gaz Métro L.P. and created the partnership of which each party owns 50%. Under the agreement, all expenditures are made jointly and all earnings, costs, expenses, liabilities, obligations and risks resulting from the partnership are shared jointly but not severally. Boralex's interest in the partnership is accounted for using the equity method. The year-end date is December 31. Vron In August 2013, the Corporation closed long-term project financing for the Vron wind farm project in France. Disbursements will be made in August The loan, which is secured by the assets of this wind farm, comprises four tranches totalling 14.2 million ($19.4 million). The loan will be amortized in quarterly payments over a 15-year period. The Corporation has used interest rate swaps to set a fixed rate of 4% for the total debt over the loan term, thereby reducing its exposure to rate fluctuations. Jamie Creek In August 2013, the Corporation closed long-term project financing for the Jamie Creek hydroelectric power station project in Canada. Disbursements will be made in August The loan, without recourse to the Corporation, is secured by the assets of this hydroelectric power station and totals $55.3 million. The loan will enjoy a nine-year grace period for repayment of principal and be amortized thereafter, in semi-annual payments, over a 31-year period. The interest rate on the financing is fixed at 5.42% over the loan term. 38 BORALEX 2013 Interim Report 2
41 Consolidated Financial Statements Consolidated Statements of Financial Position As at June 30, As at December 31, (in thousands of Canadian dollars) (unaudited) Note ASSETS Cash and cash equivalents 122, ,138 Restricted cash 6,107 5,063 Trade and other receivables 30,998 45,589 Inventories 4,631 4,404 Available-for-sale financial asset 3,009 Prepaid expenses 4,087 2,137 CURRENT ASSETS 168, ,340 Property, plant and equipment 733, ,024 Other intangible assets 262, ,115 Goodwill 49,246 48,663 Interest in the Joint Venture 4 72,822 58,994 Other non-current financial assets Other non-current assets 12,402 12,735 NON-CURRENT ASSETS 1,130,881 1,062,531 TOTAL ASSETS 1,298,918 1,229,871 LIABILITIES Trade and other payables 55,169 46,945 Current portion of debt 5 104,548 98,570 Current income tax liability 2,446 1,741 Other current financial liabilities 9 17,994 25,508 CURRENT LIABILITIES 180, ,764 Non-current debt 5 444, ,616 Convertible debentures 227, ,299 Deferred income tax liability 37,859 29,514 Other non-current financial liabilities 9 19,893 24,698 Other non-current liabilities 11,259 10,611 NON-CURRENT LIABILITIES 741, ,738 TOTAL LIABILITIES 921, ,502 EQUITY Equity attributable to shareholders 351, ,868 Non-controlling shareholders 25,533 22,501 TOTAL EQUITY 377, ,369 TOTAL LIABILITIES AND EQUITY 1,298,918 1,229,871 The accompanying notes are an integral part of these consolidated financial statements. 39 BORALEX 2013 Interim Report 2
42 Consolidated Statements of Earnings (Loss) Three-month periods Six-month periods (in thousands of Canadian dollars, except per share amounts) (unaudited) Note REVENUES Revenues from energy sales 40,141 38,905 90,877 96,356 Other income ,578 39,076 91,629 96,678 COSTS AND OTHER EXPENSES Operating expenses 11,975 14,646 24,824 35,072 Administrative 3,639 3,746 7,236 6,951 Development 872 1,797 2,009 2,468 Amortization 13,213 13,954 26,714 27,890 Other gains (48) (82) Impairment of property, plant and equipment and intangible assets ,917 34,143 60,967 73,204 OPERATING INCOME 10,661 4,933 30,662 23,474 Financing costs 12,595 12,096 25,019 24,199 Foreign exchange loss (gain) (138) 10 (146) 131 Net loss (gain) on financial instruments (876) 822 (673) 485 Share in earnings (loss) of the Joint Venture 4 (899) (27) (1,114) 17 EARNINGS (LOSS) BEFORE INCOME TAXES (1,819) (8,022) 5,348 (1,324) Income tax expense (recovery) (176) (1,723) 2, NET EARNINGS (LOSS) FROM CONTINUING OPERATIONS (1,643) (6,299) 2,794 (1,362) Net earnings from discontinued operations ,459 NET EARNINGS (LOSS) (1,021) (6,165) 3,577 1,097 NET EARNINGS (LOSS) ATTRIBUTABLE TO: Shareholders of Boralex (1,063) (5,901) 3,105 1,248 Non-controlling shareholders 42 (264) 472 (151) NET EARNINGS (LOSS) (1,021) (6,165) 3,577 1,097 NET EARNINGS (LOSS) ATTRIBUTABLE TO SHAREHOLDERS OF BORALEX Continuing operations (1,685) (6,035) 2,322 (1,211) Discontinued operations ,459 (1,063) (5,901) 3,105 1,248 NET EARNINGS (LOSS) PER SHARE (BASIC AND DILUTED) ATTRIBUTABLE TO SHAREHOLDERS OF BORALEX Continuing operations ($0.04) ($0.16) $0.06 ($0.03) Discontinued operations $0.02 $0.02 $0.06 The accompanying notes are an integral part of these consolidated financial statements. 8 ($0.02) ($0.16) $0.08 $ BORALEX 2013 Interim Report 2
43 Statements of Comprehensive Income (Loss) Three-month periods Six-month periods (in thousands of Canadian dollars) (unaudited) NET EARNINGS (LOSS) (1,021) (6,165) 3,577 1,097 Other comprehensive income (loss) to be subsequently reclassified to net earnings when certain conditions are met Translation adjustments: Unrealized foreign exchange gain (loss) on translation of financial statements of self-sustaining foreign operations 8, ,633 (1,051) Cash flow hedges: Change in fair value of financial instruments 8,792 (7,294) 9,049 (8,842) Hedging items realized and recognized in net earnings (loss) 1,927 3,687 3,778 7,826 Taxes (3,155) 985 (3,805) 572 Cash flow hedges - Joint Venture: Change in fair value of financial instruments 15,555 (11,112) 14,942 (3,350) Taxes (3,948) 2,955 (3,869) 891 Available-for-sale financial asset: Change in fair value of an available-for-sale financial asset 11 (387) 800 (451) Items realized and recognized in net earnings (loss) (54) (91) Total other comprehensive income (loss) 27,780 (10,832) 30,437 (4,405) COMPREHENSIVE INCOME (LOSS) 26,759 (16,997) 34,014 (3,308) COMPREHENSIVE INCOME (LOSS) ATTRIBUTABLE TO: Shareholders of Boralex 24,570 (16,194) 31,308 (2,593) Non-controlling shareholders 2,189 (803) 2,706 (715) COMPREHENSIVE INCOME (LOSS) 26,759 (16,997) 34,014 (3,308) COMPREHENSIVE INCOME (LOSS) ATTRIBUTABLE TO SHAREHOLDERS OF BORALEX Continuing operations 23,948 (16,329) 30,525 (5,052) Discontinued operations ,459 The accompanying notes are an integral part of these consolidated financial statements. 24,570 (16,194) 31,308 (2,593) 41 BORALEX 2013 Interim Report 2
44 Consolidated Statements of Changes in Equity (in thousands of Canadian dollars) (unaudited) Capital stock Equity component of convertible debentures Equity attributable to shareholders Contributed surplus Retained earnings Other comprehensive income (loss) Total Noncontrolling shareholders Six-month period 2013 BALANCE AS AT JANUARY 1, ,870 14,379 6, ,492 (68,818) 319,868 22, ,369 Total equity Net earnings 3,105 3, ,577 Other comprehensive income 28,203 28,203 2,234 30,437 COMPREHENSIVE INCOME 3,105 28,203 31,308 2,706 34,014 Conversion of convertible debentures Exercise of options Stock option expense Contribution of non-controlling shareholders BALANCE AS AT JUNE 30, ,956 14,379 7, ,597 (40,615) 351,628 25, ,161 (in thousands of Canadian dollars) (unaudited) Capital stock Equity component of convertible debentures Equity attributable to shareholders Contributed surplus Retained earnings Other comprehensive loss Total Noncontrolling shareholders Six-month period 2012 BALANCE AS AT JANUARY 1, ,758 14,379 6, ,501 (65,980) 321,764 7, ,878 Total equity Net earnings (loss) 1,248 1,248 (151) 1,097 Other comprehensive loss (3,841) (3,841) (564) (4,405) COMPREHENSIVE INCOME (LOSS) 1,248 (3,841) (2,593) (715) (3,308) Conversion of convertible debentures Share repurchases (5) (2) (7) (7) Stock option expense Excess of proceeds from partial sale of a subsidiary 4,946 4,946 (4,946) Contribution of non-controlling shareholders 18,124 18,124 BALANCE AS AT JUNE 30, ,798 14,379 6, ,693 (69,821) 324,468 19, ,045 The accompanying notes are an integral part of these consolidated financial statements. 42 BORALEX 2013 Interim Report 2
45 Consolidated Statements of Cash Flows Three-month periods Six-month periods (in thousands of Canadian dollars) (unaudited) Note Net earnings (loss) attributable to shareholders of Boralex (1,063) (5,901) 3,105 1,248 Less: Net earnings from discontinued operations ,459 Net earnings (loss) from continuing operations attributable to shareholders of Boralex (1,685) (6,035) 2,322 (1,211) Financing costs 12,595 12,096 25,019 24,199 Interest paid (6,240) (12,973) (16,253) (23,327) Income tax expense (recovery) (176) (1,723) 2, Income taxes paid (695) (768) (1,452) (2,464) Non-cash items in earnings (loss): Net loss (gain) on financial instruments (876) 822 (673) 485 Share in loss (earnings) of the Joint Venture ,114 (17) Amortization 13,213 13,954 26,714 27,890 Impairment of property, plant and equipment and intangible assets Other gains (48) (82) Other , ,775 5,507 40,729 27,356 Change in non-cash items related to operating activities 13,979 7,731 13,472 18,956 NET CASH FLOWS RELATED TO OPERATING ACTIVITIES 31,754 13,238 54,201 46,312 Business acquisitions (39,080) (39,080) Additions to property, plant and equipment (40,312) (1,048) (48,693) (2,543) Additions to other intangible assets (1,560) (1,560) Change in restricted cash (289) 10,868 (1,044) 11,628 Increase in interest in the Joint Venture (9,425) (11,283) Development projects (7,913) (910) (8,890) (1,656) Proceeds from sale of assets 8,763 8,763 Other 292 (19) 96 NET CASH FLOWS RELATED TO INVESTING ACTIVITIES (48,514) (32,100) (58,646) (35,635) Increase in non-current debt 24,351 29,115 Repayments on non-current debt (4,716) (2,591) (13,983) (14,667) Contribution of non-controlling shareholders 18, ,124 Other 30 (60) 30 (48) NET CASH FLOWS RELATED TO FINANCING ACTIVITIES 19,665 15,473 15,488 3,409 Cash from discontinued operations (1,232) 1,066 (5,479) TRANSLATION ADJUSTMENT ON CASH AND CASH EQUIVALENTS 2, ,967 (196) NET CHANGE IN CASH AND CASH EQUIVALENTS 6,477 (4,303) 15,076 8,411 CASH AND CASH EQUIVALENTS - BEGINNING OF PERIOD 115, , , ,703 CASH AND CASH EQUIVALENTS - END OF PERIOD 122, , , ,114 The accompanying notes are an integral part of these consolidated financial statements. 43 BORALEX 2013 Interim Report 2
46 Notes to Consolidated Financial Statements As at June 30, 2013 (Tabular amounts are in thousands of Canadian dollars, unless otherwise specified.) (unaudited) Note 1. Incorporation and Nature of Business Boralex Inc. and its subsidiaries ( Boralex or the Corporation ) operate mainly as a private producer of energy. The Corporation has interests in 22 wind power stations, 14 hydroelectric power stations, two thermal power stations and a solar power facility for a total capacity of nearly 500 megawatts ( MW *). The Corporation also operates two hydroelectric power stations on behalf of an entity controlled by a director of Cascades, a corporation exercising significant influence over the Corporation. The generated power is sold mainly in Canada, the United States and France. The Corporation is incorporated under the Canada Business Corporations Act. Boralex's head office is located at 36 Lajeunesse St., Kingsey Falls, Québec, Canada and its shares and convertible debentures are listed on the Toronto Stock Exchange ( TSX ). (* The data expressed in MW and MWh contained in notes 1, 10, 11 and 12 have not been reviewed by the auditors.) Note 2. Basis of Presentation These unaudited interim condensed consolidated financial statements have been prepared in accordance with International Financial Reporting Standards ( IFRS ), as published by the International Accounting Standards Board ( IASB ), including International Accounting Standards ( IAS ) and the interpretations of the International Financial Reporting Interpretations Committee ( IFRS IC ) applicable to the preparation of interim financial statements, and IAS 34, Interim Financial Reporting. The accounting policies followed in these unaudited interim condensed consolidated financial statements are the same as those applied in the audited annual consolidated financial statements of the Corporation for the year ended December 31, 2012, except for income taxes for the interim periods, which were calculated using the tax rate that would be applicable to expected earnings for each jurisdiction, and the changes in accounting policies in note 3. The Corporation has consistently applied the same accounting policies for all of the periods presented. As permitted under IAS 34, these interim financial statements do not constitute a complete set of financial statements, as the Corporation does not present all the notes to financial statements included in its annual report. To avoid repetition of previously reported information, the Corporation deemed it unnecessary to include such information and, therefore, readers are advised that these financial statements constitute a condensed set of financial statements under IAS 34. These unaudited interim condensed consolidated financial statements are intended to provide an update on the latest complete set of annual financial statements and should therefore be read in conjunction with the Corporation's audited annual consolidated financial statements for the year ended December 31, The preparation of financial statements in accordance with IFRS requires the use of certain critical accounting estimates. It also requires management to exercise its judgment in the process of applying the Corporation's accounting policies. These areas involving a higher degree of judgment or complexity, or areas where assumptions and estimates are significant to the consolidated financial statements, are disclosed in the Corporation's audited annual consolidated financial statements for the year ended December 31, The Board of Directors approved these financial statements on August 6, BORALEX 2013 Interim Report 2
47 Note 3. Accounting Policies Change in Accounting Estimate Change in Useful Life of a Wind Power Site Component As of January 1, 2013, the Corporation changed the useful life of a component for certain wind turbine models. The estimated life, which was formerly 10 years, was increased to 20 years, which now represents the estimated useful life for these models. This change in accounting estimate arose from new information obtained, as well as more experience regarding the component's estimated useful life. This change in estimate was recorded prospectively. The estimated annual impact of this change in accounting estimate is a decrease of approximately $1,167,000 in annual amortization expense for future periods. The impact of this change for the six-month period, 2013 is a $584,000 decrease in amortization expense. Changes in Accounting Policies IAS 32, Financial Instruments: Presentation (Revised 2011) In December 2011, the IASB revised IAS 32, Financial Instruments: Presentation, to clarify the existing requirements for offsetting financial instruments in the statement of financial position. The revised IAS 32 will be effective for the fiscal years of the Corporation beginning on or after January 1, 2014, with earlier adoption permitted. The Corporation adopted this amended standard as at January 1, 2013 and this change had no impact on the Corporation's unaudited interim condensed consolidated financial statements. IAS 34, Interim Financial Reporting This amended standard requires that comprehensive income be classified by nature and enhances disclosure requirements for financial instruments. The Corporation adopted this amended standard as at January 1, 2013 and this change had no impact on the Corporation's unaudited interim condensed consolidated financial statements. Future Change in Accounting Policies IFRS 9, Financial Instruments IFRS 9, Financial Instruments, issued in November 2009, addresses classification and measurement of financial assets and replaces the multiple category and measurement models in IAS 39, Financial Instruments: Recognition and Measurement, with a new measurement model comprising only two categories: amortized cost and fair value through profit or loss. In October 2010, the IASB amended this standard to provide guidelines on the classification and measurement of financial liabilities. Companies that elect to measure their debt at fair value must recognize changes in fair value resulting from changes to their own credit risk through Other comprehensive income instead of the statement of earnings. This standard is required to be applied for accounting periods beginning on or after January 1, 2015, with earlier adoption permitted. The Corporation has not yet assessed the impact of the standard or determined whether it will adopt the standard early. 45 BORALEX 2013 Interim Report 2
48 Note 4. Interest in the Joint Venture In June 2011, in connection with the Seigneurie de Beaupré 2 and 3 wind farm project, the Corporation entered into a partnership agreement with a subsidiary of Gaz Métro L.P. and created the joint venture Seigneurie de Beaupré 2 and 3 wind farm General Partnership (the Joint Venture ) located in Canada, of which each party owns 50%. Under the agreement, all expenditures are made jointly and all earnings, costs, expenses, liabilities, obligations and risks resulting from the Joint Venture are shared jointly but not severally. The Corporation's interest in the Joint Venture is accounted for using the equity method. The Joint Venture's year-end date is December 31. The following table shows Boralex's interest in the Joint Venture (50%): Six-month period Twelve-month period ended December Balance - beginning of period 58,994 45,266 Cash contribution 17,735 Share in earnings (loss) (1,114) 51 Share in comprehensive income (loss) 14,942 (4,088) Other 30 Balance - end of period 72,822 58,994 The following tables show all of the the current assets, non-current assets, current liabilities, non-current liabilities, net earnings (loss) and comprehensive income (loss) of the Joint Venture (100%): As at June 30, As at December 31, Current assets 24,672 19,884 Non-current assets 538, ,724 TOTAL ASSETS 562, ,608 Current liabilities 79,233 15,432 Non-current liabilities 337, ,188 TOTAL LIABILITIES 417, ,620 NET ASSETS 145, ,988 Three-month periods Six-month periods Note Administrative OPERATING INCOME (59) (68) (169) (81) Interest income (2) (9) (15) Financing costs Foreign exchange loss Net loss (gain) on financial instruments (a) 1, ,015 (187) NET EARNINGS (LOSS) (a) (1,798) (72) (2,227) 119 Other comprehensive income (loss) 31,111 (22,223) 29,884 (6,699) COMPREHENSIVE INCOME (LOSS) 29,313 (22,295) 27,657 (6,580) (a) During the six-month period, 2013, the net loss of the Joint Venture amounted to $2,227,000. The interest rate swaps entered into by that Joint Venture fully hedge the interest rate risk arising from the hedged debt. However, the theoretical application of the IFRS for purposes of measuring ineffectiveness can sometimes produce unexpected even counter-intuitive results, in particular, when integrating counterparty credit risk. Under IFRS, any ineffective portion of the financial instruments is recognized in earnings. In the financial statements of the Joint Venture, the $2,227,000 loss for the six-month period, 2013 resulted primarily from the recognition of a charge for such ineffectiveness amounting to $1,694,000. It is important to note that that loss of $1,694,000 is in respect of an instrument with a notional amount of $551,732,000, which represents a ratio of only 0.3%. 46 BORALEX 2013 Interim Report 2
49 Note 4. Interest in the Joint Venture (Cont'd) Commitment All of the Corporation's share in the net commitments of the Joint Venture are discussed in Boralex's annual financial statements for the fiscal year ended December 31, 2012, but during the six-month period, 2013, the Corporation concluded the following new commitment: Purchase Contract In January 2013, the Joint Venture entered into a contract to purchase tracked vehicles. As at June 30, 2013, the Corporation's share in the net commitments of the Joint Venture was $727,000. Note 5. Non-current Debt As at June 30, As at December 31, Note Maturity Rate (1) Master agreement - wind farms (France) , ,042 Term loan payable - Nibas wind farm (France) ,745 5,104 Term loan payable - St-Patrick wind farm (France) ,401 47,448 Finance leases (France) ,675 3,026 Term loan payable - Ocean Falls power station ,831 10,138 Term loan payable - Thames River wind farms , ,481 Canadian senior secured note ,114 36,601 U.S. senior secured note (a) ,791 71,994 Term loan payable - Lauragais solar power station (France) ,405 15,738 Term loan payable - La Vallée wind farm (France) (b) ,949 Other debts 5,058 4, , ,449 Current portion of debt (104,548) (98,570) Borrowing cost, net of accumulated amortization (9,099) (7,263) 444, ,616 (1) Weighted-average rates adjusted to reflect the impact of interest rate swaps, where applicable. (a) The U.S. note matures on September 3, On June 27, 2013, the Corporation completed a long-term financing arrangement and increased the loan to US$90,000,000. This loan, to be disbursed on September 3, 2013, will carry interest at the annual rate of 3.51% and will be amortized by half-yearly payments over a 12-year period. (b) This loan payable, secured by the assets of the La Vallée wind farm in Europe, consists of 18,037,000 ($23,964,000) drawn down under an initial financing facility of 27,000,000 over 15 years and 3,838,000 ($5,111,000) drawn down under a second financing facility of 6,400,000 over 15 years. The Corporation will make quarterly repayments of principal and interest. The variable interest rate for this financing is based on EURIBOR, plus a margin of 2.6%. To reduce its exposure to rate movements, interest rate financial swaps have been entered into, one with a notional amount of 27,000,000 ($36,966,000) at a rate of 1.86% over 15 years, and a second with a notional amount of 6,400,000 ($8,762,000) at a rate of 1.64% over 15 years. The swaps secure a fixed rate for 100% of the total debt. The revolving credit facility with an authorized amount of $60,000,000 was extended by a one year, until June 30, The interest rate margins were adjusted downward by approximately 0.25%. The authorized amount could be increased by $35,000,000 if the Corporation were to prepay its $35,000,000 Canadian private placement, maturing on July 9, 2014, and pledge the underlying assets as security. Lastly, under the new agreement, there are no longer any restrictions on dividends paid to shareholders. Note 6. Sale of Assets On June 27, 2013, the Corporation undertook to sell the equipment of a recovery site (Secure) in Québec, Canada for a consideration of $399,000. The sale is expected to close on September 13, As the assets will be sold at a price below their carrying amount, a $266,000 impairment loss was recognized as at June 30, In April 2012, the Corporation completed the sale of the Dolbeau wood-residue thermal power station to Resolute Forest Products for a cash consideration of $5,000,000. In April 2012, the Corporation closed the sale of a wind power development project in Italy for a consideration of 1,466,000 ($1,950,000). Impairment charges of $268,000 and $555,000, respectively, on the property, plant and equipment and intangible assets were recognized as at March 31, 2012 to bring the assets' carrying amount closer to their recoverable amount. 47 BORALEX 2013 Interim Report 2
50 Note 7. Discontinued Operations Net earnings from discontinued operations are detailed as follows: Three-month periods Six-month periods Pre-tax operating income from discontinued operations ,220 3,950 Income tax expense ,491 Net earnings from discontinued operations ,459 Cash flows related to discontinued operations are related to operating activities. Note 8. Net Earnings per Share (a) Net Earnings per Share-Basic Three-month periods Six-month periods (in thousands of dollars, except per share amounts and number of shares) Net earnings (loss) attributable to shareholders of Boralex (1,063) (5,901) 3,105 1,248 Less: Net earnings from discontinued operations ,459 Net earnings (loss) from continuing operations attributable to shareholders of Boralex (1,685) (6,035) 2,322 (1,211) Weighted average number of shares - basic 37,740,004 37,727,077 37,737,548 37,726,883 Net earnings (loss) per share from continuing operations attributable to shareholders of Boralex - basic ($0.04) ($0.16) $0.06 ($0.03) Net earnings per share from discontinued operations - basic $0.02 $0.02 $0.06 Net earnings (loss) per share attributable to shareholders of Boralex - basic ($0.02) ($0.16) $0.08 $0.03 (b) Net Earnings per Share-Diluted Three-month periods Six-month periods (in thousands of dollars, except per share amounts and number of shares) Net earnings (loss) attributable to shareholders of Boralex (1,063) (5,901) 3,105 1,248 Less: Net earnings from discontinued operations ,459 Net earnings (loss) from continuing operations attributable to shareholders of Boralex (1,685) (6,035) 2,322 (1,211) Weighted average number of shares 37,740,004 37,727,077 37,737,548 37,726,883 Dilutive effect of stock options 414,530 89, ,505 89,007 Weighted average number of shares - diluted 38,154,534 37,816,803 38,096,053 37,815,890 Net earnings (loss) per share from continuing operations attributable to shareholders of Boralex - diluted ($0.04) ($0.16) $0.06 ($0.03) Net earnings per share from discontinued operations - diluted $0.02 $0.02 $0.06 Net earnings (loss) per share attributable to shareholders of Boralex - diluted ($0.02) ($0.16) $0.08 $0.03 The table below shows the items that could dilute basic net earnings (loss) per common share in the future, but that were not reflected in the calculation of diluted net earnings (loss) per common share due to their anti-dilutive effect: 48 BORALEX 2013 Interim Report 2 Three-month periods Six-month periods Convertible debentures excluded due to their anti-dilutive effect 19,578,693 19,588,317 19,579,207 19,588,659 Stock options excluded due to their anti-dilutive effect 281,795 1,020, ,795 1,020,612
51 Note 9. Financial Instruments The classification of financial instruments, complete with the respective carrying amounts and fair values, is as follows: OTHER LIABILITIES Carrying amount As at June 30, As at December 31, Fair value Carrying amount Non-current debt 549, , , ,618 Convertible debentures 242, , , ,434 The fair value of the derivative financial instruments designated as cash flow hedges is as follows: Fair value OTHER NON-CURRENT FINANCIAL ASSETS As at June 30, As at December 31, Financial swaps - interest rates OTHER CURRENT FINANCIAL LIABILITIES Financial swaps - interest rates 17,994 25,508 OTHER NON-CURRENT FINANCIAL LIABILITIES 17,994 25,508 Financial swaps - interest rates 19,893 24,698 19,893 24,698 The fair value of a financial instrument is the amount of consideration that would be agreed upon in an arm's length transaction between knowledgeable, willing parties who are under no compulsion to act. The fair values of cash and cash equivalents, restricted cash, trade and other receivables, reserve funds, and trade and other payables approximate their carrying amounts due to their short-term maturities. The fair value of non-current debt is essentially based on the calculation of discounted cash flows. Discount rates were determined based on local government bond yields adjusted for the risks specific to each of the borrowings and for credit market liquidity conditions. The convertible debentures and available-for-sale financial asset are traded on the stock exchange and their fair values are based on the prices as at June 30, As at June 30, 2013 Maturity Rate (1) Discount rate Fair value Master agreement - wind farms (France) ,123 Term loan payable - Nibas wind farm (France) ,825 Term loan payable - St-Patrick wind farm (France) ,401 Finance leases (France) ,929 Term loan payable - Ocean Falls power station ,926 Term loan payable - Thames River wind farms ,103 Canadian senior secured note ,446 U.S. senior secured note ,103 Term loan payable - Lauragais solar power station (France) ,201 Term loan payable - La Vallée wind farm (France) ,949 Other debts 4, ,827 Convertible debentures ,375 (1) Weighted average annual rates, adjusted to reflect the impact of interest rate swaps. 49 BORALEX 2013 Interim Report 2
52 Note 9. Financial Instruments (Cont'd) Financial Swaps - Interest Rates Cash flows are discounted using a curve that reflects the credit risk of the Corporation or the counterparty, as applicable. The following table summarizes the Corporation's commitments under interest rate swaps as at June 30, 2013: As at June 30, 2013 Currency Fixed-rate payer Floating-rate receiver Maturity Current notional (in C$) Fair value (in C$) Financial swaps - interest rates Euro 1.640% % 6-month EURIBOR ,695 (19,573) Financial swaps - interest rates CAD 4.61% % 3-month CDOR ,000 (17,994) Financial swaps - interest rates with maturities in 2031 contain an early termination clause that is mandatory in As a result, they are presented as current financial liabilities. Hierarchy of Financial Assets and Liabilities Measured at Fair Value The fair value of a financial instrument is the amount of consideration that would be agreed upon in an arm's length transaction between knowledgeable, willing parties who are under no compulsion to act. Financial instruments measured at fair value in the financial statements are classified according to the following hierarchy of levels: Level 1: Level 2: Level 3: Consists of measurements based on quoted prices (unadjusted) in markets for identical assets or liabilities; Consists of measurement techniques based mainly on inputs, other than quoted prices, that are observable either directly or indirectly in the market; Consists of measurement techniques that are not based mainly on observable market data. The level in the fair value hierarchy within which the fair value measurement is categorized in its entirety shall be determined on the basis of the lowest level input that is significant to the fair value measurement in its entirety. The Corporation classified the available-for-sale financial asset and convertible debentures as Level 1, as their fair values are determined using quoted market prices. For non-current debt and financial swaps - interest rates, the Corporation classified the fair value measurements as Level 2, as they are based mainly on observable market data, namely government bond yields and interest rates. The following table classifies the Corporation's financial instruments by level in the fair value hierarchy: FINANCIAL ASSETS Fair value hierarchy levels: As at June 30, 2013 Level 1 Level 2 Level 3 Financial swaps - interest rates OTHER LIABILITIES Non-current debt 583, ,827 Convertible debentures 259, ,375 FINANCIAL LIABILITIES 843, , ,827 Financial swaps - interest rates 37,887 37,887 37,887 37,887 Fair value hierarchy levels: As at December 31, 2012 Level 1 Level 2 Level 3 FINANCIAL ASSETS Available-for-sale financial asset 3,009 3,009 3,009 3,009 OTHER LIABILITIES Non-current debt 556, ,618 Convertible debentures 259, , , , ,618 FINANCIAL LIABILITIES Financial swaps - interest rates 50,206 50,206 50,206 50, BORALEX 2013 Interim Report 2
53 Note 10. Commitments and Contingencies All commitments and contingencies are discussed in Boralex's annual financial statements for the year ended December 31, However, during the six-month period, 2013, the Corporation concluded the following new commitments: Maintenance Contracts (a) For two of the wind power projects under development in France with a 48 MW* capacity acquired at the time of the June 28, 2012 business combination, Fortel-Bonnières and St-François, the Corporation has entered into maintenance contracts with General Electric. The contracts have an initial term of five years and require net additional commitments of 3,900,000 ($5,340,000) payable as from the commercial commissioning of sites slated for 2014, contingent on the closing of project financing by the third quarter of 2013, in respect of which a letter of intent has already been signed.. Construction Contracts (b) For the Jamie Creek hydroelectric project in British Columbia with a 22 MW* installed capacity acquired on October 25, 2012, the Corporation has entered into contracts for the construction and installation of the hydroelectric power station. Expenditures will be made according to the percentage of completion. As at June 30, 2013, the Corporation had additional net commitments of $4,207,000. (c) The Corporation has entered into a construction contract for the 68 MW* Seigneurie de Beaupré 4 wind farm General Partnership located in Québec. Expenditures will be made according to the percentage of completion. As at June 30, 2013, Boralex's share in the net commitments of the entity was $13,753,000. (d) For two of the wind power projects under development in France with a 48 MW* capacity acquired at the time of the June 28, 2012 business combination, Fortel-Bonnières and St-François, the Corporation has entered into wind turbine purchase and installation contracts with General Electric, contingent on the closing of project financing by the third quarter of 2013 in respect of which a letter of intent has already been signed. Expenditures will be made according to the percentage of completion. As at June 30, 2013, the Corporation had net additional commitments of 37,649,000 ($51,545,000). 51 BORALEX 2013 Interim Report 2
54 Note 11. Seasonal and Other Cyclical Factors The Corporation's operations and results are partly subject to seasonal cycles and other cyclical factors that vary by segment. Since nearly all of Boralex facilities have long-term indexed fixed-price power sales contracts, seasonal cycles mainly affect the total volume of power generated by the Corporation. Only four hydroelectric power stations in the United States, accounting for only 4% of the Corporation's total installed capacity in operation, are not covered by long-term sales contracts. Operating volumes at Boralex facilities are influenced by the following seasonal factors, depending on their specific power generation method. Wind For the 286 MW* of Boralex's wind power assets currently in operation, wind conditions are usually more favourable in the winter, which falls during Boralex's first and fourth quarters, both in France and Canada. However, in winter there is a greater risk of lower production caused by weather conditions, such as icing. In general, management estimates that approximately 60% of annual production in its wind power segment is generated in the first and fourth quarters and 40% in the second and third quarters. Hydroelectricity For Boralex's hydroelectric assets totalling 136 MW*, power output depends on water flow, which in Canada and the Northeastern U.S. tends to be at a maximum in spring and generally good in the fall, which are Boralex's second and fourth quarters. Historically, water flow tends to decrease in winter and summer. In general, management estimates that approximately 60% of annual production in its hydroelectric power segment is generated in the second and fourth quarters and 40% in the first and third quarters.note that apart from four hydroelectric power stations whose water flow is regulated upstream yet not under the Corporation's control, Boralex's other hydroelectric facilities do not have reservoirs that would permit water flow regulation during the year. Thermal Boralex owns and operates two thermal power stations for an aggregate 49 MW* of installed capacity. Of the two, the Senneterre power station in Québec, Canada is fuelled by wood residue and is covered by a Hydro-Québec power sales contract expiring in An agreement has been entered into with Hydro-Québec under which the Senneterre power station will produce power six months per year during 2012 and 2013, from December to March and in July and August. The Corporation is currently in discussion with Hydro-Québec to determine terms of operation of this power station for Boralex also operates a natural gas-fired power station located in Blendecques, France. Its sales contract with Électricité de France ( EDF ), a state corporation, expired on March 31, 2013 but was extended up to April 30, 2013 at EDF's request.the power station is expected to resume operations in November 2013, once the Corporation completes the process to enter into a new power sales contract. Meanwhile, as in previous years, steam for the power station's industrial client will be produced using an auxiliary boiler during the period of suspension of the cogeneration operations, namely from May to November Solar The Corporation's only solar power station (5 MW*) currently in operation is located in Southwestern France. For this facility, which benefits from a long-term power sales contract, sunlight conditions are usually more favourable in the spring and summer, which fall during Boralex's second and third quarters. In view of these weather conditions, management estimates that approximately 65% of the annual production at its solar power station will be generated in the second and third quarters. In short, while Boralex's performance remains partially exposed to seasonal cycles and other cyclical factors, substantially all of its revenues are now derived from assets covered by fixed-price and price-indexed contracts, thereby mitigating their effect. The Corporation also capitalizes on solid diversification in its power generation sources and favourable geographic positioning. 52 BORALEX 2013 Interim Report 2
55 Note 12. Segmented Information The Corporation's power stations are grouped into four distinct operating segments - wind, hydroelectric, thermal and solar power. The Corporation operates under one reportable segment: power generation. The classification of these segments is based on the different cost structures relating to each of the four types of power stations. The same accounting rules are used for segmented information as for the consolidated accounts. The operating segments are presented according to the same criteria used to prepare the internal report submitted to the segment leader who allocates resources and assesses operating segment performance. The President and Chief Executive Officer is considered the segment leader, who assesses segment performance based on power production, revenues from energy sales and EBITDA. EBITDA does not have a standardized meaning under IFRS; accordingly, it may not be comparable to similarly named measures used by other companies. Investors should not view EBITDA as an alternative measure to, for example, net earnings, or as a measure of operating results, which are IFRS measures. EBITDA is reconciled to the most comparable IFRS measure, namely, net earnings (loss) attributable to shareholders of Boralex, in the following table: Three-month periods Six-month periods Net earnings (loss) attributable to shareholders of Boralex (1,063) (5,901) 3,105 1,248 Net earnings from discontinued operations (622) (134) (783) (2,459) Non-controlling shareholders 42 (264) 472 (151) Income tax expense (recovery) (176) (1,723) 2, Net loss (gain) on financial instruments (876) 822 (673) 485 Foreign exchange loss (gain) (138) 10 (146) 131 Financing costs 12,595 12,096 25,019 24,199 Impairment of property, plant and equipment and intangible assets Other gains (48) (82) Amortization 13,213 13,954 26,714 27,890 EBITDA 23,193 18,860 56,446 52, BORALEX 2013 Interim Report 2
56 Note 12. Segmented information (Cont'd) Information by Operating Segment Power production (MWh*) Three-month periods Six-month periods Wind power stations 166, , , ,241 Hydroelectric power stations 197, , , ,969 Thermal power stations 7,191 41,981 78, ,304 Solar power station 1,788 1,940 2,867 3,269 Revenues from energy sales 373, , , ,783 Wind power stations 20,384 16,345 43,982 36,991 Hydroelectric power stations 15,691 12,445 29,804 26,431 Thermal power stations 3,268 9,285 15,814 31,528 Solar power station ,277 1,406 EBITDA 40,141 38,905 90,877 96,356 Wind power stations 15,569 13,082 35,444 30,059 Hydroelectric power stations 12,532 9,056 23,816 19,701 Thermal power stations (1,070) 1,154 3,598 9,549 Solar power station ,088 1,218 Corporate and eliminations (4,544) (5,155) (7,500) (8,323) Additions to property, plant and equipment 23,193 18,860 56,446 52,204 Wind power stations 28, , Hydroelectric power stations 10, , Thermal power stations Solar power station Corporate and eliminations , ,312 1,048 48,693 2,543 Total assets As at June 30, As at December 31, Wind power stations 706, ,065 Hydroelectric power stations 442, ,553 Thermal power stations 46,618 79,093 Solar power station 21,343 20,768 Corporate 81,556 63,392 Total liabilities 1,298,918 1,229,871 Wind power stations 484, ,977 Hydroelectric power stations 148, ,795 Thermal power stations 10,066 11,487 Solar power station 16,632 16,438 Corporate 261, , , , BORALEX 2013 Interim Report 2
57 Note 12. Segmented information (Cont'd) Information by Geographic Segment Power production (MWh*) Three-month periods Six-month periods Canada 133, , , ,055 United States 123,443 85, , ,469 France 116,725 90, , ,259 Revenues from energy sales 373, , , ,783 Canada 14,074 19,297 35,915 50,468 United States 9,493 6,497 17,833 14,900 France 16,574 13,111 37,129 30,988 EBITDA 40,141 38,905 90,877 96,356 Canada 6,232 8,123 20,861 25,450 United States 7,556 4,605 14,288 11,252 France 9,405 6,132 21,297 15,502 Additions to property, plant and equipment 23,193 18,860 56,446 52,204 Canada 12, ,486 1,126 United States France 27, ,997 1,332 40,312 1,048 48,693 2,543 Total assets As at June 30, As at December 31, Canada 665, ,146 United States 195, ,329 France 438, ,396 Non-current assets, excluding interest in the Joint Venture 1,298,918 1,229,871 Canada 512, ,019 United States 149, ,604 France 396, ,914 Total liabilities 1,058,059 1,003,537 Canada 499, ,855 United States 100,006 94,461 France 322, , , , BORALEX 2013 Interim Report 2
58 Note 13. Subsequent Event Seigneurie de Beaupré 4 On July 5, 2013, Boralex transferred assets amounting to $6,382,000 to Seigneurie de Beaupré 4 Wind Farm GP, located in Canada, as a capital contribution in exchange for partnership units. In May 2013, in connection with the Seigneurie de Beaupré 4 wind farm project, Boralex entered into a partnership agreement with a subsidiary of Gaz Métro L.P. and created the partnership of which each party owns 50%. Under the agreement, all expenditures are made jointly and all earnings, costs, expenses, liabilities, obligations and risks resulting from the partnership are shared jointly but not severally. Boralex's interest in the partnership is accounted for using the equity method. The year-end date is December 31. Vron In August 2013, the Corporation closed long-term project financing for the Vron wind farm project in France. Disbursements will be made in August The loan, which is secured by the assets of this wind farm, comprises four tranches totalling 14,150,000 ($ ). The loan will be amortized in quarterly payments over a 15-year period. The Corporation has used interest rate swaps to set a fixed rate of 4% for the total debt over the loan term, thereby reducing its exposure to rate fluctuations. Jamie Creek In August 2013, the Corporation closed long-term project financing for the Jamie Creek hydroelectric power station project in Canada. Disbursements will be made in August The loan, without recourse to the Corporation, is secured by the assets of this hydroelectric power station and totals $55,250,000. The loan will enjoy a nine-year grace period for repayment of principal and be amortized thereafter, in semi-annual payments, over a 31-year period. The interest rate on the financing is fixed at 5.42% over the loan term. 56 BORALEX 2013 Interim Report 2
59
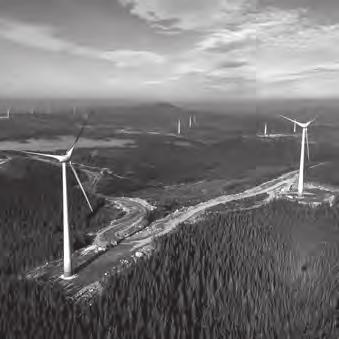

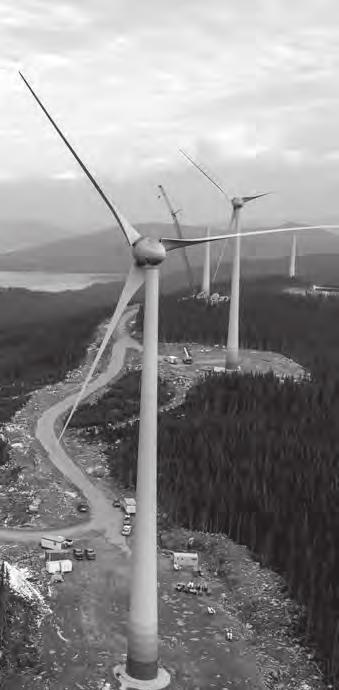
60
INTERIM REPORT AS AT MARCH 31,
 INTERIM REPORT AS AT MARCH 31, 2015 1 Contact us Head Office Boralex Inc. 36 Lajeunesse Street Kingsey Falls, Québec Canada J0A 1B0 Telephone: 819 363-6363 Fax: 819 363-6399 info@boralex.com Business Offices
PRESS RELEASE For immediate release
 PRESS RELEASE For immediate release Boralex generates strong results for the fourth quarter of 2017 The Corporation ends the year well positioned to complete the next stages of its growth strategy Montréal,
INTERIM REPORT AS AT SEPTEMBER 30, 2017
 INTERIM REPORT AS AT SEPTEMBER 30, 207 3 Profile Boralex develops, builds and operates renewable energy power facilities in Canada, France and the United States. A leader in the Canadian market and France
wind hydroelectric thermal
 Boralex. Annual Report Profile Boralex is a major private electricity producer whose core business is the development and operation of power stations that run on renewable energy. Employing over 300 people,
June 1, 2017 BLX Toronto Stock Exchange
 A unique profile June 1, 2017 BLX Toronto Stock Exchange Cautionary Statements Forward-looking Statements Some of the statements contained in this presentation, including those regarding future results
August 18, 2017 BLX Toronto Stock Exchange
 A unique profile August 18, 2017 BLX Toronto Stock Exchange Cautionary Statements Forward-looking Statements Some of the statements contained in this presentation, including those regarding future results
PRESS RELEASE For immediate release
 PRESS RELEASE For immediate release Boralex enters into a purchase agreement to acquire the Kallista Energy Investment SAS portfolio Highlights: Boralex strengthens its position as France s largest independent
A unique profile. BLX Toronto Stock Exchange
 A unique profile BLX Toronto Stock Exchange September 30, 2018 Cautionary Statements Forward-looking Statements Some of the statements contained in this presentation, including those regarding future results
A unique profile. BLX Toronto Stock Exchange. December 18, 2017
 A unique profile BLX Toronto Stock Exchange December 18, 2017 Cautionary Statements Forward-looking Statements Some of the statements contained in this presentation, including those regarding future results
BROOKFIELD RENEWABLE POWER INC. MANAGEMENT S DISCUSSION AND ANALYSIS MARCH 31, 2008
 BROOKFIELD RENEWABLE POWER INC. MANAGEMENT S DISCUSSION AND ANALYSIS MARCH 31, 2008 Attached is management s discussion and analysis of Brookfield Renewable Power Inc. (formerly Brookfield Power Inc. and
Brookfield Renewable Energy Partners L.P. ANNUAL REPORT 2012
 Brookfield Renewable Energy Partners L.P. ANNUAL REPORT 2012 TABLE OF CONTENTS Letter To Shareholders 1 Financial Review For The Year Ended December 31, 2012 11 Analysis Of Consolidated Financial Statements
Brookfield Renewable Energy Partners L.P. ANNUAL REPORT 2011
 Brookfield Renewable Energy Partners L.P. ANNUAL REPORT 2011 OUR OPERATIONS We operate our facilities through three regional operating centers in, the United States, Brazil and Canada which are designed
Management s Discussion and Analysis
 (Formerly GLV Inc.) Management s Discussion and Analysis Third quarter of fiscal 2015 Three-month and nine-month periods ended, 2014 Table of Contents 1. PRELIMINARY COMMENTS TO INTERIM MANAGEMENT S DISCUSSION
second quarterly report
 second quarterly report Intertape Polymer Group Inc. Management s Discussion and Analysis Consolidated Quarterly Statements of Earnings Three month periods ended (In thousands of US dollars, except per
HARDWOODS DISTRIBUTION INCOME FUND
 HARDWOODS DISTRIBUTION INCOME FUND The Beauty of Hardwood Third Quarter Report To Unitholders For the period ended September 30, 2005 1 About the Fund Hardwoods Distribution Income Fund (the Fund ) is
WELL-POSITIONED TO GROW
 WELL-POSITIONED TO GROW Interim report Cominar real estate investment trust Quarter ended September 30, 2010 TABLe OF CONTENTS THIRD quarter Ended September 30, 2010 / 03 Message to Unitholders / 05 Interim
Brookfield Renewable Energy Partners L.P. Q INTERIM REPORT
 Brookfield Renewable Energy Partners L.P. Q1 2013 INTERIM REPORT TABLE OF CONTENTS Letter To Shareholders 1 Financial Review for the Three Months Ended March 31, 2013 10 Analysis Of Consolidated Financial
PREMIUM BRANDS INCOME FUND. First Quarter 2007
 PREMIUM BRANDS INCOME FUND Management s Discussion and Analysis First Quarter 2007 OVERVIEW Premium Brands owns a broad range of leading branded specialty food businesses with manufacturing and distribution
Significant events. Newfoundland Capital Corporation Limited 1
 Newfoundland Capital Corporation Limited Second Quarter 2015 Period Ended June 30 (unaudited) Dartmouth, N.S. August 13, 2015, Newfoundland Capital Corporation Limited ( Company ) today announces its financial
Compared to the second quarter of Fiscal 2018:
 For immediate distribution DOLLARAMA REPORTS SECOND QUARTER RESULTS MONTREAL, Quebec, September 13, Dollarama Inc. (TSX: DOL) ( Dollarama or the Corporation ) today reported increases in sales, net earnings
VALENER AND GAZ MÉTRO REPORT THEIR FISCAL 2016 FIRST QUARTER RESULTS Q HIGHLIGHTS. Valener
 PRESS RELEASE FOR IMMEDIATE RELEASE VALENER AND GAZ MÉTRO REPORT THEIR FISCAL 2016 FIRST QUARTER RESULTS Q1 2016 HIGHLIGHTS Valener Normalized operating cash flows per common share 1 of $0.27, up 4% from
INNERGEX REPORTS ITS THIRD QUARTER 2017 RESULTS
 News Release For Immediate Distribution INNERGEX REPORTS ITS THIRD QUARTER 2017 RESULTS ACQUISITION OF TWO WIND FARMS IN FRANCE FOR 43 MW Revenues increased 56% to $108.2 million compared with the same
ANNUAL INFORMATION FORM for the year ended December 31, 2010
 ANNUAL INFORMATION FORM for the year ended December 31, 2010 March 24, 2011 Table of Contents 1. INFORMATION INCORPORATED BY REFERENCE... 3 2. NOTICE CONCERNING FORWARD-LOOKING STATEMENTS... 3 3. DATE
LETTER TO THE SHAREOWNERS
 Q1 AKITA 2018 Q1 REPORT LETTER TO THE SHAREOWNERS Drilling Ltd. s net loss for the three months ended March 31, 2018 was $1,912,000 (net loss of $0.11 per share basic and diluted) on revenue of $27,089,000,
INTERIM REPORT RAPPORT INTERMÉDIAIRE
 INTERIM REPORT RAPPORT INTERMÉDIAIRE POUR LES FOR NEUFS THE NINE MOIS MONTHS TERMINÉS ENDED LE 27 OCTOBER OCTOBRE 27, 2018 2018 MESSAGE TO SHAREHOLDERS Dear shareholders, Sales for the third quarter ended
HIGHLIGHTS CONSOLIDATED INCOME AND CASH FLOWS (4)
") HIGHLIGHTS VALENER INC. (in millions of dollars, except for share data, which is in Three months ended June 30 Nine months ended June 30 dollars, and unless otherwise indicated) 2016 2015 2016 2015 CONSOLIDATED
HIGHLIGHTS VALENER INC. (in millions of dollars, except for share data, which is in Three months ended June 30 Nine months ended June 30 dollars, and unless otherwise indicated) 2016 2015 2016 2015 CONSOLIDATED
2017 FIRST QUARTER INTERIM REPORT
 2017 FIRST QUARTER INTERIM REPORT INTERIM MANAGEMENT S DISCUSSION AND ANALYSIS March 31, 2017 Quarterly highlights 3 Preliminary comments to Management s discussion and analysis 4 Profile and description
FORACO INTERNATIONAL S.A. MANAGEMENT S DISCUSSION & ANALYSIS
 FORACO INTERNATIONAL S.A. MANAGEMENT S DISCUSSION & ANALYSIS Three-month and nine-month periods ended September 30, 2017 FORACO INTERNATIONAL S.A. MANAGEMENT S DISCUSSION AND ANALYSIS The following Management
Three-month period ended June 30, 2013 compared with the three-month period ended June 30, 2012
 MANAGEMENT S DISCUSSION & ANALYSIS Three-month period ended June 30, 2013 compared with the three-month period ended June 30, 2012 The following Management s Discussion and Analysis ( MD&A ) and the Company
Quarterly Management Report. First Quarter 2010
 Quarterly Management Report First Quarter 2010 INTERIM MANAGEMENT DISCUSSION and ANALYSIS For the Three Months Ended March 31, 2010 This interim Management Discussion and Analysis ( MD&A ) dated April
2018 FIRST QUARTER INTERIM REPORT
 2018 FIRST QUARTER INTERIM REPORT INTERIM MANAGEMENT S DISCUSSION AND ANALYSIS March 31, 2018 Quarterly highlights 3 Preliminary comments to Management s discussion and analysis 4 Profile and description
Press Release For immediate release
 Press Release For immediate release Uni-Select reports its first quarter of 2018 driven by The Parts Alliance contribution: Sales up 42.0% to $422.1 million of which The Parts Alliance contribution represented
INTERIM MANAGEMENT REPORT. Quarter 2012
 INTERIM MANAGEMENT REPORT nd Quarter 2012 SUMMARY 2 nd Quarter 2012 UNI-SELECT INC. MANAGEMENT REPORT, 1 st quarter 2012 Uni-Select recorded sales of $483 million (including over $337 million in the United
First Quarter Report
 First Quarter Report Summary Table of Facilities Facility Percentage Owned Installed Capacity (MW) Expected Annual Production (MW-hr) Electricity Purchaser Expiry of Power Purchase Agreement Saint-Paulin
Hydrogenics Corporation. Second Quarter 2013 Management s Discussion and Analysis of Financial Condition and Results of Operations
 Second Quarter 2013 Management s Discussion and Analysis of Financial Condition and Results of Operations This Management s Discussion and Analysis ( MD&A ) comments on the financial condition and operations
Brookfield Renewable Energy Partners L.P. Q INTERIM REPORT
 Brookfield Renewable Energy Partners L.P. Q3 2015 INTERIM REPORT TABLE OF CONTENTS Letter to Shareholders 1 Generation and Financial Review for the Three Months Ended September 30, 2015 10 Generation and
Forward-Looking Statements
 MANAGEMENT S DISCUSSION AND ANALYSIS For the three and six months ended June 30, 2013 Dated August 16, 2013 Management's Discussion and Analysis ( MD&A ) is intended to help shareholders, analysts and
Altus Group Reports First Quarter 2018 Financial Results
 Altus Group Reports First Quarter 2018 Financial Results Double-digit year-over-year growth in consolidated Revenues and Adjusted EBITDA TORONTO (May 3, 2018) - Altus Group Limited (ʺAltus Groupʺ or the
INTERIM MANAGEMENT DISCUSSION AND ANALYSIS FIRST QUARTER 2013
 Q1 INTERIM MANAGEMENT DISCUSSION AND ANALYSIS FIRST QUARTER 2013 SUMMARY - Uni-Select posted sales of $421.8 million during the quarter, a negative organic growth of 1.1%. Our operations were affected
Press Release FOR IMMEDIATE RELEASE
 Press Release FOR IMMEDIATE RELEASE DECEMBER 9, LAURENTIAN BANK REPORTS RECORD NET INCOME AND GROWTH FOR FISCAL RESULTS AND INCREASES ITS DIVIDEND Laurentian Bank of Canada s audited Consolidated Financial
INTERIM MANAGEMENT REPORT. Quarter 2012
 INTERIM MANAGEMENT REPORT 3 rd Quarter 2012 SUMMARY 3 rd Quarter 2012 During the quarter, Uni-Select established a distribution network consolidation plan ( optimization plan ) which also includes a revision
CanWel Building Materials Group Ltd.
 Management s Discussion and Analysis July 27, 2011 This Management s Discussion and Analysis ( MD&A ) provides a review of the significant developments that have impacted (the Company ), the successor
Press Release For immediate release
 Uni-Select reports growth in sales and EBITDA (1) for its Q4 and full year 2017: Press Release For immediate release Sales up 42.6% to $415.0 million in Q4 and up 21.0% to $1,448.3 million for 2017 due
Quarterly Report Ending December 31, 2016 TAIGA BUILDING PRODUCTS LTD. Q3 Financial Highlights. Sales $277.4 million. Earnings Per Share $0.
 Quarterly Report Ending 2016 TAIGA BUILDING PRODUCTS LTD Q3 Financial Highlights Sales $277.4 million Earnings Per Share $0.00 Net Income/(Loss) ($0.2) million EBITDA $7.4 million Management's Discussion
Average butter market is the average daily price for Grade AA Butter traded on the CME, used as the base price for butter. 4
 We are presenting the results for the first quarter of fiscal 2018, which ended on June 30, 2017. Net earnings totalled $200.3 million, an increase of $23.6 million or 13.4%. Earnings before interest,
Q Interim Financial Report for the Period Ended March 25, 2017
 Interim Financial Report for the Period Ended March 25, Q1 Revenue (in millions of Canadian dollars) 2014 2015 March 62.7 60.4 64.9 60.1 June 78.7 89.3 79.6 September 93.9 115.9 103.1 December 86.9 92.4
MANAGEMENT S DISCUSSION & ANALYSIS FOR THE THREE AND NINE MONTHS ENDED NOVEMBER 30, 2018
 MANAGEMENT S DISCUSSION & ANALYSIS FOR THE THREE AND NINE MONTHS ENDED NOVEMBER 30, TABLE OF CONTENTS ABOUT URANIUM PARTICIPATION CORPORATION 2 URANIUM INDUSTRY OVERVIEW 2 OVERALL PERFORMANCE 3 ADDITIONAL
MANAGEMENT S DISCUSSION AND ANALYSIS For the Year ended September 30, 2017 Dated: December 28, 2017
 MANAGEMENT S DISCUSSION AND ANALYSIS For the Year ended, 2017 Dated: December 28, 2017 MANAGEMENT S DISCUSSION & ANALYSIS This Management s Discussion and Analysis ( MD&A ) presents management s view of
Interim Financial Report First quarter ended September 30, 2018
 Interim Financial Report First quarter ended September 30, 2018 www.h2oinnovation.com investor@h2oinnovation.com Trading symbols: TSX Venture: HEO Alternext: MNEMO: ALHEO OTCQX: HEOFF MANAGEMENT S DISCUSSION
Linamar Delivers Another Solid Quarter of Strong Earnings and Cash Flow, Major EV Business Win Sets Stage for Future
 Linamar Delivers Another Solid Quarter of Strong Earnings and Cash Flow, Major EV Business Win Sets Stage for Future August 2, 2017, Guelph, Ontario, Canada (TSX: LNR) Sales increase 6.6% over the second
Double Digit Growth Again Drives Record Sales and Earnings at Linamar, Diversification Strategy Paying Dividends
 Double Digit Growth Again Drives Record Sales and Earnings at Linamar, Diversification Strategy Paying Dividends August 7, 2018, Guelph, Ontario, Canada (TSX: LNR) Sales increase 22.1% over the second
SUPREMEX ANNOUNCES Q4 AND 2017 YEAR-END RESULTS AND DECLARES REGULAR QUARTERLY DIVIDEND
 SUPREMEX ANNOUNCES Q4 AND 2017 YEAR-END RESULTS AND DECLARES REGULAR QUARTERLY DIVIDEND PRESS RELEASE Montreal, Quebec, February 21, 2018 Supremex Inc. ( Supremex or the Company ) (TSX: SXP), a leading
Q I N T E R I M R E P O R T. Brookfield Renewable Partners L.P.
 Q2 2017 I N T E R I M R E P O R T Brookfield Renewable Partners L.P. OUR OPERATIONS We manage our facilities through operating platforms in North America, Colombia, Brazil, and Europe which are designed
DOLLARAMA REPORTS FOURTH QUARTER AND FISCAL YEAR 2018 RESULTS
 For immediate distribution DOLLARAMA REPORTS FOURTH QUARTER AND FISCAL YEAR RESULTS Diluted net earnings per share increased by 17% during the fourth quarter Quarterly cash dividend increased to $0.12
INTERIM FINANCIAL REPORT
 Constellation Software Inc. INTERIM FINANCIAL REPORT First Quarter Fiscal Year 2010 For the three month period ended March 31, 2010 (UNAUDITED) CONSTELLATION SOFTWARE INC. MANAGEMENT S DISCUSSION AND ANALYSIS
Quarterly Report Ending June 30, 2016 TAIGA BUILDING PRODUCTS LTD. Q1 Financial Highlights. Sales $325.5 million. Earnings Per Share (loss) $0.
 $0.") Quarterly Report Ending June 30, 2016 TAIGA BUILDING PRODUCTS LTD Q1 Financial Highlights Sales $325.5 million Earnings Per Share (loss) $0.15 Net Income (loss) $4.8 million EBITDA $13.5 million Management's
Quarterly Report Ending June 30, 2016 TAIGA BUILDING PRODUCTS LTD Q1 Financial Highlights Sales $325.5 million Earnings Per Share (loss) $0.15 Net Income (loss) $4.8 million EBITDA $13.5 million Management's
MANAGEMENT S DISCUSSION AND ANALYSIS
 MANAGEMENT S DISCUSSION AND ANALYSIS This Management s Discussion and Analysis ( MD&A ) was prepared as of March 16, 2009. The purpose of this MD&A is to provide the reader with an overview of the financial
THE NORTH WEST COMPANY INC.
 THE NORTH WEST COMPANY INC. 2011 FIRST QUARTER REPORT TO SHAREHOLDERS Report to Shareholders The North West Company Inc. reports its results for the first quarter ending April 30, 2011 prepared under International
Aastra Reports Second Quarter Financial Results
 PRESS RELEASE For Immediate Release Aastra Reports Second Quarter Financial Results TORONTO, ONTARIO (July 27, 2006) -- Aastra Technologies Limited - (TSX: AAH ) today announced its unaudited financial
Financial and Operational Summary
 Choice Properties Real Estate Investment Trust Reports Results for the First Quarter Ended March 31, 2014 Continues to deliver solid, secure and predictable operating and financial performance Not for
Interim Financial Report for the Period Ended June 30, 2018 Q2 2018
 Interim Financial Report for the Period Ended June 30, Q2 Revenue (in millions of Canadian dollars) 2015 2016 March 60.4 64.9 60.1 82.4 June 89.3 79.6 101.9 149.2 September 115.9 103.1 168.3 December 92.4
DOLLARAMA REPORTS FIRST QUARTER RESULTS AND RENEWS NORMAL COURSE ISSUER BID
 For immediate distribution DOLLARAMA REPORTS FIRST QUARTER RESULTS AND RENEWS NORMAL COURSE ISSUER BID MONTREAL, Quebec, June 7, Dollarama Inc. (TSX: DOL) ( Dollarama or the Corporation ) today reported
MANAGEMENT S DISCUSSION AND ANALYSIS OF FINANCIAL CONDITION AND RESULTS OF OPERATIONS
 MANAGEMENT S DISCUSSION AND ANALYSIS OF FINANCIAL CONDITION AND RESULTS OF OPERATIONS For the Three and Nine Months Ended September 30, 2010 As of November 8, 2010 MANAGEMENT S DISCUSSION AND ANALYSIS
Message to Shareholders
 1 Interim Report Three-month period ended February 28, 1 Message to Shareholders We would like to present Richelieu s results for the first quarter ended February 28,. The Company achieved net earnings
Interim Report to Shareholders For the Three Months Ended March 31, Short Sea Shipping is OUR BUSINESS
 Interim Report to Shareholders For the Three Months Ended March 31, 2017 Short Sea Shipping is OUR BUSINESS Algoma Central Corporation Table of Contents General 1 Use of Non-GAAP Measures 1 Caution Regarding
Management's Discussion and Analysis
 Q2 Q2 FINANCIAL HIGHLIGHTS SALES 315.9 million NET INCOME 3.8 million EARNINGS PER SHARE 0.12 EBITDA 12.9 million Management's Discussion and Analysis For the three and six months ended 2012 and 2011 This
Three months ended June 30 Six months ended June Royalties $ 9,404 $ 0.71 $ 8,838 $ 0.66 $ 17,496 $ 1.31 $ 15,748 $ 1.
 For Immediate Release Brookfield Real Estate Services Fund Announces a $0.15 Increase in Annual Distributions, Second Quarter Results and Monthly Cash Distribution Royalties increased 6.4% Toronto, ON
MANAGEMENT S DISCUSSION AND ANALYSIS FOR THE 13 AND 26 WEEKS ENDED NOVEMBER 4, 2017
 MANAGEMENT S DISCUSSION AND ANALYSIS FOR THE 13 AND 26 WEEKS ENDED NOVEMBER 4, 2017 Forward-Looking Information... 1 Overview of the Business... 3 Food Retailing... 3 Summary Results Second Quarter...
MANAGEMENT S DISCUSSION AND ANALYSIS OF FINANCIAL CONDITION AND RESULTS OF OPERATIONS
 MANAGEMENT S DISCUSSION AND ANALYSIS OF FINANCIAL CONDITION AND RESULTS OF OPERATIONS For Three and Six Month Periods Ended June 30, 2007 As of August 13, 2007 MANAGEMENT S DISCUSSION AND ANALYSIS OF FINANCIAL
2018 First Quarter Report
 2018 First Quarter Report TABLE OF CONTENTS Management s Discussion & Analysis 01 Financial Highlights 02 Operating Highlights 03 Industry Statistics Results from Operations Consolidated Financial Statements
Quarterly Report Ending June 30, Sales $335.8 million. Earnings Per Share $0.05 Net Income $1.5 million. EBITDA $9.6 million
 Quarterly Report Ending June 30, 2013 TAIGA BUILDING PRODUCTS LTD. Q1 Financial Highlights Sales $335.8 million Earnings Per Share $0.05 Net Income $1.5 million EBITDA $9.6 million Management's Discussion
FORWARD LOOKING STATEMENTS AND DEFINITIONS 2 OUTSTANDING SHARE DATA 3 BUSINESS OVERVIEW THIRD QUARTER SUMMARY AND OUTLOOK 4
 MORNEAU SHEPELL MANAGEMENT S DISCUSSION AND ANALYSIS THREE AND NINE MONTHS ENDED SEPTEMBER 30, 2014 FORWARD LOOKING STATEMENTS AND DEFINITIONS 2 OUTSTANDING SHARE DATA 3 BUSINESS OVERVIEW 3 2014 THIRD
Altus Group Reports Second Quarter 2018 Financial Results
 Altus Group Reports Second Quarter 2018 Financial Results Altus Group continues to deliver on its key strategic imperatives with investments in cloud and growth in Property Tax TORONTO (August 7, 2018)
Press Release FOR IMMEDIATE RELEASE
 Press Release FOR IMMEDIATE RELEASE September 2, LAURENTIAN BANK REPORTS NET INCOME OF 30.1 MILLION FOR THE THIRD QUARTER OF Highlights of the third quarter Net income of 30.1 million, up 5% from 28.7
DOLLARAMA REPORTS STRONG RESULTS FOR FOURTH QUARTER AND FULL YEAR FISCAL 2017
 For immediate distribution DOLLARAMA REPORTS STRONG RESULTS FOR FOURTH QUARTER AND FULL YEAR FISCAL 24% increase in quarterly diluted net earnings per common share 10% increase in quarterly cash dividend
CAUTIONARY STATEMENT REGARDING FORWARD-LOOKING INFORMATION
 Management s Discussion and Analysis of Financial Results For the three and six months ended June 30, 2018 and 2017 ADVISORIES The following Management s Discussion and Analysis of Financial Results (
Sales $379.8 million Earnings Per Share $0.16. Net Income $5.0 million EBITDA $14.3 million
 Quarterly Report Ending June 30, 2017 TAIGA BUILDING PRODUCTS LTD Q1 Financial Highlights Sales $379.8 million Earnings Per Share $0.16 Net Income $5.0 million EBITDA $14.3 million Management's Discussion
MANAGEMENT S DISCUSSION & ANALYSIS FOR THE THREE AND NINE MONTHS ENDED NOVEMBER 30, 2017
 MANAGEMENT S DISCUSSION & ANALYSIS FOR THE THREE AND NINE MONTHS ENDED NOVEMBER 30, TABLE OF CONTENTS ABOUT URANIUM PARTICIPATION CORPORATION 2 URANIUM INDUSTRY OVERVIEW 2 OVERALL PERFORMANCE 4 ADDITIONAL
Q2 Financial Highlights
 Q2 Financial Highlights Sales $383.6 million Earnings Per Share $0.17 Net Income $5.7 million EBITDA $13.7 million Quarterly Report Ending 2014 Management's Discussion and Analysis For the three and six
INTERIM MANAGEMENT DISCUSSION AND ANALYSIS SECOND QUARTER 2013
 Q2 INTERIM MANAGEMENT DISCUSSION AND ANALYSIS SECOND QUARTER 2013 SUMMARY The Corporation completed a formal review of strategic alternatives centered on its US automotive operations to unlock additional
NEWS RELEASE WEST FRASER TIMBER CO. LTD. ( WFT ) Monday, October 22, West Fraser Announces Third Quarter Results
 Monday, October 22, West Fraser Announces Third Quarter Results") 858 Beatty Street Suite 501 Vancouver, B.C. Canada V6B 1C1 Telephone: (604) 895-2700 Fax: (604) 681-6061 NEWS RELEASE WEST FRASER TIMBER CO. LTD. ( WFT ) Monday, October 22, 2018 West Fraser Announces
858 Beatty Street Suite 501 Vancouver, B.C. Canada V6B 1C1 Telephone: (604) 895-2700 Fax: (604) 681-6061 NEWS RELEASE WEST FRASER TIMBER CO. LTD. ( WFT ) Monday, October 22, 2018 West Fraser Announces
2O16 FIRST QUARTERLY REPORT
 2O16 FIRST QUARTERLY REPORT Intertape Polymer Group Inc. Management s Discussion and Analysis Consolidated Quarterly Statements of Earnings Three month periods ended (In thousands of US dollars, except
TRANSALTA CORPORATION
 Management's Discussion and Analysis TRANSALTA CORPORATION Second Quarter Report for 2018 This Management s Discussion and Analysis ( MD&A ) contains forward-looking statements. These statements are based
ATLAS ENGINEERED PRODUCTS REPORTS RECORD QUARTERLY AND ANNUAL REVENUES AT YEAR-END FISCAL 2018
 ! ATLAS ENGINEERED PRODUCTS REPORTS RECORD QUARTERLY AND ANNUAL REVENUES AT YEAR-END FISCAL 2018 Reports Year Over Year Revenue Growth of 43.6% to $11.6 Million September 21, 2018 - Nanaimo, British Columbia.
FORTRESS GLOBAL ENTERPRISES INC. CONDENSED CONSOLIDATED STATEMENTS OF FINANCIAL POSITION (Canadian dollars, amounts in thousands)
") CONDENSED CONSOLIDATED STATEMENTS OF FINANCIAL POSITION (Canadian dollars, amounts in thousands) Note December 31, ASSETS Current Cash and cash equivalents 24,118 40,877 Restricted cash 7,937 7,790 Trade
CONDENSED CONSOLIDATED STATEMENTS OF FINANCIAL POSITION (Canadian dollars, amounts in thousands) Note December 31, ASSETS Current Cash and cash equivalents 24,118 40,877 Restricted cash 7,937 7,790 Trade
PRESS RELEASE RELEASE DATE: May 2, 2017
 5N Plus Reports Financial Results for the First Quarter Ended March 31, 2017 PRESS RELEASE RELEASE DATE: May 2, 2017 Montreal, Québec, May 2, 2017 5N Plus Inc. (TSX:VNP) ( 5N Plus, the Group or the Company
NEWS RELEASE WEST FRASER TIMBER CO. LTD. ( WFT ) Thursday, February 14, West Fraser Announces Fourth Quarter Results
 Thursday, February 14, West Fraser Announces Fourth Quarter Results") 858 Beatty Street Suite 501 Vancouver, B.C. Canada V6B 1C1 Telephone: (604) 895-2700 Fax: (604) 681-6061 NEWS RELEASE WEST FRASER TIMBER CO. LTD. ( WFT ) Thursday, February 14, 2013 West Fraser Announces
858 Beatty Street Suite 501 Vancouver, B.C. Canada V6B 1C1 Telephone: (604) 895-2700 Fax: (604) 681-6061 NEWS RELEASE WEST FRASER TIMBER CO. LTD. ( WFT ) Thursday, February 14, 2013 West Fraser Announces
DOLLARAMA REPORTS THIRD QUARTER RESULTS
 For immediate distribution DOLLARAMA REPORTS THIRD QUARTER RESULTS MONTREAL, Quebec, December 6, Dollarama Inc. (TSX: DOL) ( Dollarama or the Corporation ) today reported year over year increases in sales,
POLARIS INFRASTRUCTURE INC. Management s Discussion and Analysis For the Three and Nine Months Ended September 30, 2018 November 6, 2018
 INTRODUCTORY COMMENTS General The following management s discussion and analysis ( MD&A ) focuses on significant factors that affected Polaris Infrastructure Inc. and its subsidiaries ( Polaris Infrastructure,
INVESTOR PRESENTATION. August 2016
 INVESTOR PRESENTATION August 2016 CAUTIONARY NOTE Certain statements contained in this presentation may be forward-looking within the meaning of applicable securities laws. Such forward-looking statements
Three and six-month periods ended November 30, Second Quarter Report
 Three and six-month periods ended November 30, 2010 Second Quarter Report This of the operating results and the financial position is intended to assist readers in understanding 5N Plus Inc. ( the Company
Condensed Consolidated Interim Financial Statements of MAXIM POWER CORP. For the Third Quarter ended September 30, 2018.
 Condensed Consolidated Interim Financial Statements of MAXIM POWER CORP. For the Third Quarter ended September 30, 2018 (Unaudited) NOTICE OF NO AUDITOR REVIEW OF INTERIM FINANCIAL STATEMENTS Under National
OPERATING RESULTS (in thousands of dollars, except per share amounts) IFRS IFRS IFRS IFRS IFRS (1) (15 months) (Restated)
 IFRS IFRS IFRS IFRS IFRS (1) (15 months) (Restated)") 0 FINANCIAL HIGHLIGHTS OPERATING RESULTS (in thousands of dollars, except per share amounts) 2016 2015 2014 2013 IFRS IFRS IFRS IFRS IFRS (1) (15 months) (Restated) Sales $523,659 $565,173 $538,975 $610,587
0 FINANCIAL HIGHLIGHTS OPERATING RESULTS (in thousands of dollars, except per share amounts) 2016 2015 2014 2013 IFRS IFRS IFRS IFRS IFRS (1) (15 months) (Restated) Sales $523,659 $565,173 $538,975 $610,587
Management's Discussion and Analysis
 Q3 Q3 FINANCIAL HIGHLIGHTS SALES 247.7 million NET INCOME 0.4 million EARNINGS PER SHARE 0.01 EBITDA 7.1 million Management's Discussion and Analysis For the three and nine months ended 2012 and 2011 This
Rogers Sugar Inc. HIGHER SUGAR VOLUME FOR THE QUARTER AND YEAR-TO-DATE
 Rogers Sugar Inc. Press release 3 rd Quarter Results HIGHER SUGAR VOLUME FOR THE QUARTER AND YEAR-TO-DATE IMPROVED MAPLE PRODUCTS ADJUSTED GROSS MARGIN PERCENTAGE FOR THE QUARTER AND YEAR-TO-DATE As a
TRINIDAD DRILLING 2017 THIRD QUARTER REPORT 2017 THIRD QUARTER REPORT
 TRINIDAD DRILLING 2017 THIRD QUARTER REPORT 2017 THIRD QUARTER REPORT TABLE OF CONTENTS 01 Management s Discussion & Analysis 02 Financial Highlights 03 Operating Highlights 07 Industry Statistics 11 Results
Brookfield Renewable Partners
 Brookfield Renewable Partners PRESS RELEASE BROOKFIELD RENEWABLE REPORTS STRONG THIRD QUARTER RESULTS All amounts in US dollars unless otherwise indicated BROOKFIELD, News, November 1, 2017 Brookfield
Chairman s Report to Unitholders
 Chairman s Report to Unitholders On behalf of the Trustees of the A&W Revenue Royalties Income Fund (the Fund), I am pleased to report the results of the year ended December 31, 2016. The Fund enjoyed
Third Quarter 2018 Financial Results Conference Call. August 30 th, 2018
 Third Quarter 2018 Financial Results Conference Call August 30 th, 2018 Presenters Agenda Performance highlights and strategic execution Chris Fowler, President & CEO Performance highlights Execution of
FIRST-QUARTER REPORT NORTHLAND POWER INC. Gemini Offshore wind. Ontario Solar Solar. North Battleford Combined cycle. Mont Louis Onshore wind
 Thorold Cogeneration Mont Louis Onshore wind North Battleford Combined cycle Ontario Solar Solar Gemini Offshore wind Q1 FIRST-QUARTER REPORT Quarterly Report for the period ended March 31, 2016 NORTHLAND