Forterra Investor Presentation. November 2018
|
|
|
- Jonathan Cooper
- 5 years ago
- Views:
Transcription

1 1 Forterra Investor Presentation November 2018
2 Disclaimer 2 Forward Looking Statements This presentation contains forward looking statements within the meaning of Section 27A of the Securities Act of 1933, as amended, and Section 21E of the Securities Exchange Act of 1934, as amended.forward looking statements may be identified by the use of words such as "anticipate", "believe", "expect", "estimate", "plan", "outlook", and "project" and other similar expressions that predict or indicate future events or trends or that are not statements of historical matters. Forward looking statements should not be read as a guarantee of future performance or results, and will not necessarily be accurate indications of the times at, or by, which such performance or results will be achieved. Forward looking statements are based on historical information available at the time the statements are made and are based on management's reasonable belief or expectations with respect to future events, and are subject to risks and uncertainties, many of which are beyond the Company's control, that could cause actual performance or results to differ materially from the belief or expectations expressed in or suggested by the forward looking statements. Forwardlooking statements speak only as of the date on which they are made and the Company undertakes no obligation to update any forward looking statement to reflect future events, developments or otherwise, except as may be required by applicable law. Investors are referred to the Company's filings with the Securities and Exchange Commission, including its Annual Report on Form 10 K, as updated by any quarterly reporting on Form 10 Q, for additional information regarding the risks and uncertainties that may cause actual results to differ materially from those expressed in any forwardlooking statement. Industry Data We use market data and industry forecasts throughout this presentation. Unless otherwise indicated, statements in this presentation concerning our industries and the markets in which we operate, including our general expectations, competitive position, business opportunity and market size, growth and share, are based on publicly available information, periodic industry publications and surveys, government surveys and reports, and reports by market research firms. We have not independently verified market data and industry forecasts provided by any of these third party sources, although we believe such market data and industry forecasts included in this presentation are reliable. This information cannot always be verified with complete certainty due to the limits on the availability and reliability of raw data, the voluntary nature of the data gathering process and other limitations and uncertainties inherent in surveys of market size. Management estimates are derived from the information and data referred to above, as well as our internal research, calculations and assumptions made by us based on our analysis of such information and data and our knowledge of our industries and markets, which we believe to be reasonable, although they have not been independently verified. While we believe that the market position information included in this presentation is generally reliable, such information is inherently imprecise. Assumptions, expectations and estimates of our future performance and the future performance of the industries and markets in which we operate are necessarily subject to a high degree of uncertainty and risk due to a variety of factors, including those described in our filings with the Securities and Exchange Commission. These and other factors could cause results to differ materially from those expressed in the estimates made by the independent parties and by us.
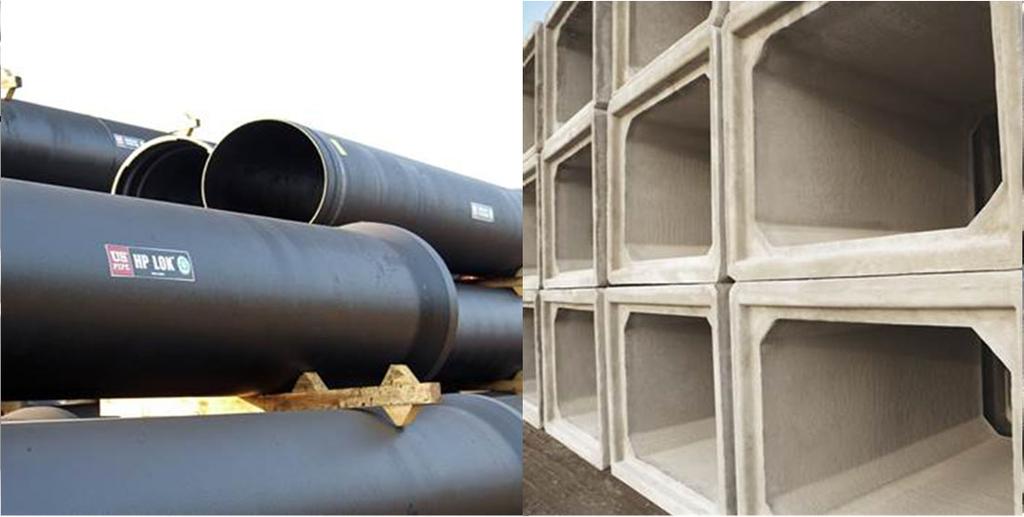
3 Company Overview 3 A leading pure play water infrastructure manufacturer 2017 Net Sales by Business Segment Two complementary businesses: Drainage Pipe & Products and Water Pipe & Products Production facilities strategically located to serve the U.S. and Eastern Canadian markets Diversified exposure across products and end markets Significant product breadth and innovation serving broad end market and customer needs 53% Drainage Pipe & Products 47% Water Pipe & Products 2017 Net Sales by End Market 35% 40% 25% Drainage Pipe & Products Water Pipe & Products Residential Infrastructure Non-residential


4 Industry Leading Position in Both Business Segments 4 Drainage Pipe & Products 2017 Net Sales by End Market Water Pipe & Products 2017 Net Sales by End Market 47% 33% Residential Non-residential 23% 47% Residential Non-residential 20% Infrastructure 30% Infrastructure Largest producer of concrete drainage pipe and precast products in the U.S. and Eastern Canada based on sales Primarily used for stormwater and wastewater systems Key Drivers: Highway infrastructure construction Stormwater and wastewater infrastructure Residential housing starts Largest producer of ductile iron pipe ( DIP ) in the U.S. based on sales Primarily used to transport potable water Key Drivers: Residential housing starts Water supply construction spend Municipal infrastructure spending

 U.S.")
 and potential for further municipal infrastructure growth State funding initiatives put in place over")

5 Market Fundamentals Support Organic Growth 5 INFRASTRUCTURE RESIDENTIAL COMMERCIAL (Non-Residential) U.S. infrastructure spending as a percentage of GDP has declined steadily since 2009 and remains near a 35 year low Anticipate accelerating pace of Fixing America s Surface Transportation Act 4 ( FAST Act ) and potential for further municipal infrastructure growth State funding initiatives put in place over the last two years, such as Texas Proposition 7 and California Senate Bill 1, support expectations of growth in infrastructure spending Annual U.S. housing starts remain below the peak of past cycles - in spite of a relatively long economic recovery Expectations for continued growth in housing starts in 2018 and 2019 supported by a healthy U.S. labor market, benefit of U.S. tax reform and pent-up demand across much of the U.S. Certain areas of non-residential construction are expected to see continued growth in 2018 and 2019, including warehouse construction that is supported by e-commerce activity and office construction supported by broad downtown market development in many larger cities Anticipated benefit of U.S. tax reform on investments in U.S. operations (1) Sources: U.S. Census Bureau and Dodge 2018 Construction Outlook 4


6 Drainage Pipe & Products Platform is a One-Stop Shop 6 Bio Clean Stormwater bio filtration systems provide a wide range of customized solutions to address municipal stormwater separation and filtration needs Highly engineered and designed to meet a wide range of applications Bridge products Precast concrete bridges used for roadways, pedestrian walkways, small tunnels and crossings Highly engineered, custom designed and manufactured for each location Inlet structures Provides inlet into a storm drain pipeline Box culverts Primarily used for high stormwater applications Rectangular pipe allows for shallow cover and easy paving Utility structures Used by utility companies for access and inspection points, as well as installation of critical equipment Each utility company typically has its own design Manholes Used as access / inspection points and to change direction in pipelines Stormwater drainage and sanitary sewer applications End treatments Finishes and secures the ends of drainage pipe, box culverts and bridge sections Designed to function together with conduit to provide a sound, functional and permanent structure Concrete pipe High volume product used primarily for stormwater drainage Standardized engineering designs used for various installation depths and traffic loads


7 Water Pipe & Products 7


8 Unrivaled Product Breadth 8 Unrivaled breadth of product offering, combined with a broad geographic reach, serving the needs of both contractors and distributors across both the drainage and water pipe business segments Drainage Pipe and Products Water Pipe & Products 1 Drainage Pipe Stormwater Precast Structures Ductile Iron Pipe Fabrication / Fittings Other Regional Players Limited scale, product offering and geographic reach Source: Company websites. 1 Products listed, and associated key competitors, reflect Forterra s primary product offerings in its Water Pipe & Products segment and exclude other alternative products, and associated competitors, such as PVC pipe and larger diameter concrete and steel pipe used in potable water and wastewater applications.

9 Commitment to Our Employees 9 Our commitment to delivering shareholder value starts with our commitment to our employees, our customers, the environment and the communities in which we operate Forterra leads with safety with a relentless focus on continuous improvement in our processes and our training our recordable and lost time injury rates are less than half of the industry average 1 Corporate culture centered upon integrity, trust and mutual respect we are committed to diversity, and our code of conduct is supported by a formalized and continuous training program 1 Based on 2015, 2016 and 2017 recordable and lost time injury rates as compared to relevant industry metrics as tracked by the Bureau of Labor Statistics


10 Commitment to the Environment and our Customers 10 Our commitment to delivering shareholder value starts with our commitment to our employees, our customers, the environment and the communities in which we operate Our focus on sustainability starts with using natural and recycled materials in our precast concrete and ductile iron pipe products We work closely with our customers to support their LEED project credits through our products that minimize site disturbance during installation and provide environmentally friendly and long-lasting service Our Bio Clean stormwater management products provide a wide range of environmental benefits to our customers and our communities including stormwater filtration, water retention and clean ground-water recharge


11 Commitment to Community Our commitment to delivering shareholder value starts with our commitment to our employees, our customers, the environment and the communities in which we operate Forterra is committed to supporting our communities through the contribution of our time, our products and other financial resources to support their longterm health and sustainability 11


12 Focus on Innovation 12 Enhancing Value through Focus on Innovation PRODUCTION Driving increased operational efficiency through lean manufacturing initiatives COST Investing in efficiency projects, leveraging procurement and standardizing processes INNOVATION CUSTOMERS Delivering products and solutions that best meet the evolving needs of our customers PORTFOLIO MANAGEMENT Building well structured markets where Forterra can flourish
13 Key Financial Metrics Third Quarter and Year to Date Period Ended September 30, ($ in millions) DRAINAGE PIPE & PRODUCTS WATER PIPE & PRODUCTS CORPORATE TOTAL FORTERRA Q Q Q Q Q Q Q Q Net Sales $ $ $ $ $ $ $ $ Gross Profit (0.3) (0.6) EBITDA (4.1) (14.9) (18.4) Adjusted EBITDA 2 $ 55.6 $ 49.2 $ 19.0 $ 28.4 (13.1) (15.6) $ 61.6 $ 61.9 Gross Profit Margin 23.6% 20.9% 10.4% 15.8% n/a n/a 17.7% 18.5% Adjusted EBITDA Margin 22.9% 19.8% 9.9% 14.5% n/a n/a 14.2% 13.9% YTD 2018 YTD 2017 YTD 2018 YTD 2017 YTD 2018 YTD 2017 YTD 2018 YTD 2017 Net Sales $ $ $ $ $ $ $ 1,140.6 $ 1,219.2 Gross Profit (0.5) (1.9) EBITDA (40.5) (66.7) Adjusted EBITDA 2 $ $ $ 51.0 $ 75.8 (41.1) (58.0) $ $ Gross Profit Margin 21.5% 17.8% 10.3% 14.7% n/a n/a 16.4% 16.1% Adjusted EBITDA Margin 20.3% 16.6% 9.8% 12.9% n/a n/a 11.9% 10.0% Key Factors Influencing Year over Year EBITDA and Adjusted EBITDA: DRAINAGE 4 Higher average sales prices Benefit of cost controls from the operational excellence and procurement initiatives More efficient management structure WATER $10 million adjusted EBITDA impact from downtime at Bessemer facility in Q associated with a significant upgrade Higher cost of scrap, labor and freight not yet offset by an increase in the average selling price for ductile iron pipe CORPORATE Lower professional fee expenses and cost controls 1 For purposes of evaluating segment profit, the Company s chief operating decision maker reviews EBITDA as a basis for making the decisions to allocate resources and assess performance 2 Adjusted EBITDA is a non-gaap measure. See the appendix for a reconciliation thereof to net income, the most directly comparable GAAP measure. 4
14 Outlook and Expectations 14 Q GUIDANCE Expect Adjusted EBITDA to be in the range of $30 to $35 million 1 as compared to Q Adjusted EBITDA of $29.3 million 2 DRAINAGE Results will be impacted by significant shipment delays already realized in October 2018 due to record rainfall in Texas, Hurricane Michael in Florida and the carry-over effect of Hurricane Florence on Forterra s CP&P joint venture WATER Results in Water are expected to be in line with the prior year quarter Adjusted EBITDA of $18 million CORPORATE Corporate Adjusted EBITDA losses are expected to be approximately $15 million Full Year 2018 GUIDANCE 4 Expect Adjusted EBITDA to be in the range of $166 to $171 million 1 as compared to full year 2017 Adjusted EBITDA of $151.8 million 1 For purposes of evaluating segment profit, the Company s chief operating decision maker reviews EBITDA as a basis for making the decisions to allocate resources and assess performance 2 Adjusted EBITDA is a non-gaap measure. See the appendix for a reconciliation thereof to net income, the most directly comparable GAAP measure. 4

15 Appendix 15
16 Non GAAP Financial Measures 16 In addition to our results calculated under generally accepted accounting principles in the United States ("GAAP"), in this presentation we also present consolidated EBITDA, adjusted EBITDA, consolidated EBITDA margin and adjusted EBITDA margin, each of which is a non-gaap financial measure presented as a supplemental measure of financial performance that is not required by, or presented in accordance with, GAAP. The Company calculates (i) consolidated EBITDA as net income/(loss) after adjusting for (earnings)/loss from discontinued operations and before interest expense, income tax benefit (expense), and depreciation and amortization; (ii) adjusted EBITDA as EBITDA before impairment and exit charges, (gains)/losses on the sale of property, plant and equipment, impairment & restructuring charges, transaction costs, inventory step-up impacting margin, and other income and expenses as outlined and described in detail in the adjusted EBITDA reconciliation slide; (iii) consolidated EBITDA margin represents consolidated EBITDA as a percentage of net sales; and (iv) adjusted EBITDA margin represents adjusted EBITDA as a percentage of net sales. Consolidated EBITDA, adjusted EBITDA, consolidated EBITDA margin and adjusted EBITDA margin are presented in this presentation because they are important metrics used by management as one of the means by which it assesses the Company s financial performance. There non-gaap financial measures are also frequently used by analysts, investors and other interested parties to evaluate companies in the Company s industry. The Company uses these non-gaap financial measures as supplements to GAAP measures of performance to evaluate the effectiveness of its business strategies, to make budgeting decisions, to allocate resources and to compare its performance relative to its peers. These non-gaap financial measures are also important for assessing the Company s operating results and evaluating each operating segment s performance on a consistent basis, by excluding the impacts of depreciation, amortization, income tax expense, interest expense and other items not indicative of ongoing operating performance. Additionally, these non-gaap financial measures, when used in conjunction with related GAAP financial measures, provide investors with additional financial analytical framework which management uses, in addition to historical operating results, as the basis for financial, operational and planning decisions and present measurements that third parties have indicated are useful in assessing the Company and its results of operations. However, these non-gaap financial measures have certain limitations. Consolidated EBITDA and adjusted EBITDA should not be considered as alternatives to net income and consolidated EBITDA margin and adjusted EBITDA margin should not be considered as an alternative to gross margin, or in the case of any of the non-gaap measures, as measures of financial performance or any other performance measure derived in accordance with GAAP. Additionally, these non-gaap financial measures are not intended to be liquidity measures because of certain limitations such as: (i) they do not reflect our cash outlays for capital expenditures or future contractual commitments; (ii) they do not reflect changes in, or cash requirements for, working capital; (iii) they do not reflect interest expense, or the cash requirements necessary to service interest, or principal payments, on indebtedness; (iv) they do not reflect income tax expense or the tax necessary to pay income taxes; and (v) although depreciation and amortization are non-cash charges, the assets being depreciated and amortized will often have to be replaced in the future, and these non-gaap measures do not reflect cash requirements for such replacements. Other companies, including other companies in the Company s industry, may not use these non-gaap financial measures, or may calculate one or more of the measures differently than as presented in this presentation, limiting their usefulness as a comparative measure. In evaluating any non-gaap financial measure, you should be aware that in the future the Company will incur expenses that are the same as or similar to some of the adjustments made in the calculations below and the presentation of these non-gaap financial measures should not be construed to mean that the Company s future results will be unaffected by such adjustments. Management compensates for these limitations by using these non-gaap measures as supplemental financial metrics and in conjunction with results prepared in accordance with GAAP.
17 Adjusted EBITDA Reconciliation Three Months and Nine Months Ended September 30, 2018 and September 30, ($ in thousands) Q Q YTD 2018 YTD 2017 Net income / (loss) $5,503 ($11,502) ($7,413) ($45,218) Interest expense 21,940 15,582 52,993 46,202 Depreciation & amortization 25,922 29,158 79,370 87,463 Income tax benefit 2,793 (8,454) 6,351 (25,448) EBITDA 1 56,158 24, ,301 62,999 (Gain) loss on sale of property, plant & equipment, net (2,447) 1,749 Impairment & exit charges 3 2,170 1,193 3,891 13,004 Transaction costs ,553 2,243 6,291 Inventory step-up impacting margin ,151 Loss on divestitures 6 31,606 31,606 Non-cash compensation 7 1,450 1,444 4,588 2,688 Other (gains) expenses 8 (679) (6,688) (1,217) Earnings from equity method investee 9 (2,224) (2,936) (7,745) (9,449) Pro-rata share of Adjusted EBITDA from equity method investee 10 3,221 4,026 10,198 12,671 Adjusted EBITDA $61,574 $61,940 $135,805 $122,493 % margin 14.2% 13.9% 11.9% 10.0% Gross Profit $77,136 $82,107 $186,814 $196,670 % margin 17.8% 18.5% 16.4% 16.1% Note Description (1) For purposes of evaluating segment profit, the Company s chief operating decision maker reviews EBITDA as a basis for making the decisions to allocate resources and assess performance (2) (Gain) loss on sale of property, plant and equipment, primarily related to the disposition of manufacturing equipment (3) Impairment or abandonment of long-lived assets and other exit charges (4) Legal, valuation, accounting, advisory and other costs related to business combinations and other transactions (5) Effect of the purchase accounting step-up in the value of inventory to fair value recognized in cost of goods sold as a result of business combinations and other transactions (6) Loss on divestiture of U.S. concrete and steel pressure pipe business and other disposed sites for the periods presented, net of specific items for which adjustments are separately made elsewhere in the calculation of adjusted EBITDA presented herein (7) Non-cash equity based compensation expense (8) Other (gains) losses, including the non-cash again on a divestiture completed in January 2018 and gains on insurance proceeds related to the destruction of property (9) Net income from Forterra s 50% ownership in the Concrete Pipe & Precast LLC ( CP&P ) joint venture accounted for under the equity method of accounting (10) Adjusted EBITDA from Forterra s 50% ownership in the CP&P joint venture. Calculated as CP&P net income adjusted primarily to add back Forterra s pro-rata portion of CP&P s depreciation and amortization and interest expense.
18 Segment Adjusted EBITDA Reconciliation Three and Nine Months Ended September 30, 2018 and September 30, (Dollars in thousands) Drainage Pipe & Products Water Pipe & Products Q Q Corporate and Other Total Drainage Pipe & Products Water Pipe & Products Corporate and Other EBITDA 1 $53,271 $17,818 ($14,931) $56,158 $47,342 ($4,144) ($18,414) $24,784 (Gain) loss on sale of property, plant & equipment, net 2 (14) (75) 680 (50) 555 Impairment & exit charges ,599 2, ,193 Transaction costs ,553 1,553 Inventory step-up impacting margin Loss on divestitures 6 31,606 31,606 Non-cash compensation (157) 1,197 1, ,444 Other (gains) expenses (401) - (404) (275) (679) Earnings from equity method investee 9 (2,224) (2,224) (2,936) (2,936) Pro-rata share of Adjusted EBITDA from equity method investee 10 3,221 3,221 4,026 4,026 Adjusted EBITDA $55,636 $18,997 ($13,059) $61,574 $49,156 $28,400 ($15,616) $61,940 YTD 2018 YTD 2017 (Dollars in thousands) Drainage Pipe & Products Water Pipe & Products Corporate and Other Total Drainage Pipe & Products Water Pipe & Products Corporate and Other EBITDA 1 $122,841 $48,923 ($40,463) $131,301 $98,832 $30,881 ($66,714) $62,999 (Gain) loss on sale of property, plant & equipment, net 2 (3,419) 972 (2,447) (4) 1,753 1,749 Impairment & exit charges 3 1,733 2,166 (8) 3,891 (14) 12, ,004 Transaction costs 4 2,243 2,243 6,291 6,291 Inventory step-up impacting margin ,151 2,151 Loss on divestitures 6 31,606 31,606 Non-cash compensation 7 1, ,097 4, ,889 2,688 Other (gains) expenses (1,270) (5,937) (6,688) (942) (275) (1,217) Earnings from equity method investee 9 (7,745) (7,745) (9,449) (9,449) Pro-rata share of Adjusted EBITDA from equity method investee 10 10,198 10,198 12,671 12,671 Adjusted EBITDA $125,876 $50,997 ($41,068) $135,805 $104,641 $75,822 ($57,970) $122,493 Total Total Note Description (1) For purposes of evaluating segment profit, the Company s chief operating decision maker reviews EBITDA as a basis for making the decisions to allocate resources and assess performance (2) (Gain) loss on sale of property, plant and equipment, primarily related to the disposition of manufacturing equipment (3) Impairment or abandonment of long-lived assets and other exit charges (4) Legal, valuation, accounting, advisory and other costs related to business combinations and other transactions (5) Effect of the purchase accounting step-up in the value of inventory to fair value recognized in cost of goods sold as a result of business combinations and other transactions (6) Loss on divestiture of U.S. concrete and steel pressure pipe business and other disposed sites for the periods presented, net of specific items for which adjustments are separately made elsewhere in the calculation of adjusted EBITDA presented herein (7) Non-cash equity based compensation expense (8) Other (gains) losses, including the non-cash again on a divestiture completed in January 2018 and gains on insurance proceeds related to the destruction of property (9) Net income from Forterra s 50% ownership in the Concrete Pipe & Precast LLC ( CP&P ) joint venture accounted for under the equity method of accounting (10) Adjusted EBITDA from Forterra s 50% ownership in the CP&P joint venture. Calculated as CP&P net income adjusted primarily to add back Forterra s pro-rata portion of CP&P s depreciation and amortization and interest expense.
19 Reconciliation of Net Income to Adjusted EBITDA Guidance for Q and Full Year ($ in millions) Q Guidance Full Year 2018 Guidance Low High Low High Net Income ($18.0) ($15.0) ($25.4) ($22.4) Interest expense Income tax expense (3.0) (1.0) Depreciation and amortization Other EBITDA adjustments Adjusted EBITDA $30.0 $35.0 $165.8 $170.8
20 Reconciliation of Net Income to Adjusted EBITDA Guidance for Q and Full Year ($ in millions) Q Full Year 2017 Net income / (loss) $43.2 ($2.1) Interest expense Depreciation & amortization Income tax benefit (15.2) (40.7) EBITDA Loss on sale of property, plant & equipment, net Impairment & exit charges Transaction costs Inventory step-up impacting margin Loss on divestitures Non-cash compensation Change in tax receivable agreement liability 8 (45.4) (46.2) Other (gains) expenses (0.1) Earnings from equity method investee 10 (2.9) (12.4) Pro-rata share of Adjusted EBITDA from equity method investee Adjusted EBITDA $29.3 $151.8 Note Description (1) For purposes of evaluating segment profit, the Company s chief operating decision maker reviews EBITDA as a basis for making the decisions to allocate resources and assess performance (2) (Gain) loss on sale of property, plant and equipment, primarily related to the disposition of manufacturing equipment (3) Impairment or abandonment of long-lived assets and other exit charges (4) Legal, valuation, accounting, advisory and other costs related to business combinations and other transactions (5) Effect of the purchase accounting step-up in the value of inventory to fair value recognized in cost of goods sold as a result of business combinations and other transactions (6) Loss on divestiture of U.S. concrete and steel pressure pipe business and other disposed sites for the periods presented, net of specific items for which adjustments are separately made elsewhere in the calculation of adjusted EBITDA presented herein (7) Non-cash equity based compensation expense (8) Adjustments to the estimated value of the tax receivable agreement due primarily to the December 2017 Tax Cuts and Jobs Act (9) Other (gains) losses, including the non-cash again on a divestiture completed in January 2018 and gains on insurance proceeds related to the destruction of property (10) Net income from Forterra s 50% ownership in the Concrete Pipe & Precast LLC ( CP&P ) joint venture accounted for under the equity method of accounting (11) Adjusted EBITDA from Forterra s 50% ownership in the CP&P joint venture. Calculated as CP&P net income adjusted primarily to add back Forterra s pro-rata portion of CP&P s depreciation and amortization and interest expense.
First Quarter 2019 Earnings Presentation February 6, 2019
 First Quarter 2019 Earnings Presentation February 6, 2019 Cautionary statements This presentation contains forward-looking statements that are subject to known and unknown risks and uncertainties, many
Investor Presentation April 18, 2019
 Investor Presentation April 18, 2019 Forward-Looking Statements This presentation contains forward-looking statements within the meaning of the safe harbor provisions of the Private Securities Litigation
Where Intelligence Meets Infrastructure
 Where Intelligence Meets Infrastructure Earnings Conference Call For The Fourth Quarter and Year Ended September 30, 2018 November 6, 2018 These slides are not intended to be a stand-alone presentation,
Q Earnings Presentation
 TUBULAR & ENERGY SERVICES CONSTRUCTION PRODUCTS RAIL PRODUCTS & SERVICES www.lbfoster.com Q2 2017 Earnings Presentation August 3, 2017 Safe Harbor Statement This presentation and oral statements regarding
2018 SUPPLEMENTAL INFORMATION. February 12, 2019
 2018 SUPPLEMENTAL INFORMATION February 12, 2019 DISCLAIMER Statement Regarding Safe Harbor for Forward-Looking Statements This presentation may contain forward-looking statements that is, information related
Investor Presentation
 Investor Presentation November 2016 November 2016 May 2017 Disclosures This presentation contains forward-looking statements as that term is defined in the Private Securities Litigation Reform Act of 1995.
Second Quarter 2018 Earnings Presentation May 8, 2018
 Second Quarter 2018 Earnings Presentation May 8, 2018 Cautionary statements This presentation contains forward-looking statements that are subject to known and unknown risks and uncertainties, many of
First Quarter 2016 Earnings
 First Quarter 2016 Earnings Disclaimer Forward-Looking Statements This presentation contains forward-looking statements within the meaning of the Federal Private Securities Litigation Reform Act of 1995.
Fourth Quarter and FY 2018 Earnings Presentation November 28, 2018
 Fourth Quarter and FY 2018 Earnings Presentation November 28, 2018 Cautionary statements This presentation contains forward-looking statements that are subject to known and unknown risks and uncertainties,
Q Earnings Presentation. November 1, 2018
 November 1, 2018 Safe Harbor Statement This presentation and oral statements regarding the subject matter may contain forward-looking statements within the meaning of the United States Private Securities
Q Earnings Presentation May 1, 2018
 May 1, 2018 Safe Harbor Statement This presentation and oral statements regarding the subject matter may contain forward-looking statements within the meaning of the United States Private Securities Litigation
Q Investors Presentation
 Q2 2017 Investors Presentation Forward Looking Statements and Non-GAAP Measures This presentation contains information about management's view of the Company's future expectations, plans and prospects
Conference Call Presentation
 Conference Call Presentation First Quarter Ended September 24, 207 (Unaudited Results) Cautionary Statement on Forward-Looking Statements Certain statements included herein contain forward-looking statements
Fourth Quarter and FY 2017 Earnings Presentation November 29, 2017
 Fourth Quarter and FY 2017 Earnings Presentation November 29, 2017 Cautionary statements This presentation contains forward-looking statements that are subject to known and unknown risks and uncertainties,
2018 RBC Capital Markets Global Industrials Conference September 8, 2018
 2018 RBC Capital Markets Global Industrials Conference September 8, 2018 Safe Harbor and Non-GAAP Financial Metrics Certain statements in this presentation may be deemed to be forward-looking. These statements
Fourth Quarter and Full Year 2016 Results. November 2016
 Fourth Quarter and Full Year 2016 Results November 2016 March November 27, 2017 2016 Disclosures This presentation contains forward-looking statements as that term is defined in the Private Securities
FOUNDATION. TRANSFORMATION. VALUE. Basic Materials Conference Longbow Research. March 1, 2016 New York, NY
 FOUNDATION. TRANSFORMATION. VALUE. Basic Materials Conference Longbow Research March 1, 2016 New York, NY www.martinmarietta.com Disclaimer Statement Regarding Safe Harbor for Forward-Looking Statements
First Quarter Fiscal 2019 Financial Results
 First Quarter Fiscal 2019 Financial Results Management Presenters Scott Barbour President and Chief Executive Officer Scott Cottrill Executive Vice President, Chief Financial Officer and Secretary Mike
BAML Leveraged Finance Conference. November 2017
 BAML Leveraged Finance Conference November 2017 1 Important Information About Ryerson Holding Corporation These materials do not constitute an offer or solicitation to purchase or sell securities of Ryerson
L.B. FOSTER REPORTS FOURTH QUARTER AND FULL YEAR OPERATING RESULTS
 Exhibit 99.1 News Release L.B. FOSTER REPORTS FOURTH QUARTER AND FULL YEAR OPERATING RESULTS PITTSBURGH, PA, February 27, 2018 L.B. Foster Company (NASDAQ: FSTR), a leading manufacturer and distributor
Advanced Drainage Systems Announces Fourth Quarter and Fiscal 2018 Results
 NEWS RELEASE Advanced Drainage Systems Announces Fourth Quarter and Fiscal 2018 Results 5/29/2018 HILLIARD, Ohio--(BUSINESS WIRE)-- Advanced Drainage Systems, Inc. (NYSE:WMS) ( ADS or the Company ), a
Vulcan Announces Fourth Quarter 2015 Results
 NEWS RELEASE Vulcan Announces Fourth Quarter 2015 Results 2/4/2016 EPS from Continuing Operations Increases Sharply to $0.69 per Share Aggregates Volume Up 8% and Price Up 11% BIRMINGHAM, Ala., Feb. 4,
Advanced Drainage Systems Announces First Quarter Fiscal 2019 Results
 NEWS RELEASE Advanced Drainage Systems Announces First Quarter Fiscal 2019 Results 8/9/2018 HILLIARD, Ohio--(BUSINESS WIRE)-- Advanced Drainage Systems, Inc. (NYSE: WMS) ( ADS or the Company ), a leading
Investor Presentation
 Investor Presentation Fall 2016 the beautiful door NYSE: DOOR Safe Harbor / Non-GAAP Financial Measures SAFE HARBOR / FORWARD LOOKING STATEMENT This investor presentation contains forward-looking information
1Q 2018 Supplemental Information for Earnings Conference Call
 1Q 2018 Supplemental Information for May 3, 2018 Aggregates Essential Material Valuable Asset I M P O R TA N T D I S C L O S U R E S F o r w a r d L o o k i n g S t a t e m e n t s This document contains
Third Quarter 2018 Earnings Presentation & Remarks
 Third Quarter 2018 Earnings Presentation & Remarks November 1, 2018 1 Forward-looking Statements These slides and remarks are being provided to assist readers in understanding the results of operations,
2012 Earnings Highlights. Earnings Conference Call, February 14, 2013
 2012 Earnings Highlights Earnings Conference Call, February 14, 2013 Important Disclosure Notes Forward Looking Statements This document contains forward-looking statements. Statements that are not historical
2017 Robert W. Baird Global Industrial Conference
 2017 Robert W. Baird Global Industrial Conference NYSE: CVA NOVEMBER 2017 Cautionary Statements All information included in this earnings presentation is based on continuing operations, unless otherwise
Investor Meetings December 11, 2017
 Investor Meetings December 11, 2017 Forward-Looking Statements This presentation contains forward-looking statements within the meaning of the Private Securities Litigation Reform Act of 1995. When used
1Q18 EARNINGS PRESENTATION NYSE: DOOR
 1Q18 EARNINGS PRESENTATION NYSE: DOOR Safe Harbor / Non-GAAP Financial Measures SAFE HARBOR / FORWARD LOOKING STATEMENT This press release contains forward-looking information and other forward-looking
EARNINGS PRESENTATION
 EARNINGS PRESENTATION Fourth Quarter & Full Year 2017 Aleris Corporation March 19, 2018 Forward-Looking and Other Information IMPORTANT INFORMATION This information is current only as of its date and may
Business Combination of Skyline Corporation and Champion Homes Creating the Nation s Largest Publicly Traded Factory-Built Housing Company
 Business Combination of Skyline Corporation and Champion Homes Creating the Nation s Largest Publicly Traded Factory-Built Housing Company January 25, 2018 Disclaimer Forward-Looking Statements Statements
4Q16 Earnings Presentation
 TUBULAR & ENERGY SERVICES CONSTRUCTION PRODUCTS RAIL PRODUCTS & SERVICES www.lbfoster.com 4Q16 Earnings Presentation March 2, 2017 Safe Harbor Statement This presentation and oral statements regarding
3Q 18 Earnings Call Presentation NOVEMBER 1, 2018
 3Q 18 Earnings Call Presentation NOVEMBER 1, 2018 1 Important Disclaimer This presentation contains certain statements and information that may constitute forward-looking statements within the meaning
UNITED STATES STEEL CORPORATION REPORTS FOURTH QUARTER AND FULL-YEAR 2017 RESULTS
 NEWS RELEASE CONTACTS: Media Meghan Cox Manager Corporate Communications T - (412) 433-6777 E - mmcox@uss.com Investors/Analysts Dan Lesnak General Manager Investor Relations T - (412) 433-1184 E - dtlesnak@uss.com
XYLEM INC. Q EARNINGS RELEASE FEBRUARY 1, 2018
 XYLEM INC. Q4 2017 EARNINGS RELEASE FEBRUARY 1, 2018 Q4 2017 EARNINGS RELEASE FORWARD-LOOKING STATEMENTS This presentation contains information that may constitute forward-looking statements. Forward-looking
Horizon Global Third Quarter 2017 Earnings Presentation
 Horizon Global Third Quarter 2017 Earnings Presentation October 31, 2017 Q1 2016 Earnings 1 Safe Harbor Statement Forward-Looking Statements This presentation may contain "forward-looking statements" as
Third Quarter 2018 Earnings Call
 Third Quarter 2018 Earnings Call October 25, 2018 Nick Zarcone President & Chief Executive Officer Varun Laroyia Executive Vice President & Chief Financial Officer Joe Boutross Vice President, Investor
Forward-looking Statement Disclosure
 Third Quarter 2017 Earnings Call Presentation Valmont Industries. Inc. 2017 Investor Day Forward-looking Statement Disclosure These slides contain (and the accompanying oral discussion will contain) forwardlooking
2018 Jefferies Consumer Conference June 19, Trevor Lang EVP and Chief Financial Officer
 2018 Jefferies Consumer Conference June 19, 2018 Trevor Lang EVP and Chief Financial Officer Forward-Looking Statements This presentation and the associated webcast contain forward-looking statements,
Second Quarter 2016 Earnings
 Second Quarter 2016 Earnings Disclaimer Forward-Looking Statements This presentation contains forward-looking statements within the meaning of the Federal Private Securities Litigation Reform Act of 1995.
Driving Value Through Culture, Innovation and Results
 Driving Value Through Culture, Innovation and Results THIRD QUARTER 2018 EARNINGS PRESENTATION November 2, 2018 1 Agenda Introduction Business Overview Financial Overview Roger Hendriksen Director, Investor
KeyBanc Capital Markets Basic Materials and Packaging Conference. September 2017
 KeyBanc Capital Markets Basic Materials and Packaging Conference September 2017 1 Important Information About Ryerson Holding Corporation These materials do not constitute an offer or solicitation to purchase
Q Earnings Presentation March 1, 2019
 Q4 2018 Earnings Presentation March 1, 2019 * Safe Harbor Statement The following information contains, or may be deemed to contain, forward-looking statements (as defined in the U.S. Private Securities
Why Vulcan. Investor Presentation March 10, 2015
 Why Vulcan Investor Presentation What we aim to offer investors 1 2 3 4 A domestic pure play aggregates business with several years of doubledigit revenue growth potential Shipment growth with recovery
AquaVenture Holdings Limited Announces Second Quarter 2017 Earnings Results
 Press Release investors@aquaventure.com Investors Hotline: 855-278-WAAS (9227) FOR IMMEDIATE RELEASE August 9, 2017 AquaVenture Holdings Limited Announces Second Quarter 2017 Earnings Results (Tampa, Fla.)
Pentair KeyBanc Capital Markets Industrial, Automotive & Transportation Conference
 Pentair KeyBanc Capital Markets Industrial, Automotive & Transportation Conference John L. Stauch Chief Financial Officer May30, 2013 PENTAIR FORWARD-LOOKING STATEMENTS CAUTION CONCERNING FORWARD-LOOKING
November 1, Q Earnings Presentation
 November 1, 2018 Q3 2018 Earnings Presentation Certain statements contained in this presentation that are not historical facts, including any statements as to future market conditions, results of operations,
Ceridian Reports Second Quarter 2018 Results
 Ceridian Reports Second Quarter 2018 Results Cloud revenue of $127.8 million, up 35.5% year-over-year Total revenue of $179.3 million, up 13.8% year-over-year Operating loss of $11.3 million, which includes
Daseke, Inc. Consolidating the Flatbed & Specialized Logistics Market Acquisition Conference Call December 6 th, 2017
 Daseke, Inc. Consolidating the Flatbed & Specialized Logistics Market Acquisition Conference Call December 6 th, 2017 Important Disclaimers Forward-Looking Statements This presentation includes forward-looking
2018 FOURTH QUARTER EARNINGS CALL
 NORTH AMERICA S LEADING BUILDING MATERIALS DISTRIBUTOR RESIDENTIAL COMMERCIAL INTERIOR SOLAR 2018 FOURTH QUARTER EARNINGS CALL Forward Looking Statements / Non-GAAP Measures This presentation contains
First Quarter Fiscal 2019 Business Review & Outlook. November 8, 2018
 ` First Quarter Fiscal 2019 Business Review & Outlook November 8, 2018 Safe Harbor Statement Safe Harbor Statement Certain statements contained in this presentation release constitute forward-looking statements
Ceridian Reports First Quarter 2018 Results
 Ceridian Reports First Quarter 2018 Results Cloud revenue of $125.2 million, up 38.0% year-over-year Total revenue of $208.9 million, up 11.7% year-over-year HCM operating profit of $27.3 million, up 150.5%
BMC STOCK HOLDINGS, INC. Second Quarter 2018 Earnings Presentation July 30, BMC. All Rights Reserved.
 BMC STOCK HOLDINGS, INC. Second Quarter 2018 Earnings Presentation July 30, 2018 2018 BMC. All Rights Reserved. CLICK Disclaimer TO EDIT TITLE This presentation contains "forward-looking statements" within
Third Quarter 2014 Earnings Slides
 Third Quarter 2014 Earnings Slides November 6, 2014 Dial-in: 877-407-3982 Passcode: 13593706 Disclaimer / Safe Harbor Disclaimer This presentation may include "forward-looking statements" within the meaning
Atkore International Group Inc. Announces Third Quarter 2018 Results
 Atkore International Group Inc. Announces Third Quarter 2018 Results Diluted earnings per share increased by $0.29 to $0.70; net income per diluted share increased by $0.37 to $0.86 Net income increased
Masonite International Investor Presentation NYSE: DOOR
 Masonite International Investor Presentation NYSE: DOOR Spring 2015 Safe Harbor / Non-GAAP Financial Measure SAFE HARBOR / FORWARD LOOKING STATEMENT This investor presentation contains forward-looking
GENESCO INC. CHIEF FINANCIAL OFFICER S COMMENTARY FISCAL YEAR 2019 FOURTH QUARTER ENDED FEBRUARY 2, 2019
 GENESCO INC. CHIEF FINANCIAL OFFICER S COMMENTARY FISCAL YEAR 2019 FOURTH QUARTER ENDED FEBRUARY 2, 2019 Discontinued Operations On December 14, 2018, the Company entered into a definitive agreement for
Investor Update September / October 2017
 Investor Update September / October 2017 [Beacon logo] Forward Looking Statements and Non-GAAP Measures This presentation contains forward-looking statements within the meaning of the Private Securities
Investor Presentation. Second Quarter 2018 NASDAQ: BECN BECN
 Investor Presentation Second Quarter 2018 BECN 1 Disclosures Forward Looking Statements and Non-GAAP Measures This presentation contains forward-looking statements within the meaning of the Private Securities
BAIRD 2018 GLOBAL INDUSTRIAL CONFERENCE NOVEMBER 7, Bob Bauer President and CEO Jim Maloney SVP, CFO and Treasurer
 BAIRD GLOBAL INDUSTRIAL CONFERENCE NOVEMBER 7, Bob Bauer President and CEO Jim Maloney SVP, CFO and Treasurer Safe Harbor Statement This presentation and oral statements regarding the subject matter may
Comfort Systems USA (NYSE: FIX) November 13, 2012
 November 13, 2012") Comfort Systems USA (NYSE: FIX) November 13, 2012 Disclosures Safe Harbor Certain statements and information in this presentation may constitute forward-looking statements within the meaning of the Private
Comfort Systems USA (NYSE: FIX) November 13, 2012 Disclosures Safe Harbor Certain statements and information in this presentation may constitute forward-looking statements within the meaning of the Private
Q2 FY17 Results April 26, 2017
 Q2 FY17 Results April 26, 2017 Steve Voorhees Chief Executive Officer Ward Dickson Chief Financial Officer Jim Porter President, Business Development and Latin America Jeff Chalovich President, Corrugated
Daseke, Inc. Consolidating North America s Flatbed & Specialized Logistics Market
 Daseke, Inc. Consolidating North America s Flatbed & Specialized Logistics Market Investor Presentation September 2017 Important Disclaimers Non-GAAP Financial Measures This presentation includes non-gaap
D.A. Davidson & Co. Engineering & Construction Conference September 20, 2017 Chicago, IL
 D.A. Davidson & Co. Engineering & Construction Conference September 20, 2017 Chicago, IL Alaskan Way Viaduct (SR-99) Replacement Project, Seattle Forward-Looking Statements Statements contained in this
Atkore International Group Inc. Announces Fourth Quarter 2018 Results. Fiscal 2018 Highlights
 Atkore International Group Inc. Announces Fourth Quarter Results Fiscal Highlights Net income per diluted share increased 95% from $1.27 to $2.48; Net income per diluted share increased $1.13 to $2.78
Investor Presentation December Alaskan Way Viaduct (SR-99) Replacement Project, Seattle
 Replacement Project, Seattle") Investor Presentation December 2017 Alaskan Way Viaduct (SR-99) Replacement Project, Seattle Forward-Looking Statements Statements contained in this presentation that are not purely historical are forward-looking
Investor Presentation December 2017 Alaskan Way Viaduct (SR-99) Replacement Project, Seattle Forward-Looking Statements Statements contained in this presentation that are not purely historical are forward-looking
First Quarter 2012 Earnings Results. April 26, 2012
 First Quarter 2012 Earnings Results April 26, 2012 Important Disclosure Notes Forward Looking Statements Certain matters discussed in this presentation, including expectations regarding future performance,
4Q15 Earnings Presentation
 1 www.lbfoster.com 4Q15 Earnings Presentation March 1, 2016 2 Safe Harbor Statement This presentation and oral statements regarding the subject matter may contain forwardlooking statements within the meaning
3 rd Quarter 2013 Earnings Presentation
 Click to edit Master title style 3 rd Quarter 203 Earnings Presentation November 6 th, 203 Click Disclaimers to edit Master title style IMPORTANT INFORMATION This information is current only as of its
VENTAS REPORTS 2015 THIRD QUARTER RESULTS
 Ventas, Inc. 353 North Clark Street, Suite 3300 Chicago, Illinois 60654 (877) 4-VENTAS www.ventasreit.com Contact: (877) 4-VENTAS Ryan K. Shannon VENTAS REPORTS 2015 THIRD QUARTER RESULTS Reported Normalized
First-Quarter 2017 Supplemental Financial Information. May 2, 2017
 First-Quarter 2017 Supplemental Financial Information May 2, 2017 Disclaimer Statement Regarding Safe Harbor for Forward-Looking Statements This presentation may contain forward-looking statements that
Goodman Global, Inc. JPMorgan Small / Mid Cap Conference November 14, 2006
 Goodman Global, Inc. JPMorgan Small / Mid Cap Conference November 14, 2006 1 Company overview Goodman Goodman is a leading HVAC manufacturer $1.8 billion in annual sales A growing position in a growing
Third Quarter & 2017 Nine Month Results
 Third Quarter & 2017 Nine Month Results Gary E. Robinette Chairman & Chief Executive Officer Shawn K. Poe Chief Financial Officer Agenda Third Quarter Review & Nine Month Results Gary Robinette Financial
GCP Applied Technologies
 GCP Applied Technologies Q3 2017 Investor Highlights November 2, 2017 Forward Looking Statements This document contains, and our other public communications may contain, forward-looking statements, that
Kraton Performance Polymers, Inc.
 Kraton Performance Polymers, Inc. Third Quarter 2015 Earnings Conference Call October 29, 2015 Forward Looking Statement Disclaimer This presentation includes forward looking statements that reflect our
Quad/Graphics, Inc. Benchmark Company, LLC One-on-One Investor Conference May 31 st, 2012
 Quad/Graphics, Inc. Benchmark Company, LLC One-on-One Investor Conference May 31 st, 2012 Quad/Graphics Overview 2 Our Facts 3 Global provider of print and related multichannel solutions for Marketers
Second Quarter 2017 Earnings Call
 Second Quarter 2017 Earnings Call July 27, 2017 Nick Zarcone President & Chief Executive Officer & Chief Financial Officer Michael Clark Vice President- Finance and Controller Joe Boutross Director, Investor
Stifel 2017 Industrials Conference
 Stifel 2017 Industrials Conference NYSE: CVA JUNE 2017 Cautionary Statements All information included in this earnings presentation is based on continuing operations, unless otherwise noted. Forward-Looking
Q %; 7.1% Q3 106%; 61% Q3 EPS
 At Home Group Inc. Announces Third Quarter Fiscal 2018 Financial Results Q3 net sales grew 25%; comparable store sales increased 7.1% Q3 operating income rose 106%; adjusted operating income 1 increased
WILLIS GROUP HOLDINGS FACT BOOK FOR THE QUARTER ENDED JUNE 30, 2010
 WILLIS GROUP HOLDINGS FACT BOOK FOR THE QUARTER ENDED JUNE 30, 2010 Willis snapshot Leading global insurance broker Broad range of professional insurance, reinsurance, risk management, financial and human
LEADERSHIP GROWTH MOMENTUM THROUGH STRENGTH
 Investor Presentation March 2017 Safe Harbor and Non-GAAP Financial Metrics Certain statements in this presentation may be deemed to be forward-looking statements within the meaning of Section 27A of the
FIRM CAPITAL AMERICAN REALTY PARTNERS CORP. CAPITAL PRESERVATION DISCIPLINED INVESTING MD&A MANAGEMENT DISCUSSION AND ANALYSIS
 FIRM CAPITAL AMERICAN REALTY PARTNERS CORP. CAPITAL PRESERVATION DISCIPLINED INVESTING MD&A MANAGEMENT DISCUSSION AND ANALYSIS FIRST QUARTER 2018 MARCH 31, 2018 FORWARD LOOKING STATEMENTS The following
2018 Q3. Brookfield Residential Properties Inc. September 30, 2018 Chief Executive Officer s Report
 Brookfield Residential Properties Inc. 2018 Q3, 2018 Chief Executive Officer s Report Brookfield Residential saw good results for the third quarter of 2018, despite continued challenges in the Canadian
2Q17 EARNINGS PRESENTATION NYSE: DOOR
 2Q17 EARNINGS PRESENTATION NYSE: DOOR Safe Harbor / Non-GAAP Financial Measures SAFE HARBOR / FORWARD LOOKING STATEMENT This investor presentation contains forward-looking information and other forward-looking
KRATON PERFORMANCE POLYMERS, INC. THIRD QUARTER 2012 EARNINGS CONFERENCE CALL. November 1, 2012
 KRATON PERFORMANCE POLYMERS, INC. THIRD QUARTER 2012 EARNINGS CONFERENCE CALL November 1, 2012 Forward-Looking Statement Disclaimer This presentation includes forward-looking statements that reflect our
Third Quarter 2018 Earnings I October 25, 2018
 Third Quarter 208 Earnings I October 25, 208 Forward-Looking Statements Certain statements in this presentation may be considered forward-looking statements. Words such as expects, anticipates, estimates,
Second Quarter 2016 Earnings Call
 Second Quarter 2016 Earnings Call July 28, 2016 Rob Wagman President & Chief Executive Officer Nick Zarcone Executive Vice President & Chief Financial Officer Joe Boutross Director, Investor Relations
MASONITE INTERNATIONAL CORPORATION REPORTS 2013 THIRD QUARTER AND YEAR TO DATE RESULTS
 Contact: Joanne Freiberger Vice President and Treasurer 813-739-1808 investorrelations@masonite.com MASONITE INTERNATIONAL CORPORATION REPORTS THIRD QUARTER AND YEAR TO DATE RESULTS (Tampa, FL, November
Helen of Troy Limited Reports Third Quarter Fiscal 2018 Results
 NEWS RELEASE Helen of Troy Limited Reports Third Quarter Fiscal 2018 Results 1/8/2018 Delivers Consolidated Net Sales Revenue Growth of 1.9%; Core Business Growth of 1.3% Reports GAAP Diluted Loss Per
Polypipe Group PLC. Full Year Results Year ended 31 December 2017
 Polypipe Group PLC Full Year Results Year ended 31 December 2017 Agenda 1 2 3 4 5 INTRODUCTION FINANCIAL REVIEW BUSINESS REVIEW STRATEGY SUMMARY & OUTLOOK Introduction Record performance in 2017 in line
FIRM CAPITAL AMERICAN REALTY PARTNERS CORP. CAPITAL PRESERVATION DISCIPLINED INVESTING MD&A MANAGEMENT DISCUSSION AND ANALYSIS
 FIRM CAPITAL AMERICAN REALTY PARTNERS CORP. CAPITAL PRESERVATION DISCIPLINED INVESTING MD&A MANAGEMENT DISCUSSION AND ANALYSIS FOURTH QUARTER 2017 DECEMBER 31, 2017 FORWARD LOOKING STATEMENTS The following
Williams Industrial Services Group Reports 37% Increase in Revenue for Third Quarter 2018
 Williams Industrial Services Group Reports 37% Increase in Revenue for Third Quarter 2018 November 9, 2018 Revenue increased 37% to $53.5 million driven by nuclear construction projects Gross margin was
Explanation of Non-GAAP Financial Measures
 Explanation of Non-GAAP Financial Measures We report our financial results in accordance with U. S. generally accepted accounting principles ( GAAP ). However, management believes that, in order to more
ECOLAB FOURTH QUARTER REPORTED DILUTED EPS $1.35 ADJUSTED DILUTED EPS $1.54, +12% 2019 ADJUSTED DILUTED EPS FORECAST $5.80 TO $6.
 News Release Ecolab Inc. 1 Ecolab Place, St. Paul, Minnesota 55102 FOR IMMEDIATE RELEASE Michael J. Monahan (651) 250-2809 Andrew C. Hedberg (651) 250-2185 ECOLAB FOURTH QUARTER REPORTED DILUTED EPS $1.35
Ceridian Reports Fourth Quarter and Full Year 2018 Results
 Ceridian Reports Fourth Quarter and Full Year Results Fourth quarter Cloud revenue of $148.3 million, up 27.5% year-over-year Fourth quarter total revenue of $200.3 million, up 9.8% year-over-year Excluding
KRATON PERFORMANCE POLYMERS, INC. FOURTH QUARTER 2012 EARNINGS CONFERENCE CALL. February 28, 2013
 KRATON PERFORMANCE POLYMERS, INC. FOURTH QUARTER 2012 EARNINGS CONFERENCE CALL February 28, 2013 Forward-Looking Statement Disclaimer This presentation includes forward-looking statements that reflect
Investor Presentation February Alaskan Way Viaduct (SR 99) Replacement Project, Seattle
 Replacement Project, Seattle") Investor Presentation February 2019 Alaskan Way Viaduct (SR 99) Replacement Project, Seattle Forward-Looking Statements Statements contained in this presentation that are not purely historical are forward-looking
Investor Presentation February 2019 Alaskan Way Viaduct (SR 99) Replacement Project, Seattle Forward-Looking Statements Statements contained in this presentation that are not purely historical are forward-looking
Q Investor Presentation. March 31, 2013
 Q2 2013 Investor Presentation March 31, 2013 Forward-Looking Information This presentation contains forward-looking statements. All forward-looking statements speak only as of the date of this presentation.
Q3 FY17 Results August 3, 2017
 Q3 FY17 Results August 3, 2017 Steve Voorhees Chief Executive Officer Ward Dickson Chief Financial Officer Jim Porter President, Business Development and Latin America Jeff Chalovich President, Corrugated