Scout24 AG FY 2016 Results Conference Call
|
|
|
- Amie Griffin
- 5 years ago
- Views:
Transcription


1 Scout24 AG FY 2016 Results Conference Call March 29, 2017
2 Disclaimer This document has been issued by Scout24 AG (the Company and, together with its direct and indirect subsidiaries, the "Group") and does not constitute or form part of and should not be construed as any offer or invitation to sell or issue, or any solicitation of any offer to purchase or subscribe for, any securities of the Company, nor shall any part of it nor the fact of its distribution form part of or be relied on in connection with any contract or investment decision, nor does it constitute a recommendation regarding the securities of the Company or any present or future member of the Group. All information contained herein has been carefully prepared. However, no reliance may be placed for any purposes whatsoever on the information contained in this document or on its completeness. No representation or warranty, express or implied, is given by or on behalf of the Company or any ofits directors, officers or employees or any other person as to the accuracy or completeness of the information or opinions contained in this document and no liability whatsoever is accepted by the Company or any of its directors, officers or employees nor any other person for any loss howsoever arising, directly or indirectly, from any use of such information or opinions or otherwise arising in connection therewith. The information contained in this presentation is subject to amendment, revision and updating. Certain statements, beliefs and opinions in this document are forward-looking, which reflect the Company s or, as appropriate, senior management s current expectations and projections about future events. By their nature, forward-looking statements involve a number of risks, uncertainties and assumptions that could cause actual results or events to differ materially from those expressed or implied by the forward-looking statements. These risks, uncertainties and assumptions could adversely affect the outcome and financial effects of the plans and events described herein. Statements contained in this document regarding past trends or activities should not be taken as a representation that such trends or activities will continue in the future. The Company does not undertake any obligation to update or revise any information contained in this presentation (including forward-looking statements), whether as a result of new information, future events or otherwise. You should not place undue reliance on forward-looking statements, which speak only as of the date of this document. This document is not an offer of securities for sale in the United States of America. Securities may not be offered or sold in the United States of America absent registration or an exemption from registration under the U.S. Securities Act of 1933, as amended. Neither this document nor any copy of it may be taken or transmitted into the United States of America, its territories or possessions or distributed, directly or indirectly, in the United States of America, its territories or possessions or to any US person. By attending, reviewing or consulting the presentation to which this document relates or by accepting this document you will be taken to have represented, warranted and undertaken that you have read and agree to comply with the contents of this notice. Nothing in this document constitutes tax advice. Persons should seek tax advice from their own consultants or advisors when making investment decisions. page 1
3 Key Operational Highlights We Continue to Be the Most Relevant Marketplace for BOTH our Customers and Consumers Record Listings Levels More than 3m active listings Record Traffic Levels Visits to core brands at constant high level +6% YoY 0.4m 0.9m +9% YoY 146m 148m 1.3m +7% YoY 0.5m -8% YoY December 2016 December 2016 We are further cementing our leading market positions 2.2x out of 10 engage through us on the go FY16 1.6x 2.2x FY15 1.4x 0.9x 0.9x 1.3x 1.2x 1.2x 1.2x 86m (59%) 97m (66%) IS24 AS24 DE AS24 IT AS24 NL AS24 BE IS24 AS Sources: Management estimates, Autobiz December2016, Yearly average on monthly traffic (sessions) measured by own traffic monitor (googly analytics). Mobile traffic as a percentage of total traffic (sessions). page 2
4 Key Financial Highlights Strong organic revenue growth sustainable profitability and robust & visible cash flows +12% +18% +20% % % % % 2015 Group Revenues Group ordinary operating EBITDA Group cash contribution 2 ooebitda margin Cash Conversion 2 Note: All figures in millions. 1. Ordinary operating (oo)ebitda represents EBITDA adjusted for non-operating and special effects, ordinary operating EBITDA margin of a segment is defined as ordinary operating EBITDA as a percentage of external segment revenues. 2. Cash contribution is defined as ooebitda less Capital expenditures, cash conversion as ooebitda / (ooebitda less Capital expenditures) page 3
5 # listings, in thousands ImmobilienScout24 Listings Traffic Monetization Innovation Listings position Listings per Customer x 1.5x 1.6x IS24 based on total customers +3% Dec 15 IS24 Dec combined comp. -10% Comp 2 Comp Dec 15 Mar 16 Jun 16 Sep 16 Dec 16 Dec 15 Dec 16 Combined Competitor Source: Management estimates, internal data. page 4
6 ImmobilienScout24 Listings Traffic Monetization Listings Innovation Dec (1.0) (0.8) June (0.2) Sept Excluding agents leaving the business, core agent number increasing slightly in Q Regain and new customer acquisitions outnumbering gross churn 17% increase in customer winback rate (based on monthly run rate) in Q compared to Q % increase in new customer acquisition rate in Q compared to Q Some agents switching back from professional PPA to membership model Number of agents leaving the business slightly higher in Q than in Q Dec 2016 Source: Management estimates, internal data. 1. No listings at any online sources 6 months after inactivation at IS24. (0.3) 17.4 Net loss/gain excl. Agents leaving the business 1 Agents leaving the business / inactive Agents page 5
7 ImmobilienScout24 Listings Traffic Monetization Innovation Traffic Evolution 1 (visits in millions) 37% Total: 72m +11% y-o-y growth 31% Total: 72m % = main sites = mobile sites and apps % Unique Visitors (2016) 2 Time Spent (2016) 2 (in millions) 4.0m 1.6x 6.4m 50% of the market visits IS24 ONLY 2 (in minutes) 2.6x 477m 73% audience share 3 180m 50% of the market visits IS24 ONLY 2 IWH IS24 IWH IS24 1. Management estimates, based on visits to the IS24 platform from mobile devices, mobile and all IS24 applications as measured by own traffic monitor (google analytics). 2. Based on average Unique Monthly Visitors ( UMV ) for traffic and total time spent for engagement in 2016, comscore MMX December 2016 (desktop only for traffic and desktop and mobile for engagement). In the July to October 2016 period, erroneous engagement (user activity) and in the June to September for UMV data were gathered for IS24. To measure engagement and UMV for IS24, the average for the January to May 2016 respectively June and November 2016 respectively October to December 2016 periods were applied. 3. Share based on total time spent within Germany competitor set for online property classifieds which includes IS24, Immonet and Immowelt. page 6
8 ImmobilienScout24 Listings Traffic Monetization Innovation ARPU Evolution (ARPU in /month) % Membership migration status % Membership migration mostly finalized in 2016; nonmembership products to expire by end of Q Q Given the Group s complex financial history, to facilitate year-on-year comparison and to better represent the business trends and situation of Scout24, additional, voluntary disclosure has been provided for the twelvemonth period ended December 31, These figures represent the sum of financials from the audited consolidated financial statements of Scout24 Holding GmbH for the short financial year from January 1, 2014 until March 31, 2014 and from the audited consolidated financial statements of Asa NewCo GmbH for the period of April 1, 2014 to December 31, % of Core Agents, targeted for migration, migrated to the membership model as per December 2016 page 7
9 Percentage of Core Agents ImmobilienScout24 Listings Traffic Monetization Innovation More and more of our core agents are recognizing our value proposition 30% 25% 20% ~60% of our core agents spent less than 500/month in % 10% 5% 2.5k core agent members spent more than 1,000/month, up 42% since % ,000 1,100 1,200 1,300 1,400 1,500 over Revenue per Core Agent / month 1,500 Sources: Internal customer database. Data as per December of the respective year. page 8


10 ImmobilienScout24 Listings Traffic Monetization Innovation Virtual Reality Viewings Take a tour at vr.immobilienscout24.de Property you might also like Lead-Engine/ Agent recommendation page 9
11 ImmobilienScout24 Wrap-Up What We Have Delivered What We Are Working On Membership migration near completion Drive VIA power usage and further expand ARPU Increased listings market share Continue to roll-out regional product and pricing strategy Successfully implemented initiatives to improve sales performance Drive sales force performance Successful roll-out of major product innovations Support product innovations with marketing page 10
12 Listings Monetization AutoScout24 Focus on Germany Strengthening Market Positioning Core Dealer Locations 1 Listings 2 +10% 22,298 24,421 1,206 1,286 ( 000) +7% Dec 2015 Dec 2016 Dec 2015 Dec 2016 Traffic 3 (visits in millions) 50% Total: 42m % +17% y-o-y growth = main sites = mobile sites and apps 37% Total: 42m % Direct German traffic partially re-directed to Eastern European language versions supporting the German market (ARPU in /month) Q Q Management estimates, based on internal data. 2. Autobiz, December Management estimates, based on visits to the AS24 platform from mobile devices, mobile and all AS24 applications as measured by own traffic monitor (google analytics). 4. Given the Group s complex financial history, to facilitate year-on-year comparison and to better represent the business trends and situation of Scout24, additional, voluntary disclosure has been provided for the twelvemonth period ended December 31, These figures represent the sum of financials from the audited consolidated financial statements of Scout24 Holding GmbH for the short financial year from January 1, 2014 until March 31, 2014 and from the audited consolidated financial statements of Asa NewCo GmbH for the period of April 1, 2014 to December 31, page 11
13 Monetization Listings AutoScout24 Focus on Italy & Benelux Cementing our Leadership Positions Core Dealer Locations 1 Listings 2 +7% 18, % Listings growth 1.3 vs. #2 17, % Listings growth x vs. #2 ( 000) +13% +11% Listings growth Dec 2015 Dec x vs. #2 Dec 2015 Dec 2016 (visits in millions) 43% +14% y-o-y growth 37% Traffic 3 Total: 35m 57% = main sites = mobile sites and apps Total: 36m 63% (ARPU in /month) Q Q Management estimates, based on internal data. 2. Autobiz, December 2016, deduplicated for AS24 and AutoTrader.nl. 3. Management estimates, based on visits to the AS24 platform from mobile devices, mobile and all AS24 applications as measured by own traffic monitor (google analytics). 4. Given the Group s complex financial history, to facilitate year-on-year comparison and to better represent the business trends and situation of Scout24, additional, voluntary disclosure has been provided for the twelvemonth period ended December 31, These figures represent the sum of financials from the audited consolidated financial statements of Scout24 Holding GmbH for the short financial year from January 1, 2014 until March 31, 2014 and from the audited consolidated financial statements of Asa NewCo GmbH for the period of April 1, 2014 to December 31, page 12


14 AutoScout24 Listings Traffic Monetization Innovation Car Valuation Express Car sale New Car seamless integration page 13
15 AutoScout24 Wrap-Up What We Have Delivered What We Are Working On Successfully implemented and proofed new sales approach Benelux and Italy Execute on sales strategy to further cement leadership position Rollout Marketing Power pricing model completed Further increase penetration of Marketing power products and monetize market leading position Creating tangible USPs/ differentiation points vs. our competition in Germany Further leverage USPs to further narrow traffic and content gap vs. mobile.de Fully integrated AutoTrader.nl Drive monetization of leadership position page 14


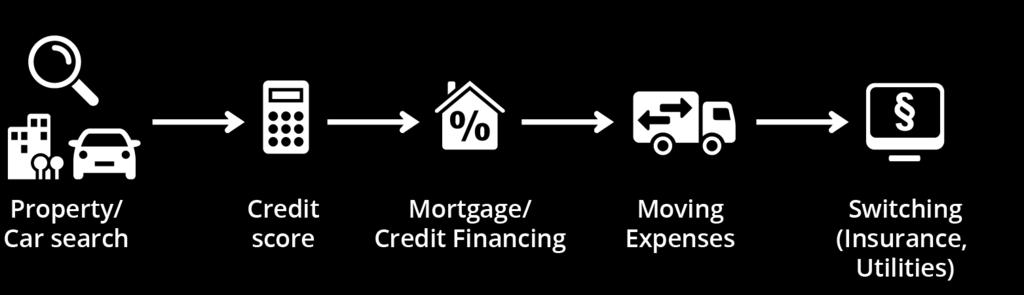
16 Scout24 Media Well Positioned for Further Growth Along Value-Chains Revenue growth 2016 page 15

17 Financial Review
18 Group Strong organic growth and sustainable profitability Revenues (in m) growth y-o-y 10% 24% growth y-o-y 12% 26% 7% 5% Q Q AS24 IS24 Corporate other ordinary operating EBITDA 49% 43% growth y-o-y 27% 48% % 225 growth y-o-y 18% Q Q xx% ooebitda margin page 17
19 ImmobilienScout24 Platform for Continued Growth External Revenues (in m) Q Q Other revenues Other Agent revenues ordinary operating EBITDA 62% 57% growth y-o-y 5% 7% 9% 3% Core Agent revenues % % 179 growth y-o-y 7% 11% 5% 5% Key highlights Core Agent revenues Revenue growth driven by solid ARPU increase partially offset by decreasing core agent numbers Other Agent revenues Slight increase in Professional PPA revenues as well as healthy growth in Austrian marketplace Other revenues Increase reflecting healthy revenue growth in adjacent businesses combined with a positive contribution in private listing revenues ooebitda Operational leverage, IT cost efficiencies and phasing of marketing spending driving margin increase Q Q xx% ooebitda margin page 18
20 AutoScout24 Delivering on Growth Potential External Revenues (in m) Q Q Other revenues Other dealer revenues ordinary operating EBITDA 40% 27% 17 9 growth y-o-y 24% 16% 12% 33% 25% 121 Core Dealer revenues BE/NL/IT % 44 Core Dealer revenues GER 42% 64 growth y-o-y 26% 10% 20% 37% 30% Key highlights Core Dealer revenues Ongoing expansion of dealer base and ARPU in Germany due to success of new sales approach and visibility product roll-out Strong ARPU growth fueled by the visibility products roll-out in Italy / Benelux AutoTrader.nl (acquired in February 2016) adding 5.0 million Core dealer revenues and 0.5 million of other revenues Other Dealer revenues Ongoing success of smaller European countries Other revenues Display revenues with solid growth throughout all key geographies ooebitda Operational gearing driving margin increase Q Q xx% ooebitda margin page 19
21 Ordinary Operating Cost (in m) FY 2015 FY 2016 Comments Revenues Own work capitalised Personnel (incl. external labour) (108.3) (120.2) Marketing (online & offline) (50.2) (50.1) IT (12.2) (13.2) Other costs (44.0) (45.8) Total operating cost (204.0) (217.6) increase in staff of ~10% (100 FTE average) during 2016 compared to 2015 including 0.5m for stock-option programme for employees (SOP) 3.5m of additional expenses for SOP expected for 2017 slowed down marketing spending in 2016 higher marketing spending expected linked to roll-out of product innovation in 2017 Increase largely driven by increased cloud usage Ordinary operating EBITDA Ordinary operating EBITDA-margin 48.2% 50.8% page 20
22 Below EBITDA Items PPA Effect Interest Taxes FY 2015 FY 2016 (in m) Ordinary operating EBITDA Non-operating items (22.6) (17.8) Reported EBITDA D&A (16.0) (15.8) D&A on PPA items (49.6) (49.6) EBIT Results Equity Method Finance Income Finance Cost (48.5) (45.9) Earnings before Tax Taxes on Income (22.0) (31.6) Earnings after Tax Earnings per Share (in ) Adjusted Earnings Earnings per Share adjusted (in ) Comments include 4.0m from share-based compensation (Management Equity Programmes, thereof 0.8m non-cash), 1.8m performance based compensation stemming from a purchase price agreement, 3.9m of cost relating to acquisition of AutoTrader.nl, 7.8m personnel cost relating to the reorganisation 10.0m of non-operating items expected for 2017 Amortization of PPA items decreasing to 37.0m in 2017 Amortization of capitalized financing fees of 17.0m included in 2016 (including write-offs due to refinancing and prepayment, non-cash relevant), 13.0m in Q including 1.8m gain from derivative instruments (2015: 1.3m gain, 0% floor on EURIBOR, non-cash relevant) Effective tax rate of 32.1% (slightly higher than normalized rate of 31.5%) Higher cash taxes for 2016 mainly driven by due to the non-tax deductibility of the PPA-related amortization 1. Unaudited. Excluding Non-recurring items and D&A on PPA items, calculated with normalized tax rate. Detailed reconciliation in appendix. page 21
23 Strong Free Cash Flow Generation Revenue to Free Cash Flow Bridge (2016) (in m) Total Revenue 442 Solid topline driven by organic growth Operating Expenses (218) Cost efficiencies and significant operating leverage oo EBITDA 225 non-operating items (18) 50.8% margin Decreasing non-operating cost Reported EBITDA 207 Capex (20) Limited capex requirements Reported Cash Contribution 187 Income Taxes Paid (43) To approach statutory corporate rate Underlying FCF 144 Interest paid (29) Robust deleveraging and significantly improved cost of debt Levered FCF 115 Potential for outsized net cash flow growth page 22
24 Capital structure Strong deleveraging profile and low interest margins supporting dividend payment Margin ratchet thresholds Leverage (Net Debt/EBITDA) Margin 1 Term Loan Revolving Facility 2 >3.00x 2.00% 1.60% >2.50x 1.70% 1.30% >2.00x 1.50% 1.10% >1.50x 1.30% 0.90% >1.00x 1.10% 0.70% <1.00x 0.90% 0.50% Key highlights Scout24 was recently upgraded by the rating agencies and is now rated Ba3 by Moody s and BBby S&P Excess cash flow of total 100m were used to pay down debt during 2016 Refinancing end of 2016 significantly improved interest margins, as business de-levers over time, margin ratchet will reduce interest expense further 3.6x x x 1 2.8x Management and Supervisory Board will propose 0.30 Dividend per share to Annual General Meeting in June 2017 Target pay-out ratio of 30.0% to 50.0% of adjusted net income over time Mar 2016 June 2016 Sep 2016 Dec 2016 Gross Debt Leverage (Net debt 3 / ordinary operating EBITDA) 1. Leverage test on a quarterly basis with new spread applicable 45 days post quarter end 2. Revolving Facility is subject to a utilisation fee depending of the amount drawn (<33.3% : 0.1%, <66.7% : 0.2%, >66.7% : 0.4%) 3. Net debt is defined as total debt (current and non-current liabilities) less cash and cash equivalents Cash and cash equivalents page 23
25 Outlook Full Year 2017 Revenues (in m) 442 Group revenues expected to record high-single-digit percentage growth rate 2016 IS24 is expected to achieve a mid-single percentage revenue growth rate, revenue growth weighted towards second half 2017 with acceleration to a mid- to high-single-digit growth rate AS24 is expected to grow revenues at mid-teens percentage rate ordinary operating EBITDA (in m) 225 Group ooebitda margin is expected to increase by around one percentage point 51% IS24 is expected to achieve an ordinary operating EBITDA margin on a slightly lower (but, at least 61%) or comparable level than in AS24 margin expected to expand by at least five percentage points ooebitda margin page 24
26 Q&A
27 Reconciliation Adjusted Earnings (EUR millions) Earnings before Tax Add back non-operating items Add back D&A on PPA items Add back extraordinary finance expense/ income and effects from derivative instruments Deduct Profit from disposal of investments accounted for using the equity method (1,3) (1,8) (24.6) (0,9) Adjusted Earnings before Tax Adjusted Tax based on normalized Tax rate (39.4) (51.1) Based on relevant nominal tax rate as stated in Annual Report 2015 and 2016 respectively. FY 2015: 31.44%; FY 2016: 31.30% Non-Controlling interest Adjusted Earnings attributable to owners of the parent Earnings per Share adjusted (in ) Weighted average of shares (in million) 101, Voluntary information. unaudited. not reviewed. page 26
28 Key performance indicators IS24 (in EUR million, unless otherwise stated) Revenues from core agents (Germany) Q Q / /- 38,7 39,7 2,6% 149,6 156,9 4,9% Revenues from other agents 8,3 9,1 9,6% 33,7 35,4 5,0% Other revenues 22,7 24,3 7,0% 83,5 92,4 10,7% Total external revenues 69,8 73,1 4,7% 266,7 284,6 6,7% Ordinary operating EBITDA 40,0 45,7 14,3% 159,2 179,2 12,6% Ordinary operating EBITDA - margin % 57,3% 62,5% 5,2pp 59,7% 63,0% 3,3pp EBITDA 35,8 42,3 18,2% 147,9 162,6 9,9% Capital expenditure 2,2 3,4 54,5% 9,8 11,1 13,3% page 27
29 Key performance indicators AS24 (in EUR million, unless otherwise stated) Revenues from core dealers (Germany) Revenues from core dealers (Benelux/Italy) Q Q / / % % % % Revenues from other dealers % % Other revenues % % Total external revenues % % Ordinary operating EBITDA % % Ordinary operating EBITDA - margin % 26.7% 40.2% 13,5pp 36.2% 42.2% 6,0pp EBITDA % % Capital expenditure (45.2%) (18.9%) page 28
30 Income Statement (EUR millions) Revenues Own work capitalised Other operating income Total operating performance Personnel expenses (99.5) (112.0) Advertising expenses (50.6) (50.6) IT expenses (12.3) (13.3) Other operating expenses (83.2) (73.7) EBITDA (Earnings before interest. tax. depreciation and amortisation) Depreciation. amortisation and impairment losses (65.6) (65.5) EBIT (Earnings before interest and tax) Net financial result (22.4) (42.8) Earnings before tax Income taxes (22.0) (31.6) Earnings after tax Earnings per share (EUR) page 29
31 Balance Sheet 1/2 Assets (EUR '000) 12/31/ /31/2016 Current assets Cash and cash equivalents Trade receivables Financial assets Income tax receivables Other assets Non-current assets 2, ,034.7 Goodwill Trademarks Other intangible assets Property, plant and equipment Investments accounted for using the equity method Financial assets Deferred tax assets Other assets Total assets 2, ,130.9 page 30
32 Balance Sheet 2/2 Equity and liabilities (EUR '000) 12/31/ /31/2016 Current liabilities Trade payables Financial liabilities Other provisions Income tax liabilities Other liabilities Non-current liabilities 1, ,027.8 Financial liabilities Pension and similar obligations Other provisions Income tax liabilities Deferred tax liabilities Other liabilities Equity Subscribed share capital Capital reserve Retained earnings Measurement of pension obligations (0.1) (0.1) Other reserves Treasury shares (13,400 and 0 shares respectively) Equity attributable to shareholders of parent company Non-controlling interests Total equity and liabilities 2, ,130.9 page 31
33 Cash Flow Statement 1/2 (EUR millions) 01/01/ - 12/31/15 01/01/16-12/31/16 Earnings after tax Depreciation. amortisation and impairment losses Income tax expense/(income) Financial income 1 (4.8) (3.0) Financial expenses Result from investments accounted for using the equity method 0.8 (0.0) Result on disposal of investments accounted for using the equity method (22.1) - Result on disposal of intangible assets and property. plant and equipment 0.0 (0.1) Other non-cash transactions Change in other assets not attributable to investing or financing activities (4.2) (4.3) Change in other liabilities not attributable to investing or financing activities (4.2) (6.3) Change in provisions (6.4) (1.1) Income tax paid (31.4) (43.0) Cash flow from operating activities Purchases of intangible assets (16.2) (17.2) Purchases of property. plant and equipment (3.0) (2.4) Proceeds from disposal of intangible assets and property. plant and equipment Payments made for investments in financial assets (0.1) (0.1) Proceeds from sale of financial assets Payments made to acquire subsidiaries (9.5) (29.5) Proceeds from disposal of investments accounted for using the equity method Payments made in connection with disposal of investments accounted for using the equity method (2.1) - Interest received Proceeds from disposal of discontinued activities Cash flow from investing activities 36.2 (48.8) [1] The previous year's figures has been adjusted: the previously separately reported interest income and interest expense figures as well as the other financial result are now shown as part of financial income and expenses. page 32
34 Cash Flow Statement 2/2 (EUR millions) 01/01/ - 12/31/15 01/01/16-12/31/16 Cash flow from investing activities 36.2 (48.8) Drawing down of short-term financial liabilities Repayment of short-term financial liabilities (0.1) (3.0) Drawing down of medium- and long-term financial liabilities Repayment of long-term financial liabilities (264.2) (781.0) Payments for costs of debt acquisition (7.7) - Payments for acquisition of derivative financial instruments (0.1) - Proceeds from capital increases less transaction costs Interest paid (37.6) (29.1) Dividends paid (421.6) - Payments for purchases of treasury shares - (1.1) Cash flow from financing activities (111.6) (133.3) Effect of foreign exchange rate changes on cash and cash equivalents Change in cash and cash equivalents 49.2 (27.2) Cash and cash equivalents at beginning of period Cash and cash equivalents at end of period page 33


35 IR Contact details and financial calendar Financial Calendar (expected) Wednesday 10 May 2017 Thursday 8 June 2017 Wednesday 9 August 2017 Wednesday 8 November 2017 Interim Report Q Annual General Meeting Half Year Report 2017 Interim Report Q Full year report report.scout24.com/ Investor Relations Contact Britta Schmidt Vice President Investor Relations & Treasury Diana Apostol Junior Manager Investor Relations Tel : ; Fax : ; ir@scout24.com
Scout24 AG Interim Results Q Conference Call November 11, 2015
 www.scout24.com Scout24 AG Interim Results Q3 2015 Conference Call November 11, 2015 Disclaimer This document has been issued by Scout24 AG (the Company and, together with its direct and indirect subsidiaries,
DISCOVER. CONNECT. FULFIL.
 QUARTERLY STATEMENT Third Quarter 2018 Interim consolidated financial statements for the nine months and the quarter ended 30 September 2018 DISCOVER. CONNECT. FULFIL. Table of Contents New reporting structure...
Company Presentation September 2015
 www.scout24.com Company Presentation September 2015 Important Notice This presentation has been prepared by Scout24 AG (the "Company") solely for informational purposes. Certain information in this presentation
Full year results presentation Year ended 31 March June 2018
 Full year results presentation Year ended 31 March 2018 7 June 2018 Disclaimer Not for publication, transmission, distribution or release, directly or indirectly, in or into any jurisdiction in which the
Full year and Q results March 15, 2017
 Full year and Q4 2016 results March 15, 2017 Disclaimer This document and its related communication ( Presentation ) have been issued by windeln.de SE and its subsidiaries ( Company ) and do not constitute
Full year and Q results
 Full year and Q4 2015 results March 17 th, 2016 Disclaimer This document has been issued by windeln.de AG (the Company ) and does not constitute or form part of and should not be construed as any offer
3M FY 2016/17 Financial results. 22 February
 3M FY 206/7 Financial results 22 February 207 0 Table of contents. Key Highlights 2. Financial Update Appendix Notice to recipients This presentation and any materials distributed in connection herewith
Q Results presentation
 Q1 2016 Results presentation 12 May 2016 1 Disclaimer This presentation (the "Presentation") has been prepared and is issued by, and is the sole responsibility of Telepizza Group, S.A. ( Telepizza" or
Q Results Investor Presentation. PLAY Communications 12 November 2018
 Q3 2018 Results Investor Presentation PLAY Communications 12 November 2018 Disclaimer This presentation has been prepared by Play Communications S.A. s and its subsidiaries (together the PLAY Group ).
preliminary results Telefónica Deutschland July 2017 Public Nicht vertraulich
 Q2 2017 preliminary results Telefónica Deutschland Razón Investor social Relations 00.00.2015 26 July 2017 Public Nicht vertraulich Disclaimer This document contains statements that constitute forward-looking
Investor Presentation
 Investor Presentation (NASDAQ: TRIP) Q3 2012 Safe Harbor Statement Forward-Looking Statements. Our presentation today, including the slides contained herein, contains "forward-looking statements" within
H1/2018 Results Investor/Analyst Conference Call Berlin, July 27, Dr Mathias Döpfner, Chairman & CEO Dr Julian Deutz, CFO
 H1/2018 Results Investor/Analyst Conference Call Berlin, Dr Mathias Döpfner, Chairman & CEO Dr Julian Deutz, CFO Disclaimer This document, which has been issued by Axel Springer SE (the "Company"), comprises
Quarter ended December 31, High Yield report
 Quarter ended December 31, 2013 High Yield report Key Highlights Quarterly Recurring EBITDA in line with guidance provided to markets and above market on revenue and booking growth showing the advantages
KION Q3 UPDATE CALL Gordon Riske, CEO Thomas Toepfer, CFO Wiesbaden, 14 November 2013
 KION Q3 UPDATE CALL 2013 Gordon Riske, CEO Thomas Toepfer, CFO Wiesbaden, 14 November 2013 AGENDA 1 Highlights 2013 Gordon Riske 2 Financial Update Thomas Toepfer 3 Outlook Gordon Riske 14 November 2013
BUSINESS AND FINANCIAL REVIEW JANUARY DECEMBER Analyst presentation 21 FEBRUARY 2018
 BUSINESS AND FINANCIAL REVIEW JANUARY DECEMBER 2017 Analyst presentation 21 FEBRUARY 2018 Disclaimer These materials and the oral presentation do not constitute or form part of any offer or invitation
Q Results. Lars Brorsen (CEO) Christoph Hobo (CFO) November 22, 2018
 Christoph Hobo (CFO) November 22, 2018") Q3 2018 Results Lars Brorsen (CEO) Christoph Hobo (CFO) November 22, 2018 Agenda 1. Highlights Q3 2018 2. Market outlook 3. Detailed results review 4. Company outlook 5. Q&A Appendix 1 Business summary
Q3 2018 Results Lars Brorsen (CEO) Christoph Hobo (CFO) November 22, 2018 Agenda 1. Highlights Q3 2018 2. Market outlook 3. Detailed results review 4. Company outlook 5. Q&A Appendix 1 Business summary
Disclaimer. Forward Looking Statements
 Q3 2016 Results PLAY Investor Presentation November 22, 2016 Disclaimer This presentation has been prepared by P4 Sp. z o.o. ( PLAY ). The information contained in this presentation is for information
Hellas Group 4th Quarter 2007 Results. February 19, 2008
 Hellas Group 4th Quarter 2007 Results February 19, 2008 Forward looking statement This presentation includes forward-looking statements. These forward-looking statements include all matters that are not
16 May M FY 2017/18 FINANCIAL RESULTS
 16 May 2018 6M FY 2017/18 FINANCIAL RESULTS NOTICE TO RECIPIENTS This presentation and any materials distributed in connection herewith (together, the Presentation ) have been prepared by Douglas GmbH
STRATEGICALLY POSITIONED FOR GROWTH.
 STRATEGICALLY POSITIONED FOR GROWTH. ANNUAL REPORT 2017 SHOP APOTHEKE EUROPE N.V. DR. ULRICH WANDEL, CFO 12 MARCH 2018 DISCLAIMER. 2 THIS PRESENTATION AND ITS CONTENTS ARE NOT FOR RELEASE, PUBLICATION
t e c h n i c o l o r. c o m
 2017 t e c h n i c o l o r. c o m Forward looking statements THIS PRESENTATION contains certain statements that constitute "forward-looking statements", including but not limited to statements that are
KION UPDATE CALL Q Gordon Riske, CEO Thomas Toepfer, CFO Wiesbaden, 7 May 2015
 KION UPDATE CALL 2015 Gordon Riske, CEO Thomas Toepfer, CFO Wiesbaden, 7 May 2015 AGENDA 1 Highlights Gordon Riske 2 Market update Gordon Riske 3 Financial update Thomas Toepfer 4 Outlook Gordon Riske
Bank of America Merrill Lynch Technology Conference
 Bank of America Merrill Lynch Technology Conference NASDAQ - TRIP 5/9/2012 Safe Harbor Statement Forward-Looking Statements. Our presentation today, including the slides contained herein, contains "forward-looking
Disclaimer. Forward Looking Statements
 Q4 and Full Year 2016 Results PLAY Investor Presentation February 28, 2017 Disclaimer This presentation has been prepared by P4 Sp. z o.o. ( PLAY ). The information contained in this presentation is for
4Q17 Earnings Conference Call. March 8, 2018
 4Q17 Earnings Conference Call March 8, 2018 Disclaimer This presentation includes forward-looking statements. We have based these forward-looking statements largely on our current beliefs, expectations
Deutsche Bank 24 th Annual Media, Internet & Telcom Conference. March 8, 2016
 Deutsche Bank 24 th Annual Media, Internet & Telcom Conference March 8, 2016 Safe Harbor for Forward-Looking Statements Certain statements in this presentation are forward-looking statements within the
Investor Presentation
 Investor Presentation (NASDAQ: TRIP) Q2 2013 Safe Harbor Statement Forward-Looking Statements. Our presentation today, including the slides contained herein, contains "forward-looking statements" within
Q Results. May 2015
 Q1 2015 Results May 2015 Safe Harbor Forward-Looking Statements. Our presentation today, including the slides contained herein, contains "forwardlooking statements" within the meaning of the Private Securities
Hellas Group 3nd Quarter 2007 Results. November 15, 2007
 Hellas Group 3nd Quarter 2007 Results November 15, 2007 Forward looking statement This presentation includes forward-looking statements. These forward-looking statements include all matters that are not
Investor Presentation
 Investor Presentation (NASDAQ: TRIP) Q4 2012 Safe Harbor Statement Forward-Looking Statements. Our presentation today, including the slides contained herein, contains "forward-looking statements" within
Investor Presentation S E P T E M B E R
 Investor Presentation S E P T E M B E R 2 0 1 6 Disclosure Regarding Forward-Looking Statements This presentation contains forward-looking statements. These forward-looking statements reflect the views
DEUTSCHE TELEKOM Q3/2018 RESULTS. Not to be released until November 8, 2018 Start statement Timotheus Höttges
 DEUTSCHE TELEKOM Q3/2018 RESULTS Not to be released until November 8, 2018 Start statement Timotheus Höttges DISCLAIMER This presentation contains forward-looking statements that reflect the current views
TI Fluid Systems plc Results Presentation for TI Fluid Systems plc 20 March 2018
 2017 Results Presentation for 20 March 2018 Disclaimer This presentation contains certain forward-looking statements with respect to the financial condition, results of operations and business of (the
Q Results. May 2017
 Q1 2017 Results May 2017 Forward-Looking Statements. Our presentation today, including the slides contained herein, contains "forwardlooking statements" within the meaning of the Private Securities Litigation
DEUTSCHE TELEKOM Q2/14 Results
 DEUTSCHE TELEKOM Results DISCLAIMER This presentation contains forward-looking statements that reflect the current views of Deutsche Telekom management with respect to future events. These forwardlooking
H RESULTS PRESENTATION
 H1 2018 RESULTS PRESENTATION 03.09.2018 H1 2018 RESULTS PRESENTATION DISCLAIMER This presentation (the "Presentation") has been prepared and is issued by, and is the sole responsibility of Telepizza Group,
Interim Report as of December 31, NorCell Sweden Holding 2 AB (publ) Group
 Group") Interim Report as of December 31, 2012 NorCell Sweden Holding 2 AB (publ) Group FOR IMMEDIATE RELEASE Date: February 20, 2013 Time: 9:30 CET IMPORTANT INFORMATION For investors and prospective investors
Interim Report as of December 31, 2012 NorCell Sweden Holding 2 AB (publ) Group FOR IMMEDIATE RELEASE Date: February 20, 2013 Time: 9:30 CET IMPORTANT INFORMATION For investors and prospective investors
DEUTSCHE TELEKOM Q2/2018 RESULTS
 DEUTSCHE TELEKOM Q2/2018 RESULTS DISCLAIMER This presentation contains forward-looking statements that reflect the current views of Deutsche Telekom management with respect to future events. These forward-looking
3rd quarter 2008 November 13, 2008
 3rd quarter 2008 November 13, 2008 1 Overview > Q3 2008 results > Update on full year 2008 guidance > Immediate priorities and business update 2 Results in EUR m Q3 08 Q3 07 Change Sep 08 Sep 07 Change
Investor Overview Q Slides updated as of February 21, 2018
 Investor Overview Q4 2017 Slides updated as of February 21, 2018 Safe Harbor and Non-GAAP Financial Measures This presentation contains forward-looking statements within the meaning of federal securities
2018 Liberty Investor Meeting
 2018 Liberty Investor Meeting Steve Kaufer, CEO and President November 14, 2018 Forward-Looking Statements. Our presentation today, including the slides contained herein, contains "forward-looking statements"
London, 6 September 2018
 London, 6 September 2018 NOTICE TO RECIPIENTS This presentation and any materials distributed in connection herewith (together, the Presentation ) have been prepared by Douglas GmbH (the Company ) solely
SmarTone Telecommunications Holdings Limited
 SmarTone Telecommunications Holdings Limited FY15 Annual Results Presentation For the year ended 30 June 2015 Stephen Chau Interim CEO 1 September 2015 1 Disclaimer It is not the intention to provide,
Results FY 2017 Schaeffler AG. Conference Call March 7, 2018 Munich
 Results FY 2017 Schaeffler AG Conference Call Munich Disclaimer This presentation contains forward-looking statements. The words "anticipate", "assume", "believe", "estimate", "expect", "intend", "may",
Half year results 31 December Jon Macdonald Caroline Rawlinson
 Half year results 31 December 2016 Jon Macdonald Caroline Rawlinson CEO CFO Overview H1 YoY Revenue $115m +9% Expenses $40m +5% EBITDA 1 $74m +12% EBIT 1 $64m +12% Operating NPAT 1 $45m +16% Dividend 8.5cps
Q results. Analyst & investor presentation. November 21, 2017
 Q3 2017 results Analyst & investor presentation November 21, 2017 Q3 2017 Development at a Glance: Fully on Track 18 new units opened year to date (Q3 6 openings) and pipeline fully secured Strong growth
Results Presentation 2012 Lippert/Heilshorn & Associates Roadshow Ströer Media AG 9-11 April 2013, Boston / New York
 1 Results Presentation 2012 Lippert/Heilshorn & Associates Roadshow Ströer Media AG 9-11 April 2013, Boston / New York Ströer group developments in 2012 FY organic revenue growth (-4.0%) and operational
Interim Report. 1 July September 2005
 Interim Report 1 July 2005 30 September 2005 1 Q3 2005 Report President and CEO Veli-Matti Mattila Elisa Q3 2005 Q3 2005 and financial highlights Review of the mobile and fixed network businesses Saunalahti
2017 Interim Results. Continuing Execution of Our Strategy. 3 August 2017
 2017 Interim Results Continuing Execution of Our Strategy 3 August 2017 0 Disclaimer THIS PRESENTATION IS NOT FOR RELEASE, PUBLICATION OR DISTRIBUTION, IN WHOLE OR IN PART, IN OR INTO THE UNITED STATES
2017 Interim Results. 14 September 2017
 2017 Interim Results 14 September 2017 1 Disclaimer NOT FOR PUBLICATION OR DISTRIBUTION IN WHOLE OR IN PART IN, INTO OR FROM ANY JURISDICTION WHERE TO DO SO WOULD CONSTITUTE A VIOLATION OF THE RELEVANT
Q4 AND FY 2015 RESULTS. Harold Goddijn CEO Taco Titulaer CFO 9 February 2016
 Q4 AND FY 2015 RESULTS Harold Goddijn CEO Taco Titulaer CFO 9 February 2016 CONSUMER OPERATIONAL HIGHLIGHTS Within Drive, we maintained our leading market position and continued to strengthen our navigation-based
Eesti Energia Audited Financial Results for 2016
 Eesti Energia Audited Financial Results for 2016 27 February 2017 Eesti Energia Narva Wind Park, Estonia 2 Disclaimer This presentation and any materials distributed or made available in connection herewith
NLSN 4Q and FY 2011 Investor Presentation
 NLSN 4Q and FY 2011 Investor Presentation Forward Looking Statements The following discussion contains forward-looking statements, including those about Nielsen s outlook and prospects, in the meaning
2018 Combined Financial Results. Air Bank, Home Credit Czech Republic and Home Credit Slovak Republic. 6 February 2019
 2018 Combined Financial Results Air Bank, Home Credit Czech Republic and Home Credit Slovak Republic 6 February 2019 Note: Unaudited combined IFRS figures DISCLAIMER GENERAL THIS PRESENTATION DOES NOT
Fourth Quarter and Annual Results 2015
 Fourth Quarter and Annual Results 2015 Highlights Rising customer satisfaction supporting continued strong base growth in Consumer in Q4 2015 and FY 2015 +40k broadband net adds (FY 2015: +139k) and +69k
FY 2018 Results for Rocket Internet SE & Selected Companies 4 APRIL 2019
 FY 2018 Results for Rocket Internet SE & Selected Companies 4 APRIL 2019 1 Disclaimer This document is being presented solely for informational purposes and should not be treated as giving investment advice.
January March 2010 Conference Call. Georg Denoke Member of the Executive Board & CFO 4 May 2010
 January March 2010 Conference Call Georg Denoke Member of the Executive Board & CFO 4 May 2010 Disclaimer This presentation contains forward-looking statements about Linde AG ( Linde ) and their respective
27 July 2018 Interim Results
 27 July 2018 Interim Results for the half year ended 30 June 2018 Disclaimer This presentation may contain forward-looking statements, including forward-looking statements within the meaning of the United
H1 16 interim results. 22 September 2015
 H1 16 interim results 22 September 2015 Important notice 2 This presentation may include certain forward-looking statements, beliefs or opinions, including statements with respect to the Company s business,
Preliminary Results January September 2013
 Preliminary Results January September 2013 Disclaimer The financial information contained in this document (in general prepared under International Financial Reporting Standards (IFRS)) contains in respect
CARS.COM. Third Quarter 2017 Earnings November 8, 2017
 CARS.COM Third Quarter 2017 Earnings November 8, 2017 Forward Looking Statements This presentation contains forward looking statements within the meaning of the federal securities laws, including those
Combined management report of Scout24 Group and Scout24 AG
 Combined management report of Scout24 Group and Scout24 AG Fundamentals of the Group Business model and business lines The Scout24 Group (referred to as "Scout24" or the "Group") is a leading operator
Ziggo Q Results. October 14, 2011
 Ziggo Q3 2011 Results October 14, 2011 Disclaimer Various statements contained in this document constitute forward-looking statements as that term is defined by U.S. federal securities laws. Words like
Ziggo N.V. Q Results. October 19, 2012
 Ziggo N.V. Q3 2012 Results October 19, 2012 Disclaimer This document does not constitute or form a part of any offer or solicitation to purchase or subscribe for securities in the United States or any
Results First Quarter 2012/13
 Results First Quarter 2012/13 Investor Call Mannheim, 27 th June 2012 Dr. Michael Majerus CFO Disclaimer 2012 PHOENIX Pharmahandel GmbH & Co KG This document has been prepared by PHOENIX Pharmahandel GmbH
BUSINESS AND FINANCIAL REVIEW JANUARY SEPTEMBER Analyst presentation 26 October 2017
 BUSINESS AND FINANCIAL REVIEW JANUARY SEPTEMBER 2017 Analyst presentation 26 October 2017 Disclaimer These materials and the oral presentation do not constitute or form part of any offer or invitation
Group Interim Report. First Half and Second Quarter 2016
 Group Interim Report First Half and Second Quarter 2016 Interim consolidated financial statements for the half-year and the three months ended June 30, 2016 1 Scout24 financial highlights (EUR millions)
technicolor.com 7 JUNE 2018
 technicolor.com 7 JUNE 2018 COUNTRIES SITES REVENUES Connected Home 57% 57% 2017 2016 16% 1% 26% Production Services 18% DVD Services 24% North America 53% 2017 2016 25% 16% 52% 7% Europe, Middle-East
Q Results PLAY Investor Presentation. PLAY, November 2017
 Q3 2017 Results PLAY Investor Presentation PLAY, November 2017 Disclaimer This presentation has been prepared by Communications S.A. s and its subsidiaries (together the PLAY Group ). The information contained
March Quarter & Fiscal Year 2016 Results
 March Quarter & Fiscal Year 2016 Results May 5, 2016 Disclaimer This presentation contains forward-looking statements. These statements are made under the safe harbor provisions of the U.S. Private Securities
Q1 FY 2015/16. Ended June 30, Unterfoehring, August 6, 2015
 Presentation Q1 FY 2015/16 Ended June 30, 2015 Unterfoehring, August 6, 2015 Disclaimer This presentation may contain forward-looking statements. These statements are based on management's current expectations
Hürriyet Investor Presentation. July 2007
 Hürriyet Investor Presentation July 2007 1 Notice This presentation does not constitute an offer or invitation to purchase or subscription for any securities and no part of it shall form the basis of or
MAISONS DU MONDE: FIRST-HALF 2018 RESULTS
 PRESS RELEASE MAISONS DU MONDE: FIRST-HALF 2018 RESULTS A solid first half in a challenging environment Updated full-year 2018 targets Sales up 11% to 507m including Modani, and up 9.8% at constant scope
TELENOR GROUP FOURTH QUARTER Jørgen C. Arentz Rostrup, CFO
 TELENOR GROUP FOURTH QUARTER Jørgen C. Arentz Rostrup, CFO DISCLAIMER The following presentation is being made only to, and is only directed at, persons to whom such presentation may lawfully be communicated
Strategy 2013 highlights. Business. segments
 1 1 2 3 4 2014 Full-year Group Business Outlook 2014 Strategy 2013 highlights financials segments update 2 1 2 3 4 Revenue Cash conversion rate YoY growth: +6.9% EBITA Margin YoY growth: +4.7% Reported
eircom Holdings (Ireland) Limited First Quarter unaudited results 30 September 2017
 Limited First Quarter unaudited results 30 September 2017") First Quarter unaudited results 30 September 2017 1 Unaudited first quarter results to 30 September 2017 Table of contents Page(s) Trading highlights for the first quarter ended 30 September 2017
First Quarter unaudited results 30 September 2017 1 Unaudited first quarter results to 30 September 2017 Table of contents Page(s) Trading highlights for the first quarter ended 30 September 2017
first quarter results 2010
 first quarter results 2010 back to growth in March Robert-Jan van de Kraats, CFO Randstad Holding nv April 28, 2010 disclaimer Certain statements in this document comprise forecasts on Randstad Holding
FY 2017 FINANCIAL RESULTS. March 1 st, 2018
 FY 2017 FINANCIAL RESULTS March 1 st, 2018 FY 2017 Results 1. Highlights 2. FY Financial Performance Analysis 3. Appendix Verallia FY 2017 Financial Results 01/03/2018 2 2017 HIGHLIGHTS A very good financial
Q RESULTS May 14th, 2018
 Q1 2018 RESULTS May 14th, 2018 1 Disclaimer This document has been prepared by HelloFresh SE (the Company and, together with its subsidiaries, the Group ). All material contained in this document and information
Investor Presentation
 Investor Presentation (NASDAQ: TRIP) Q3 2013 Safe Harbor Statement Forward-Looking Statements. Our presentation today, including the slides contained herein, contains "forward-looking statements" within
Business and Financial Review January September 2009
 Business and Financial Review January September 2009 Ivica Mudrinić, President of the Management Board and CEO Juergen P. Czapran, Member of the Management Board and CFO 30 October 2009 Presentation topic
FIRST HALF-YEAR 2018 FINANCIAL RESULTS CONFERENCE CALL CURETIS N.V.
 FIRST HALF-YEAR 2018 FINANCIAL RESULTS CONFERENCE CALL CURETIS N.V. ARES Technology Platform CONFERENCE CALL PRESENTATION 14 August 2018 DISCLAIMER & FORWARD LOOKING STATEMENTS This document has been issued
Group Interim Report. Nine Months and Third Quarter 2015
 Group Interim Report Nine Months and Third Quarter Interim consolidated financial statement for the nine-month period and the three-month September 30, 1 Scout24 Financial Highlights Table of Contents
Telefónica Deutschland releases first quarter 2013 results
 3 rd May 2013 Telefónica Deutschland releases first quarter 2013 results MUNICH. Telefónica Deutschland continued delivering on its strategy in a more active and competitive environment focused on smartphones.
Second Quarter 2014 results
 Second Quarter 2014 results KPN shows another quarter of good strategic progress. The outlook is maintained. Continued operational progress in The Netherlands High postpaid net adds in Consumer Mobile
Roadshow. November 2005
 Roadshow November 2005 1 Contents Elisa today Q3 2005 and financial highlights Elisa and the Finnish telecoms market review Saunalahti transaction Future outlook 2 Elisa at a glance Full range of telecom
MD&A. Executive Summary. Operational Summary MANAGEMENT DISCUSSION AND ANALYSIS FIRST QUARTER 2018
 MD&A Executive Summary In Q118, dtac reported strong EBITDA growth of 21% YoY and EBITDA margin of 43.8%, mainly driven by lower handset subsidies and regulatory cost, despite 1.1%YoY decline in service
Foxtons Interim results presentation For the period ended 30 June 2018
 Foxtons Interim results presentation For the period ended 30 June 2018 Important information This presentation includes statements that are, or may be deemed to be, forward-looking statements. These forward-looking
2015 Investor Day. November 12, 2015
 2015 Investor Day November 12, 2015 Forward-Looking Statements This presentation includes certain forward-looking statements within the meaning of the Private Securities Litigation Reform Act of 1995,
eaccess Ltd. (9427) FY3/2012 3Q Results (4/2011 ~ 12/2011)
 FY3/2012 3Q Results (4/2011 ~ 12/2011)") eaccess Ltd. (9427) FY3/2012 3Q Results (4/2011 ~ 12/2011) February 9, 2012 FY3/2012 3Q Results & Outlook Operational Targets & Progress Platinum Band 900/700MHz Appendix 2 FY3/2012 3Q Results & Outlook
eaccess Ltd. (9427) FY3/2012 3Q Results (4/2011 ~ 12/2011) February 9, 2012 FY3/2012 3Q Results & Outlook Operational Targets & Progress Platinum Band 900/700MHz Appendix 2 FY3/2012 3Q Results & Outlook
1H 19 Investor Presentation February 2019
 1H 19 Investor Presentation February 2019 1 About Raiz Raiz (formerly Acorns) is a mobile first micro-investing platform via mobile phone or web app, which allows customers to invest in a portfolio of
BUSINESS AND FINANCIAL REVIEW JANUARY MARCH Analyst presentation 28 APRIL 2016
 BUSINESS AND FINANCIAL REVIEW JANUARY MARCH 2016 Analyst presentation 28 APRIL 2016 Disclaimer These materials and the oral presentation do not constitute or form part of any offer or invitation to sell
F O U R T H Q U A R T E R R E S U L T S February 6, 2018
 F O U R T H Q U A R T E R 2 0 1 7 R E S U L T S February 6, 2018 Safe Harbor for Forward-Looking Statements Certain statements in this presentation are forward-looking statements within the meaning of
Foxtons Interim results presentation For the period ended June 2017
 Foxtons Interim results presentation For the period ended June 2017 Important information This presentation includes statements that are, or may be deemed to be, forward-looking statements. These forward-looking
Results of the 1 st quarter PHOENIX group 2018/19
 Investor call Results of the 1 st quarter PHOENIX group 2018/19 Helmut Fischer, CFO Mannheim, 26 June 2018 Disclaimer 2018 PHOENIX Pharma SE / PHOENIX PharmahandelGmbH & Co KG This document has been prepared
FY 2011 Results. February 28th, 2012
 FY 2011 Results February 28th, 2012 Disclaimer In addition to figures prepared in accordance with IFRS, PRISA presents non-gaap financial performance measures, e.g., EBITDA, EBITDA margin, adjusted EBITDA,
BUSINESS AND FINANCIAL REVIEW JANUARY MARCH Analyst presentation 26 APRIL 2018
 BUSINESS AND FINANCIAL REVIEW JANUARY MARCH 2018 Analyst presentation 26 APRIL 2018 Disclaimer These materials and the oral presentation do not constitute or form part of any offer or invitation to sell
For personal use only. Investor Update. January
 1 Investor Update January 2019 www.aspermont.com The leading media services provider to the global resources industry 2 Aspermont is ASX listed with offices in Australia, UK, Brazil, North America and
RESULTS 2 nd QUARTER 2018
 RESULTS 2 nd QUARTER (IFRS, UNAUDITED) July 18, Software AG. All rights reserved. SAFE HARBOR This presentation includes forward-looking statements based on the beliefs of Software AG management. Such
Business Update. USPP Conference Miami. Luis Damasceno Group CFO Michael Williams Group Finance Director & Treasurer January 2019
 Business Update USPP Conference Miami Luis Damasceno Group CFO Michael Williams Group Finance Director & Treasurer 23-25 January 2019 www.alsglobal.com IMPORTANT NOTICE AND DISCLAIMER This presentation