New Zealand (Subsidiary)
|
|
|
- Marvin McBride
- 5 years ago
- Views:
Transcription
1 1

2 2
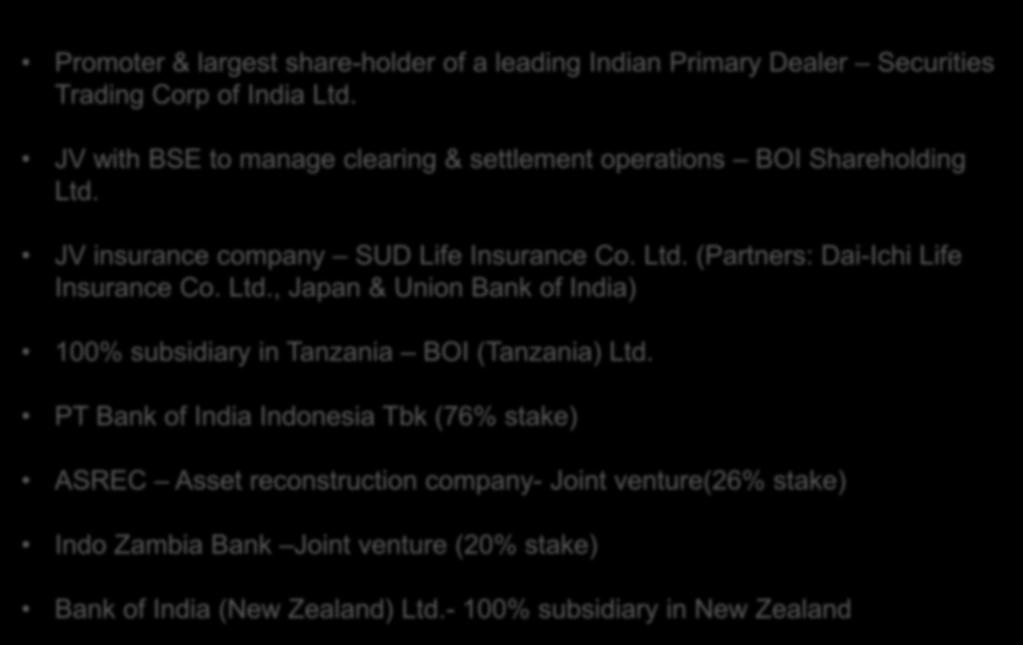
 -Belgium (Antwerp) Hong Kong Kowloon Shenzen")

 New Zealand")
3 USA (New York & SFO) UK (London + 7branches) Europe -France (Paris) -Belgium (Antwerp) Hong Kong Kowloon Shenzen Singapore Jakarta Ho Chi Minh Japan (Tokyo & Osaka) Phnom Penh West Indies - Cayman Islands Dubai (Representative office) Channel Islands Tanzania (Subsidiary), Kenya (Nairobi, Mombasa, Ind Area & Westlands) New Zealand (Subsidiary) Jo burgh (SA) 3
4 Mutual Funds, Corporate 0.52% Bodies, 0.79% Insurance Cos, 15.37% FIs/Banks, 0.16% FI Investor, 14.71% Indian Public, 5.32% NRIs/FII, 0.41% Promoter(GOI), 62.72% Mar-12 Promoter(GOI) FI Investor FIs/Banks Insurance Cos Mutual Funds Corporate Bodies NRIs/FII Indian Public 4


5 5
 CASA improves from 29.18% to 34.25% Business touched `5,697,103 Mn ( YoY Growth 10.")
 Net Interest Income increased sequentially from ` 20,675Mn to ` 25,010Mn (Growth 20.")
 Net NPA ratio decreased from 1.78% to 1.47% (Sequentially) ROA improved from 0.76% to 0.")
6 Advances at ` 25,14,942 Mn (YoY Growth 16.35%) Deposits stood at ` 3,182,160 Mn (YoY Growth 6.47%) CASA improves from 29.18% to 34.25% Business touched `5,697,103 Mn ( YoY Growth 10.62%) Operating Profit increased from ` 12,053Mn to ` 20,146Mn ( Growth 67% YoY) Net Profit Increased from `4,936Mn to ` 9,527 Mn (Growth 93% YoY) Net Interest Income increased sequentially from ` 20,675Mn to ` 25,010Mn (Growth 20.97% YoY) Net Interest Margin increased from 2.55% to 2.86% (Sequentially) Gross NPA ratio decreased from 2.74% to 2.34% (Sequentially) Net NPA ratio decreased from 1.78% to 1.47% (Sequentially) ROA improved from 0.76% to 0.98% (Sequentially) ROE improved from 16.97% to 21.17% (Sequentially)
7 24,000 20,000 16,000 12,000 12,053 13,959 15,515 17,319 20,146 8,000 4,000 0 Qtr Mar-11 Qtr Jun-11 Qtr Sep-11 Qtr Dec-11 Qtr Mar-12 March 11- March 12 Growth - 67% 7
8 12,000 9,527 8,000 7,162 4,936 5,175 4,911 4,000 0 Qtr Mar-11 Qtr Jun-11 Qtr Sep-11 Qtr Dec-11 Qtr Mar-12 March 11- March 12 Growth 93% 8
9 28,000 24,000 20,000 23,073 18,409 19,039 20,675 25,010 16,000 12,000 8,000 4,000 0 Qtr Mar-11 Qtr Jun-11 Qtr Sep-11 Qtr Dec-11 Qtr Mar-12 NII sequentially grows by 20.97% over Dec 11 9
10 Domestic Global Foreign 0.00 Qtr Mar-11 Qtr June 11 Qtr Sep-11 Qtr Dec-11 Qtr Mar-12 10
11 12,000 8,000 8,231 6,601 8,418 8,522 9,671 4,000 0 Qtr Mar-11 Qtr Jun-11 Qtr Sep-11 Qtr Dec-11 Qtr Mar-12 March 11- March 12 growth % 11
12 Qtr Mar-11 Qtr Jun-11 Qtr Sep-11 Qtr Dec-11 Qtr Mar-12 12
13 Qtr Mar-11 Qtr Jun-11 Qtr Sep-11 Qtr Dec-11 Qtr Mar-12 13
14 Qtr Mar-11 Qtr Jun-11 Qtr Sep-11 Qtr Dec-11 Qtr Mar-12 14
15 Qtr Mar-11 Qtr Jun-11 Qtr Sep-11 Qtr Dec-11 Qtr Mar-12 15
 2.94 2.19 2.44 2.55 2.86 Gross NPA (%) 2.23 2.69 3.02 2.")
16 Quarter ended Mar -11 Jun -11 Sept -11 Dec -11 Mar -12 Business Mix 5,150,401 5,080,339 5,160,250 5,403,668 5,697,103 Deposits 2,988,858 2,930,984 2,990,741 3,072,523 3,182,160 Advances 2,161,543 2,149,355 2,169,509 2,331,146 2,514,942 Operating Profit 12,053 13,959 15,515 17,319 20,146 Net Profit 4,936 5,175 4,911 7,162 9,527 NIM (%) Gross NPA (%) Net NPA (%) Return on Assets(%) Rtn. on Equity (%) Book Value (INR)

17 Deposits March 11 Dec. 11 Mar. 12 Foreign Indian Global 17


18 1,000, , , , , , , , , , , , , , , , , , , ,646 Mar-11 Jun-11 Sep-11 Dec-11 Mar-12 CASA SB CD 18
19 850,000 (34.25%) (32.41%) 813, , ,000 (29.18%) 731,385 (30.48%) 741,675 (31.64%) 766, , , ,000 Qtr Mar-11 Qtr Jun-11 Qtr Sep-11 Qtr Dec-11 Qtr Mar-12 Share of CASA to Aggregate Deposits- Mar % 19
20 FOREIGN INDIAN GLOBAL March'11 Dec'11 March'12 20
21 Mar-11 Dec-11 Mar-12 % YoY Growth Agriculture 176, , , % SME (Priority & Non Priority) 312, , , % Retail Credit 166, , , % Corporate 1,001, ,910 1,030, % 21


22 Mar-11 June-11 Sep-11 Dec-11 Mar-12 YoY Growth % Textiles 71,700 72,300 75,420 77,940 80, % Chemicals & Chemical products Rubber, Plastic & their products Basic metal & metal products Vehicles, vehicle parts & Transport equipment 43,790 46,370 45,150 46,030 46,310 18,730 18,260 20,360 21,410 22, ,860 98, , , ,890 23,600 22,910 22,750 24,310 21, % 22.00% 15.29% % Gems & Jewellery 28,110 27,780 30,670 31,470 35, % Infrastructure 204, , , , , % Other Industries 143, , , , % 22
23 Mar-11 Mar-12 TRADE 43, ,767.6 MANUFACTURING 56, ,655.3 REAL ESTATE 10, ,893.0 LOAN AGAINST DEPOSITS 10, ,377.8 BUYERS CREDIT 287, ,388.5 OTHERS * 102, ,386.5 TOTAL 510, ,468.8 * Others include Staff Loans,Bills discounted for other banks, syndication/ecb loans, FCTL, etc. 23
24 Sector Mar-11 Dec-11 Mar-12 % YoY Growth Gross advances 1,651,470 1,633,250 1,779, % -Food credit 33,410 39,400 36, % -Non-food credit 1,618,060 1,593,850 1,742, % Retail credit 166, ,040 1,91, % -Residential mortgage -Business Mortgage loans 70,570 85,750 83, % 14,950 16,710 16, % -Auto Finance 14,080 17,810 18, % -Educational loan 19,460 21,680 21, % - Others 47,420 38,090 51, % 24
25 Sector March -11 Dec-11 March-12 % YoY Growth Agriculture 176, , , % Industry 650, , , % Services 624, , , % -Trade 92, , , % -Others 532, , , % Retail Credit 166, , , % Total 1,618,060 1,593,850 1,779, % 25
26 SECTOR MAR-11 JUN-11 SEPT.-11 DEC-11 MAR-12 % of Total Advances Total Advances 1,651,472 1,611,230 1,578,634 1,633,251 1,779,502 REAL ESTATE 203, , , , , Out of which HOUSING LOAN MORTGAGE LOAN COMML. REAL ESTATE Others(Invest & Indirect) CAPITAL MARKET 74,783 78,401 79,466 85,756 88, ,950 19,843 17,372 16,709 16, ,546 38,170 37,297 41,436 48, ,344 67,076 70,880 63,116 74, ,451 34,920 33,896 34,256 33,


27 SECTOR AMOUNT Infrastructure 29,612 Engineering 1,870 Textiles 1,388 Miscellaneous 479 Iron & Steel 1,434 Services 234 Pharmaceuticals 92 Aviation - Sugar 235 Agriculture 1,261 Paper - Chemicals 241 Trade 265 Construction - Automobile - Computer 312 Gem - Other metal - Trade GRAND TOTAL 37,796
28 Industry Amount AGRICULTURE - CHEMICALS - ENGINEERING - INFRASTRUCTURE - MISC 39 SERVICES 127 STEEL - TEXTILES 193 TRADING 353 SUGAR 46 TOTAL


29 S.No Sector Qtr Mar 11 Qtr Jun 11 Qtr Sept. 11 Qtr Dec 11 1 AGRICULTURE CHEMICALS CRE ENGINEERING INFRASTRUCTURE 281 1, MISC PAPER & PAPER PRODUCTS 29 Qtr Mar SERVICES STEEL TEXTILES , TRADING CERAMICS SUGAR Aviation , Automobile AGGREGATE 972 3,591 3,271 5,

30 Mar-11 June 11 Sept. 11 Dec. 11 Mar-12 Gross NPA 48,116 57,910 65,480 63,860 58,939 Net NPA 19,450 26,897 42,446 40,931 36,564 Gross NPA % Net NPA % Provision Coverage Ratio %

31 70,000 60,000 50,000 43,566 52,581 58,283 55,924 51,697 40,000 30,000 20,000 10,000 0 Qtr Mar-11 Qtr Jun-11 Qtr Sep-11 Qtr Dec-11 Qtr Mar-12 31
32 ,197 7,936 7, ,550 5,330 0 Qtr Mar-11 Qtr Jun-11 Qtr Sep-11 Qtr Dec-11 Qtr Mar-12 32
33 70,000 60,000 57,911 65,480 63,860 58,939 50,000 48,116 40,000 30,000 20,000 10,000 0 Qtr Mar-11 Qtr Jun-11 Qtr Sep-11 Qtr Dec-11 Qtr Mar-12 33
34 50,000 40,000 39,577 37,761 34,134 30,000 25,022 20,000 18,084 10,000 0 Qtr Mar-11 Qtr Jun-11 Qtr Sep-11 Qtr Dec-11 Qtr Mar-12 34
35 ,869 3,170 2, ,875 1, Qtr Mar-11 Qtr Jun-11 Qtr Sep-11 Qtr Dec-11 Qtr Mar-12 35
36 50,000 40,000 42,446 40,931 36,564 30,000 26,897 20,000 19,450 10,000 0 Qtr Mar-11 Qtr Jun-11 Qtr Sep-11 Qtr Dec-11 Qtr Mar-12 36
37 12,000 10,604 10,157 10,619 8,784 8,000 7,117 4,000 0 Qtr Mar-11 Qtr Jun-11 Qtr Sep-11 Qtr Dec-11 Qtr Mar-12 37
 23,073 18,409 19,039 20,675 25,010 8.40% 4 Non-Interest Income 8,231 6,601 8,418 8,522 9,671 17.")
38 Qtr Mar 2011 Qtr Jun 2011 Qtr Sept Qtr Dec 2011 Qtr Mar 2012 Variation YoY (%) 1 Interest Earned 63,069 66,335 68,864 71,501 78, % 2 Interest Expended 39,996 47,926 49,825 50,826 53, % Net Interest Income 3 (1-2) 23,073 18,409 19,039 20,675 25, % 4 Non-Interest Income 8,231 6,601 8,418 8,522 9, % Total Operating Income 5 (3+4) 31,304 25,010 27,457 29,197 34, % 6 Operating Expenses 19,251 11,051 11,942 11,878 14, % 7 Operating Profit (5-6) 12,053 13,959 15,515 17,319 20, % 8 Total Provision 7,117 8,784 10,604 10,157 10, % 9 Net Profit 4,936 5,175 4,911 7,162 9, % 38
39 Income Year ended Mar 11 Mar 12 YoY % 1. Total Income 243, , % a. Interest Income 217, , % b. Non Interest Income 26,418 33, % 2. Total Expenditure 190, , % a. Interest expended 139, , % b. Operating Expenses 50,682 49, % 3. Operating Profit 53,842 66, % 4. Profit before Tax 34,954 35, % 5. Profit After Tax 24,887 26, % 39


40 ,010 23,073 20,675 18,409 19,039 20,146 17,319 15,515 13,959 12,053 9,527 7,162 4,936 5,175 4,911 Mar-11 June 11 Sept-11 Dec-11 Mar-12 Net Profit Operating Profit NII 40
41 Year ended Mar 11 Mar 12 YoY % Operating Profit Global 53,842 66, % Indian 46,280 56, % Foreign 7,562 10, % Provisions Global 28,955 40, % Indian 26,347 35, % Foreign 2,608 4, % Net Profit Global 24,887 26, % Indian 19,933 20, % Foreign 4, % 41
42 Qtr Mar-11 Qtr Jun-11 Qtr Sept.-11 Qtr Dec-11 Qtr Mar-12 Variation YoY (%) TOTAL INTEREST INCOME 63,069 66,335 68,864 71,501 78, % INT. INCOME FROM ADVANCES 43,252 45,959 48,865 51,714 55, % INT. INCOME FROM INVESTMENTS 14,119 16,406 18,431 18,414 18, % OTHER INTEREST INCOME 5,698 3,970 1,568 1,373 4, % TOTAL INTEREST EXPENDED 39,996 47,926 49,825 50,826 53, % INT. EXPENDED ON DEPOSITS 35,249 43,837 45,055 44,542 46, % INT. EXPENDED ON BORRROWINGS 2,340 1,517 2,099 3,564 4, % INTEREST EXPENSES ON SUBORDINATED DEBT etc. 2,408 2,470 2,671 2,721 2, % NET INTEREST INCOME 23,073 18,409 19,039 20,675 25, % 42
43 Particulars Mar-11 Year ended Mar-12 Variation YoY % Interest Income 217, , % a. From Advances 155, , % b. From Investments 51,717 71, % c. Other Interest Income 10,797 10, % Interest Expended 139, , % a. On Deposits 121, , % b. On Borrowings 8,129 11, % c. Subordinated Bonds 6,350 6, % d. Others 3,146 3, % Net Interest Income 78,107 83, % 43
44 Qtr Mar- 11 Qtr Jun- 11 Qtr Sep- 11 Qtr Dec- 11 Qtr Mar- 12 Variation YoY (%) Treasury: PROFIT FROM SALE OF SECURITIES 1,266 1,097 1, % PROFIT FROM EXCHANGE TRANSACTIONS 1,334 1,471 1,483 1,239 1, % Core-banking Operations: Sub Total (A) 2,600 2,568 3,027 1,951 2, % COMMISSION / EXCHANGE / BROKERAGE 3,468 2,737 3,258 3,204 3, % OTHER NON-INTEREST INCOME 1, ,257 1,509 1, % Sub Total (B) 4,712 3,721 4,515 4,713 5, % RECOVERY IN WRITTEN OFF ACCOUNTS (C) ,858 1, % TOTAL NON-INTEREST INCOME (A+B+C) 8,231 6,601 8,418 8,522 9, % 44

45 Particulars Mar-11 Year ended Mar-12 Variation YoY % Commission, Exchange & Brokerage 11,810 12, % Profit from Sale of Investments 3,219 4,088 27% Profit from Exchange Transactions 5,025 5, % Recovery In W/o accounts 2,247 4, % Other Non Interest Income 4,117 5, % Total Non Interest Income 26,418 33, % Core Non Interest Income Net of Treasury & Recovery in W/o Accounts 15,927 18, % 45

46 Qtr Mar-11 Qtr June-11 Qtr Sep-11 Qtr Dec-11 Qtr Mar-12 Variation YoY % OPERATING PROFIT 12,053 13,960 15,520 17,320 20, % TOTAL PROVISIONS 7,117 8,780 10,610 10,160 10, % -PROVISION FOR NPA 3,367 3,880 8,240 3,330 4, % -PROVISION FOR INVESTMENTS -PROVISION FOR TAXATION ,510 1, % 2,340 3, ,230 3, % -OTHER PROVISIONS 1, , ,420 1, % NET PROFIT 4,936 5,180 4,910 7,160 9, % 46

47 Year ended Mar 11 Year ended Mar 12 Variation YoY(%) OPERATING PROFIT 53,842 66, TOTAL PROVISIONS 28,955 40, PROVISION FOR NPA 10,543 20, PROVISION FOR INVESTMENTS 1,369 4, PROVISION FOR TAXATION 10,067 9, PROVISION FOR STANDARD ASSETS 1,500 2, PROVISION FOR FITL PROVISION FOR RESTRUCTURE 610 2, FLOATING PROVISION 1, PROV. FOR CLAIM AGAINST BANKS 2, DEBT WAIVER/DEBT RELIEF OTHER PROVISIONS NET PROFIT 24,887 26,
48 Qtr Mar 11 Qtr Jun 11 Qtr Sept 11 Qtr Dec 11 Qtr Mar 12 INDIAN FOREIG GLOBAL INDIAN FOREIGN GLOBAL INDIAN FOREIGN GLOBAL INDIAN FOREIGN GLOBAL INDIAN FOREIGN GLOBAL N Cost of Deposits Yield on Advances Yield on Investments Yield on Funds Cost of Funds N.I.M
49 Mar 11 June 11 Sep-11 Dec-11 Mar-12 Cost to Income Ratio Non Interest income to Operating Expenses Asset Utilization Ratio Return on Assets Return on Equity Earnings Per Share (Basic & Diluted) Book value per share Net worth (Rs. in Mn) 154, , , , ,594 49
50 Year Ended Mar-11 Year Ended Mar-12 Cost to Income Ratio Non Interest income to Operating Expenses Asset Utilization Ratio Return on Assets Return on Equity Earnings Per Share (Basic & Diluted) Book value per share Net worth (INR/Mn) , ,594 Bus. per employee (INR/Mn) Bus. per branch (INR/Mn) 1, ,

51 Mar-11 Mar-12 AFS HTM HFT TOTAL AFS HTM HFT TOTAL 1. SLR INVESTMENTS 155, , , , ,678 3, ,264 OF WHICH: GOVERNMENT SECURITIES 154, , , , ,325 3, ,250 OTHER APPROVED SECURITIES 1,099 2,055-3, , M Duration - AFS NON SLR INVESTMENTS 135,419 10, , , ,539 M Duration TOTAL 290, , , , ,664 3, ,803 51
 Total 21,700 63 1,558 1,558 11,414 1,441 7,471 355")
52 Type of Investment Book Value Total Provision G-Sec Bonds /CLN Lehman Bros Bonds-Others CLN (Other issuers) Total 21, ,558 1,558 11,414 1,441 7, ,143 3,417 52

53 Tier I Capital 170, , , , ,300 Tier II Capital 78,670 75,630 76,760 78,980 79,160 Total Capital 249, , , , ,470 Total Assets 3,511,725 3,459,576 3,514,381 3,645,565 3,845,360 Risk Weighted Assets 2,047,620 2,126,990 2,069,270 2,236,300 2,354,660 CRAR - Tier I (%) CRAR - Tier II (%) CRAR (%)


54 ,464 1,423 1,374 1,406 1,414 Mar-11 Jun-11 Sep-11 Dec-11 Mar Mar-11 Jun-11 Sept-11 Dec-11 Mar-12 54


55 55

56 56
The Bank that begins with Financial Results Q1, F.Y
 The Bank that begins with Financial Results Q1, F.Y. 2012-13 Analyst Meet August 8 th, 2012 Performance Highlights Jun - 2011 Jun - 2012 Percent 153264 Total Business 130201 17.7 Deposit 77104 89639 16.3
The Bank that begins with Financial Results Q3 & 9Months, F.Y
 The Bank that begins with Financial Results Q3 & 9Months, F.Y. 2012-13 Concall with Analysts 4 th March, 2013 Performance Highlights Mar - 2012 Dec - 2011 Dec - 2012 Percent 152989 157682 Total Business
The Bank that begins with Financial Results Q3 & 9-Months
 The Bank that begins with Financial Results Q3 & 9-Months 2011-12 Tele-Conference with Analysts February 7 th, 2012; 3.30 P.M. Performance Highlights Dec - 2010 Dec - 011 Percent 141915 Total Business
 www.allahabadbank.in Business Mix Sl. No. Parameters Mar'15 Sep'15 Variation Q-o-Q Y-o-Y over Sep'15 over Amt. (%) Amt. (%) 1 Business 331196 346519 340101 344709 4608 1.35 13513 4.08 2 Deposit 184544
Performance During Q4 : FY17-18 * ENABLING THE STAR TO SHINE *
 Performance During Q4 : FY17-18 * ENABLING THE STAR TO SHINE * PERFORMANCE AT A GLANCE Q4 FY18 Parameter Rs. Crore Y-o-Y (%) Growth Business 896,850-3.96 Total Deposits 520,854-3.55 Gross Advances 375,995-4.52
 www.allahabadbank.in Business Mix Sl. No. Parameters Jun'15 Mar'16 Jun'16 Variation Q-o-Q Y-o-Y Jun'16 over Mar'16 Jun'16 over Jun'15 Amt. (%) Amt. (%) 1 Business 334548 358352 350848-7504 -2.09 16300
Performance Highlights
 Presentation on Financial Performance for the Quarter/FY March 2015 1 Performance Highlights Top Line Milestones: Global Assets- Rs. 6.0 Lac Global Deposit- Rs. 5.0 Lac Saving Deposit- Rs. 1.5 Lac Overseas
Financial Results. Q3 FY15 & Nine-months ended December th January 2015
 Financial Results Q3 FY15 & Nine-months ended December 27 th January 2015 1 Highlights Capital CRAR (Basel III) at 10.30%; CET 1: 7.02% Margin Domestic NIM stable at 2.6% Fee Income Core Fee Income up
HIGHLIGHTS OF WORKING RESULTS
 1 HIGHLIGHTS OF WORKING RESULTS 2 Business Global Business at ` 4,67,626 Crore Savings Deposits grew by 23% (Y-o-Y) Income Non - Interest Income increased by 38% (Y-o-Y) Profit Advances Consistent and
Capital Adequacy Ratio (Basel III) Earnings Per share, Book Value Per Share & Share Holdings Pattern
 Earnings Per share, Book Value Per Share & Share Holdings Pattern") 1 Sl. No. Areas of Presentation Slide No 1 Highlights 3 2 Business Cross Section 4 3 Domestic CASA 5 4 Domestic Advances 6 5 Retail Credit Components 7 6 Industry & NBFC Exposure 8 7 Restructured Advances,
1 Sl. No. Areas of Presentation Slide No 1 Highlights 3 2 Business Cross Section 4 3 Domestic CASA 5 4 Domestic Advances 6 5 Retail Credit Components 7 6 Industry & NBFC Exposure 8 7 Restructured Advances,
Highlights. Core Deposits stood at Rs.1,33,672 cr. as at the end of Sept,16 showing growth of 10.53% Y-o-Y basis
 Highlights Total Business stood at Rs. 3,44,428 cr. as at the end of Sept 16 against Rs.3,27,807 cr. as on Jun 16.(Increase by Rs.16,621 cr. over the qrt.) Global Deposits stood at Rs. 2,09,485 cr. as
Welcome to Analysts Meet
 PERFORMANCE HIGHLIGHTS For the Quarter Ended 30 th JUNE, 2013 Welcome to Analysts Meet 31 st July- 2013 Mumbai INDEX Sl. No. Slide Details Slide No. 1 Financial Highlights 4 2 Earnings Cross Section 5
Domestic Branch Network
 Domestic Branch Network RURAL SEMI-URBAN URBAN METRO 20% 19% 20% 41% Branches 2716 Rural-1105 S-Urban-553 Urban-551 Metro-507 3000 2500 2000 1500 Branches 2415 2259 2286 2716 2516 FY'09 FY'10 FY'11 FY'12
154 years in service of the Nation and going strong
 Financial Results Q4 & Welcome Board of Directors 11 th May 2018 154 years in service of the Nation and going strong The Bank s Key Strengths Robust CASA Stable Operating Profit Young & energetic workforce
Movement of business parameters
 2 Movement of business parameters. [ Amt. in Rs. Crore ] During Qtr./ As on QE Q3 vs Q4 Change (%) Performance Highlights During FY/ As on END YoY Change (%) Q3 FY'17 Q4FY'17 2015-16 2016-17 209572 201285-3.95
THE BANKER TO EVERY INDIAN. Quarterly Results Q1 FY 2012
 THE BANKER TO EVERY INDIAN Quarterly Results Q1 FY 2012 1 Rs. In Crores NII growth drives Profitability Parameter Q1 FY 11 Q4 FY 11 Q1 FY 12 YOY Growth % Interest Income 18452 21721 24197 31.14 Interest
HIGHLIGHTS OF WORKING RESULTS
 1 HIGHLIGHTS OF WORKING RESULTS 2 Business Global Business at ` 4,96,122 Crore. Grew by 6% (Y-o-Y) Global Advances at ` 2,23,346 Crore. Grew by 8%(Y-o-Y) Income Net - Interest Income increased by 4% (Y-o-Y)
Growth Powered by Technology, Driven by Customers. Financial Results 31 st March 2017
 Financial Results 31 st March 2017 Performance Highlights Q4 FY 2016-17 NET INTEREST INCOME ` 989.49 cr NON INTEREST INCOME ` Rs.450.16 cr OPERATING PROFIT ` Rs.703.12 cr NET PROFIT ` 203.99 cr NET INTEREST
INVESTOR PRESENTATION. Business Performance
 INVESTOR PRESENTATION Business Performance 31.12.2018 31.12.2018 DISCLAIMER This presentation has been prepared by Karur Vysya Bank Limited ( the Bank ) solely by the Bank for information purposes only.
Investor Presentation
 Investor Presentation 31.12.2016 Awards and Accolades IDRBT Award for the Best Bank Among Small Banks for Digital Banking, 2015-16 on 18.07.2016 IDRBT Award for the Best Bank Among Small Banks for Managing
Financial Results Q1 FY July 28, 2015
 Financial Results Q1 FY 2015-16 July 28, 2015 A Step Towards Digitalization 2 Performance Highlights Business Opex Profitability Global Business increased by 8.6% to ` 582817 crore Savings Deposits grew
Page 1
 Page 1 HIGHLIGHTS MARCH 2015 Major HIghlights Net profit at 2703 crore, up by 10.8% y.o.y. Gross profit at 6950 crore, up by 2.3% y.o.y. Total provisions at 4248 crore compared to 4358 crore in FY14 Non-interest
Un-Audited/ Reviewed Financial Results For the Quarter ended June 30,2018
 Un-Audited/ Reviewed Financial Results For the Quarter ended June 30,2018 1 BUSINESS PROFILE 200000 150000 100000 50000 0 Advances Deposit Business June-17 March-18 June-18 Parameter June 17 Mar 18 June
Audited Financial Results. For Q / FY. March, 2015
 Audited Financial Results For Q / FY March, 2015 1 BUSINESS PROFILE 200000 150000 100000 50000 0 Advances Business Mar-13 Mar-14 Mar-15 Parameter Mar 13 Mar 14 Mar 15 Y-o-Y % Growth Gross Advances 66,457
THE BANKER TO EVERY INDIAN. Annual Results FY
 THE BANKER TO EVERY INDIAN Annual Results FY 2011-12 Healthy Growth in NII and Operating Profit - a Snapshot (1/2) Rs. In Crores Q4 FY11 Q4 FY12 Gr.% FY11 FY12 Gr.% Interest Income 21721 28583 31.59 Interest
Financial Results Q4-10 & FY Analyst Presentation
 Financial Results Q4-10 & FY 2010 Analyst Presentation 6th May, 2010 HIGHLIGHTS OF BUSINESS GROWTH Total Business increased from Rs.236968 Cr. to Rs.291289 Cr. an increase of 22.92% Total Deposits registered
Content. Highlights. Financial Performance. Business Performance. Treasury Operations. Asset Quality. Capital. Digital Banking & Financial Inclusion
 Q2 FY 2019 Content Highlights Financial Performance Business Performance Treasury Operations Asset Quality Capital Digital Banking & Financial Inclusion 2 Highlights 3 Highlights for Quarter September
Business Delivery Channels. Branches Extension Counters ATMs Satellite Offices TOTAL
 1 Branch Mix METRO RURAL SEMI-URBAN URBAN Business Delivery Channels 31.12.2014 31.03.2015 31.12.2015 Branches 2287 2507 2748 27% 16% Extension Counters 9 8 4 ATMs 2156 2232 2323 Satellite Offices 35 35
Financial Highlights Q3 FY18 vs Q3 FY17
 Q3 FY 2018 Financial Highlights Q3 FY18 vs Q3 FY17 Operating Profit Growth 680% NII Growth 105% NIM at 2.16% up by 130 bps Operating expenses is reduced by 10% Recovery/ Up gradation increased to 973 Cr
FINANCIAL RESULTS HY 1 / Q2 FY 18
 1 FINANCIAL RESULTS HY 1 / Q2 FY 18 2 EMERGING ECONOMIC & BANKING SCENARIO Domestic Economy Reset in New Normal Govt s Mega Recapitalization Plan Improved Economic Macros Credit Growth shows green shoots
FINANCIAL HIGHLIGHTS FOR THE QUARTER / NINE MONTHS ENDED
 FINANCIAL HIGHLIGHTS FOR THE QUARTER / NINE MONTHS ENDED 31 ST DECEMBER 2015 PERFORMANCE HIGHLIGHTS- / 20 Total Business of the Bank increased to Rs. 4,59,266 crore from Rs. 4,41,510 crore in December
Financial Performance For the Quarter/ Nine Months Ended 31ST DEC. 2017
 Financial Performance For the Quarter/ Nine Months Ended 31ST DEC. 2017 12th FEBRUARY 2018 1 Corporation Bank was founded in the Year 1906 in Udupi a small town in South India Nationalized in the year
fm- Ref No.:HO:IRC:RB: :85 Date:
 _ fm- V.5+1, p 1l (1 400 051 V-(71 : (022)- 6668 4490 th-tit : (022)- 6668 4491 v) el : headoffice.share@bankofindia.coin 4- Rank of INVESTOR RELATIONS CELL HEAD OFFICE : Star House, C-5, "G" Block, 8th
FINANCIAL HIGHLIGHTS FOR THE QUARTER / NINE MONTHS ENDED
 FINANCIAL HIGHLIGHTS FOR THE QUARTER / NINE MONTHS ENDED 31 ST DECEMBER 2014 PERFORMANCE HIGHLIGHTS- / 20 Total Business of the Bank increased to Rs. 4,41,510 crore from Rs. 4,12,164 crore in December
FINANCIAL HIGHLIGHTS FOR THE QUARTER ENDED
 FINANCIAL HIGHLIGHTS FOR THE QUARTER ENDED 30 th JUNE 2015 PERFORMANCE HIGHLIGHTS- FY 20 Total Business of the Bank increased to Rs. 4,51,739 crore from Rs. 4,26,829 crore in June 2014, recording Y-o-Y
Total Business Gross Advances Total Deposits 12.05% 9.91% 13.82% NIM CASA. CRAR Basel III 2.59% 11.20% 12.52%
 1 Total Business Gross Advances Total Deposits 12.05% 9.91% 13.82% CASA NIM CRAR Basel III 12.52% 2.59% 11.20% 2 PARTICULARS 31.03.2015 31.03.2016 No. of Share % Holding No. of Share % Holding Govt of
FINANCIAL HIGHLIGHTS FOR THE 1 ST QUARTER ENDED 30 TH JUNE 2018
 FINANCIAL HIGHLIGHTS FOR THE 1 ST QUARTER ENDED 30 TH JUNE 2018 PERFORMANCE HIGHLIGHTS- FY 20 Total Business of the Bank increased to Rs. 4,68,535 crore as at June 30, 2018 compared to Rs. 4,66,360 crore
CENTRAL BANK OF INDIA FINANCIAL HIGHLIGHTS FOR THE HALF YEAR
 CENTRAL BANK OF INDIA FINANCIAL HIGHLIGHTS FOR THE HALF YEAR ENDED SEPTEMBER 2011 30 th Performance Highlights Sept 2011-12(` in crore) Parameters Q2FY2012 Q2FY2011 YOY Growth (%) FY2011 Total Business
Analyst Presentation Q1 FY16 2
 Q1 FY 2016 Disclaimer: Certain statements contained in this presentation may be statements of future expectations and other forward-looking statements that are based on third party sources and involve
NET PROFIT (Q4) INCREASED BY 110% Y-O-Y TOTAL NUMBER OF BRANCHES CROSSED 2500 PROVISION COVERAGE RATIO IMPROVED TO 58.93
 INCREASED BY 110% Y-O-Y TOTAL NUMBER OF BRANCHES CROSSED 2500 PROVISION COVERAGE RATIO IMPROVED TO 58.93") 1 NET PROFIT (Q4) INCREASED BY 110% Y-O-Y NIM @ 3.00% FOR FY 2014-15 TOTAL NUMBER OF BRANCHES CROSSED 2500 PROVISION COVERAGE RATIO IMPROVED TO 58.93 CASA DEPOSITS CROSSED 27% NET NPAs BELOW 3% 2 BRANCH
1 NET PROFIT (Q4) INCREASED BY 110% Y-O-Y NIM @ 3.00% FOR FY 2014-15 TOTAL NUMBER OF BRANCHES CROSSED 2500 PROVISION COVERAGE RATIO IMPROVED TO 58.93 CASA DEPOSITS CROSSED 27% NET NPAs BELOW 3% 2 BRANCH
isyndicateb ank has W13? W37 i3v7sl'llnvestor Relations Centre m 30$?)- 351m:
- 351m:") 2"d aria: mm am, has 560009 351m: 080-22283030 amt: 080-22283030 m 30$?)- inrc@syndlicatebank.co.in fi- F: 5 _ ' \ isyndicateb ank SyndicateBank,Corporate Office 2" Cross, Gandhi Nagar, Bengaluru - 560009
2"d aria: mm am, has 560009 351m: 080-22283030 amt: 080-22283030 m 30$?)- inrc@syndlicatebank.co.in fi- F: 5 _ ' \ isyndicateb ank SyndicateBank,Corporate Office 2" Cross, Gandhi Nagar, Bengaluru - 560009
FINANCIAL RESULTS Q1 FY 18
 1 FINANCIAL RESULTS Q1 FY 18 2 EMERGING ECONOMIC & BANKING SCENARIO Strengthening of NPA Resolution Process Strong Macro Economic Environment Good Monsoon Improves Rural Business Growth Outlook Re-emergence
Performance Review: Q July 25, 2003
 Performance Review: 2004 July 25, Highlights 34% increase in profit after tax to Rs. 3.40 bn compared to Rs. 2.53 bn in Net interest margin improved to 1.7% for 2004 compared to 1.4% for FY Equity capital
Audited Quarterly & Full-Year Results March 31, 2015
 Earnings Update Audited Quarterly & Full-Year Results March 31, 2015 The Board of Directors of The Jammu & Kashmir Bank Ltd. at their meeting held on May 16, 2015 took on record the Audited Financial Results
State Bank of India PRESS RELEASE H1FY
 SBI STAND ALONE RESULTS HIGHLIGHTS State Bank of India PRESS RELEASE H1FY 2011-12 Net Profit of the Bank is up by 12.36% YOY from Rs.2501 crores in Q2 FY11 to Rs.2810 crores in Q2FY12. Sequentially it
Analyst I Institutional Investor Meet Presentation & Press Release
 'Sr4TH t dlt 1ft-5, WE tik1 ch 8a1- cii50 tillei wilt TO, ticti 400 051 TOR-- 22-66684490 ait-022-66684491 tilm:headoffice.share(ri,:bankofindia.co.in Eznk of India INVESTOR RELATIONS CELL HEAD OFFICE
INVESTOR PRESENTATION FEDERAL BANK FY
 INVESTOR PRESENTATION FY 2010-11 Second Quarter Results as on 30.09.2010 PERFORMANCE HIGHLIGHTS (Q2 FY 2011 vs Q2 FY 2010) Net Interest Income up by 32.86 % from Rs.329.95 Cr to Rs.438.37 Cr Operating
State Bank of India PRESS RELEASE Q1FY Operating Profit recorded a YOY growth of 18.06% Q1FY11, while sequentially it is up by 19.12%.
 SBI STAND ALONE RESULTS HIGHLIGHTS State Bank of India PRESS RELEASE Q1FY 2011-12 Operating Profit recorded a YOY growth of 18.06% Q1FY11, while sequentially it is up by 19.12%. in Q1FY12 over Net Profit
Analyst Presentation - Q4 & FY15 2
 Q4 & FY 2015 Disclaimer: Certain statements contained in this presentation may be statements of future expectations and other forward-looking statements that are based on third party sources and involve
Financial Results Q2 & H1 FY November 06, 2015
 Financial Results Q2 & H1 FY 2015-16 November 06, 2015 Highest Gainer in Brand Value Brand value rises 72% on accelerated digitalization efforts. 2 Structural Transformation Initiative 3 Performance Highlights
Terminal Business Mix
 12 th November 2018 Terminal Business Mix Parameters Sep-18 Jun-18 Sep-17 Y-o-Y Variation Amount % 1 Business 298823 294065 312175-13352 -4.28 Domestic 282257 274424 280393 1864 0.66 Overseas 16566 19641
RETAIL PNB -DIGITAL PNB
 RETAIL PNB -DIGITAL PNB Presentation on Financial Performance for the Quarter/FY March 2016 1 Operating Profit of the Bank crosses landmark of Rs. 12000 cr. (OverRs.10000cr.forconsecutive5years). Domestic
The Bank that begins with. Financial Results Q-4 / FY ( )
") The Bank that begins with Financial Results Q-4 / FY (2014-15 ) Result at A Glance. Performance Parameter Rs. crore Ratio for 2014-15 (in %) Net Profit 256 Return on Assets 0.21% Operating Profit 2428
The Bank that begins with Financial Results Q-4 / FY (2014-15 ) Result at A Glance. Performance Parameter Rs. crore Ratio for 2014-15 (in %) Net Profit 256 Return on Assets 0.21% Operating Profit 2428
Performance Analysis:
 Performance Analysis: Q3 FY 2016 (April December 2015) February 13, 2016 2016 Bank of Baroda. All Rights Reserved 1 Bank of Baroda: Our Key Strengths Bank of Baroda is a 107 years old State-owned Bank
Disclosures under Pillar 3 in terms of Guidelines on composition of Capital Disclosure Requirements of Reserve Bank of India as on 30 th June 2014
 Disclosures under Pillar 3 in terms of Guidelines on composition of Capital Disclosure Requirements of Reserve Bank of India as on 30 th June 2014 Table DF-2 : Capital Adequacy Qualitative disclosures:
Investor Presentation Q3 FY 12
 Investor Presentation Q3 FY 12 Performance Highlights Profitability Measure ROA 1.30 1.44 1.41 11.37 14.29 14.56 Shareholder Value Measure ROE 37.30 38.91 37.13 Efficiency Measure COST-INCOME 0.81 0.58
Q2 FY 12 INVESTOR PRESENTATION
 Q2 FY 12 INVESTOR PRESENTATION PERFORMANCE HIGHLIGHTS Profitability Measure ROA 1.34 1.15 1.44 11.48% 11.28% 14.29% Shareholder Value Measure ROE 38.60% 38.91% Efficiency Measure COST-INCOME 33.90% 0.68
IIP growth (%) Rates FY CPI(YoY) in % Repo Reverse Repo MSF Call Money(Daily movement) A p r.
 Rates FY CPI(YoY) in % Repo Reverse Repo MSF Call Money(Daily movement) A p r.") 2 Rates FY13-14 Repo Reverse Repo MSF Call Money(Daily movement) 13.5 12.5 11.5 10.5 9.5 8.5 7.5 6.5 5.5 A p r M a y J u n J u l A u g S e p O c t N o v D e c J a n F e b M a r IIP growth (%) 3.5 2.6 2.7
2 Rates FY13-14 Repo Reverse Repo MSF Call Money(Daily movement) 13.5 12.5 11.5 10.5 9.5 8.5 7.5 6.5 5.5 A p r M a y J u n J u l A u g S e p O c t N o v D e c J a n F e b M a r IIP growth (%) 3.5 2.6 2.7
Disclosures under Pillar 3 in terms of New Capital Adequacy Framework (Basel III) of Reserve Bank of India as on 30 th June 2013
 of Reserve Bank of India as on 30 th June 2013") Disclosures under Pillar 3 in terms of New Capital Adequacy Framework (Basel III) of Reserve Bank of India as on 30 th June 2013 Table DF-2 : Capital Adequacy The Bank s Minimum Capital Requirement and
Disclosures under Pillar 3 in terms of New Capital Adequacy Framework (Basel III) of Reserve Bank of India as on 30 th June 2013 Table DF-2 : Capital Adequacy The Bank s Minimum Capital Requirement and
PRESS RELEASE BANK OF INDIA ANNOUNCES DECEMBER 2017 (Q3 - FY ) FINANCIAL RESULTS
 FINANCIAL RESULTS") PRESS RELEASE BANK OF INDIA ANNOUNCES DECEMBER 2017 (Q3 - FY 2017-18) FINANCIAL RESULTS Bank of India announced its audited results for the Q3 FY 2017-18, following approval by its Board of Directors on
PRESS RELEASE BANK OF INDIA ANNOUNCES DECEMBER 2017 (Q3 - FY 2017-18) FINANCIAL RESULTS Bank of India announced its audited results for the Q3 FY 2017-18, following approval by its Board of Directors on
Analyst Presentation
 Quarterly Results Q3FY19 Analyst Presentation 01.02.2019 Safe Harbor Certain statements in these slides are forwardlooking statements. These statements are based on Management's current expectations and
Content. Highlights. Financial Performance. Business Performance. Treasury Operations. Asset Quality. Capital. Prompt Corrective Action Matrix
 Q3 FY 2019 Content Highlights Financial Performance Business Performance Treasury Operations Asset Quality Capital Prompt Corrective Action Matrix Digital Banking & Financial Inclusion IDBI-LIC Deal 2
Analyst Presentation Q2 FY16 2
 Q2 FY 2016 Disclaimer: Certain statements contained in this presentation may be statements of future expectations and other forward-looking statements that are based on third party sources and involve
INVESTOR PRESENTATION FEDERAL BANK
 INVESTOR PRESENTATION FY 2010-11 Fourth Quarter & Annual Results as on 31.03.2011 PERFORMANCE HIGHLIGHTS Q4 FY 11 FY 2011 (YOY growth) (YOY growth) Net Interest Income Fee Income Total Income Net Profit
(_NI r- elki 1 iii)05li V. 3TaTTH?V, R 0? C
05li V. 3TaTTH?V, R 0? C") CIN: L65190MH2004G01148838 31> 3l tmf21d6 ti ft-a 0,1eliCle4 : 311 z- e-iii oid-,actd, colo tre`u, 311 CT,R, t4-400 005. 47W : (+91 22) 6655 3355, 2218 9111 : (+91 22) 2218 0411 t-4t11-"c: www.idbi.com
CIN: L65190MH2004G01148838 31> 3l tmf21d6 ti ft-a 0,1eliCle4 : 311 z- e-iii oid-,actd, colo tre`u, 311 CT,R, t4-400 005. 47W : (+91 22) 6655 3355, 2218 9111 : (+91 22) 2218 0411 t-4t11-"c: www.idbi.com
Earnings Presentation. Annual Results FY16-17
 Earnings Presentation Annual Results FY16-17 1 Safe Harbor Except for the historical information contained herein, statements in this release which contain words or phrases such as will, aim, will likely
FINANCIAL RESULTS 9M / Q3 FY 17
 FINANCIAL RESULTS 9M / Q3 FY 17 1 PNB s Key Strength Reducing stressed assets formation Commanding share in CASA Sustaining Growth, Profitability & Strength Strong Retail Base Fast pace of Digitalization
ANALYST S MEET. Performance Highlights For the Financial Year ended 31-March-2015
 ANALYST S MEET Performance Highlights For the Financial Year ended 31-March-2015 Sl. No. Areas of Presentation Slide No. 1 Highlights 3 2 Business Cross Section 4 3 Deposits 5 4 Domestic Advances 6 5 Infrastructure
FINANCIAL RESULTS. Quarter & FY Ended March 2017
 1 FINANCIAL RESULTS Quarter & FY Ended March 2017 2 01 MAJOR HIGHLIGHTS Higher Operating Profit : Rs. 14565 Cr 02 Gross & Net NPA below March 16 as well as Dec 16 Level GNNPA = Rs. 55370 Cr. NNPA= Rs.
Financial Results for Quarter/ Financial Year ended 31 st March 2018 SMALL STEPS TOWARDS BIG CHANGE
 Financial Results for Quarter/ Financial Year ended 31 st March 2018 SMALL STEPS TOWARDS BIG CHANGE Performance Highlights Assets, Liabilities & Business Overview Loans & Advances Asset Quality Investments
Disclosures under Pillar 3 in terms of Guidelines on composition of Capital Disclosure Requirements of Reserve Bank of India as on 30 th June 2018
 Disclosures under Pillar 3 in terms of Guidelines on composition of Capital Disclosure Requirements of Reserve Bank of India as on 30 th June 2018 Table DF-2 : Capital Adequacy Quantitative disclosures:
The Bank that begins with. Financial Results Q3 ( )
") The Bank that begins with Financial Results Q3 (2013-14 ) HIGHLIGHTS 31.12.2013. Total Business at Rs.188867 crore, with a y-o-y growth of 19.78%. Highlights Total Deposits increased to Rs.109891 crore,
The Bank that begins with Financial Results Q3 (2013-14 ) HIGHLIGHTS 31.12.2013. Total Business at Rs.188867 crore, with a y-o-y growth of 19.78%. Highlights Total Deposits increased to Rs.109891 crore,
The Bank that begins with Financial Results
 The Bank that begins with U Financial Results 2010-2011 Analyst Meet Trident, Mumbai May 4, 2011 Performance Highlights 2009-10 2010-11 Percent 131779 Total Business 110936 18.8 Deposit 68180 77845 14.2
Q4 FY 13. Investor Information
 Q4 FY 13 Investor Information Key Messages : FY 13 Retail Advance grew by 25.47% (12.58%) SME Advance grew by 22.44% (9.49%) Retail & SME Customer base increased by 79.8% in 12 months (32.90%) Other Income
Disclosures under Pillar 3 in terms of Guidelines on composition of Capital Disclosure Requirements of Reserve Bank of India as on 30 th June 2016
 Disclosures under Pillar 3 in terms of Guidelines on composition of Capital Disclosure Requirements of Reserve Bank of India as on 30 th June 2016 Table DF-2 : Capital Adequacy Quantitative disclosures:
FY First Quarter Results. Investor Presentation
 FY 2009-10 First Quarter Results Investor Presentation 1 Performance Highlights Q1FY10 Net Profit Net Interest Income Fee Income Operating Revenue Operating Profit 70% YOY 29% YOY 17% YOY 40% YOY 47% YOY
YES BANK LIMITED DISCLOSURES UNDER THE NEW CAPITAL ADEQUACY FRAMEWORK PILLAR III (BASEL II)
") YES BANK LIMITED DISCLOSURES UNDER THE NEW CAPITAL ADEQUACY FRAMEWORK PILLAR III (BASEL II) 1. Scope of Application YES BANK Limited is a publicly held bank; which was incorporated as a limited company
YES BANK LIMITED DISCLOSURES UNDER THE NEW CAPITAL ADEQUACY FRAMEWORK PILLAR III (BASEL II) 1. Scope of Application YES BANK Limited is a publicly held bank; which was incorporated as a limited company
Particulars 30 Sep 12
 1. Scope of application Qualitative Disclosures DBS Bank Ltd., India ( the Bank ) operates in India as a branch of DBS Bank Ltd., Singapore a banking entity incorporated in Singapore with limited liability.
Financial Results Q4 FY & FY May 13, 2016
 Financial Results Q4 FY 2015-16 & FY 2015-16 May 13, 2016 Table of Contents #1 Story of Transformation #2 Business Performance #3 Financials 2 Structural Transformation 3 Structural Transformation Medium
Management s Discussion & Analysis
 Management s Discussion & Analysis FINANCIALS AS PER INDIAN GAAP The effective date of the merger of ICICI, ICICI PFS and ICICI Capital with ICICI Bank ( the merger ) was May 3, 2002. However, the Appointed
Touching Hearts Spreading Smiles since 1937
 Good People to Grow With Touching Hearts Spreading Smiles since 1937 Presentation to Analysts June 2015 (in INR) Continuing Tradition of Quiet & Dignified Service to the Society Good People to Grow With
Analyst Presentation
 Quarterly Results Q1FY19 Analyst Presentation 10.08.2018 Safe Harbor Certain statements in these slides are forwardlooking statements. These statements are based on Management's current expectations and
DISCLOSURES UNDER THE NEW CAPITAL ADEQUACY FRAMEWORK (BASEL II GUIDELINES) FOR THE HALF YEAR ENDED 30 th SEPTEMBER 2009
 FOR THE HALF YEAR ENDED 30 th SEPTEMBER 2009") DISCLOSURES UNDER THE NEW CAPITAL ADEQUACY FRAMEWORK (BASEL II GUIDELINES) FOR THE HALF YEAR ENDED 30 th SEPTEMBER 2009 I. SCOPE OF APPLICATION Axis Bank Limited (the Bank ) is a commercial bank, which
DISCLOSURES UNDER THE NEW CAPITAL ADEQUACY FRAMEWORK (BASEL II GUIDELINES) FOR THE HALF YEAR ENDED 30 th SEPTEMBER 2009 I. SCOPE OF APPLICATION Axis Bank Limited (the Bank ) is a commercial bank, which
FINANCIAL HIGHLIGHTS FOR THE 4 TH QUARTER & FINANCIAL YEAR ENDED 31 ST MARCH 2018
 FINANCIAL HIGHLIGHTS FOR THE 4 TH QUARTER & FINANCIAL YEAR ENDED 31 ST MARCH 2018 PERFORMANCE HIGHLIGHTS- & 20 Total Business of the Bank improved to Rs. 4,72,323 crore in March 31, 2018 as against Rs.
DENA BANK. WELCOMES YOU AT ANALYST MEET 6 th November Un-Audited [Reviewed] Quarterly/Half Yearly Financial Results For September 30, 2012
![DENA BANK. WELCOMES YOU AT ANALYST MEET 6 th November Un-Audited [Reviewed] Quarterly/Half Yearly Financial Results For September 30, 2012](/thumbs/88/115527137.jpg "DENA BANK. WELCOMES YOU AT ANALYST MEET 6 th November Un-Audited [Reviewed] Quarterly/Half Yearly Financial Results For September 30, 2012") DENA BANK WELCOMES YOU AT ANALYST MEET 6 th November 01 Un-Audited [Reviewed] Quarterly/Half Yearly Financial Results For September 30, 01 KEY INDICATORS [` cr] Full Year Quarter March 1 Sept 11 Sept 1
DENA BANK WELCOMES YOU AT ANALYST MEET 6 th November 01 Un-Audited [Reviewed] Quarterly/Half Yearly Financial Results For September 30, 01 KEY INDICATORS [` cr] Full Year Quarter March 1 Sept 11 Sept 1
Robust Operating Momentum
 Key Messages Operating Momentum Continues to make Strong Progress **** Healthy Core Engine Robust Operating Momentum Highest ever Operating Profit @ 708cr, grows 26% Y-o-Y Highest ever Net Profit @ 334Cr,
DISCLOSURES UNDER THE NEW CAPITAL ADEQUACY FRAMEWORK (BASEL II GUIDELINES)
") DISCLOSURES UNDER THE NEW CAPITAL ADEQUACY FRAMEWORK (BASEL II GUIDELINES) I. Scope of Application IndusInd Bank Limited ( the Bank ) is a commercial bank, which was incorporated on 31 st January 1994.
DISCLOSURES UNDER THE NEW CAPITAL ADEQUACY FRAMEWORK (BASEL II GUIDELINES) I. Scope of Application IndusInd Bank Limited ( the Bank ) is a commercial bank, which was incorporated on 31 st January 1994.
Leading provider of long term finance
 Presentation to Analysts June 2014 Genesis 1964-1976 1976 1994-00 2003-06 2007-14 Set up by an Act of Parliament in 1964 as a subsidiary of the Central Bank (RBI) Ownership transferred to Govt. in 1976
Strong Operating Momentum. Operating Profit grows 20% Y-o-Y Robust Growth across all Business Segments Highest ever
 Key Messages Robust Operating Momentum **** Healthy Core Engine Strong Operating Momentum Operating Profit grows 20% Y-o-Y Robust Growth across all Business Segments Highest ever NII @1022Cr Granular Liability
Market Share in Advances increases to 1.01%. Up by 6bps. Market Share in deposits increases to 0.91%. Up by 3bps Y-o-Y
 Key Messages Robust and Diversified Credit Growth Continues. Blended Y-o-Y Growth rate of 22% Refined Retail Asset delivery architecture yields results (HL grows 26% Y-o-Y; 7% Q-o-Q and Auto grows 68%Y-o-Y;15%Q-o-Q;
Good People to Grow With. Presentation to Analysts. March 2017 (in INR)
") Good People to Grow With Presentation to Analysts March 2017 (in INR) Good People to Grow With 2 INDEX Particulars slide No Particulars slide No Highlights 4 Asset Classification 22 Milestones 5-6 NPA
Good People to Grow With Presentation to Analysts March 2017 (in INR) Good People to Grow With 2 INDEX Particulars slide No Particulars slide No Highlights 4 Asset Classification 22 Milestones 5-6 NPA
Q1 FY19 FINANCIALS JUNE 30, 2018
 Q1 FY19 FINANCIALS JUNE 30, 2018 Key Highlights: Q1 FY19 (In lacs) 16.0 10.1 No. of Customers (Total: 30.8 lacs IBL customers: 13.4 lacs) 19.4 11.1 23.3 12.2 5.9 8.3 11.0 27.0 30.8 12.9 14.1 13.4 17.4
August 11, 2016 Performance Analysis
 August 11, 2016 Performance Analysis Q1, FY 2017 Performance Highlights: Q1 FY 17 1 Operating Profit at INR 2,669 crore, the highest in 5 quarters 2 Profit after Tax at INR 424 crore from a loss position
PRESS RELEASE 17 th July 2012
 PRESS RELEASE 17 th July 2012 AXIS BANK ANNOUNCES Q1FY13 NET PROFIT OF `1,153.52 CRORES, UP BY 22% YOY The Board of Directors of Axis Bank Limited approved the financial results for the quarter ended 30
DCB Bank Ltd. 1 P a g e
 4 Recommendation HOLD Another strong quarter CMP (16/04/2015) Rs. 120 Target Price Rs. 140 Sector Stock Details Banking BSE Code 532772 NSE Code Bloomberg Code DCB DEVB IN Market Cap (Rs cr) 3383 Free
CMP* (Rs) 145 Upside/ (Downside) (%) 32 Bloomberg Ticker BOB IN Market Cap. (Rs bn) 384 Free Float (%) 36 Shares O/S (mn) 2,646
 145 Upside/ (Downside) (%) 32 Bloomberg Ticker BOB IN Market Cap. (Rs bn) 384 Free Float (%) 36 Shares O/S (mn) 2,646") 4QFY18 Result Update May 28, 218 Market Cap. (Rs bn) 384 Free Float 36 Shares O/S (mn) 2,646 Improving Outlook; Maintain (BoB) has reported elevated fresh slippages of Rs125.7bn (+123% QoQ and +28% YoY)
4QFY18 Result Update May 28, 218 Market Cap. (Rs bn) 384 Free Float 36 Shares O/S (mn) 2,646 Improving Outlook; Maintain (BoB) has reported elevated fresh slippages of Rs125.7bn (+123% QoQ and +28% YoY)
Analysts Meet. PERFORMANCE HIGHLIGHTS for the Financial Year ended 31st MARCH, Analysts Meet: 08/05/2014
 1 Analysts Meet PERFORMANCE HIGHLIGHTS for the Financial Year ended 31st MARCH, 2014 Analysts Meet: 08/05/2014 INDEX Sl. No. Slide Details Slide No. 1 Financial Highlights Quarterly 3 2 Interest Analysis
Investor Presentation
 Investor Presentation January 11, 2018 Q3 FY18 Performance Highlights Key performance indicators remained stable NII up 20% ; Core Fee growth at 22 % YoY YoY PAT growth up by 25 % NIM remained steady at
Strong, Consistent & Sustainable Growth. Bank further cements its position as a national player through the Why Settle for Less? Marketing Campaign
 Key Messages Credit continues growth trend. Book grows by 25% Y-o-Y. Credit Growth spread evenly across all segments. Ahead of system growth continues New client acquisition across all segments shows robust
Investor Presentation
 Investor Presentation October 12, 2017 Q2-FY18 Results 2 Q2 FY18 Performance Highlights Key performance indicators remained stable NII up 25% ; Core Fee growth at 23 % YoY; YoY PAT growth up by 25 % NIM