Annual Report. Towards Product Leadership. Atria Plc Annual Report Atria Plc. Table of Contents. Atria Group s financial year 2010
|
|
|
- Mercy Cameron
- 5 years ago
- Views:
Transcription


 Atria refers to the entire Atria Group in this annual report. Principles.")
1 Atria Plc Annual Report 2010 Atria Plc Table of Contents Atria Plc is a powerfully growing and internationalizing Finnish food-industry company. Atria is the largest meat processor in Finland in the terms of sales and one of the leading food industry companies in the Nordic countries, Russia and the Baltic region. Atria s1) net sales in 2010 was EUR 1,301 million and it employed an average of 5,812 persons. The Group is divided into four business areas: Atria Finland, Atria Scandinavia, Atria Russia and Atria Baltic. Atria s customer groups are retail trade, Food Service sector and industry. In addition it has a Fast Food concept business based on its own brands. Atria s roots go back to 1903, when its oldest owner co-operative was founded. Atria Plc s shares are listed on the Nasdaq OMX Helsinki Ltd. Atria Group s financial year 2010 Financial summary CEO s review...2 Atria s brands...4 Atria s strategy...6 Review of operations Atria Finland...12 Atria Scandinavia...18 Atria Russia...22 Atria Baltic...26 Product development and marketing...28 Corporate responsibility 1) Atria refers to the entire Atria Group in this annual report. Principles...30 Financial responsibility...32 Environmental responsibility...33 Atria s quality-, environmentand product safety systems...35 Social responsibility...38 Financial statement and annual report...42 Corporate governance Annual Report Atria Plc P.O. BOX 900, FI ATRIA FINLAND Tel Fax: Towards Product Leadership Corporate Governance Code Atria Plc s administration Atria Group s organisation and management team Investor relations and analysts Contact details...122
2 Atria Plc Annual Report 2010 Atria Plc Table of Contents Atria Plc is a powerfully growing and internationalizing Finnish food-industry company. Atria is the largest meat processor in Finland in the terms of sales and one of the leading food industry companies in the Nordic countries, Russia and the Baltic region. Atria s1) net sales in 2010 was EUR 1,301 million and it employed an average of 5,812 persons. The Group is divided into four business areas: Atria Finland, Atria Scandinavia, Atria Russia and Atria Baltic. Atria s customer groups are retail trade, Food Service sector and industry. In addition it has a Fast Food concept business based on its own brands. Atria s roots go back to 1903, when its oldest owner co-operative was founded. Atria Plc s shares are listed on the Nasdaq OMX Helsinki Ltd. Atria Group s financial year 2010 Financial summary CEO s review...2 Atria s brands...4 Atria s strategy...6 Review of operations Atria Finland...12 Atria Scandinavia...18 Atria Russia...22 Atria Baltic...26 Product development and marketing...28 Corporate responsibility 1) Atria refers to the entire Atria Group in this annual report. Principles...30 Financial responsibility...32 Environmental responsibility...33 Atria s quality-, environmentand product safety systems...35 Social responsibility...38 Financial statement and annual report...42 Corporate governance Annual Report Atria Plc P.O. BOX 900, FI ATRIA FINLAND Tel Fax: Towards Product Leadership Corporate Governance Code Atria Plc s administration Atria Group s organisation and management team Investor relations and analysts Contact details...122
3 Atria Group Year 2010 Atria Group key indicators Net sales, EUR million 1, ,316.0 EBIT, EUR million EBIT, % Profit before tax, EUR million Earnings per share, EUR Equity ratio, % Gross investments, EUR million Gross investments of net sales, % Average personnel 5,812 6,214 Net sales EUR mill. 1,400 1,200 1, Ebit EUR mill Earnings per share EUR Gross investments Equity ratio Average personnel EUR mill Percent Persons 7,000 6,000 5,000 4,000 3,000 2,000 1,


 Core product groups cold cuts consumer-packed meat 2) meat products, such as sausages and cold cuts convenience food delicatessen products, such as premium cheese, premium sausages and")
4 Atria s business areas Atria Finland Atria s Customers consumer goods retail trade Food Service customers 1) food industry export customers concept customers Key Indicators Net sales, EUR million EBIT, EUR million EBIT, % Average personnel 2,089 2,222 Core product groups fresh and consumerpacked meat meat products, such as sausages and cold cuts convenience food poultry products Share in Group net sales Share in Group net sales...58% Rest of Group...42% Atria Scandinavia Customers consumer goods retail trade Food Service customers 1) Deli customers (Ridderheims customers and Falbygdens Ost customers) Concept customers (Sibylla concept customers) Core product groups cold cuts consumer-packed meat 2) meat products, such as sausages and cold cuts convenience food delicatessen products, such as premium cheese, premium sausages and marinated fresh products Key Indicators Net sales, EUR million EBIT, EUR million EBIT, % Average personnel 1,205 1,394 Share in Group net sales Share in Group net sales...29% Rest of Group...71% In Atria s market ar in European parts of 60 mi Production Plants 1. Nurmo 2. Forssa 3. Kuopio 4. Kauhajoki 5. Karkkila 6. Sköllersta 7. Malmö/Fosie 8. Stockholm 9. Tranås 10. Halmstad 1) Includes customers of hotel, restaurant and catering (Food Service) enterprises as well as public administration customers. 2) Production discontinued in 2010
5 Market Area Atria Russia Customers Key Indicators 2010 consumer goods retail trade Food Service customers 1) Concept customers Net sales, EUR million EBIT, EUR million EBIT, % Core product groups Average personnel 2,048 2,003 meat products, particularly sausages cold cuts convenience food (pizza, etc.) Share in Group net sales fresh meat Atria Russia s primary production 2 5 Share in Group net sales...10% Rest of Group...90% Atria Baltic ea, in the Baltic Sea region and Russia, there are approximately llion consumers. 11. Skene 12. Moheda 13. Borås 14. Falköping 15. Horsens 16. St. Petersburg area (Sinyavino, Gorelovo) 17. Moscow 18. Valga 19. Vastse-Kuuste Customers consumer goods retail trade Food Service customers 1) Core product groups meat products, particularly sausages cold cuts fresh and consumer-packed meat Atria Baltia s primary production Key Indicators Net sales, EUR million EBIT, EUR million EBIT, % Average personnel Share in Group net sales Share in Group net sales...3% Rest of Group...97%
6 CEO s Review Year was disappointing from the point of view of financial performance. A positive aspect is that Atria strengthened its competitiveness. The set growth and profitability targets were achieved only partially in markets characterised by weak purchasing power. Net sales reached the previous year s level. However, EBIT fell clearly short. The slight decline (approx. 1%) in net sales was caused by a decrease in sales in the Scandinavian and Finnish business areas. In Sweden, Atria discontinued part of its business, and in Finland, sales volumes decreased due to the effects of the industrial dispute in the spring. In addition, the direct and indirect effects of the dispute weakened Atria Finland s earnings markedly. However, the weaker profitability of Atria Group was mainly due to the loss-making operations of Atria Russia. It was caused by weak demand, increased raw material costs and tougher price competition. The losses were worsened by exceptionally high non-recurring costs. The targets related to securing and improving Atria s sustainable competitiveness were achieved for the most part. In all of its business areas, the company continued to implement efficiency improvement programmes to improve its operational cost efficiency and slim down its cost structure. The results of the programmes were particularly visible in the improved earnings made by Atria Scandinavia and Atria Baltic. The systematic aim of Atria s new strategy, which maps out goals up to 2013, is to focus on improving the company s competitiveness and profitability. Strengthening competitiveness in weak market conditions Atria was well positioned to achieve profitable growth after the difficult recession year of The operational environment proved, however, surprisingly challenging for us, as well as for most companies in the food industry. Although consumers purchasing power began to strengthen in all of our business areas at the end of 2010, recovery was slower than expected throughout the year. The demand for daily consumer goods remained low, which weighed down the increase in the demand for fresh food products and caused significant price competition, both between the chains in the consumer goods retail trade and within our industry. As a consequence of price competition, the consumer sales value of the product groups we represent decreased in practically all of our countries of operation. By far Atria s most challenging operational environment was Russia, where total sales of meat products in the consumer goods retail trade decreased by approximately 10 per cent and prices remained low. At the same time, the price of the meat raw material used by Atria Russia increased by over 25 per cent. Raw material costs could not be passed on to consumer prices swiftly due to intense price competition. The contraction of the value of demand and sales was similar within Atria Baltic in Estonia. The Swedish consumer goods market was expected to grow by 4 per cent, but it only grew by slightly over 2 per cent. The meat product markets represented by Atria Scandinavia grew even less than this, and their growth stood at approximately 1 per cent. In Finland, the overall demand for food recovered, especially towards the end of the year. However, the average price of food in the food trade decreased by nearly 5 per cent during the year. The challenges of low demand and low prices were, however, small compared to the difficulties caused by the industrial dispute in the spring. These caused directly or indirectly most of the decrease in Atria Finland s net sales and EBIT, which fell by EUR 14 million and EUR 12 million, respectively. Efficiency improvement programmes improved profitability Although Atria s earnings were affected by the loss-making operations in Russia, in other business areas operational profitability developed favourably considering the circumstances. Atria Scandinavia s EBIT grew by approximately 40 per cent, and in the last quarter, the company nearly reached an EBIT margin of 6 per cent. The improvement in profitability was fuelled by the clear strengthening of the Swedish krona. Atria Baltic s operations continued to be in the red. However, its operating loss decreased by over 30 per cent compared to the previous year. Atria Finland s EBIT, which was in excess of EUR 30 million, was a good performance in unusual conditions. Atria s favourable profitability development was supported by many major restructuring operations and efficiency improvement programmes. In Sweden, we discontinued the production of consumer packed meat due to its low profitability. In Russia, we transfer a large part of our meat product production to the centralised Gorelovo plant in St Petersburg, which was opened in the spring. We expect the measures to generate annual cost 2

7 Year 2010 savings of approximately EUR 6 million by mid In Estonia, we transferred the operations of the Ahja production plant to a centralised plant. In Finland, we launched a well-planned efficiency improvement programme to transfer bovine slaughtering to the Kauhajoki unit, which will be a very competitive plant, even by the highest European standards. We expect this arrangement to generate cost structure savings amounting to EUR 6 million per year. This efficiency improvement programme was approved at the beginning of The new Kauhajoki bovine slaughterhouse will be completed by the end of All these arrangements improved and will continue to improve our cost efficiency and structure even if they did not reach their full potential in terms of earnings, due to the weak market conditions. Focus on profitability Atria s financial development focuses on significantly improving the profitability of our international companies in the coming years. This is the core message of our renewed strategy, which maps out goals up to The strategy is presented in this Annual Report, starting on page 6. Under the new strategy the focus is on strengthening Atria s financial position and balance sheet structure. Efforts will focus on raising the company s equity ratio and return on equity quite significantly. At the same time net gearing should be brought down correspondingly. The financial position will be enhanced, first and foremost, by improving profitability and cash flow. The company will also release assets from the balance sheet through a reduction of working capital. I would like to thank Atria employees and our partners for their excellent work for the benefit of our customers, our shareholders and our company. Seinäjoki, 18 March 2011 Juha Gröhn President and CEO, Atria Plc Year 2011 There are two opposite directions of development in Atria s operational environment, and the balance of these directions will determine the extent of Atria s growth and profitability in A positive development is the slight increase in consumer demand in Finland, Sweden, Denmark and Estonia. Demand will recover in Russia as well, although more slowly than in the aforementioned countries. With higher demand, Atria is wellplaced for organic growth. The growth in our net sales is, however, weighed down by the smaller sales volumes in Sweden due to the discontinuation of the production of consumer packed meat, as well as by the challenging situation in Russia with respect to demand and prices. The alarmingly sharp increase in the prices of crops, feed and other raw materials is an unfavourable development. If raw material costs are not passed on to consumer prices swiftly enough and to an adequate extent, and if there is a large oversupply of meat, the profit-making capacity of Atria and the entire meat processing industry will deteriorate dramatically. If this threatening scenario is averted, Atria is well-placed for significantly better earnings. 3
.")

8 Brands in 2010 Strong regional and international brands are an essential element of Atria s growth strategy. Their importance is further emphasised in the new strategy, which maps out Atria s goals up to 2013 (see page 6). By concentrating product development and marketing investments on strengthening its own brands, Atria has good preconditions to develop products with a higher degree of processing and more profitable price levels. Strong brands make it significantly easier to develop and launch new product groups and concepts, as well as new business models. Atria s goal is to place its brands among the two best-known brands in all of its business areas. Atria Finland Atria Finland s leading brand is Atria, one of the best-known and most valued food brands in Finland. In Finland, Atria is the market leader in many of its product groups. Its total market share in the consumer goods retail trade is approximately 25 per cent. Atria Baltic By roots and nature, Atria Baltic s brands in Estonia are local brands that, with the centralisation of the consumer goods retail trade, have grown into national brands. The most important brands are Maks & Moorits and Wõro, whose grill sausages are market leaders in their segment. 4


9 Brands Atria Scandinavia Atria Scandinavia has an extensive selection of brands. The best-known brand in Sweden is Sibylla, which is also Atria s most international brand. With a market share of approximately 30 per cent, the Ridderheims and Falbygdens delicatessen products, which are marketed by the Atria Deli business, are the market leaders in their respective product groups in Sweden. Atria Russia Atria Russia s brands are Pit-Product and CampoMos. With a market share of approximately 20 per cent, the Pit-Product brand is the market leader in its product groups in St Petersburg s consumer goods retail trade. CampoMos market share in Moscow s centralised consumer goods retail trade is four per cent. 5
10 Strategy New strategy : higher profitability from leading products The Board of Directors of Atria Plc approved in spring 2010 a Group strategy that strives to enhance the company s value systematically and with longterm effects. The implementation of this strategy, designed to cover the years until 2013, has already begun. The most important financial goal under the new strategy is to significantly improve the profitability of Atria s international operations. The strategy also aims to secure and strengthen Atria Finland s profitability, which is already good. Besides improving profitability, the new strategy promotes company growth. This means predominantly organic growth, and only complementary acquisitions will be considered. In the previous strategy period Atria s growth outside Finland was mostly based on acquisitions and capital investments. Under the new strategy the focus is on strengthening Atria s financial position and balance sheet structure. Efforts will focus on raising the company s equity ratio and return on equity quite significantly. At the same time net gearing should be brought down correspondingly. The financial position will be enhanced, first and foremost, by improving profitability and cash flow. The company will also release assets from the balance sheet through a reduction of working capital. Atria s production and operative structures are seen to support the profitability improvement goals primarily from a cost-efficiency perspective. Growth and competitive advantage from product leadership To improve its profitability and secure its growth, Atria aims for an increasingly Atria s new strategy in a nutshell Vision The first choice for consumers and customers in fresh food in the Baltic Sea region and European Part of Russia. Strategy Dramatically improve international profitability 2. Strengthen market position and grow organically Strategic tools 1. Achieve sustainable 2. Focus on Atria brands 3. Create category and brand competitive advantage and profitability (incl. strategy and implement through product leadership structure) in Finland the production network optimisation in Sweden 4. Drive rapid profitability 5. Revenue enhancement 6. Reduce working capital enhancement in Russia and implementation of comprehensive turn-around program in Baltics Mission Good food better mood. 6
11 Strategy strong market position in all its business areas. The strengthening of the market position relies on the scale of Atria s operations, operational efficiency and comprehensive product portfolio. These attributes allow the company to develop its product groups across all price categories. Product leadership will be the guiding principle in the ongoing development of product groups and operations. This is the profitable growth strategy which Atria will use to gain long-term competitive advantage and stand out from its competitors. Atria s product leadership model is a genuinely consumer-driven business model in which the development of operations and product groups is primarily guided by consumer needs, not the needs of retail operators or Atria s other customers. Consumer needs and wishes guide the management and development of product groups as well as their pricing. When supply is genuinely customerdriven, it also improves retail business opportunities in a whole new way. To be able to make its operations and supply customer-driven, Atria is significantly upgrading its consumer research efforts in all business areas. In line with the product leadership model, Atria is concentrating its R&D and marketing efforts on strengthening its own brands. Strong brands put Atria in an excellent position to develop products with a higher degree of processing and more profitable price levels. The goal is to develop entirely new, innovative product groups, concepts and business models. Atria s product leadership model will initially be applied in two product groups. One of these is cold cuts, which offers opportunities for developing product ranges even across geographical boundaries. The other is the Sibylla fast food range, a product group whose market position Atria aims to considerably strengthen. Sibylla is Atria s most international brand and has excellent expansion potential. Atria s product leadership in a nutshell Product leadership is an essential element of Atria s profitable growth strategy. Atria uses it to gain long-term competitive advantage and stand out from its competitors. In accordance with the product leadership model, Atria will: develop proprietary products that genuinely bring added value to consumers; operations are primarily consumer-driven, secondarily retail-driven focus on its own brands avoid following or copying of competitors products shift the focus of supply from volume to profitability, especially in Finland heavily invest in deepening consumer understanding and in market research heavily invest in product development and marketing maintain product innovations as a key preference, aiming for pioneering innovations in all business areas create a balanced product portfolio which also comprises longer-term development projects draw upon the competences and resources of the entire Group to achieve product leadership analyse and carefully select the product groups in which product leadership is targeted; product leadership does not apply to all product groups apply sustained efforts; the successful development of product range management, R&D and marketing processes takes 2 3 years. 7

12 Strategy Striving for leadership in fresh foods Atria s goal is to be the number one choice for consumers and customers in fresh foods in the Baltic Sea region and European parts of Russia. To put the vision into practice Atria will apply its profitable growth strategy, with which the new strategy has been aligned. The strategy dictates that Atria looks for growth in the traditional meat and meat processing market and also more extensively in the entire food sector, particularly in the fresh food segments. Atria s primary aim is to grow organically, but complementary acquisitions are also possible. Dynamics in the operating environment Atria s profitable growth strategy has been adapted to continuing intense changes in the business environment. The international environment is governed by the following dynamics in particular: Global increase in the demand for food Internationalisation of the food processing industry and industrial processes Internationalisation of the consumer goods retail trade and the food sector Raw material trade across borders Increased focus on ethical and environmental issues More fragmented consumer behaviour Operating models based on networking and partnerships Basic assumptions determining Atria s growth In Atria s Finnish and Scandinavian markets the quantitative growth in meat consumption is negligible, the consumer goods retail trade is concentrated and the share and growth of private label products is considerable. In Russia, particularly in large cities like Moscow and St Petersburg, overall demand for meat products is expected to grow considerably over the medium and long term. In the Baltic Sea area long-term growth expectations are also promising, although the total volume of the market is modest compared with Atria s other markets. The concentration of retail trade is only just beginning in Russia and the Baltic states. The food industry is the largest industry in the EU and meat processing is its largest sub-sector. The food industry and its most important customer segment, the consumer goods retail trade, are in the process of becoming more international Product leadership as Atria s long-term competitive asset Product leadership is Atria s new competitive strategy applied to gain long-term competitive advantage and stand out from competitors. To achieve optimal success, product leadership requires consumer-driven operations and clear segmentation of product lines. A second prerequisite for sustained success is a comprehensive and balanced offering, which Atria is well positioned to achieve as one of the leading operators in the sector. Consumer needs are diverging Need for clear offering segmentation High-end Mid-range Low-end 8
13 Strategy and concentrated. Despite the increasingly international nature of the industry, culinary preferences are still largely determined by national culture. The average margins of meat industry products are lower than in many other industries, and, in the long run, price levels of products will be harmonised both on the EU level and globally. The food industry is historically less sensitive to business cycles than most other industries. MISSION VISION 2013 Good food better mood. Atria is the first choice for consumers and customers in fresh food in the Baltic Sea region and in European parts of Russia. We are the market leader or number two in all of our business areas. This way we are the best creator of sustainable shareholder value. Our brands are among the two best-known brands in the existing food category, developing markets of meat products and in emerging markets in the meat categories. We are our customers most preferred partner in the existing food category, developing markets of meat products and in emerging markets in the meat categories. We are the most efficient and streamlined company in the industry. We are the best employer; our tools are good management and systematic development of skills based on our strategy. VALUES Profitability and forerunner in our business Consumer and customer focus Individual and co-operative initiative Networking teamworking Cost-efficiency Role of segment Category Key success factors Create value Platform for innovation Spearhead for international expansion Most of cold cuts Higher-end sausages Higher-end of convenience Continuous innovation Very clear and compelling brand promise Strong value brand in Finland Providing scale & visibility towards customer Large volume products with strong brand promise Continuous innovation Large scale Needed for SC optimization: Maximize utilization Largest volume products with little innovation potential Lower quality PL Efficient supply chain High-volumes "Right-sized" supply 9
14 Strategy Strengths supporting Atria s new strategy Strong market position In Finland, Atria is the market leader in many of the product groups it represents and it is the largest player in the meat processing market. In Sweden, the company is the second largest player in the market, and it has a sound bridgehead position in Denmark. In Russia, Atria is the market leader in its segment in the consumer goods retail trade in the St Petersburg area and its position in Moscow has strengthened. In Estonia Atria is the second largest player in the market. Strong brands Atria has strong and well-known brands, the significance of which is further highlighted in the product leadership model of the new strategy. Due to its strong brands Atria is well positioned to continue launching new products and product groups and to aim for growth, particularly in product groups with a higher degree of processing and better profitability. Good knowledge of consumers Knowing consumers purchasing and culinary habits is essential for success in the food industry. Good customer knowledge is already a significant strength of Atria s, and the new strategy means even more investments to promote it. Atria strengthens its customer partnerships by developing new, innovative and profitable co-operation models with each consumer goods retail chain. Cost-efficient operations In order to meet the challenges presented by the changing nature of the consumer goods retail trade and business environment, Atria has implemented extensive programmes to increase the efficiency of its production and operations. Experience with increasing production efficiency and good control over change processes and the supply chain are Atria s core strengths in all business areas. Financial targets 2010 target Achieved EBIT 5% 0.8% Equity ratio 40% 40.2% Share of international operations 50% 42.1% Return on equity 12% -1.0% Distribution of dividends (of the profit for the period) 50% % Strategic measures in 2010 In 2010 Atria did not acquire new companies but aimed for organic growth and stabilising the operations of previous acquisitions and achieving improved profitability in accordance with the company strategy. In Russia, Atria confirmed its partnership agreements with the Danish company Dan Invest A/S concerning pork production. The agreement gave Atria a 26 per cent holding in the Russian company OOO Dan Invest, owner of two pork farms. The estimated annual production volume is 188,000 pigs by The total value of the project is about EUR 40 million. Atria is investing EUR 3 million in the project now and a further EUR 2 million when an agreed production volume has been achieved. Atria also signed a supply agreement with the production company. 10


15 Efficiency improvement programmes Strategy Atria Finland Atria Scandinavia Atria Russia Atria Baltic Events Impact 2009: efficiency improvement programme covering all operations annual savings EUR 5 million personnel reduction 125 man-years : decision to concentrate bovine slaughtering in Kauhajoki 2009: sale of the salad and sandwich business and EUR 5 million investment in increasing the efficiency of the Atria Deli business 2010: discontinuation of consumer packed meat production and investments in production automation annual savings EUR 6 million personnel reduction 120 man-years total personnel reductions 201 man-years total personnel reductions 79 man-years 2009: efficiency improvement programme covering all operations annual savings EUR 4 million total personnel reductions 150 man-years 2010: transfer of most of the meat product production of the Moscow and Sinyavino plants to the new, centralised Gorelovo plant in St Petersburg 2009: concentration of slaughtering, cutting and meat product production at the Valga plant 2010: shutdown of the Ahja plant and concentration of production at the Valga and Vastse-Kuuste plants annual savings EUR 6 million (starting from Q2/2012) total personnel reductions 300 man-years annual savings EUR 1.4 million total personnel reductions 100 man-years annual savings EUR 1 million personnel reduction 40 man-years Atria s strategic measures and growth from 2006 to Atria merges the Atria acquires the Atria acquires the Atria sells the Lätta Atria made no new operations of its Swedish company AB Russian company OOO Måltider business in acquisitions or sales. Lithuanian subsidiary Sardus Campomos, which Sweden Instead, it focused on UAB Vilniaus Mesa and Atria acquires Liha- mainly operates in the Atria invests in pork developing operations the Estonian company Pouttu Oy in Finland Moscow market production in Russia by and improving Valga Lihatööstus. Atria sells the Swedish Atria acquires the acquiring a 26 per cent profitability. company Svensk Swedish company holding in the Russian Snabbmat för AB Ridderheims company OOO Dan Storkök AB Delikatesser Invest. Atria discontinues its Atria acquires the meat production operations processing companies in Lithuania. AS Wõro Kommerts and AS Vastse-Kuuste Lihatööstus in Estonia. 1,400 MEUR Net sales 1,300 1,200 1,100 1, Net sales: 1,103 MEUR Net sales: 1,272 MEUR Net sales: 1,357 MEUR Net sales: 1,316 MEUR Net sales: 1,301 MEUR Atria Finland...60% Atria Finland...58% Atria Finland...58% Atria Finland...58% Atria Finland...58% Atria Scandinavia...30% Atria Scandinavia...35% Atria Scandinavia...33% Atria Scandinavia...33% Atria Scandinavia...29% Atria Russia and Baltic...10% Atria Russia...5% Atria Baltic...2% Atria Russia...7% Atria Baltic...2% Atria Russia...7% Atria Baltic...2% Atria Russia...10% Atria Baltic...3% 11
16 Atria Finland Growth subsided slightly, profitability weakened The direct and indirect consequences of the production break caused by the industrial dispute in spring 2010 significantly weakened Atria Finland s growth and performance prospects. The company s net sales fell by nearly 2 per cent and operating profit fell by 28 per cent. Profitability was also weakened by the rise in feed prices, which increased the costs of meat production. Additionally, an increase in imports put pressure on consumer prices. The food industry strike and related lock-out in April and May directly and indirectly weakened Atria Finland s volume and earnings development. The labour dispute that affected the majority of Finland s food industry operators stopped Atria Finland s production operations for 10 days in Kauhajoki, Kuopio and Nurmo, with the exception of the chicken slaughterhouse. Atria Finland s net sales fell by EUR 14.1 million or 1.8 per cent to EUR million. In the first half of 2010, net sales decreased by EUR 25.6 million, which was 6.7 per cent less compared to the corresponding period the year before. Sales volumes recovered in the last quarter, when net sales grew by approximately three per cent yearon-year. Falling volumes and the other indirect consequences of the production break significantly weakened Atria Finland s profitability. The company s EBIT decreased by EUR 12.2 million to EUR 30.7 million. This was 28.4 per cent down on the previous year. Profitability weakened, especially in early summer when Atria s sales structure was unfavourable due to problems in production. The decreased average price of the product range also reduced profitability. Despite the volume and net sales reduction caused by the production break, Atria Finland s cost efficiency remained high and the company slimmed down its cost structure according to plan. Major companies Net sales EBIT Atria Finland Ltd This company develops, manufactures and markets Finnish fresh food products and related services. In terms of net sales, it is the largest meat processing company in Finland. It has production plants in Nurmo, Forssa, Kuopio, Kauhajoki and Karkkila. A-Farmers Ltd Subsidiary focusing on meat purchasing. A-Rehu Oy Subsidiary focusing on the feed business. Production plants located in Koskenkorva and Varkaus. EUR mill Meat volumes processed by Atria Mill. kg Poultry Beef Pork EUR mill Delivery reliability % 100,0 99,5 99,0 98,5 98,0 97,5 97,0 96,5 96, * *) The 99,8% delivery reliability figure does not include the impacts of the production break in spring


.")
17 Reviews Towards product leadership The first product group used by Atria Finland to pursue product leadership as per the new strategy is the cold cuts product group. Atria is the market leader in the product group in Finland with a share of over 25 per cent, and the Atria brand has been the quality leader in the product group since the beginning of the 2000s. The size of the cold cut market increased steadily throughout the 2000s until 2010, when growth subsided slightly, along with demand generally. In terms of value, the market size is about EUR 400 million 1). Atria Finland s major investment in the higher price category of the cold cuts product group is the new Kulinaari product family. During its launch phase, the family included four completely new 1) Sources: Nielsen Market Trends, FFDIF statistics 13


 In addition to cheap imported meat, the rise in feed prices increased cost and price pressure on Atria Finland and its meat producers.")
18 Atria Finland Cheap imported meat and feed price hikes put pressure on prices The production break overloaded Atria Finland s pig and bovine slaughtering, which caused a significant increase in stock levels. The clearing of frozen stocks was slowed down primarily by a significant increase in the amount of cheap imported meat. Even though the growth in import to Finland slowed towards the end of the year, the increase on the previous year was significant. Pork imports increased by 21% to 28.4 million kilos and beef imports by 14% to more than 17 million kilos. The share of imported pork as a proportion of total pork consumption increased by two percentage points, to 15 per cent. The share of imported beef as a proportion of total beef consumption also increased by two percentage points, to a total of 18 per cent. 1) In addition to cheap imported meat, the rise in feed prices increased cost and price pressure on Atria Finland and its meat producers. This was due to the significant increase in the price of cereal and protein raw materials internationally. For example, the price of feed barley almost doubled in (See page 17.) Consumer prices fell Even though the total demand in the retail and Food Service sectors recovered towards the end of the year and the overall demand for food was up from a year earlier, the total value of the food market fell. The average price of food in the retail trade was 4 per cent lower than in the previous year. The average price of beef was down 7 per cent and the price of beef fillet dropped by 10 per cent. The average price of pork and pork products was 4 per cent down from the previous year. 1) Prices varied greatly throughout the year. In summer and early autumn, for example, imports of German pork, which had increased by a third, put pressure on the average market price of pork and on the average consumer price of Finnish pork products. The consumer prices of product groups represented by Atria Finland also declined, although not as drastically as the average prices of meat products. In Atria s own estimate the market for cold cuts and poultry products declined in value by some 2.5 per cent while sausage sales remained unchanged. The convenience foods market saw a mild growth of less than 2 per cent in terms of value. Market share remained strong The lower-than-anticipated overall demand for fresh food products, the availability issues caused by the production break and the pressure on the price level from cheap imported meat weakened the profit-making capacity of the entire sector and gave rise to occasional bouts of fierce price competition. Source: Suomen Gallup Elintarviketieto, products and two that had already been on the market before. The best hams and roasts are used as raw materials for the products. The products have a meat content of at least 95 per cent, and they are manufactured using traditional recipes and methods. The products do not contain monosodium glutamate or substances listed as allergens by the EU. All Kulinaari products come in next-generation recyclable paperboard containers. On top of each container there is a sliding lid that can be easily opened and closed. Thanks to this, the product remains well preserved in the fridge after being opened. 14

19 Reviews To secure its profitability Atria Finland restrained from getting involved in the fiercest price battles, which affected its market share in some product sub-segments. The company s overall market share in the retail trade remained strong, at approximately 25 per cent by its own estimate. The poultry group progressed especially well with a sales growth of almost 15 per cent. Successful product launches and well-timed product and marketing investments increased Atria s market share, as the new EU fresh poultry marketing standard came into force on 1 May Procurement shares unchanged, meat production profitability holds major challenges Overall, meat consumption in Finland increased by some 3 per cent, with beef and poultry leading the way. Pork consumption also saw a slight increase. Total production volume, on the other hand, remained at the previous year s level, but pork production fell 1.3 per cent. The increase in consumption only applied to imported pork. Atria s pork processing volume fell relatively more than national production, at about 2 per cent. The most important single reason for this fall was the poor profitability of pork farms, which further deteriorated as feed and cereal prices rose steeply near the end of the year. Unprofitability has led to pork farm closures. The processing volumes of beef remained at the previous year s level although freight slaughtering fell slightly. Chicken processing volumes grew markedly, by almost 15 per cent. Despite the challenging procurement situation, Atria maintained its procurement shares. Atria is Finland s leading pork and beef processor with a 43 per cent share of the market. Export volumes and value remained at 2009 levels despite the import restrictions in Russia. Atria was able to find replacing markets, which meant a bigger role for Group subsidiaries. The profitability of exports was good, as anticipated. Better competitiveness for the entire beef chain At the end of the year, Atria Finland published a programme of substantial improvements to be made to the effectiveness and competitiveness of its beef production and the entire beef chain. The price competitiveness of domestic production and processing of beef has been affected by increased imports. In line with the efficiency improvement programme approved in early 2011, Atria s bovine slaughtering and cutting operations will be centralised at a large new facility to be built in Kauhajoki, which is large even on European standards. This EUR 26 million investment is due to be completed by the end of Atria will subsequently close down the operations of its Kuopio unit. The efficiency improvement programme is expected to generate annual cost savings of EUR 6 million. Year 2011 The faster-than-anticipated recovery of the Finnish economy is positively reflected in demand for consumer goods, which also means that the overall demand for fresh food products is expected to grow by more than in The flip side is the unusually severe pressure to raise the consumer prices of fresh food products, since the costs of primary production are likely to continue rising for at least the first half of the year. Retail price levels are naturally of crucial importance for Atria Finland s profitability, but we will also continue systematically improving the cost-efficiency of operations. Our organic growth will be supported by new products aligned with our new strategy, which will be accompanied by substantial marketing inputs. Mika Ala-Fossi Executive Vice President, Atria Finland business area 15

20 Atria Finland Atria Finland s business environment Overview Quantitative growth of the market: 1) approx. 3% Growth in terms of value: 2) approx. -4% Size of the market: 3) approx. EUR 2 billion Proportion of total consumer expenditure spent on food: 12% Finland is a net exporter of meat; the main export is pork 84.8% of the pork consumed is Finnish 82.5% of the beef consumed is Finnish 85.0% of the poultry consumed is Finnish Operational environment The consumer goods retail trade is highly concentrated; the sector is dominated by the S Group and the K Group. S Group s market share is 43.2%, K Group s market share is 34.2% and Suomen Lähikauppa s market share is 10.2%. 4) The market share of private label goods in the entire retail trade grew slightly in Their share in the product groups represented by Atria ranged from 5 to 15 per cent. Competitive environment There are some 300 meat processing plants and slaughterhouses in Finland, of which the 20 largest produce over 90% of the gross value of production. By far the largest market players are Atria Finland Ltd and HK Ruokatalo Oy. Atria Finland is the largest slaughterhouse industry operator in Finland with a market share of over 45% in pork and beef processing. Other significant, mid-sized players are the privately owned Saarioinen Oy, Oy Snellman Ab and Pouttu Oy. 1) Overall demand for meat products 2) Average consumer price of meat and meat products 3) Total market for food products represented by Atria 4) Figures for 2009, Source: Finnish Grocery Trade Association (FGTA) Finland s meat processing markets Overall production and consumption Meat consumption increased by 3% to 389 million kilos Meat production remained at the previous year s level of 382 million kilos Meat imports increased by 16%, pork imports increased the most Imports as a proportion of overall consumption grew to 17 per cent (15% in 2009) Exports decreased by 2%, pork exports decreased the most Forecast for 2011 Meat consumption will remain unchanged, and overall production will grow by approximately 0.5%. Pork production will decrease slightly Production of other types of meat will grow slightly kg Overall production and consumption of meat Million kg e Production Consumption Meat consumption in Finland per capita Poultry Beef Pork Proportion of meat imports in total consumption % Imports, Beef Pork Chicken* Turkey* total Structure of meat products consumption *The figures for 2009 are not comparable Cooking sausages (frankfurters, grill sausages etc.), 56% Cold cut sausages, 15% Cold cuts (including special cuts), 24% Cured sausages, 5% 16


 Feed barley producer price Beef producer price Oilseed rape and turnip producer price Beef Beef consumption increased by 5% to 99 million kilos Beef production increased by 1% to 82 million")
21 Price index: mixed feed for pigs as well as feed barley and fattening pig producer price in Finland (Index: 2005=100) Pork Pork consumption increased by 2% to 187 million kilos Pork production decreased by 1.3% to 203 million kilos Forecast for 2011 Pork consumption will increase by 1% Pork production will decrease by 1% Reviews Mixed feed for pigs Fattening pig producer price Feed barley producer price Price index: mixed feed for cattle and feed barley, oilseed rape/turnip rape and beef producer prices in Finland (Index: 2005 = 100) Mixed feed for cattle (excl. calves) Feed barley producer price Beef producer price Oilseed rape and turnip producer price Beef Beef consumption increased by 5% to 99 million kilos Beef production increased by 1% to 82 million kilos Forecast for 2011 Beef consumption will remain unchanged Beef production will increase by 1% Price index: mixed feed for poultry as well as feed barley and chicken producer price in Finland (Index: 2005=100) Mixed feed for poultry Chicken producer price Feed barley producer price Poultry Poultry consumption increased by 5% to 98 million kilos Chicken production increased by 2% to 88 million kilos Turkey production remained unchanged, standing at 8.7 million kilos Forecast for 2011 Poultry consumption will increase by nearly 4% Finland s meat processing markets, source: Suomen Gallup Elintarviketieto Oy,
22 Atria Scandinavia Atria Scandinavia s profitability improved significantly. The company s EBIT grew by nearly 40 per cent on the previous year. The positive development is mainly due to the massive reorganisation of production, which enabled the company to slim down its cost structure and improve the cost efficiency of operations. The strengthening of the Swedish krona also improved the company s profit-making capacity. Net sales, on the other hand, decreased by just over 3 per cent. This primarily stemmed from discontinued operations. The company s organic growth was hampered by reduced sales in some product groups in the Swedish fresh foods market, where recovery has been slower than expected. Profitability and cost efficiency improved significantly Atria Scandinavia s net sales fell for the second year in a row following the closure of unprofitable operations. In 2010, net sales fell by 3.4 per cent year-on-year to EUR million. Net sales in krona fell by 12.3 per cent. The decrease was mainly due to the discontinuation of the production of consumer-packed meat in summer 2010 as well as the divestment of the Lätta Måltider salad and sandwich business in summer The annual volumes of these two businesses were significant. Net sales of consumer-packed meat amounted to about EUR 45 million and net sales of Lätta Måltider stood at approximately EUR 25 million. Atria Scandinavia s profitability developed very positively. The company s EBIT grew by 39 per cent to EUR 13.9 million. Despite the decrease in net sales, operative EBIT remained at the previous year s level in the first half of the year. In the second half performance improved significantly. In the fourth quarter, the company reached 5.7 per cent EBIT with the same net sales as during the corresponding period of the previous year. The trend was supported by the strengthening of the Swedish krona by over 10 per cent against the euro. Thanks to this, the prices of imported raw materials sank, which in turn improved sales margins. However, the improved performance was primarily due to the reorganisation that the company used to slim down its cost structure and improve its cost efficiency. Atria Scandinavia s business environment in Sweden remained very challenging despite a slight recuperation in the economy. The consumer goods Major companies Atria Retail AB Supplier of meat products and convenience food for the grocery industry. Atria Foodservice AB Supplier of meat products and convenience food for foodservice-sector. Atria Deli - Ridderheims & Falbygdens AB Supplier of fresh delicatessen products to the grocery industry and foodservice-sector. Net sales EUR mill EBIT EUR mill Atria Concept AB Developer and supplier for the Sibylla fast food concept. 3-Stjernet A/S Supplier of cold cuts for the grocery industry, primarily in Denmark. Atria Scandinavia s core product groups 2010 Market share Market position Sausages, Sweden 13% 2 Traditional home meals, Sweden 23% 1 Cold cuts, Sweden 17% 2 Cold cuts, Denmark 14% 2 Convenience food, Sweden 17% 2 Fast food/sibylla, Sweden 14% 2 18


23 Reviews Towards product leadership Sibylla is Atria s most international brand. Atria utilises it to implement its product leadership strategy at a concept level across geographical boundaries. There are good growth opportunities for the Sibylla concept in all of Atria s business areas. However, the most significant growth opportunities are in Russia s major cities as well as in Eastern European EU countries, such as Poland, Hungary, Slovakia and the Czech Republic. The Fast Food segment grew steadily in the late 2000s, when the demand for many other fresh food segments decreased due to financial uncertainty. For example, in Finland and Sweden, the estimated annual growth of the fast food market was approximately five per cent. In Russia and the Baltic countries, the annual growth 19
 The weak demand for meat products resulted in tightened market share competition in the consumer goods retail trade, where hard discount stores increased their share.")
24 Atria Scandinavia market grew by just 2.5 per cent instead of the predicted 4 per cent. The increase in meat product sales in terms of value was even lower than this at 1.1 per cent. 1) The weak demand for meat products resulted in tightened market share competition in the consumer goods retail trade, where hard discount stores increased their share. Market position remained strong Despite the weak overall demand for fresh food products and increased domestic and international competition, Atria Scandinavia s total market position in Sweden remained almost unchanged and in Denmark it strengthened. Atria Scandinavia s decision to give up its consumer-packed meat production notably reduced Atria Retail s sales to the retail branch, but at the same time it clarified the sales structure and improved the function s profitability. Private label products sold steadily and Atria Scandinavia maintained its position as the leading supplier of traditional home meals ( Husmanskost ). Atria Foodservice s sales to the restaurant and catering branch started to pick up in the second half of the year. At the same time, it was able to strengthen its position with new supply contracts, the effects of which will be evident in the sales for The sales of Ridderheims and Falbygdens products in Sweden declined slightly due to low overall demand. However, Atria Deli s position as the market leader in fresh delicatessen products remained strong. In exports, demand for Atria Deli products was particularly good in Finland, where sales grew by more than 50 per cent. In Denmark, the position of the 3-Stjernet brand as the second largest player in the cold cuts market strengthened due to increased sales. International growth of the Sibylla fast food concept continued to be particularly strong in Eastern European countries. In Poland, for example, Atria Concept delivered approximately 240 new Sibylla outlets to service stations, which raised the number of Sibylla outlets in the country to a total of 560. In Russia, 200 new Sibylla outlets were opened, resulting in a total number of 390 outlets in Russia. Significant reorganisations Atria Scandinavia carried out several restructuring and efficiency improvement measures which resulted in improved cost efficiency and competitiveness. At the very beginning of the year, Atria Scandinavia announced the discontinuation of the production of consumer-packed meat, and it shut down the Årsta production plant in Stockholm during the summer. Also the Tyresö plant located in the Stockholm region was shut down and production was transferred to the Skene plant. The production of delicatessen products was also transferred there from Gothenburg. The Gothenburg plant was turned into a delivery centre for delicatessen products. As part of the rationalisation of operations, co-operation in meat cutting was launched between the Malmö production plant and KLS Ugglarps, a subsidiary of Danish Crown. Atria Scandinavia s operations were also streamlined and integrated through significant logistics and IT investments. The target was to get all Swedish operations under a single ERP system in ) Grocery Manufacturers of Sweden, 2011 was as much as 15 per cent, depending on the area. The international growth of the Sibylla fast food concept is based on both developing the offering of the existing sales outlets and establishing new ones. The majority of them are sales outlets based on a franchise agreement and operating at service stations or in other shopping spaces. 20

25 Reviews Atria Scandinavia s business environment Overview Sweden Quantitative growth of the market: 1) 2.5% Growth in terms of value: 2) approx. 1% Size of the market: 3) approx. EUR 2.8 billion Proportion of total consumer expenditure spent on food: 11% Sweden is a net importer of meat; nearly 50% of beef, over 25% of pork, and over 40% of poultry is imported. Denmark is a major net exporter of meat globally; the main export is pork. Operational environment The consumer goods retail trade is highly concentrated in Sweden; by far the most significant player is ICA, the leading retail company in the Nordic countries, with a market share of approx. 45%. Coop and Axfood both have market shares of approx. 20% in Sweden. In Denmark, the consumer goods retail trade is dominated by Danske Supermarked and Coop with a share of nearly 70%; SuperGros has a market share of approx. 20%. Sales of private label goods in Sweden and Denmark accounted for 19% and 21% of total sales, respectively. The growth in private labels subsided. Competitive environment More than half of the Swedish meat processing market is dominated by small companies with annual net sales of less than EUR 50 million. The largest player in the market is Scan AB, which is owned by HKScan. Atria Scandinavia is the second largest player. The acquisitions made by Atria and HKScan were the biggest M&A arrangements in the industry in Sweden. In Denmark, the clear leader in the meat processing market is Danish Crown, Europe s largest meat industry company and one of the largest meat export companies in the world. 1) Consumer goods retail trade market 2) Total growth of the product groups represented by Atria in the consumer goods retail trade 3) Total market for food products represented by Atria Year 2011 Atria Scandinavia s key target in 2011 is to further improve profitability. The massive reorganisations create a good basis for this in terms of operations and cost structure. Although the Swedish fresh food segment is not expected to grow much as a whole, we see significant growth potential in sub-segments with a higher degree of processing, especially in premium products. The market position of private label products in Sweden appears to be declining, which also creates a potential demand for our strong brands. Our international growth will be boosted by Atria Deli s strong Ridderheims and Falbygdens brands and the Sibylla fast food concept, which will be given more attention in line with our product leadership strategy. Juha Gröhn Executive Vice President, Atria Scandinavia business area until 18 March
26 Atria Russia Market position strengthened, profitability declined Increased marketing and sales efforts improved the net sales of Atria Russia and strengthened its position in the consumer goods retail trade in both Moscow and St Petersburg. At the same time the profitability of operations declined significantly. A decrease in overall demand, increased price competition and higher raw material costs caused the operations to make a loss. Non-recurring goodwill impairments brought the result down by more than EUR 10 million. Atria Russia s net sales increased by 14.3 per cent to EUR million. Growth was boosted by increased sales, strengthening of the Russian rouble and price increases implemented at the end of the year. Calculated in roubles, the growth was 3.9 per cent. Atria Russia s profitability was weak and the result was very much in the red. The economic recession continued from the previous year and weakened the earnings potential decisively. Because of the recession, overall demand for meat products declined by approximately 10 per cent 1) and demand shifted towards lower cost product groups and products. The contracting market also toughened price competition. The price level rose towards the end of the year, but not sufficiently to compensate for the rise in raw material prices and the general inflation rate of 9 per cent 2). A steep rise in the price of meat raw material on global markets started during the second half of the year. This eroded Atria Russia s profitability as well as its competitiveness. The price rose from the starting level at the beginning of the year by approximately 26 per cent. Almost 90 per cent of the meat raw material used by Atria Russia is imported meat. Atria was able to pass on only part of the increased raw material costs to sales prices. Atria Russia s result was also significantly strained by increased marketing costs and fixed costs and the non-recurring goodwill impairment. Atria invested heavily in marketing, especially in Moscow, which increased marketing costs by approximately EUR 3 million. The start-up of the new production plant in Gorelovo increased fixed costs and depreciation by approximately EUR 3 million. As a result of goodwill impairment testing in Atria Russia, the company decided to record impairments totalling EUR 10.8 million allocated to goodwill. These non-recurring entries did not affect the cash flow. Atria Russia Facilities: Moscow and St Petersburg Key brands: CampoMos (in Moscow and St Petersburg) and Pit-Product (specifically in St Petersburg) Main product groups: meat products, particularly sausages and cold cuts, fresh meat and convenience foods, especially CampoMos pizzas Production plants: Moscow factory, St Petersburg s Gorelovo and Sinyavino factories Logistics centres: in Moscow and St Petersburg; the company has its own truck fleet Primary production in 2010: Campofarm pork farm 170 km southeast of Moscow; slaughtering contracted out, meat cutting at the Moscow factory Net sales EUR mill EBIT EUR mill Stronger position, particularly in Moscow Atria Russia continued investments launched in 2009 to enhance the recognition rate and market position of the CampoMos brand, particularly in the Moscow region. Thanks to these investments the market share of the brand rose to 4 per cent in Moscow s retail-chain based consumer goods trade 3). The sales of CampoMos cold cuts sold in re-closable packages increased 1) Source of market information: Business Analytica 2010, unless otherwise indicated. 2) Source: Bank of Finland, BOFIT, ) Atria s own estimate 22


27 Reviews Towards product leadership In , Atria Russia made record investments in renewing and marketing its CampoMos brand, particularly in the Moscow region, which is the largest market area of the food industry in Russia by far. Furthermore, citizens purchasing power there is nearly twice as high as in the rest of Russia. The value of the meat and meat product markets is about EUR 2.7 billion. The corresponding figure for the St Petersburg region is about EUR 0.9 billion. Moscow s enormous market also has a significantly high number of players in the meat processing industry. In some product groups, Atria has local competitors. Atria has practically no international competitors in the Moscow market. In line with its product leadership strategy, Atria Russia looks for growth through differentiation. It strives to differentiate itself from its competitors through the quality of its products and its innovation. Re-closable cold cut packages are an example of a very successful innovation. Atria was the first company to launch them in Russia. 23

28 Atria Russia significantly. Thanks to promotion campaigns, the recognition of the brand increased in the Moscow region to as high as 95 per cent 4). Atria s market position in the St Petersburg region remained strong. In terms of value, the market share in St Petersburg s entire consumer goods retail trade rose to over 20 per cent, making Atria the clear market leader in its segment. The biggest increase was seen in the frankfurter sub-segment, where sales in terms of volume and value increased by nearly 10 per cent in an otherwise declining market. To increase sales and strengthen its pioneering position as a producer of fresh convenience foods, Atria launched entirely new products in the Russian market. These are cooked minced beef products such as meat balls, hamburger patties and kebabs. The products are sold in similar modified atmosphere boxes as in the Finnish market. Atria Russia s competitive environment became significantly tighter both in the St Petersburg and Moscow regions. Because of falling overall demand, overcapacity in the segment only grew worse. This resulted in tough price competition which caused severe profitability and liquidity problems for some companies operating in the sector. Primary production and Gorelovo plant investments increased competitiveness Some of Atria Russia s investments in primary production, crucial for its competitiveness, were ready to start production. In accordance with the shareholder agreement signed in 2009, Atria owns 26 per cent of the Russian company OOO Dan Invest, which invests approximately EUR 40 million in two pork farms (see page 10). The 4) Survey: Toy-Opinion, 2010 investment is progressing according to plan, and the estimated production volume of the pork farms is to grow in stages to 188,000 slaughter pigs in The Campofarm pork farm, fully owned by Atria, was already completed and in full use in The annual volume of the farm is 55,000 slaughter pigs. Slaughtering has been contracted out and the meat is cut at the Campomos plant in Moscow. The significance of the new massscale pork farms for Atria Russia s competitiveness was further heightened when the Russian government announced new food import quotas and self-sufficiency targets. With its investments in primary production, Atria Russia will reach 90 per cent selfsufficiency in pork. Atria Russia s EUR 70 million logistics centre and production facility investment was finalised when the new Gorelovo, St Petersburg meat product plant started production in early summer. The logistics centre has been operating since The production capacity of the Sinyavino plant located in St Petersburg was also increased in the important cured sausages product segment. Operations concentrated in the new St Petersburg facility To improve its cost efficiency, Atria Russia decided at the end of the year to move the production of some of its meat products from the Moscow and Sinyavino plants to the new Gorelovo plant in St Petersburg. The arrangement enables Atria to increase the productivity of its entire production structure and make maximum use of the efficient western process technology at the new Gorelovo facility. The measures to improve efficiency will reduce the number of Atria s personnel by about 300. The annual cost savings are estimated at EUR 6 million, which will be fully realised by spring After these measures, logistics operations, meat cutting and pizza production will still remain in Moscow. The Sinyavino plant will concentrate mainly on the production of cured sausages. If the food market recovers and leads to increased demand, the production of meat products at the Moscow plant can be re-commissioned to increase production capacity. Year 2011 The overall demand for the food products represented by Atria Russia is expected to pick up alongside the general economic recovery in Russia, and the value of the market is likely to grow at least on a par with the rate of inflation. The massive development and efficiency improvement measures we have taken will improve our cost efficiency and thereby our profit-making capacity. We are implementing profitable growth in line with the product leadership strategy. Juha Ruohola Executive Vice President, Atria Russia business area 24
29 Atria s business environment in Russia Reviews Overview St Petersburg Quantitative development 1) -8% Growth in terms of value 1) approx. 10% Size of the market 2) approx. EUR 0.9 billion Moscow Quantitative development 1) -10% Growth of food products in terms of value 1) approx. 3% Size of the market 2) approx. EUR 2.7 billion Food accounts for 32% of total consumption expenditure by Russian citizens. Russia is the world s most significant net importer of meat; the country s own meat production cannot satisfy the growing demand, either in terms of quantity or quality. Operational environment The share of the modern consumer goods retail trade is growing rapidly in Russia, although traditional marketplaces and market halls still dominate with a share of over 50%. The share of supermarkets and hypermarkets is growing most intensively. Consumer goods retail trade is highly fragmented, but chains are increasingly gaining ground. The combined market share of the three largest consumer retail chains is approximately 4% of total sales throughout Russia. The largest chains are Magnit, X5 and Kopeika. The total volume of the Russian food retail market is more than EUR 150 billion. Competitive environment The consolidation of the meat processing industry is still in its early days in Russia, and there are few international players. Atria is the largest foreign operator in the sector. Price competition remained tough in and landed some operators in the sector in severe financial difficulties, but did not eliminate the significant overcapacity. 1) Overall demand for meat products in consumer goods retail trade 2) Total market of food segments in which Atria operates Import quotas and national subsidies steer Russia s primary production The Russian president approved a plan in February 2010, according to which Russia will strive to reinforce the position of domestic food production and reduce dependency on foreign imports. With its new food strategy, which is part of the national security strategy in force until 2020, Russia will strive to raise its level of self-sufficiency in all major foodstuffs. The self-sufficiency target for cereal is 95%, for sugar 80%, for vegetable oil 80%, for dairy products 90% and for meat and meat products 85%. Self-sufficiency target rates in Russia for meat and meat products Pork and beef Poultry % % Measures for securing national production in Russia The import quotas of food, including meat, are strict and imports are also limited by other regulatory practices The price of imported meat exceeding the quotas is notably higher. The state strongly supports domestic primary production with incentives such as investment subsidies Import quotas for poultry were cut by 20% in 2009, and the next cut will take place in Selfsufficiency in 2008 Target 0 Selfsufficiency in 2008 Target 25
30 Atria Baltic Growth subsided, profitability improved The continued decline in demand for and prices of daily consumer goods in Estonia had an adverse effect on Atria Baltic s growth and performance prospects. Net sales did not reach the level seen in 2009 and EBIT was negative. Profitability improved, however, thanks to intensive efficiency improvement measures. The continued decline in consumer purchasing power in Estonia decreased overall demand in the product groups represented by Atria Baltic. For example, sales of cooking sausages in the consumer goods retail trade fell by almost 10 per cent and cold cuts by approximately 5 per cent 1). Due to weakened overall demand and decreased market shares in meat products Atria Baltic s net sales fell by 6.7 per cent to EUR 35.0 million. The decreased price level was the main element that hampered Atria Baltic s profitability. The price level was weighed down by reduced overall demand and the resulting stiff price competition between companies in the meat industry and retail chains. The decline in the price level was also fuelled by increased imports of inexpensive meat and meat products. For example, average prices of cooking sausages in the consumer goods retail trade fell by 6 per cent and cold cuts by 4 per cent. Atria s preconditions for profit-making were also weakened by the rise in the price of cereals and feed, which raised producer prices for beef and pork and costs at Atria s own pork farms. Despite the fallen prices Atria Baltic was able to improve its profitability. The operating loss (excluding goodwill impairment losses) decreased by 31.5 per cent to EUR 3.7 million. Cost efficiency improved In order to improve its competitiveness and profitability, Atria Baltic carried out an efficiency improvement programme, which slimmed down the company s cost structure and measurably improved operational cost efficiency. The most significant actions were the shutdown of the Ahja plant and the concentration of production to the Valga and Vastse-Kuuste plants. Additionally, the company launched a programme to considerably reduce costs and increase cost efficiency in all areas of its business process. Market share fell slightly The market shares of Atria Baltic s key product groups narrowed slightly in the declining market. Atria retained its market position as the second largest player in the important cold cuts market with a share of just under 20 per cent. In the first half of the year, Atria lost some ground in sausages, although rising sales in the second half of the year compensated for the loss. Atria is the market leader in the grill sausages subsegment with a share of over 30 per cent. Sales of consumer-packed meat grew from the previous year. 1) Source of market information: AC Nielsen 2010, unless otherwise indicated Atria Baltic Production plants in Estonia in 2010: Valga and Vastse-Kuuste Brands: Maks & Moorits, Wõro and VK Main product groups: cold cuts, sausages and consumer-packed meat Net sales EUR mill EBIT EUR mill


 approx. -2% Size of the market: 2) approx. EUR 200 million Proportion of total consumer expenditure spent on food: approx.")

31 Reviews Year 2011 Once Estonia s economy takes a turn for the better, the contraction of the meat market is also expected to end. At this point the demand for more expensive product segments is also expected to pick up, which is key to our profitability. On the other hand, the cost level rise in primary production poses a challenge to our price competitiveness. The cost efficiency improvement measures we have launched and our investments in sales and product development will create the preconditions for profitable growth in the expanding market. Towards product leadership In line with its product leadership strategy, Atria Baltic strives to boost its growth by investing in strengthening its own brands. The best-known brands are Maks & Moorits and Wõro, which are among Estonia s 10 strongest food brands, including all international brands 1). The Wõro brand has the widest product range of all the Atria Baltic's brands. The marketing of fresh meat both packaged and unpackaged focuses on the Maks & Moorits brand. The VK brand is used to market ham and other meat products for consumers who appreciate high quality. 1) Source: TNS Emor, 2010 Tomas Back Executive Vice President, Atria Baltic business area Atria Baltic s business environment in Estonia Overview Growth in terms of value: 1) approx. -2% Size of the market: 2) approx. EUR 200 million Proportion of total consumer expenditure spent on food: approx. 25% Estonia s own meat production is mostly sufficient to cover the increased demand; some pork is imported. Operational environment The Estonian consumer goods retail trade has been rapidly modernised since the country joined the EU in Nordic chains have a prominent position in the country, the largest ones being Rimi Baltic, owned by ICA, and Prisma, owned by the S Group. ETK, Selver and Maxima are the main local players. Competitive environment Estonia s largest meat industry company is Rakvere Lihakombinaat, which is owned by HKScan. Atria is the second largest player in the country. The number of meat processing companies has decreased slightly in Estonia, and small companies which often operate locally are more focused on improving their operational efficiency than on expansion. 1) Overall demand for meat products in the modern consumer goods retail trade 2) Total market for food products represented by Atria 27
32 Product development and marketing Additional investments in research operations and marketing communications Atria s new strategy states that product leadership is the guiding principle in the development of product groups and operations. Atria uses product leadership to gain long-term competitive advantage and stand out from its competitors. Atria s product leadership model is a genuinely consumer-driven business model in which the development of operations and product groups is primarily guided by consumer needs, rather than the needs of retail operators or Atria s other customers. In order to make its operations and supply more consumer-driven, Atria stepped up its research and product development investments in The Group s research and product development operations focus on researching consumer behaviour and market data. In addition, Atria participates in applied research in the areas of product and packaging technology and food science. Atria s research and product development operations form an integrated function along with marketing. At the Group level, Atria is developing a joint R&D process and joint operating models between the business areas. Each business area has, however, its own operative research and marketing unit, because the business is mainly regional and culinary preferences are rather culture-specific. In 2010, Atria launched over 400 new products. This figure, which is considerably higher than that of the previous year, also includes new Atria s research and product development operations EUR mill. % of net sales packages and new products related to product support. The significance of new products is further emphasised in the new strategy, and efforts are made to considerably increase their share in both net sales and EBIT. Emphasis on marketing communications In addition to research and development operations, Atria's product leadership model emphasises marketing. As product leadership is Atria s differentiation tool, innovation and uniqueness are significant factors in marketing communication. Marketing communication resourcing is also a critical success factor. In 2010, Atria Russia had the highest relative increase in marketing communications. The main investment target was the CampoMos brand. However, also the sales of the Pit- Product brand were boosted through major additional investments. The effects of Atria Finland s new marketing communications guidelines and the considerably higher investments will become visible in Atria complies with the updated guidelines for responsible food marketing communications, which are based on the principles of responsible marketing communications of the Confederation of the Food and Drink Industries of the EU (CIAA). These illustrate the approach at the EU level and serve as a guideline for the voluntary self-regulation of companies. Additional information on Atria s responsible marketing is at: corporateresponsibility/ socialresponsibility/ ResponsibleMarketingCommunications Share of net sales, % 28


33 Key marketing campaigns in various business areas in 2010 Reviews Finland Main campaign: Key target: Key means: Key achievements: a perfect Finnish summer day, Wilhelm strengthening the image as the leading supplier of the grilling season Scandinavia Lithells ASADO increasing sales and product awareness afternoon newspapers, periodicals, television, radio, online banners and image service on Facebook and Twitter the grilling party at Kungsträdgården Park in Stockholm, sales material, TV spots, announcements in the specialised press, competitions online and in social media, as well as our own iphone application Russia Pit-Product frankfurters 25% sales growth extensive use of mass media and various advertising channels, such as special advertising hoardings, lotteries and competitions the image targets were met, but the same cannot be said for all sales targets as the production break weakened the delivery reliability of certain product groups. the campaign aroused the interest of the media and received an honourable mention in the Chark-SM competition. sales grew by 35 per cent, exceeding the original targets by 10 per cent. Estonia Wõro frankfurters increasing sales TV, POS, radio, PR sales grew by approximately 200 per cent. 2 1 Campaigns: 1. Atria Finland, Atria Wilhelm campaign 2. Atria Baltic, Wõro campaign 3. Atria Russia, Pit-Product campaign 4. Atria Scandinavia, Lithells Asado campaign
34 Corporate responsibility Responsible business for the long term Atria s corporate responsibility policy is encapsulated in its mission, Good food better mood. For Atria, the concept of good food covers the entire food chain from primary production to the dining table. Atria s good food is produced in a responsible and ethical manner; it is of high quality and it is safe. Good food leads to a better mood and added value for all of Atria s stakeholders. Atria aims to secure its current and future operating conditions through responsible operations. In accordance with the principles of sustainable development, Atria takes into account the economic, social and environmental aspects of all its business areas. Atria s corporate responsibility policy is embodied in its day-to-day work with stakeholders. Atria uses various surveys, inquiries and analyses, as well as meetings and personal interaction, to gain extensive knowledge of its stakeholders expectations. In addition to the information provided in this Annual Report, corporate responsibility at Atria is discussed in the Corporate Responsibility Report and on the company website at corporateresponsibility yrityksena/ yritysvastuu (in Finnish) The key stakeholders have been defined on the basis of Atria s business strategy. The most important stakeholder groups are Customers Consumers Shareholders Authorities Personnel Suppliers Other stakeholders include subcontractors, local communities, educational institutes and the media. Atria s corporate responsibility policy is managed on two levels. A Grouplevel workgroup determines the main principles of corporate responsibility and ensures that the business areas development programmes support the common goals. Steering groups in the business areas analyse the expectations that the most significant and active stakeholders of the business area have concerning Atria s corporate responsibility, and initiate development programmes. The CR programme sums up the principles of responsible operations In autumn 2010 Atria launched an extensive and long-term corporate responsibility programme, Atria s Handprint, which is visible in and impacts the entire Atria food processing chain. This programme will assist Atria as it continues to build upon its long history of corporate responsibility, which began nearly 110 years ago. The Atria s Handprint programme gathers the principles, practices, projects and results of Atria s responsible operations and transparently provides extensive information on them. The programme has been integrated into the Group s management practices and a member of the management team has been put in charge of the programme. Under the Atria s Handprint programme, responsible operations will initially be developed and measured in the following seven sectors: finance environment well-being of animals product safety nutrition personnel communication By developing all of these sectors in a balanced manner, Atria aims to become a leading company in responsible food production in its areas of operation. Responsible practices will be developed and expanded with various development projects, which vary from one business area to the next. The development projects bring together established practices and also create entirely new operating methods. The symbol of Atria s Handprint programme is the Handprint logo. The logo speaks of the personal contribution handprint of each person participating in the Atria food processing chain, and communicates responsibility with its colours. Atria s Code of Conduct promotes ethical actions Atria published its set of ethical guidelines, the Atria Code of Conduct, in autumn The guidelines reflect Atria s values and practices, and guide the Group s operations towards sustainable development and continuous improvement. Atria s Code of Conduct lays out the company s expectations for the behaviour of its employees, as well as the employees ethical and legal basic responsibilities when they act as Atria s representatives. 30


 guidelines, in which corporate responsibility is viewed from the economic,")
35 The Atria Code of Conduct comprises five sectors: Safe Atria Quality Respect for the environment Interest group relations Motivated people Business integrity The Code of Conduct applies to all Atria employees, partners and clerical employees, as well as members of the management team, Board of Directors and Supervisory Board. The Code covers all business areas and also the partnerships and joint ventures in which Atria has a majority holding and/ or positions of responsibility. The Atria Code of Conduct has been distributed to every Atria employee as an insert of Atria s Group magazine, Our Atrium. The issue takes a comprehensive look at the code and the significance of responsibility in each individual s work. HANdpRINT of RESpoNSIbLE ATRIA Clockwise from top left Therese Sundman, Anna Schreil, Ulrik Jismyr ja Tiina Kinnunen Atria Code of Conduct HANdpRINT of RESpoNSIbLE ATRIA Corporate responsibility First stand-alone Corporate Responsibilty Report At the end of 2010 Atria published its first stand-alone Corporate Responsibility Report. The report describes the impact Atria has on its operating environment and on society as a whole, as well as how Atria takes corporate responsibility into account in its current and future operations. The report describes Atria s key events, results and impacts in 2009 from the point of view of corporate responsibility. As the basis for its reporting, Atria uses the international Global Reporting Initiative (GRI) guidelines, in which corporate responsibility is viewed from the economic, social and environmental perspective according to a threepillar model. The 2010 Corporate Responsibility Report will be published in the summer of
36 Financial responsibility By financial responsibility, Atria refers to meeting its financial targets in such a way that it can generate economic added value to the shareholders and other stakeholders on a long-term basis and increase well-being in the surrounding communities and society. On the basis of profitability In order to reach the financial targets, Atria s business must first and foremost be profitable. This is supported by good competitiveness and efficiency, together with business risk management. The company s financial goals and their achievement in 2010 are presented on page 10. For Atria, economic responsibility also means complying with healthy and responsible business practices. Corporate responsibility, decisionmaking and administration are subject to national legislation and regulations, as well as the Corporate Governance Code for Finnish listed companies, which Atria has followed from the beginning of Profitability and efficiency create the preconditions for bearing social and environmental responsibility. Atria believes that socially and environmentally responsible conduct also works in the other direction by strengthening economic responsibility. Distribution of Atria s economic added value Customers Consumer goods retail trade market Food Service customers Food industry Export customers Atria Net sales and other operating income EUR 1,309 mill. Partners Primary production in particular Purchasing and other expenses EUR 998 mill. Personnel Wages and salaries EUR 181 mill. Society Taxes and social security expenses EUR 52 mill. Shareholders Dividends 1) EUR 7 mill. Lenders Financial expenses EUR 11 mill. Growth investments Gross investments, Research and development EUR 57 mill. 1) Proposal of the Board of Directors 32
37 Environmental responsibility Environmental management supports the entire food production chain A prospering environment is essential to Atria and its entire food production chain. One of the key elements of Atria s environmental responsibility is taking into consideration the natural environment at each stage of operations. Atria is committed to monitoring the environmental impact of its operations, products and services and to identifying the significance of the environmental impact of each stage of the operating chain. What this means in practice is reducing the direct environmental impact of practical operations and identifying the indirect environmental impact of the entire operating chain. Atria s environmental management vision is to be an efficient expert in environmental matters such that environmental management supports the business and promotes sustainable development. A key objective of Atria s environmental management is the controlled and sparing use of natural resources. Continuous improvement means continuous monitoring of energy and water consumption, packaging material and waste volumes, and using all of these inputs more efficiently. The starting point for environmental management is ensuring that the company operates in compliance with local environmental legislation. Atria s environmental management strategy is based on networking, in line with the company s values. By networking with research and development operators and the operative level, Atria can develop the best environmental management practices to support continuous improvement. Environmental operations permeate the whole food processing chain Atria is committed to reducing the direct environmental impact of its operations, and it continuously monitors and optimises its environmental performance. Atria s environmental measures permeate the whole food processing chain: primary production, industrial production, transportation, and products and services for customers and consumers. Atria s meat raw material procurement models and structures differ from one country to another. Atria Scandinavia acquires its meat raw material from Swedish slaughterhouses and international meat raw material markets. In Estonia, Atria has its own slaughterhouse that processes animals from Atria s own pork farms and from local farmers. Some meat is also imported into Estonia from Atria s Finnish plants and from elsewhere in the EU. Russia has the most versatile raw material base in terms of origin: South and North America, EU countries, Russia s regions and Atria s own farm. In Finland, nearly all of the raw material needed by the industry is acquired from Finnish farms, and the slaughter animals produced on the farms are slaughtered, cut and processed at Atria s production plants. All of the meat used in Atria-branded products comes from Finnish producers. In primary production Atria supports sustainable development by offering expert services to develop production farms. In Finland these operations are handled by A-Farmers Ltd. Energy, water and waste management as special challenges In industrial production, essential factors include compliance with environmental management principles, management of the environmental impact of production, efficient use of energy, fuel and water, the reduction of waste and sorting. In the food industry, energy consumption is highest in various manufacturing-related heating and cooling processes, as well as in the maintenance of material flows. Atria has increased the efficiency of its energy consumption relative to production output, since the pressure to increase energy consumption has been substantial following the increase of refrigerated production space and increasingly strict refrigeration requirements. In transportation the aim is to reduce CO 2 emissions by using new trucks, more efficient logistics planning, driver training and networking. Atria Finland s CO 2 emissions fell by a third, from to CO 2 /kg from 2007 to The aim is to reduce waste volumes through better identification and utilisation of waste: clean packaging materials are recycled: clean plastic packages are recycled, energy waste is separated from mixed waste and food waste is utilised as fuel for biogas plants or as feed for fur animals. Towards unified environmental targets The structures of Atria s operations and the measurement of environmental variables vary greatly between the business areas, so unified environmental targets and objectives had still not been fully defined at the end of Atria continued drafting Group-level measurement principles, targets and common environmental guidelines for all business areas. A concrete goal is to create Group-level measurement principles and targets for environmental objectives and modernise the Corporate responsibility 33
38 Environmental responsibility Water consumption The food industry uses large Water consumption Total water consumption by source Total water consumption by source in proportion to production amounts of water, partly because of production hygiene requirements. The total water consumption increased by 2 per cent in the monitoring period due to the production start of the Pit Product plant in Russia. In other business areas water consumption fell on average by 2.5 per cent. Water consumption efficiency has improved by 2 per cent. Atria strives to minimise the environmental 3,000,000 2,500,000 2,000,000 1,500,000 1,000, ,000 0 m Atria Finland Atria Scandinavia Atria Russia Atria Baltic 3,000,000 2,500,000 2,000,000 1,500,000 1,000, ,000 0 m Surface water Ground water m 3 / product tonne impacts of water consumption in cooperation with local waterworks, among other things by increasing Energy consumption Direct energy consumption of the main sources Indirect energy consumption of the main sources the use of surface water and levelling off consumption peaks. Energy consumption In the food industry, energy consumption is highest in various manufacturing-related heating and cooling processes, as well as in the maintenance of material flows and the refrigeration chain. Total energy consumption increased by 4 per cent, and energy efficiency per GJ 2,000,000 1,500,000 1,000, , Atria Finland Atria Scandinavia Atria Russia Atria Baltic GJ 700, , , , , , , Renewable sources Unrenewable sources GJ 1,000, , , , , Renewable sources Unrenewable sources kilogram of end product increased by 4.6 per cent. Total energy consumption in proportion to production GJ / product tonne environmental guidelines that apply to all of Atria s business areas. At Group level, 2010 environmental performance indicators included energy and water consumption as well as direct and indirect consumption of the main sources. Performance was also measured in terms of CO 2 emissions, both as absolute values and in proportion to production volume. Because of the differences detected in the measurement of CO 2 emissions these figures are not shown in the statistical summary. 34
39 Atria s Quality And Environment Systems BUSINESS AREA QUALITY ENVIRONMENT PRODUCTION PLANT Atria Finland ISO/IEC 17025:2005 (Laboratory accreditation) SFS-EN ISO 9001:2000 ISO 22000:2005 Nurmo, Kuopio, Kauhajoki Nurmo, Forssa, Kuopio, Kauhajoki, Karkkila, Seinäjoki Nurmo Corporate responsibility SFS-EN ISO 14001:2004 Air quality control, Finland s environmental administration: Seinäjoki and Kuopio area quality control, bio-indicator research Nurmo, Kuopio, Forssa Kauhajoki, Karkkila, Seinäjoki Seinäjoki, Kuopio Atria Baltic ISO 22000:2005 Wõro Kommerts ISO 9001:2000 ISO/IEC 17025:2005 (Laboratory accreditation) Valga Valga Atria Russia ISO 9001:2000 Campomos GOST R and Regulation (EC) Nr. 852/2004 of the European parliament and the council of 29 April 2004 on the hygiene of foodstuffs. 1) Atria Scandinavia BRC Global Standard - Food (Issue5:January 2005) Grade A The IKEA Way on Purchasing Food (IWAY) BRC Global Standard for Food Safety (Issue5:January 2008) Grade B DS/EN ISO 9001:2000 Pit-Product, Campomos Sköllersta, Tranås, Falköping, Skene, Moheda, Borås, Horsens, Halmstad Borås, Falköping Sköllersta, Malmö Horsens ISO 14001:2004 Organic Production according to Council Regulation (EEC) 2092/9 Organic production according to KRAV Regulation Sköllersta Tranås, Moheda, Borås Falköping 1) Written GOST R-certificate is a guarentee for that the product fulfils Russian security standards. Greenhouse gas emissions The greenhouse gas emissions arising from the production of operating energy Greenhouse gas emissions Atria Finland s waste profile calculated as carbon dioxide equivalents has increased in the monitoring period. At Atria Finland the replacement of crude oil by peat has increased the volume of greenhouse gas emissions, but on the other hand this assessment does not take into account the overall environmental impacts, which in our view are positive when using peat. The use of peat is also justified from an economic and social responsibility perspective and it has been a conscious choice. GJ Atria Finland Atria Scandinavia Atria Russia Atria Baltic tonne / product tonne Compost Recycling Commercial waste Combustion Slaughterhouse waste Municipal solid waste Hazardous waste 35
40 Environmental responsibility Atria Finland s target-oriented environmental management Atria Finland s environmental impact has been analysed on five measures: management of energy consumption, water consumption, wastewater values, municipal waste and packaging material. A target and a programme have been defined for each measure. Atria Finland will develop Group-level measurement principles and indicators for environmental objectives and modernise the environmental guidelines that apply to all of Atria s business areas. Atria Finland s environmental management is handled by a steering group, which works under the Management Team. It includes representatives from purchasing, production, product and package development and energy production. The composition of the group ensures that management encompasses all of the areas in which Atria can control its environmental impact. The group analyses the results achieved in the previous year, plans the required investments and sets the targets for the following period. Atria Finland s environmental objectives, targets and programmes Environmental objective Environmental target Environmental programme Control of energy consumption Control of water consumption Control of wastewater values Control of municipal waste volumes Control of packaging materials The consumption of energy relative to the volume of production will be reduced by 9% by 2016, comparison year 2005 The consumption of water relative to the volume of production will be maintained at the 2008 level Ensuring operations are within valid environmental permit limits 5% increase in the volume of waste used for energy by 2011 Consideration of environmental values an integral part of package design Energy review and analysis at Nurmo Improving the efficiency of the controls of cold stores and systems Increase of heat recovery profitably More effective recycling of water and identification of new recycling possibilities Identification of water loss through new consumption monitoring methods and alarms Optimisation of water consumption in process washes Emptying production equipment of solid waste before washing Maintaining the cleaning capacity of pre-treatment plants Improving the efficiency of sorting through personnel training Planning the locations of the energy waste collection points Colour coding of waste bins Recognising the environmental impacts of packaging methods and materials Development of packaging units that are suitable for the transport module Atria Finland s environmental indicators in 2010 in the Corporate Responsibility Report to be published in summer
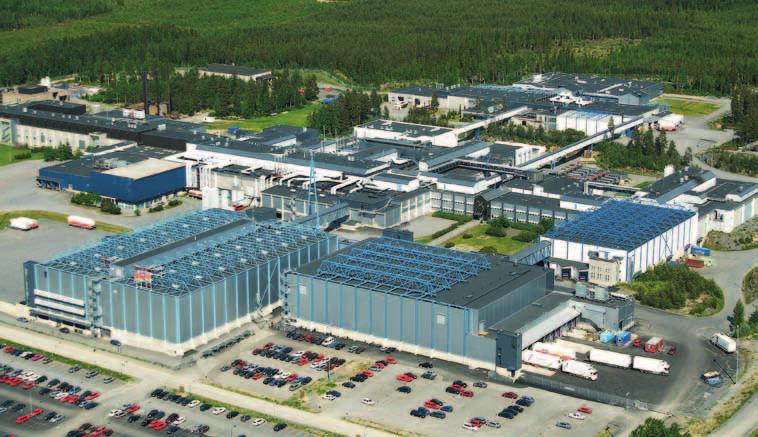

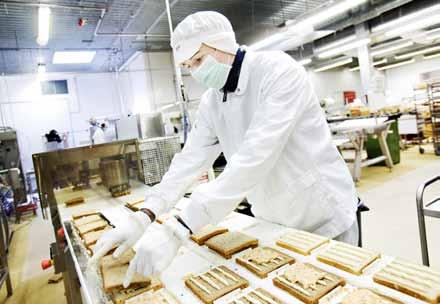
41 Corporate responsibility Atria production plant in Nurmo 37
42 Social Responsibility Personnel at the heart of social responsibility The competence and well-being of personnel form the most central dimension of Atria s social responsibility. The quality and competitiveness of all the company s operations and products rest on them. You can read more about social responsibility in the Corporate Responsibility Report to be published in summer 2011 At Atria, social responsibility also refers to obligations and voluntary responsibilities relating to product safety and product responsibility as well as consumer protection, including product labelling and marketing communications. The well-being of personnel is a key factor for Atria s sustainable growth. Atria engages in continuous co-operation with employees to promote physical and psychological well-being at work. Atria s success is critically dependent on employees investment in their personal and professional development. Atria s human resources work in 2010 focused on integrating operations and supporting more efficient practices especially in Atria Scandinavia and Atria Baltic. In Atria Russia, the inauguration of the Gorelovo facility took centre stage in human resources operations and in Atria Finland, spring 2010 was shadowed by labour market disputes in the food industry. Development of skills was a focus area in business areas as well as in international Group-level training programmes, the first among which, Atria Future Leader, came to completion. An international meat technology training programme, Atria Meat Technology Seminar, was launched at the end of 2010, with individuals attending from all business areas. The training maintains and promotes Atria s pioneering work in the field of meat technology. In Group-level HR work, systematic development of skills will continue in 2011 and a Group employee survey will be conducted in all Group units at the same time in the first quarter. The survey will gather information on the various operational areas of the organisation and on factors affecting satisfaction at work. Based on the findings of the survey, measures will be prepared in spring to further improve workplace operations and the wellbeing of employees. Atria Finland Atria Finland continued the implementation of the Early Caring project for better employee wellbeing in A well-being survey was conducted among all Atria Finland employees along with physical capability tests. All participants received individual feedback on their physical capacity. Spring 2010 was shadowed by labour market disputes in the food industry. Measures to maintain individuals ability to work were strengthened and set up in the occupational health care. Managerial activities and leadership structures were also improved. Strategy-based training and development programmes were established, for example, by launching the new Atria Trainee coaching for young academic talents. The Early Caring employee wellbeing project will continue in 2011 with focus on occupational safety and safety management. Atria has safety management targets for accident rate and close calls reporting. A well-being at work discussion will be held with all production employees during 2011, while clerical and managerial employees have their annual personal performance evaluations which also address the issue. The 2011 priority areas are productivity improvement, further development of leadership and managerial work and the creation and reinforcement of talent. Atria Scandinavia Human resources work within Atria Scandinavia involved continued reorganisation of the Sköllersta and Fosie sites. Particular attention was paid to reassigning existing personnel. An internal and external recruitment tool was developed to ensure efficient organisation and the payroll and travel expenses accounting system was also improved. The Apollo project, launched in 2009 to increase the efficiency of Atria Deli operations and to develop its product portfolio, actively continued 38
43 Personnel Atria Group s average number of personnel persons Personnel in average % Men & women Corporate responsibility Atria Finland...36% Atria Scandinavia...21% Atria Russia...35% Atria Baltic...8% Atria Russia Atria Baltic 0 Atria Atria Finland Scandinavia 0 Atria Atria Finland Scandinavia Women Men Atria Russia Atria Baltic Age structure in Atria Group* persons under over 65 Atria Finland Atria Scandinavia Atria Russia Atria Baltic *Situation on Dec 31, 2010 Service years* persons under 1 year 1 5 years 6 10 years years years years years years years yli 40 years Atria Finland Atria Scandinavia Atria Russia Atria Baltic *Situation on Dec 31,


44 Social responsibility in The project, which has affected the entire organisation, is expected to yield positive results in The drafting of shared human resources practices started alongside the reorganisation work to support business expansion and employee well-being. Atria Scandinavia participated in the Group-level development projects to secure the development of skills, and a regional sales development programme was launched. Human resources targets for 2011 highlight the reinforcement of leadership and sales skills, harmonising personnel practices and supporting employees through the organisation s structural change process. Atria Russia The main personnel changes within Atria Russia in 2010 were linked to the recruitment, workplace induction and training of production personnel for the newly opened Gorelovo production facility. Gorelovo s production managers also took part in leadership training. The Moscow and St Petersburg sales units were strengthened and expanded. The programme focusing on well-being at work launched in 2010 involves a work station survey and regular health checks for production personnel. Well-being at work was promoted by means of various personnel events, excursions and contests. Hard work was promoted by revising the remuneration scheme of the logistics, production, technology and marketing units. Atria Russia engages in development of skills through participation in Atria s joint training programmes. The unit also launched its own quality management training programme with an eye on the implementation of the ISO food safety standard. At the end of 2010 Atria Russia announced a shift of meat product production from the Moscow and Sinyavino plants to the new Gorelovo plant in St Petersburg. This concentration of operations means a net reduction of 300 employees. Atria Russia s main targets in 2011 is to focus on strengthening skills through leadership and conference training and Group training programmes. Internal communications will be intensified by means of regular meetings and events. Atria Baltic Within Atria Baltic, key organisational changes included restructuring of the Ahja production plant and a new sales unit with 70 per cent new workforce. The meat products and sales units pay systems were revised, and a review of salaries was conducted among clerical employees. The employment contracts were redrafted according to new Estonia Employment Act. Job descriptions were updated for office and factory employees. All production and logistics centre employees participated in annual physical health check and work environment risk assessment was carried out in Vastse-Kuuste production plant. Skills were developed through participation in Group training programmes; in language and team training. Internal communication was improved by arranging communication training for the sales and marketing team as well as by arranging regular meetings and common events. The goals for 2011 highlight the development of skills through participation in training programmes, variable pay-system to production employees, implementation of health and safety strategy and investment to internal communication. 40


45 Product safety maintained throughout the food chain The management of product quality and the safety of Atria s meat products starts at primary production and continues throughout the processing chain all the way to the consumer. Each link in the chain ensures that predetermined quality criteria are met. The foundation for safety is laid by competent personnel, a hygienic production environment, hygienic work methods and an uninterrupted cold chain. Product safety work starts at the beginning of the chain. A crucial part of the product safety of meat consists of the disease prevention work conducted at farms and a strictly limited use of veterinary medicines, such as antibiotics, so that the meat contains only minor traces. The wellbeing of production animals consists of animal health, rearing conditions and the consideration of species-typical needs in animal husbandry. The wellbeing of animals is measured by several indicators. Information is gathered in national health classification systems and national and European registers, such as the pork farm health classification register (SIKAVA), the salmonella control programme and the European Food Safety Authority (EFSA). In addition to EU requirements, meat producers are subject to structural, operational and documentation requirements on a national level, the compliance with which is controlled by authorities. The safety and microbiological quality of Atria s products are based on self-monitoring plans that are approved by the authorities and cover raw materials, production processes and distribution routes. Safe Atria Quality workgroups which meet up regularly review the internal monitoring process and methods in use. In-house validations and audits ensure the functionality of systems. Through authority approval and regular audits, Atria ensures that the plans comply with the latest legislation and product safety standards in the industry, as well as with the requirements of international trade. Corporate responsibility 41
46 Financial statements and annual report Invitation to the Annual General Meeting...42 Report by the Board of Directors...43 Atria Plc s shareholders and shares...52 Group key indicators...54 Atria Group s IFRS Financial Statements Notes to the consolidated financial statements...60 Parent Company Financial Statements (FAS)...96 Notes to the parent company financial statements (FAS)...98 Signatures Auditor s report Corporate Governance Code (See separate table of contents on page 106) Annual General Meeting 29 April 2011 Atria Plc invites its shareholders to the Annual General Meeting, which will be held on Thursday, 29 April 2011 in Helsinki at the Finlandia Hall. The AGM will address the following matters, among others: 1. Matters to be addressed at the AGM as set out in Article 16 of the Articles of Association. The invitation to the AGM is published in national newspapers on 21 of March The AGM documents are available on Atria s website at Financial Reporting in 2011 Atria Plc will publish financial results in 2011 as follows: 2010 Financial statement...17 February Annual report... during week 14 Interim report Q1 (3 months)...29 April 2011 Interim report Q2 (6 months)...28 July 2011 Interim report Q3 (9 months)...27 October 2011 Atria s financial information will be published in real time on the company website at 42
47 Report by the Board of Directors Report by the Board of Directors 1 Jan 31 Dec 2010 Poor performance in Russia and industrial disputes in Finland weighed down the Group result The recovery of the food products market in 2010, following the previous year s recession, was slower than anticipated. The Russian economy developed particularly weakly. In April and May, industrial disputes in Finland culminated and a strike by food processing employees and an employer lock-out kept the Nurmo, Kauhajoki and Kuopio production plants closed for a period of 10 days. These were the main reasons for the year s unexpectedly weak performance. The recovery from the impact of the strike takes some time. Sales in the important summer season were lower than predicted, as the impact of the strike on the range of products for sale, and thus on customer orders, was still evident in the second half of the year. The market for food products in Russia continued to contract. More intense competition made it more difficult to implement price increases and, therefore, it has not been possible to transfer the increased raw material prices to sales prices. Atria Russia s performance was additionally weighed down by the costs of the new production plant in the St Petersburg region and increased investments in marketing. At the end of the year, as a result of goodwill impairment testing in Atria Russia, the Board of Directors decided that Atria Russia will record impairments totalling EUR 10.8 million allocated to goodwill. The impairments were recorded in the performance of Q3/2010 as a non-recurring item. The strengthening of the Russian rouble and Swedish krona against the euro increased the Group s net sales in euro terms. The Group s cash flow was strongly positive during the fourth quarter of the year and, owing to this, free cash flow for the entire year (operating cash flow cash flow from investments) amounted to EUR 4.4 million (EUR 27.6 million). Consolidated net liabilities increased to EUR 411 million (EUR 391 million). This was mainly due to the strengthening of the Swedish krona. New strategy : higher profitability through product leadership Work towards revamping the strategy was initiated in In April, the Board of Directors approved the new strategy, which extends to The most important financial goal of the new strategy is to significantly improve the profitability of Atria s international operations. The strategy also aims to secure and strengthen Atria Finland s profitability, which is already good. Besides improving profitability, the new strategy promotes company growth. This means predominantly organic growth, and only complementary acquisitions will be considered. The strengthening of the financial position and balance sheet structure are also highlighted in the new strategy. Product leadership is the strategic cornerstone. In practice this means that Atria will, in the coming years, increasingly invest in product development and marketing as well as in the development of new types of operating models. Becoming more innovative is one of the key objectives of the product leadership strategy. Besides new products, further development of existing products and product families is crucial in achieving product leadership and putting the strategy into practice. Individual product group strategies will be devised for all product groups. Product leadership will be sought in two primary product groups: cold cuts and the Sibylla fast food business. The business area specific strategy plans were built into strategic projects with specified financial indicators. The strategic projects in each country are monitored by the Group on a monthly basis, and more extensive reviews are carried out quarterly. Atria wants to be the first choice of consumers and customers in the food sector especially in fresh products in the Baltic Sea region and European part of Russia. To accomplish this, Atria must be the market leader or at least the second largest player in the market in all business areas, and its brands must be among the two best-known brands. Atria Group s financial goals are as follows: EBIT... 5% Equity ratio... 40% Share of international operations... 50% Return on equity (ROE)... 12% Dividend distribution of profit for the period... 50% Making responsibility part of the business In the period under review Atria focused on further developing its responsible operations and published the principles and goals of the Handprint programme. With the Handprint programme, Atria s responsible operations, which already have more than 100 years of history, will be developed in a coordinated manner. It is a comprehensive corporate responsibility programme that concerns the entire Atria food processing chain. The Atria s Handprint programme gathers the principles, practices and results of Atria s responsible operations and provides extensive, transparent information on them. The corporate responsibility programme is particularly concerned with seven sectors: finance environment well-being of animals product safety nutrition personnel communication Report by the Board of Directors 43
48 Report by the Board of Directors As part of the Handprint programme, Atria published a set of ethical principles, the Atria Code of Conduct, and the Group s first stand-alone Corporate Responsibility Report. Responsible operating methods and transparency are key development priorities for the entire food industry. By investing more systematically in developing responsible operating methods, Atria aims to secure its current and future operating conditions. Finland and Scandinavia achieved moderate results despite sluggish markets, demand fell in Russia Atria Finland s net sales were EUR million (EUR million), down 1.8 per cent year-on-year. The decline of net sales was mainly due to the industrial disputes in spring The Nurmo, Kauhajoki and Kuopio production plants shut down, with the exception of the poultry unit, for 10 days. In the summer season, Atria was particularly successful within the poultry product group. Good preparation for the amendment of the EU poultry directive and good new products boosted Atria s market share to record heights. In other product groups, recovery from the strike to normal levels will take longer. The market for Food Service products is recovering from the recession, and sales took a turn for the better during the accounting period. Christmas season sales, especially sales of ham, were brisk. The export ban imposed by the Russian authorities interrupted Atria Finland s exporting of pork to Russia during the period between February and December. The share of Russian exports in Atria Finland s net sales is quite small, and the export ban did not have a significant impact on net sales. Atria Finland s EBIT fell 28.4 per cent from the previous year. The industrial disputes and lower prices across the entire product range weighed on the result. However, cost-efficiency has been good, resulting in moderate profitability. The 10-day production break caused by the strike overloaded pig and bovine slaughtering in the summer, and clearing this backlog increased the amount of frozen stocks. The frozen stocks could not be cleared because of the recordhigh amount of imported meat in the market. The steep rise in feed price at the end of the year put heavy cost pressure on meat producers. In October, Atria Finland published its plan to improve the efficiency of its bovine slaughtering operations. According to the plan, bovine slaughtering and cutting will be concentrated at the Kauhajoki facility. Modern abattoir and cutting facilities will be constructed in Kauhajoki, to be completed by the end of Employer-employee negotiations relating to the plan were initiated with the personnel. The annual cost savings from the efficiency improvement programme are estimated at EUR 6 million. The Board of Directors decided to go ahead with the plan in January The decision did not affect the result for the accounting period. Atria Scandinavia s net sales were EUR million (EUR million), a decline of 3.4 per cent. Net sales in krona fell by 12.3 per cent. The decrease in net sales was mainly due to the discontinuation of the production of consumer packaged meat in summer 2010 and the sale of the salad and sandwich business in summer The annual net sales from these totalled approximately EUR 70 million. Atria Scandinavia s EBIT grew by 39.4 per cent to EUR 13.9 million. The EBIT margin in the fourth quarter of 2010 rose to 5.7 per cent. The performance improvement was supported by the strengthening of the Swedish krona by more than 10 per cent against the euro. This caused the price of imported raw materials to fall, which in turn improved sales margins. The improved performance was primarily due to the reorganisation that the company used to slim down its cost structure and improve its cost efficiency. An efficiency improvement programme was launched in Sweden in Q1/2010 and the company decided to discontinue production of consumer-packed meat. Production at the Årsta plant came to an end in October and the plant was closed. Atria Scandinavia s result includes EUR 2.3 million of non-recurring costs relating to the shutdown of the Årsta plant. Also, the Tyresö plant located in the Stockholm region was shut down and production was transferred to the Skene plant. A decision was made in the spring concerning large investments in the automation of the cold cuts production line at the Halmstad plant and the automation of the meat products line at Sköllersta. These investments totalled EUR 1.6 million. Despite the weak overall demand for fresh food products and increased domestic and international competition, Atria Scandinavia s total market position remained unchanged and in Denmark it strengthened. International growth of the Sibylla fast food concept continued to be particularly strong in Eastern European countries. In Poland, for example, Atria Concept delivered approximately 240 new Sibylla outlets to service stations, which raised the number of Sibylla outlets in the country to a total of 560. Atria Scandinavia s Managing Director Michael Forsmark moved on and Juha Gröhn, M.Sc. (Food Science) was appointed as new Managing Director as of 1 September
49 Atria Russia s net sales increased by 14.3 per cent to EUR million (EUR million). Growth was boosted by increased sales, strengthening of the Russian rouble and price increases implemented at the end of the year. In the local currency, net sales grew by 3.9 per cent year-on-year. Atria Russia s EBIT was heavily in the red at EUR million (EUR -9.8 million). During the review period, Atria Russia recorded impairments totalling EUR 10.8 million allocated to goodwill as a non-recurring item. The weak performance was also impacted by sluggish market demand, weakened margins, increased marketing costs and, in particular, the strong rise in the prices of meat raw materials. In 2010 the Russian market for meat products declined by about 10 per cent (Source: Business Analytica). Atria Russia s EBIT also includes non-recurring items relating to the Campomos acquisition and real estate in Moscow. The company reached an agreement with the seller concerning the conditional purchase price for the Campomos acquisition. The positive net effect of these items was EUR 1.3 million. Atria s market position in the St Petersburg region remained strong. Its market share in St Petersburg s consumer retail trade increased to over 20 per cent. Atria is the clear market leader in St Petersburg (Source: Business Analytica). In Atria s own estimate its market share in the Moscow retail trade was approximately 4 per cent. The sales and marketing efforts related to Campomos products, initiated in 2009, have continued as planned. At the end of 2009 Atria signed a shareholder agreement with the Danish company Dan Invest A/S, concerning pork production, and this agreement was confirmed at the beginning of Once the production of the pork farms reaches full capacity, the estimated annual production volume will be 188,000 slaughter pigs by With this agreement, Atria has secured better availability and quality of locally produced pork for Russian consumers and Atria s Russian customers. This investment provides Atria with better means for creating a balance between imported and locally produced pork. This enables more efficient management of currencyrelated risks and other risks associated with the procurement of raw material. The new meat processing plant in Gorelovo, St Petersburg went on stream in April. The Gorelovo logistics centre has been operational since At the end of the year Atria Russia decided to concentrate its meat processing in Gorelovo, and production will be transferred there from the Sinyavino and Moscow plants. The aim is to improve cost efficiency by utilising the efficient western process technology at the Gorelovo facility. The measures will reduce the number of Atria s personnel by about 300. The annual cost savings are estimated at EUR 6 million, which will materialise fully by spring Atria Baltic s net sales fell by 6.7 per cent to EUR 35 million. The fall was mainly due to weakened overall demand and a decrease in the market share of meat products. The operating loss (excluding goodwill impairment losses) decreased by 31.5 per cent to EUR 3.7 million. Atria s profitmaking ability has been weakened by a lower price level, increased imports of meat products and the rapid increases in the prices of cereals and feed at the end of the year. Atria s market shares have narrowed slightly in the declining Estonian market. In the important cold cuts market Atria retained its position as the second largest player with a share of just under 20 per cent. In grill sausages, Atria is number one in the Estonian market with a market share exceeding 30 per cent (Source: AC Nielsen). The closing down of the Ahja plant in the early part of the year, as well as other efficiency improvement measures implemented, have improved the company s cost structure. Rauno Väisänen was appointed Managing Director of Atria Eesti AS effective of 1 February Tomas Back, M.Sc. (Econ.), was appointed Executive Vice President of Atria Baltic business area as of 1 September Earnings Consolidated EBIT was EUR 9.8 million (EUR 27.5 million). EBIT for 2010 includes a total of EUR 11.8 million (EUR 13.1 million) of non-recurring costs. A EUR 10.8 million goodwill value impairment was recorded in Russia along with other non-recurring items with a positive effect of EUR 1.3 million. Atria Scandinavia ceased producing consumer packaged meat and closed down the Årsta plant. This plant closure caused a non-recurring cost item of approximately EUR 2.3 million in Consolidated loss for the period was EUR 4.2 million (profit of EUR 7.4 million). Group key indicators, EUR million: Net sales 1, , ,356.9 EBIT EBIT% Balance sheet total 1, , ,134.5 Return on equity,% Return on investments,% Equity ratio,% Net gearing,% Report by the Board of Directors 45
50 Report by the Board of Directors Events occurring after the period In January 2011, Atria announced its decision to invest approximately 26 million euros in building and renovating the Kauhajoki bovine slaughterhouse and cutting plant. New production facilities will be built in Kauhajoki, and the existing production facilities will be renovated and automated using the latest production technology. Atria will also buy the shares of Kauhajoen Teurastamokiinteistöt Oy from Itikka Co-operative. The purchase price is approximately EUR 7 million. At the same time, the company launched an efficiency improvement programme to increase the efficiency of bovine slaughtering and cutting operations and bring down the excess capacity in slaughtering. Bovine slaughtering and cutting at the Kuopio facility will be transferred to the Kauhajoki slaughterhouse by the end of Carrying out the efficiency improvement programme means the reduction of approximately 120 man-years of work in Kuopio by the end of The annual cost savings from the efficiency improvement programme are estimated at EUR 6 million. The decision did not affect the result for the accounting period. In this context Atria also announced the conclusion of a co-operation agreement with Saarioinen Oy on the slaughtering of cattle reared in Eastern Finland at Saarioinen s Jyväskylä slaughterhouse. Mika Ala-Fossi was appointed Managing Director of Atria Finland and member of the management team on 1 February In February 2011, Atria Scandinavia announced a plan for an investment and efficiency improvement programme aimed at streamlining and automating the black pudding production process. According to plan Atria will invest approximately EUR 2.2 million in new production equipment for the Tranås plant. The production of black pudding will be transferred from the Saltsjö-Boo plant in Stockholm to Tranås. Significant synergy benefits will be achieved from moving the production to Tranås. The efficiency improvement programme is expected to generate annual cost savings of approximately EUR 1 million. Matti Tikkakoski resigned as President and CEO of Atria Plc on 4 March He also resigned from the Board of Directors. The Board of Directors started the recruitment process to appoint a new CEO. In the meantime the CEO s duties are performed by Juha Gröhn, Managing Director of Atria Scandinavia and Deputy CEO of Atria Plc. Research and development Atria Group s research and development operations focus on researching consumer behaviour and market data in all of the Group s business areas. In addition, Atria participates in applied research in the areas of product and packaging technology and food science. In line with Atria s new strategy, product leadership is our strategic differentiation tool. Product research and development resources were adjusted to meet the new strategy in the second half of Atria Finland launched 93 new products in the retail and Food Service markets in Among the year s biggest successes were Atria Organic Minced Beef, Meatloaf, Grill Plate, CheeseGotler and Surface Seasoned Chicken Tenderloin. The share of the new products in Finland is 3.5 per cent of total sales. Atria Russia launched a total of 104 new products. Of these 23 were launched under the Pit-Product brand and 83 under the Campomos brand. Re-closable frankfurter and cold cut packages were a significant new product in Russia. This innovation increased Pit-Product frankfurter sales by 10 per cent. In Russia the new products account for 1.5 per cent of total sales. Atria Scandinavia launched some 200 new products across all product groups. Several new high-end innovations were launched in the delicatessen and cold cuts product groups. In the Atria Scandinavia business area, consumers favour local products. Additive-free and healthy options are also sought after. In Sweden the new products accounted for some 3.7 per cent of total sales. Funds used for Atria Group s research and development activities in relation to net sales for the period : Research and development, EUR million % of net sales Financing and liquidity After two challenging years, the functioning of financial markets normalised to some extent during the accounting period. Bank credits shifted toward long-term maturities and the availability of credit improved. The decline in the market interest rate reversed in spring 2010, but market rates remained low by historical standards and loan margins decreased somewhat below last year s level. Therefore, the Group s financial expenses fell slightly year-on-year. Atria Plc refinanced a considerable portion of its committed credit limits and made active use of commercial papers to acquire short-term financing. In order to concentrate external financing in the parent company, Atria Scandinavia AB paid off a loan of 46
51 approximately EUR 18 million in June and Atria Plc raised a seven-year loan of EUR 15 million. In September, Atria Plc refinanced four old credit limits totalling EUR 190 million with three new credit limits totalling EUR 150 million. The maturities of the new committed credit limits are five years (EUR 100 million) and seven years (EUR 50 million). In addition to these, an eight-year TyEL loan in the amount of EUR 14 million was drawn. In November, an additional fiveyear committed credit facility of EUR 50 million was agreed upon. These arrangements lengthened the average maturity of the Group s loan portfolio and decreased the refinancing risk of the loan portfolio. In September, Atria also concluded a new interest rate swap to the amount of SEK 370 million. At the end of the accounting period on 31 December 2010, fixed interest debts accounted for 39.7% (33.0%) of the Group s liabilities. Risk management Atria's business is exposed to a variety of external and internal risks, whose effects on the results may be negative or positive. The purpose of Atria s proactive risk management activities, implemented consistently across the Group, is to support the execution of Atria s strategy and the achievement of targets, as well as to secure business continuity if the risks are realised. Risk management operations in Atria are guided by the Risk Management Policy approved by the Board of Directors and its harmonised operating models for risk assessment and reporting. A risk assessment in accordance with the policy was implemented in all business areas and Group operations. The most significant risks observed are prioritised throughout the Group and reported to the Board of Directors. The Management Teams of the business areas and the Group Management Team are responsible for implementing the required risk management measures in their respective areas of responsibility. The profitability of Atria s business is greatly affected by the global-level risk associated with changes in the market price of meat raw material. Price risk in cereals is also connected to Atria s own primary production. Atria aims to protect itself against unfavourable fluctuations in production costs by adjusting production where necessary. Atria also tries to anticipate changes through the pricing of end products. The Group applies a uniform transaction risk management policy to hedge against currency risks relating to raw material procurement. The Group makes active use of currency derivatives, particularly in order to hedge foreign-currency-denominated material purchases in Sweden against currency risks. Products sold under the Atria brand are manufactured using only Finnish meat. Consequently, changes in the production volumes and availability of Finnish meat raw material may affect Atria Finland s profitability in the long run. Changes in meat consumption may have a similar impact on production volumes and the Group s business as a whole. In Atria Russia s operations, changing restrictions and import duties on meat, as well as other authority regulations, constitute a special characteristic of the market. Atria aims to secure availability and quality of locally produced pork by investing in local pig production in Russia. Atria and its Danish partners have launched an extensive project in Russia concerning two pig farms. Atria Russia s new production plant in Gorelovo in the St Petersburg region was inaugurated in May 2010, enabling increased efficiency and the launch of new product groups in the Russian market. The most important new product group is convenience food, not much of which has been on offer in the Russian market up until now. Atria Russia will continue implementing its projects to concentrate functions and manage capacity in Retail trade in the food industry is highly concentrated in all of Atria s key markets, which creates opportunities for building diverse forms of cooperation over the long term. On the other hand, this may increase dependence on individual customers. The strength of Atria s market position and its brands improve its negotiating position. Being a food manufacturing company, it is of primary importance for Atria to see to the high quality and safety of raw materials and products throughout the production chain. Atria has modern methods in place for ensuring the safety of production processes and for eliminating various microbiological, chemical and physical hazards. An animal disease discovered at a critical point in Atria s production chain could interrupt production in the unit concerned and disturb the entire chain s operations. Through internal monitoring involving multiple stages, Atria aims to detect potential hazards as early as possible. The economic downturn increased the risk of weakening liquidity among Atria s customers and the occurrence of credit losses particularly in the hotel and restaurant sector and in the Baltic states and in Russia. As a result of more efficient credit control, no significant credit losses were incurred. A significant proportion of Atria s trade receivables in Finland are related to feed and animal trading in primary production. The profitability of agricultural production and producers liquidity may be reduced by sharp changes in the price of inputs. Significant changes in energy costs, such as electricity and gas prices, may affect Atria s profitability. Atria uses derivatives to hedge against unfavourable changes in Report by the Board of Directors 47
52 Report by the Board of Directors accordance with its hedging policy. The company also has projects underway aiming to cut energy costs. Low temperatures and repetitive movements are characteristic of work performed within the food industry. The work is often physical and requires the use of cutting machines and tools, which increases the risk of accidents at work. Atria aims to prevent occupational accidents, disease risks and related costs by investing in safety at work and the continuous improvement of work methods and tools. Atria has more than 20 production plants in Finland, Sweden, Denmark, the Baltic Countries and Russia. All of these are insured against material damage and business interruptions through the Group s insurance programmes. Atria manages its financial risks in accordance with the financing policy approved by the Board of Directors. The Board of Directors has delegated the application and implementation of financing policy and management of financing risks to the Group's Treasury Committee that consists of the President and CEO, the Executive Vice President, the CFO, the Group Controller and the Treasurer. The practical management of financial risks is centralised in the Group s Treasury unit. The aim of the Group s financing risk management is to reduce the effect on earnings, the balance sheet and cash flow due to price fluctuations on the financial markets and other uncertainty factors, and to ensure sufficient liquidity. The main risks related to financing are interest rate risk, currency risk, liquidity and refinancing risk and credit risk. Atria s financial risk management is discussed in more detail in Note 29 to the financial statements. Changes in administration and operational organisation 1 Jan - 31 Dec 2010 In its constitutive meeting following the Annual General Meeting, Atria Plc s Supervisory Board elected Maisa Romanainen, M.Sc. (Econ.), as a new member of the Board of Directors in place of retiring member Runar Lillandt. The Supervisory Board re-elected retiring member Timo Komulainen. Ari Pirkola was appointed Chairman and Seppo Paavola Deputy Chairman of the Supervisory Board. Martti Selin, Chairman of the Board of Directors, was reappointed. Atria Plc s Board of Directors had the following membership: Chairman of the Board Martti Selin; Deputy Chairman Timo Komulainen; members Tuomo Heikkilä, Esa Kaarto, Maisa Romanainen, Harri Sivula and Matti Tikkakoski. Michael Forsmark, Managing Director of Atria Scandinavia, left Atria. Juha Gröhn, M.Sc. (Food Science), was appointed Managing Director of Atria Scandinavia effective as of 1 September Juha Gröhn previously served as Managing Director of Atria Finland and director of the Atria Baltic business area. Matti Tikkakoski, M.Sc. (Econ.), was appointed Managing Director of Atria Finland and Tomas Back, M.Sc. (Econ.) Executive Vice President of Atria Baltic business area as of 1 September Seija Pietilä, M.Sc. (Econ.), Group Vice President, Human Resources, transferred to another employer. Kirsi Matero, M.Sc. (Econ.), was appointed new Group Vice President, Human Resources and member of the management team from 15 November Atria Plc s corporate governance system in 2010 is described in a separate report and published simultaneously with the report by the Board of Directors on the company website. Atria Plc s governance is described in more detail under the chapter on corporate governance principles on page 107. Personnel Average at 31 Dec Atria Finland 2,089 2,222 2,378 Atria Scandinavia 1,205 1,394 1,691 Atria Russia 2,048 2,003 1,525 Atria Baltic Atria Group total 5,812 6,214 6,135 Salaries and benefits for the period, Group total (EUR million) Management and key persons incentive programmes Share incentive plan Atria Plc s Board of Directors has decided to continue the share-based incentive programme for Atria Group s key individuals. The programme comprises three one-year accrual periods in the calendar years 2010, 2011 and Payments will be made in 2010, 2011 and 2012, partly in the form of the company s Series A shares and partly as cash payments. The cash payments will cover any taxes or similar costs caused by the incentives. The shares may not be transferred for a period of two years from the end of the accrual period. Any profit from the programme for the accrual period 2010 will be based on consolidated EBIT and capital employed. The share incentives to be paid for 2010 would have amounted to no more than 100,100 of Atria Plc s Series A shares. However, no share incentives are granted based on the 2010 result. In the earlier accrual periods of the incentive plan in incentives were paid partly in Series A shares and 48
53 3,000,000 2,500,000 2,000,000 1,500,000 1,000, ,000 0 Water consumption m 3 m 3 / product tonne Total water consumption by source in proportion to production GJ 2,000,000 1,500,000 1,000, ,000 Energy consumption GJ / product tonne Total energy consumption in proportion to production Report by the Board of Directors Atria Finland Atria Scandinavia Atria Russia Atria Baltic Atria Finland Atria Scandinavia Atria Russia Atria Baltic partly as cash payments. The cash payments covered the taxes and similar costs caused by the incentives. The shares may not be transferred for a period of two years from the end of the accrual period. In the accrual period, a total of 38,540 Series A shares held by the company were transferred free of charge to key persons under the incentive programme (35,260 shares for 2007 and 3,280 shares for 2009). In 2009, a total of 3,870 of these shares were returned to the company. Merit pay system Atria Plc s Board of Directors has set out the management and key persons bonus scheme for The maximum amount of merit pay for Atria Plc s President and CEO and Management Team is 30% to 50% of the annual salary, depending on the effect on the performance and the requirement level of the role. The criteria of Atria Plc s merit pay system comprise result criteria at Group level and in the person s responsibility area, the amount of working capital and, for some individuals, personal performance. In addition to the President and CEO, Deputy CEO, and Management Team, Atria Plc s merit pay system covers approximately 60 people at the executive and supervisory levels. Environmental responsibility The well-being of the environment is essential to the operations of Atria and the food industry as a whole. Atria Group s environmental responsibility is built around three main elements: taking the environment into consideration at all operational levels identifying the indirect environmental impact of various stages of the operating chain reducing the direct environmental impact of practical operations. Atria s main environmental concerns are energy use, water use, wastewater load and the generation of municipal waste. Indirect concerns are transport and primary production. The company is aware of their impact and monitors key variables such as the fuel consumption of vehicles. In primary production, Atria keeps track of the share of farms committed to the conditions for environmental subsidies. Environmental management is developed in accordance with the Group s values by networking, which enables Atria to develop the best environmental management practices to support continuous improvement together with other players. Environmental management at Atria Finland and, partially, Atria Scandinavia is based on an environmental management system certified in compliance with the ISO standard. In other business areas, the company strives to achieve a corresponding level of environmental management. Atria Finland s environmental management is handled by a steering group, which works under the Management Team and is in charge of planning and monitoring environmental management. The steering group has representatives from purchasing, production, product development, packaging design and energy production. The composition of the group ensures that Atria s environmental management encompasses all of the areas in which the company can control its environmental impact. The group analyses the results achieved in the previous year, discusses the required investments and sets the targets for the following period. Atria s Environmental Responsibility Programme is laid out on page 33 of this Annual Report. Outlook for 2011 Market conditions are expected to remain challenging in Consumption of food is expected to grow slightly in Finland, Sweden, Denmark and Estonia. In Russia, overall 49
54 Report by the Board of Directors demand for meat products decreased in 2010 and, according to Atria s estimate, the increase in demand will be slow during Atria Group s net sales are expected to grow somewhat in The growth of net sales was weighed down, particularly by the difficult market situation in Russia and the discontinuation of the production of consumer packaged meat in Sweden. The Group s EBIT excluding non-recurring costs stood at EUR 21.6 million in In 2011, the Group s EBIT is expected to be higher than this. The key sources for uncertainty in terms of earnings development are the rising prices of cereal, feed and other raw materials, as well as the difficult market situation in Russia. Rising cereal and feed prices cause pressure to increase meat prices. Atria Plc s share capital The breakdown of the parent company s share capital is as follows: Series A shares (1 vote/share)...19,063,747 Series KII shares (10 votes/share)... 9,203,981 Series A shares have preference for a dividend of 0.17, after which Series KII shares are paid a dividend of up to If dividend remains to be paid after this, Series A and Series KII shares entitle their holders to an equal right to a dividend. Atria s Articles of Association include a pre-emptive purchase clause concerning the KII shares. If a Series KII share is transferred to a party outside the company or a Series KII share is transferred to a shareholder within the company who has not previously owned Series KII shares, the transferee must inform the Board of Directors without delay and a Series KII shareholder has the right to pre-emptively purchase the share under certain conditions. In addition, the acquisition of Series KII shares by means of transfer requires approval by the company. Series A shares have no such limitations. Information on shareholding distribution, shareholders and management holdings can be found under the heading Shares and shareholders on page 52. Board of Directors share issue authorisation The Annual General Meeting authorised the Board of Directors to decide, on one or several occasions, on an issue of a maximum of 12,800,000 new A shares or on the disposal of any A shares held by the company through a share issue and/or by granting option rights or other special rights entitling people to shares as referred to in Chapter 10, Section 1 of the Companies Act. The authorisation will be exercised for the financing or execution of any acquisitions or other arrangements or investments related to the company s business, for the implementation of the company s incentive programme or for other purposes subject to the Board s decision. The Board is also authorised to decide on all terms and conditions of the share issue and of the granting of special rights as referred to in Chapter 10, Section 1 of the Companies Act. The authorisation thus also includes the right to issue shares in a proportion other than that of the shareholders current shareholdings in the company under the conditions provided by law, the right to issue shares against payment or without charge and the right to decide on a share issue without payment to the Company itself, subject to the provisions of the Companies Act on the maximum number of treasury shares. The authorisation shall supersede the share issue authorisation granted by the Annual General Meeting on 29 April 2009 to the Board of Directors, and be valid until the closing of the next Annual General Meeting or until 30 June 2011, whichever is first. Purchase and transfer of treasury shares The Annual General Meeting held on 29 April 2010 authorised the Board of Directors to decide, on one or several occasions, on the acquisition of a maximum of 2,800,000 of the company s own Series A shares with funds belonging to the Company s unrestricted equity, subject to the provisions of the Companies Act regarding the maximum number of treasury shares to be held by a company. The Company s own Series A shares may be acquired for use as consideration in any acquisitions or other arrangements relating to the Company s business, to finance investments, as part of the Company s incentive scheme, to develop the Company s capital structure, to be otherwise further transferred, to be retained by the Company or to be cancelled. The shares shall be acquired in a proportion other than that of the shareholders current shareholdings in the Company in public trading arranged by NASDAQ OMX Helsinki Ltd at the trading market price at the moment of acquisition. The shares shall be acquired and paid for in accordance with the rules of NASDAQ OMX Helsinki Ltd and Euroclear Finland Oy. The Board of Directors is authorised to decide on the acquisition of treasury shares in all other respects. The authorisation by the Annual General Meeting shall supersede the authorisation granted by the Annual General Meeting on 29 April 2009 to the Board of Directors to decide on the acquisition of the company s own shares and be valid until the closing of the next Annual General Meeting or until 30 June 2011, whichever is first. 50
55 A total of 3,280 treasury Series A shares held by the company were transferred as share incentives in As of 31 December 2010, the company held a total of 110,432 treasury shares. Donations The AGM approved the Board of Directors proposal on the donation of a maximum amount of EUR 150,000 to be made to the operation of universities or other educational institutions. The Board of Directors decided to donate a total of EUR 150,000 to three academic recipients: EUR 50,000 was donated to each of the University of Vaasa, the University of Eastern Finland and the South Ostrobothnian University Fund. Report by the Board of Directors Board of Directors proposal for profit distribution The parent company s shareholders equity on 31 December 2010 comprises the invested unrestricted equity fund of EUR 110,227,500, treasury share fund of EUR -1,271,455 and profits of EUR 85,382,754, of which profit for the period totals EUR 10,984,562. The Board of Directors will propose to the Annual General Meeting that the distributable profits be used as follows: a dividend of EUR 0.25/share be paid totalling EUR 7,039,324 added to shareholders equity EUR 77,071,975 EUR 84,111,299 No significant changes have occurred in the company s financial position since the end of the financial year. The company s liquidity is good and, in the Board of Directors opinion, the proposed dividend does not compromise the company s solvency. 51
56 Atria Plc shareholders and shares BREAKDOWN OF SHARE OWNERSHIP Shareholders according to the number of shares owned, 31 Dec 2010 Number of shares No. of shareholders % Shares (1,000) % , ,000 5, , ,001-10, , , , , ,001-1,000, , ,000, ,999,999, , Total 11, , Shareholders by business sector, 31 Dec 2010 Business sector No. of shareholders % Shares (1,000) % Companies , Financial and insurance institutions , Public corporations , Non-profit associations Households 10, , Foreign owners , Total 11, , Nominee-registered, total INFORMATION ON SHAREHOLDERS Major shareholders, 31 Dec 2010 KII A Total % Itikka Co-operative 4,914,281 2,642,801 7,557, Lihakunta 4,020,200 3,438,797 7,458, Odin Norden 1,047,216 1,047, Varma Mutual Pension Insurance Company 767, , Pohjanmaan Liha Co-operative 269, , , Mandatum Life Insurance Company Limited 502, , Public pension insurance company Veritas 366, , Odin Finland 316, , Nordea Bank Finland Plc 312, , Reima Kuisla 297, , Major shareholders in terms of voting rights, 31 Dec 2010 KII A Total % Itikka Co-operative 49,142,810 2,642,801 51,785, Lihakunta 40,202,000 3,438,797 43,640, Pohjanmaan Liha Co-operative 2,695, ,038 3,175, Odin Norden 1,047,216 1,047, Varma Mutual Pension Insurance Company 767, , Mandatum Life Insurance Company Limited 502, , Public pension insurance company Veritas 366, , Odin Finland 316, , Nordea Bank Finland Plc 312, , Reima Kuisla 297, ,
57 MANAGEMENT'S SHAREHOLDING The members of the Board of Directors and Supervisory Board, and the President and CEO and deputy CEO owned a total of 46,464 A series shares on 31 December 2010, which corresponds to 0.16% of shares and 0.04% of the voting rights conferred by them. MONTHLY TRADING VOLUME OF A SERIES SHARES IN 2010 Shareholders and shares Month Turnover, EUR Turnover, shares Monthly lowest Monthly highest January 10,763, , February 8,215, , March 12,588,165 1,070, April 13,810,068 1,067, May 8,180, , June 3,519, , July 2,493, , August 13,798,622 1,270, September 10,578, , October 6,150, , November 3,376, , December 12,879,863 1,417, Total 106,352,671 9,702,129 TREND IN THE PRICE OF THE A SERIES SHARE EUR /10 9/10 6/10 3/10 12/09 9/09 6/09 3/09 12/08 9/08 6/08 3/08 12/07 9/07 6/07 3/07 12/06 9/06 6/06 3/06 53
58 Group Key Indicators FINANCIAL INDICATORS 31 Dec Dec Dec Dec Dec 2006 Net sales, EUR million 1, , , , ,103.3 EBIT, EUR million % of net sales Financial income and expenses, EUR million % of net sales Profit before tax, EUR million % of net sales Return on equity (ROE), % Return on investment (ROI), % Equity ratio, % Interest-bearing liabilities, EUR million Gearing, % Net gearing, % Gross investments in fixed assets, EUR million % of net sales Average number of employees 5,812 6,214 6,135 5,947 5,740 Research and development costs, EUR million % of net sales * Volume of orders** * Booked in total as expenditure for the financial year ** Not a significant indicator as orders are generally delivered on the day following the order being placed SHARE-ISSUE ADJUSTED INDICATORS PER-SHARE 31 Dec Dec Dec Dec Dec 2006 Earnings per share (EPS), EUR Shareholders' equity per share, EUR Dividend/share, EUR* Dividend/profit, %* Effective dividend yield* Price/earnings (P/E) Market capitalisation, EUR million Share turnover/1,000 shares A Share turnover, % A Number of shares, million, total Number of shares A KII Share issue-adjusted average number of shares Share issue-adjusted number of shares on 31 December SHARE PRICE DEVELOPMENT Lowest of the period A Highest of the period A At end of period A Average price during the period A * The Board of Directors' proposal 54
59 FINANCIAL INDICATORS Return on equity (%) = Profit/loss for the period Shareholders' equity (average for the period) * 100 Group Key Indicators Return on investments, % = Profit before tax + interest and other financial expenses Shareholders equity + interest-bearing financial liabilities (average) * 100 Equity ratio (%) = Shareholders equity Balance sheet total - advance payments received * 100 Gearing (%) = Interest-bearing financial liabilities Shareholders equity * 100 Net Gearing (%) = Interest-bearing financial liabilities - cash and cash equivalents Shareholders equity * 100 Earnings per share (basic) = Profit for the period attributable to the owners of the parent company Average share issue-adjusted number of shares for the period Equity per share = Equity attributable to the owners of the parent company Undiluted number of shares on 31 Dec Dividend per share = Dividend distribution during the period Undiluted number of shares on 31 Dec Dividend/profit (%) = Dividend / share Earnings/share (EPS) * 100 Effective dividend yield (%) = Dividend / share Closing price at the end of the period * 100 Price/earnings (P/E) = Closing price at the end of the period Earnings / share Average price = Overall share turnover in euro Undiluted average number of shares traded during the period Market capitalisation = Number of shares at the end of the period * closing price on 31 Dec Share turnover (%) = Number of shares traded during the period Undiluted average number of shares *
60 Atria Group s Ifrs Financial Statements 2010 CONSOLIDATED INCOME STATEMENT, EUR 1,000 Notes 1 January 31 December January 31 December 2009 Net sales 1, 2 1,300,906 1,315,998 Costs of goods sold 7, 8-1,149,118-1,151,133 Gross margin 151, ,865 Sales and marketing expenses 3, 7, 8-84,497-77,737 Administrative expenses 4, 7, 8-47,329-47,658 Other operating income 5 7,714 4,646 Other operating expenses 6-17,920-16,602 EBIT 1 9,756 27,514 Financial income 9 31,500 24,657 Financial expenses 9-42,623-37,066 Net financial items -11,123-12,409 Income from associates 15 1,672 1,439 Profit before tax ,544 Income taxes 10, 18-4,532-9,097 Income for the financial period -4,227 7,447 Income distribution for the financial period: To parent company owners -5,069 7,073 To non-controlling owners Total -4,227 7,447 Earnings per share (basic), EUR 11-0,18 0,25 Diluted earnings per share, EUR 11-0,18 0,25 CONSOLIDATED STATEMENT OF COMPREHENSIVE INCOME, EUR 1,000 Income for the financial period -4,227 7,447 Other items of the total comprehensive income after tax: Financial assets available for sale 9, Cash flow hedge 9, 10 3,156-1,443 Net investment hedge Translation differences 9 16,888 2,510 Total comprehensive income for the financial period 16,152 8,207 Comprehensive income distribution for the financial period: To parent company owners 15,097 7,758 To non-controlling owners 1, Total 16,152 8,207 The notes presented on pages 60 to 95 form an integral part of the consolidated financial statements. 56
61 CONSOLIDATED BALANCE SHEET, EUR 1,000 Assets Notes 31 Dec Dec 2009 Non-current assets Property, plant and equipment 1, , ,284 Biological assets 13 1,891 1,811 Goodwill , ,801 Other intangible assets 14 75,527 70,008 Investments in joint ventures and associates 1, 15, 32 11,862 7,444 Other financial assets 16, 29 1,586 2,307 Trade receivables, loans and other receivables 17, 29 20,166 20,394 Deferred tax assets 10, 18 11,453 7,025 Total 755, ,074 IFRS Financial Statements Current assets Inventories , ,131 Biological assets 13 5,765 5,440 Trade and other receivables 20, , ,191 Tax assets 17,453 8,206 Cash and cash equivalents 21, 29 18,530 35,300 Total 346, ,268 Non-current assets held for sale 22 9,174 9,995 Total assets 1 1,111,615 1,101,337 Equity and liabilities Notes 31 Dec Dec 2009 Equity attributable to the shareholders of the parent company Share capital 48,055 48,055 Share premium 138, ,502 Treasury shares -1,271-1,308 Other funds 1,822-1,669 Invested unrestricted equity fund 110, ,596 Translation differences -14,314-30,989 Retained earnings 159, ,919 Total 10, 11, 18, 23, 443, ,106 24, 29 Non-controlling owners share 2,867 1,812 Total equity 446, ,918 Non-current liabilities Interest-bearing financial liabilities 26, , ,883 Deferred tax liabilities 10, 18 46,797 41,186 Other liabilities 25, ,380 Provisions Total 351, ,449 Current liabilities Interest-bearing financial liabilities 26, , ,914 Trade and other payables 28, , ,842 Current tax liabilities 701 9,214 Total 314, ,970 Total liabilities 1 665, ,419 Equity and liabilities, total 1,111,615 1,101,337 The notes presented on pages 60 to 95 form an integral part of the consolidated financial statements. 57
62 Atria Group s Ifrs Financial Statements 2010 CALCULATION OF CHANGES IN SHAREHOLDERS' EQUITY FOR THE GROUP, EUR 1,000 Note Share capital Share premium Equity attributable to the owners of the parent company Invested unrestrictetion Transla- dif- Treasury Other equity ferences shares funds fund premium Retained earnings Total Non-controlling owners share Total equity Equity 1 January , , ,336-33, , ,507 1, ,870 Total comprehensive income for the financial period Income for the financial period 7,073 7, ,447 Other items of the total comprehensive income Financial assets available for sale Cash flow hedge -1,443-1,443-1,443 Net investment hedge Translation differences 2,435 2, ,510 Transactions with owners Treasury shares Share incentives Distribution of dividends 23-5,653-5,653-5,653 Equity 31 December , ,502-1,308-1, ,596-30, , ,106 1, ,918 Total comprehensive income for the financial period Income for the financial period -5,069-5, ,227 Other items of the total comprehensive income Financial assets available for sale Cash flow hedge 3,156 3,156 3,156 Net investment hedge Translation differences 16,675 16, ,888 Transactions with owners Treasury shares Share incentives Distribution of dividends 23-7,039-7,039-7,039 Equity 31 December , ,502-1,271 1, ,571-14, , ,176 2, ,043 The notes presented on pages 60 to 95 form an integral part of the consolidated financial statements. 58
63 CONSOLIDATED CASH FLOW STATEMENT, EUR 1,000 Notes 1 January 31 December January 31 December 2009 Cash flow from operating activities Sales income 1,302,497 1,332,314 Payments received from other operating revenue 7,627 4,646 Payments on operating expenses -1,224,582-1,244,217 Interest paid and payments on other operating expenses -42,723-38,815 Dividends received 12 5 Interest payments received and other financial income 26,756 17,388 Direct taxes paid -24,894-9,584 IFRS Financial Statements Cash flow from operating activities 44,693 61,737 Cash flow from investments Investments in tangible and intangible assets -39,615-32,340 Investments ,850 Cash flow from investments -40,211-34,190 Cash flow from financing Draw down of long-term loans 40,814 41,807 Repayment of long-term loans -56,245-64,768 Dividends paid 23-7,039-5,653 Treasury shares Cash flow from financing -22,470-29,380 Change in cash and cash equivalents -17,988-1,833 Cash and cash equivalents at the start of the financial period 21 35,300 37,138 Effect of exchange rate changes 1,218-5 Cash and cash equivalents at end of financial period 18,530 35,300 The notes presented on pages 60 to 95 form an integral part of the consolidated financial statements. 59
64 Notes to the Consolidated Financial Statements Basic corporate information The parent company of the Atria Group, Atria Plc, is a Finnish public company formed in accordance with Finnish law and domiciled in Kuopio, Finland. The company has been listed on Nasdaq OMX Helsinki Ltd since Copies of the consolidated financial statements are available online at or from the parent company s head office at Atriantie 1, Nurmo; postal address: P.O. Box 900, FI ATRIA. Atria Plc and its subsidiaries manufacture and market food products, especially meat products, poultry products, meals and food concepts. Atria has defined Finland, Sweden, Denmark, European parts of Russia and the Baltic countries as its market area. Atria s subsidiaries are also located in this area. The Group s operations are divided into four business areas: Atria Finland, Atria Scandinavia, Atria Russia and Atria Baltic. The financial statements were approved by the Board of Directors for publication on 16 February According to the Finnish Companies Act, the shareholders are entitled to approve or reject the financial statements in the Annual General Meeting to be held after their publication. The AGM can also make a decision to revise the financial statements. Accounting policies BASIS OF PREPARATION The consolidated financial statements have been prepared in accordance with the International Financial Reporting Standards (IFRS) approved for use in the EU. IAS and IFRS standards valid on 31 December 2010 have been followed, as well as SIC and IFRIC interpretations. The IFRS refer to standards and interpretations thereof approved for application in the EU in compliance with the proceedings stipulated in EU decree (EC) 1606/2002, as referred to in the Finnish Accounting Act and subsequent regulations. The notes to the consolidated financial statements also comply with Finnish accounting and corporate legislation. The consolidated financial statement has been prepared on acquisition cost basis with the exception of available-forsale financial assets, financial assets and liabilities measured at fair value through profit or loss and derivative instruments. From the moment of classification, the assets held for sale are measured at the lower of their book value and fair value less cost to sell. The financial statement data is presented in units of 1,000 euros, with sums rounded off to the nearest thousand. CHANGES IN ACCOUNTING POLICIES AND DISCLOSURES a) New and amended standards which must be applied by the financial period beginning on 1 January 2010 Revised IFRS 3 Business Combinations and resulting amendments in IAS 27 Consolidated and Separate Financial Statements, IAS 28 Investments in Associates and IAS 31 Interests in Joint Ventures are applied with a non-retroactive effect to those business combinations in which the acquisition date falls in a financial period beginning on or after 1 July According to the revised standard, the acquisition method is still applied to business combinations. However, the method has undergone some significant changes compared with the former IFRS 3 standard. For example, all payments executed in order to implement an acquisition are recognised at fair value at the time of the acquisition and certain contingent payments classified as liabilities are measured at fair value through the statement of comprehensive income at a later stage. The non-controlling interest for each acquisition can be valued either at fair value or as a proportion of the net assets of the acquisition target. All acquisition-related expenses are recognised as expenses. The revisions to the standard affect the amount of goodwill from acquisitions and income from sales of business operations. The revision also affects items recorded through profit or loss both in the acquisition period and in periods in which additional purchase price is paid or additional acquisitions are carried out. Under the amended IAS 27, the impacts of transactions carried out with holders of non-controlling interest must be recognised under equity if there is no change in control, and goodwill or revenue and expenses no longer arise from these transactions. If the parent company loses its control in the subsidiary, any remaining interest in the acquisition target is measured at fair value through profit or loss. The amended IAS 27 has no impact in this financial period. b) New and amended standards and interpretations which must be applied in financial periods beginning on or after 1 January 2010 but which currently have no impact on the group IFRIC 12 Service Concession Arrangements IFRIC 15 Agreements for the Construction of Real Estate IFRIC 16 Hedges of a Net Investment in a Foreign Operation IFRIC 17 Distributions of Non-cash Assets to Owners IFRIC 18 Transfers of Assets from Customers IFRIC 9 Reassessment of Embedded Derivatives and amended IAS 39 Financial Instruments: Recognition and Measurement 60
65 IAS 39 amendment: Financial Instruments: Recognition and Measurement. The amendments concern hedge accounting. Amendment to IFRS 2 Share-based Payment Group cash-settled share-based payment transactions. c) IASB published in April 2009 improvements to 12 standards as part of the annual standard improvement process (Improvements to IFRSs). The impacts of the amendments vary depending on the standard, but the changes have not had a material impact on the consolidated financial statements. d) New standards and interpretations which have been published but which do not have to be applied in the financial period beginning on 1 January 2010 and have not been adopted early Revised IAS 24 Related Party Disclosures was issued in November This standard replaces the IAS 24 published in Revised IAS 24 must be applied in financial periods beginning on or after 1 January It may also be applied earlier either in part or fully. In the revised standard, the definition of a related party has been clarified and simplified, and government-related entities are no longer obliged to disclose the details of business transactions carried out with government or other government-related entities. The revision does not change existing related party reporting. Classification of Rights Issues (amendment to IAS 32) was issued in October The amendment applies to financial periods beginning on or after 1 February Earlier application is allowed. The amendment addresses the accounting for rights issues that are denominated in a currency other than the functional currency of the issuer. Provided that certain conditions are met, these rights are now classified as equity regardless of the currency in which the exercise price is denominated. Previously these rights were accounted for as derivative liabilities. This amendment will not affect the next consolidated financial statement. IFRIC 19 Extinguishing Financial Liabilities with Equity Instruments is applicable in financial periods beginning on or after 1 July The interpretation clarifies the accounting approach in a situation where the terms of a financial liability are renegotiated and, as a consequence, the company issues equity instruments to a creditor to extinguish all or part of the financial liability (settling liability by equity). The Group will adopt this interpretation as of 1 January It is not expected to affect the consolidated or parent company financial statements. Prepayments of a Minimum Funding Requirement (amendments to IFRIC 14). The amendments correct an unintended consequence of IFRIC 14 IAS 19 The Limit on a Defined Benefit Asset, Minimum Funding Requirements and their Interaction. Without these amendment, companies would not be allowed to recognise as an asset in their balance sheet some voluntary prepayments for minimum funding contributions. The amendments apply in financial periods beginning on or after 1 January The amendments are not expected to affect the consolidated financial statements. IASB published in July 2010 improvements to seven standards or interpretations as part of the annual standard improvement process. EU has not yet approved the improvements for application in the EU. The Group will adopt the amendments after the EU approval in its financial statements for Group management is looking into how the amendments will affect the consolidated financial statements. e) The Group will adopt the following standards, interpretations or amendments to existing standards in 2012 or later IFRS 9 Financial Instruments, covering classification and measurement of financial assets was issued in November It was the first part in a process to replace IAS 39 Financial Instruments: Recognition and Measurement with a new standard. IFRS 9 contains new kinds of requirements regarding the classification and measurement of financial assets, and it is not believed to affect the accounting of financial assets in the Group. The standard will not be effective until January 2013, but early adoption is permitted. However, the standard has not yet been approved for adoption in the EU. IFRS 9 Classification and measurement of financial liabilities was issued in October It complements the first part of the process to replace IAS 39, which targeted on the classification and measurement of financial assets, issued in November Under the new standard the recognition and measurement of financial liabilities should remain unchanged, except for those financial liabilities to which the fair value option is applied. The amendment is not expected to affect the accounting treatment of financial liabilities in the Group. The standard is not effective until January 2013, but early adoption is allowed if the previously issued standard on the recognition and measurement of financial assets has also been adopted early. However, the standard has not yet been approved for adoption in the EU. The overall effect of IFRS 9 is only now being looked into. Notes to Financial Statements 61
66 Notes to the Consolidated Financial Statements Amendment to IFRS 7 Disclosures: transfers of financial assets requires additional notes regarding risk positions arising from transferred financial assets. The amendment extends the requirement of detailed notes to cover also such transfers of financial assets that have been fully recognised outside balance sheet but to which the transferor maintains an interest. The amendment may increase the required amount of notes in financial statements. The amendment will be effective for financial periods beginning on or after 1 July It has not been given EU approval yet. Amendment to IAS 12 Deferred tax. In the past, IAS 12 required that the entity assesses what extent of the book value of an asset item recognised at fair value in the balance sheet can be accrued from continuous usage (as in rental revenue) and what extent from the sale of the asset. In accordance with this amendment, the book value of certain assets recognised at fair value is by default assumed to be accrued from the sale of the asset. This assumption is applicable for deferred taxes which arise from investment real estate, property, plant and equipment and intangible assets valued either at fair value or by the revaluation model. This amendment will not affect the consolidated financial statement. Accounting policies calling for judgments by the management and key sources of estimation uncertainty When preparing the financial statements, the management must make assessments and assumptions concerning the future and affecting assets and debts in relation to responsibilities, profits and costs. The realised values may deviate from the original assessments and assumptions. In addition, deliberation must be used in applying the accounting policies. This concerns cases where the IFRS practice in force contains alternative recognition, measurement or presentation procedures. The management has exercised judgment in the classification of assets and financial assets and in the recognition of deferred tax assets and reserves. Key accounting assessments and assumptions: The assessments are based on the management s view at the end date of the reporting period. Any changes in the assessments and assumptions are recognised in the accounting period in which the assessment or assumption is adjusted and in all subsequent accounting periods. Measurement of the fair value of assets acquired in business combinations: The assets and liabilities acquired in business combinations are valued using the fair value at the time of acquisition. In significant business combinations, the Group has used an external advisor when measuring the fair value of tangible and intangible assets. In the case of tangible assets, comparisons have been made with the market price of corresponding assets, and the assets have been tested for impairment caused by their age, wear and other similar factors. The fair value of intangible assets is determined based on assessments of asset cash flows. The management believes that the assessments and assumptions are sufficiently detailed to be used as the basis for fair value measurement. Impairment of assets: The Group reviews any indication of impairment of tangible and intangible assets at least at the end date of each reporting period. The Group conducts annual impairment tests on goodwill and intangible assets with indefinite useful lives. It also assesses any indication of impairment in accordance with the accounting policies. At the end of the accounting period, the value of the intangible assets to be tested annually was EUR million. The recoverable amounts of cash-generating units are defined on the basis of value-in-use calculations. The cash flows resulting from these calculations are based on the five-year financial plans approved by the management (Note 14). As a result of goodwill impairment testing, Atria Russia decided to record an impairment totalling EUR 10.8 million allocated to goodwill. Additional information on the recoverable amount susceptibility to changes in the assumptions used can be found in Note 14. Accounting policies for the consolidated financial statements Subsidiaries The consolidated financial statements include the parent company Atria Plc and all of its subsidiaries. Subsidiaries are companies over which the Group has control. The Group is in control when it owns over half of the voting rights or otherwise has the say in the company. Control refers to the right to decide on the company s financial and operating principles in order to reap benefit from its operations. The acquired subsidiaries are consolidated from the moment the Group has gained control of the company until said control ends. 62
67 Business combinations are accounted for using the acquisition method. The consideration paid for an acquisition of a subsidiary is measured using the fair value of assigned assets and accepted liabilities. Paid consideration includes the fair value of an asset or liability arising from a contingent consideration arrangement. Acquisition costs are entered as expenses as they arise. The net assets and accepted and contingent liabilities acquired in business combinations are valued at fair value at the time of the acquisition. The interest of non-controlling owners in the acquisition target is recognised on acquisition basis either at fair value or based on their relative share of the net assets of the acquisition target. The amount by which the sum total of paid consideration, non-controlling owners share in the acquisition target and the fair value of the previously held interest exceeds the Group s share of the fair value of the acquired net assets is recognised as goodwill in the balance sheet. If the sum total of the consideration, non-controlling owners share and previously held interest is less than the fair value of the acquired net assets of the subsidiary, the difference is entered directly in the profit and loss account. All intra-group transactions, receivables and liabilities, as well as unrealised profits are eliminated. Unrealised losses are also eliminated. Transactions conducted with non-controlling shareholders are treated as those conducted with Group shareholders. When shares are purchased from noncontrolling shareholders, the difference between the consideration paid and the book value of the share acquired of the net assets of the subsidiary is recognised in equity. Profit or loss from the sale of shares to non-controlling shareholders is also recognised in equity. When the control or large influence ceases to exist, any remaining interest is measured at fair value and the change in book value is recognised through profit or loss. This fair value serves as the original book value when the remaining interest is later recognised as an associate, joint venture or financial assets. In addition, the amounts of the said entity previously recognised in other comprehensive income are treated as if the Group had directly assigned the associated assets and liabilities. This may mean that amounts previously entered as other comprehensive income become accounted for through profit or loss. If the interest in an associate diminishes but a large influence remains, only a relative share of the amounts previously recognised in other comprehensive income is accounted for through profit or loss where appropriate. Associates Associates are companies in which the Group has considerable influence. Considerable influence materialises when the Group owns more than 20 per cent of the company s voting rights, or when the Group otherwise has considerable influence but not control over the company. The associates have been consolidated using the equity method. If the Group s share in the associates losses exceeds the investment s book value, the investment will be entered at zero value in the balance sheet and the losses exceeding the book value will not be recognised unless the Group is committed to fulfilling the associates obligations. Investments in associates include investments at the time of acquisition and changes in the associates equity after the time of acquisition. Income for the financial year from associates, corresponding to the Group s holding in them, has been entered as a separate item after operating profit. Joint ventures Joint ventures are companies in which the Group and other parties exercise joint control based on an agreement. Within the Group, joint ventures are consolidated using the equity method. Foreign currency translation The consolidated financial statements are presented in euro, which is the functional and presentation currency of the parent company. Foreign currency business transactions have been translated into euros at the exchange rate on the date of transaction. Foreign currency receivables and liabilities have been translated into euros at the exchange rate on the closing date. Exchange gains and losses arising from foreign currency transactions as well as receivables and liabilities have been recognised in the income statement, excluding loans that are part of a net investment in a foreign operation and those exchange rate changes of derivative instruments that are qualifying cash flow hedges or are used to effectively protect foreign net investments. These exchange differences have been recognised in other items of the total comprehensive income. Exchange gains and losses from operations are included in the appropriate item before operating profit. Exchange gains and losses from foreign currency-denominated loans and forward exchange agreements protecting financial transactions are included in financial income and expenses. The profit and financial position of Group companies outside the eurozone have been accounted for in the currency that is the currency of the operating region of the company in question. The income statements of Group companies Notes to Financial Statements 63
68 Notes to the Consolidated Financial Statements outside the eurozone have been translated into euros at the average exchange rate for the reporting period, and the balance sheets at the rate on the closing date. The exchange difference arising from the use of different translation rates is recognised in other comprehensive income. The translation differences arising from the elimination of the acquisition costs of subsidiaries outside the eurozone and the hedge profit deriving from the corresponding net investments are recognised in other comprehensive income. When a foreign operation is partially disposed of or sold, exchange rate differences recognised in equity are recognised through profit or loss as a sales gain or loss. Property, plant and equipment Property, plant and equipment are recognised at original cost, less accumulated depreciation and any impairment. If the tangible fixed asset consists of several parts with different useful lives, each part is treated as a separate asset. In this case, the costs connected to renewing the part are activated. Otherwise, later costs are included in the book value of the property, plant and equipment only if it is probable that the future benefit connected to the asset will benefit the Group, and the acquisition cost of the asset can be reliably determined. Other repair and maintenance costs are booked so that they affect earnings after they have materialised. Depreciation is calculated as straight-line depreciation according to the estimated useful life as follows: Buildings years Machinery and equipment 5 10 years Other intangible assets 5 10 years No depreciation is made on land and water. Assets which are not suited for recognition in other property, plant or equipment accounts due to their nature or depreciation periods are recognised as other tangible assets (Buildings, Machinery and equipment). The residual value and the useful life of assets are checked in every financial statement and, if necessary, adjusted so that the book value equals, at most, the recoverable amount. The depreciation of property, plant and equipment stops when the tangible fixed asset is classified as available for sale in accordance with IFRS 5 Non-current Assets Held for Sale and Discontinued Operations. Gains and losses accumulated from the disposal or transfer of tangible fixed assets are included in other operating income or expenses. Leases Group as lessor: Leases concerning tangible assets where the Group has a considerable share of the risks and rewards related to ownership are classified as finance leases. Finance leases are entered in the balance sheet at the fair value of the leased asset on the day the lease period begins, or at a lower value that corresponds to the current value of the minimum lease payments. The depreciation of assets acquired with finance leases are made during the useful life of assets or a shorter leasing period. Lease payments are apportioned between a finance charge and debt reduction over the lease period, so that a constant interest rate is formed for the outstanding liability in each financial year. Lease obligations are included in interest-bearing debts. Leases where the risks and rewards incident to ownership remain with the lessor are handled as operating leases. Rents paid on the basis of other leases are recognised as costs in the profit and loss account, based on the straight-line method during the lease period. Intangible assets Goodwill: Goodwill is the amount by which the acquisition cost exceeds the Group s share of the fair value of the acquired subsidiary s net assets at the time of acquisition. Goodwill arising from the acquisition of subsidiaries is recognised in intangible assets. Goodwill is tested annually for impairment and entered in the balance sheet at acquisition cost less accrued impairment losses. An impairment loss recognised for goodwill is not reversed. Goodwill is tested annually for impairment. For this purpose, goodwill is allocated to cash-generating units. The Group s cash-generating units are classified by business segment based on the operations and location of subsidiaries. In 2010, they are Atria Finland, Atria Scandinavia, Atria Russia and Atria Estonia. Goodwill is measured at original cost less impairment. Other intangible assets: Intangible assets are only entered in the balance sheet if the acquisition cost of the asset can be reliably determined and if it is probable that the expected economic benefit from the asset will flow to the company. Intangible assets with a limited useful life are recognised as expenses based on straight-line depreciation in the income statement during their known or estimated useful life. Intangible assets with indefinite useful lives are not amortised, but instead tested annually for impairment. 64
69 Depreciation periods: Customer relationships Trademarks Other intangible assets *) *) Includes e.g. computer software and subscription fees 3 8 years 5 10 years 5 10 years Impairment of tangible and intangible assets On each closing date, the Group tests intangible and tangible assets to see whether they show indications of impairment. If there are such indications, the recoverable amount from the said asset is estimated. The recoverable amount of cash from goodwill and intangible assets with indefinite useful lives is assessed annually and whenever indications of impairment are detected. The recoverable amount is the fair value of the asset less costs to sell or, if higher, the asset s value in use. If the recoverable amount cannot be assessed per item, the impairment need is observed on the level of cash-flow generating units, i.e. at the lowest unit level which is mainly independent of other units and at which cash flows can be distinguished from other cash flows. Impairment loss is recognised if the book value of the asset is higher than the recoverable amount. Impairment loss is recognised immediately in the income statement. If the impairment loss arises with regard to a cash-generating unit, it is first allocated to reduce the goodwill and then to reduce the other assets of the unit pro rata. The useful life of the amortised asset is re-evaluated in conjunction with the recognition of an impairment loss. An impairment loss recognised for an asset other than goodwill is reversed if there has been a change in the estimates used to determine the recoverable amount from the said asset. However, the impairment loss may not be reversed in excess of what the asset s book value would be without the recognition of the impairment loss. An impairment loss recognised for goodwill is never reversed. Inventories Inventories are measured at the lower of original cost or probable net realisable value. The acquisition cost is determined using the FIFO method. The acquisition cost for finished and unfinished products consists of raw materials, direct labour costs, other direct costs, and the appropriate share of manufacturing-related overhead and fixed overhead at a normal level of operations. The net realisable value is the estimated selling price in the ordinary course of business, less the estimated costs related to sales. Biological assets The Group s biological assets are live animals and growing crops. Biological assets are valued at fair value, less estimated sales-related costs. Productive animals are included in tangible assets and other biological assets are included in inventories. Agricultural products harvested of the biological assets at harvest time are valued at fair value, less estimated sales-related costs. Valuation after harvest is conducted in accordance with inventories valuation principles. The fair value of productive biological assets is based on acquisition price less a cost corresponding to the reduction of value in use due to the aging of animals. There is no available market price for productive animals. The fair value of consumable biological assets (slaughter animals) equals their market price, which is based on the company s slaughter animal procurement/sales in the local market. The fair value of consumable biological assets (growing crops) is based on production costs. Financial assets Classification The Group s financial assets are divided into the following groups: Financial assets recognised at fair value through profit or loss Loans and other receivables Financial assets available for sale The classification is made on the basis of the purpose of the acquisition, and the assets are classified in connection with the original acquisition. Financial assets recognised at fair value through profit or loss: A financial asset belongs to this group if it has been acquired for trading purposes or if it has been initially recognised at fair value through profit or loss. Financial assets held for trading are acquired mainly to generate profit from changes in short-term market prices. The derivatives used by the company that do not fulfil the hedge accounting conditions in IAS 39 have been classified as held for trading. The assets belonging to this group have been classified as current assets. Loans and other receivables: Loans and other receivables are non-derivative financial assets which involve payments that are fixed or determinable and which are not noted on active markets. They are included in current assets, except when they fall due within more than 12 months of the end date of the reporting period. These assets are classified as non-current assets. The trade and other receivables Notes to Financial Statements 65
70 Notes to the Consolidated Financial Statements as well as cash and cash equivalents in financial assets are also included in the Group s loans and other receivables. Financial assets available for sale: Financial assets available for sale are non-derivative assets that have been prescribed to this group or that have not been prescribed to any other group. They are included in noncurrent assets unless they fall due or are intended to be kept for less than 12 months from the closing date, in which case they are included in current assets. Recognition and measurement Regular purchases and sales of financial assets are recognised on the basis of the trading date, i.e., the date on which the Group commits to purchase or sell the asset. Financial assets are classified as non-current assets when they fall due more than 12 months from the closing date. If financial assets are intended to be kept for less than 12 months, they are classified as current assets. Financial assets are derecognised when the rights to receive cash flows from investments have expired or have been transferred to another party and the Group has transferred substantially all risks and rewards of ownership. Investments in financial assets not recognised at fair value through profit or loss are initially recognised at fair value plus all transaction costs that are directly attributable to the acquisition or issue. Financial assets recognised at fair value through profit or loss are initially recognised at fair value, and all transaction costs are expensed in the income statement. Financial assets recognised at fair value through profit or loss and available-for-sale financial assets are subsequently measured at fair value. Loans and other receivables are measured at amortised cost using the effective interest method. Unrealised and realised profits and losses due to changes in the fair value of the financial assets at fair value through profit or loss group are recognised in the income statement in the accounting period in which they occur. Exchange differences and changes in the fair value of assets classified as available for sale are recognised in other comprehensive income and are presented in the fair value fund, taking into consideration the tax effect. When securities classified as available for sale are sold or impaired, the accumulated fair value adjustments recognised in equity are transferred to the income statement as financial income and expenses. Dividends on available-for-sale equity instruments are recognised in the income statement when the Group s right to receive payments is established. The fair values of quoted investments are based on current bid prices. If the market for a financial asset is not active (and for unlisted securities), fair value is established through valuation techniques. These include the use of recent arm s-length transactions between independent parties, fair values of other instruments that are substantially the same and discounted cash flow analysis. The models make maximum use of market inputs and relies as little as possible on entity-specific inputs. Whether there is objective proof of impairment of a financial asset or financial asset group is estimated on each closing date. In the case of equity securities classified as available for sale, a significant or prolonged decline in the fair value of the security below its acquisition cost is considered as an indicator that the securities are impaired. If any such evidence exists, the cumulative loss measured as the difference between the acquisition cost and the current fair value, less any impairment loss on that financial asset previously recognised in profit or loss is removed from equity and recognised in the income statement. Impairment losses recognised in the income statement on equity instruments will not be reversed through the income statement. Derivative instruments and hedge accounting Derivatives are initially recognised at fair value on the date a derivative contract is entered into and are subsequently measured at their fair value. The method of recognising the resulting gain or loss depends on whether the derivative is designated as a hedging instrument, and if so, the nature of the item being hedged. The derivatives hedge accounting is applied to are defined as either: hedges of interest rate, currency or electricity price risks associated with a recognised asset or liability or a highly probable forecast transaction (cash flow hedge); or hedges of a net investment in a foreign operation (net investment hedge). The relationship between hedging instruments and hedged items is documented at the inception of the hedging transaction. Risk management objectives and strategies for undertaking various hedging transactions are documented as well. The Group documents its assessment, both at hedge inception and on an ongoing basis, of whether the derivatives that are used in hedging transactions are highly effective in offsetting changes in fair values or cash flows of hedged items. The full fair value of a hedging derivative is classified as a non-current asset or liability when the maturity of the hedged item is more than 12 months and as a current asset or liability when the remaining maturity of the hedged item is less than 12 months. Trading derivatives are classified as current assets or liabilities. 66
71 Cash flow hedge: The effective portion of changes in the fair value of derivatives that are designated and qualify as cash flow hedges are recognised in other items of the total comprehensive income. The gain or loss relating to the ineffective portion is recognised immediately in the income statement under the proper item. Gains and losses accumulated in equity are recycled in the income statement in the periods when the hedged item affects profit or loss (for example, when the forecast purchase that is hedged takes place). However, when the forecast transaction that is hedged results in the recognition of a non-financial asset (for example, inventories or fixed assets), the gains and losses previously deferred in equity are transferred from equity and included in the initial acquisition cost of the asset. The deferred amounts are ultimately recognised in costs of goods sold in case of inventories, or in depreciations in case of fixed assets. When a hedging instrument expires or is sold, or when a hedge no longer meets the criteria for hedge accounting, any cumulative gain or loss existing in equity at the time remains in equity and is recognised in the income statement only when the forecast transaction occurs. When a forecast transaction is no longer expected to occur, the cumulative gain or loss that was reported in equity is immediately transferred to the income statement under the proper item. Net investment hedge: Hedges of net investments in foreign operations are accounted for in the same way as cash flow hedges. Any gain or loss on the hedging instrument relating to the effective portion of the hedge is recognised in other items of the total comprehensive income. The gain or loss relating to the ineffective portion is recognised immediately in the income statement. Gains and losses accumulated in equity are included in the income statement when the foreign operation is partially disposed of or sold. Derivatives that do not meet the criteria for hedge accounting: Certain derivative instruments do not meet the criteria for hedge accounting. All changes in the fair value of this kind of derivatives are immediately recognised in the proper item of the income statement. Trade receivables Trade receivables are initially recognised at fair value and are subsequently measured at amortised cost using the effective interest rate method and taking impairment into account. Provisions for impairment for trade receivables are recognised when there is objective evidence that the Group will not be able to collect all amounts due according to the original terms of receivables. Significant financial difficulties of the debtor, probability that the debtor will enter bankruptcy or financial reorganisation, and default or delinquency in payments are considered indicators that the trade receivable is impaired. If the impairment loss decreases in a later accounting period, and the reduction can be objectively linked to a transaction that has taken place after the recognition of the impairment loss, the recognised loss is reversed through profit or loss. Cash and cash equivalents Cash and cash equivalents comprise cash and bank deposits available on demand. Items classified as cash and cash equivalents have a maximum maturity of three months from acquisition. Available credit limits are included in current interest-bearing liabilities. Non-current assets held for sale Non-current assets are classified as held for sale if their book value is to be recovered through a sale transaction rather than through continuing use. This condition is regarded as met only when the sale is highly probable and the asset is available for immediate sale in its present condition subject only to terms that are usual and customary. Furthermore, management must be committed to the sale, which should be expected to occur within one year of the date of classification. Immediately before being classified as held for sale, these assets are measured in accordance with the applicable IFRS standards. Thereafter, the assets are measured at the lower of their book value and fair value less cost to sell. These assets are no longer depreciated after the classification. equity Ordinary shares are presented as share capital. Expenses related to the issue or acquisition of equity instruments are presented as a deductible item under equity. If a Group company acquires shares in the company, the consideration paid for them and the expenses arising directly from the acquisition, taking into consideration the tax effect, are deducted from the shareholders equity until the shares are either cancelled or reissued. If the shares are reissued, the consideration received for them less transaction costs directly attributable to the shares is included in the shareholders equity, taking into consideration the tax effect. Financial liabilities Financial liabilities are initially recognised at fair value. They are later measured at amortised cost using the effective Notes to Financial Statements 67
72 Notes to the Consolidated Financial Statements interest method. Financial liabilities are included in current and non-current liabilities. A one-off credit fee related to committed credit facilities is spread over the duration of the agreement. The credit limit fees related to such facilities are recognised as a cost based on the passing of time. RESERVATIONS A reservation is entered when the Group has, due to a past event, a judicial or factual obligation, and the obligation is likely to materialise and the sum of the obligation can be reliably estimated. Reservations are valued at the current value of the expenses required to cover the obligation. The amounts of reservations are assessed on each closing date and their amounts are adjusted to correspond to the best estimate at that time. Changes in reservations are recognised in the income statement in the same item where the original reservation was entered. Revenue recognition Turnover includes profits from the sale of products and services, as well as raw materials and equipment, adjusted by indirect taxes and discounts. Goods and services: Revenue from the sale of articles is recognised when the risks and rewards of owning the article have been transferred to the buyer. Revenue from services is recognised when the service has been completed. Rental income: Rental income is recognised on a straight-line basis over the lease period. Interest and dividends: Interest rates are recognised based on the passing of time, taking into account the effective income from the asset. Dividend income is recognised when the shareholders right to payment is established. Employee benefits Pension obligations: Pension arrangements are classified as either defined benefit or defined contribution plans. In defined contribution plans, the Group makes fixed payments into a separate unit. The Group has no legal or constructive obligation to make additional payments, if the recipient of the payments cannot pay the pension benefits in question. All plans that do not fulfil these conditions are defined benefit pension plans. Payments made into defined contribution plans are recognised in the income statement in the reporting period to which they apply. The Group s pension plans are mainly defined contribution plans. Swedish ITP pension arrangements are multi-employer defined benefit plans. Sufficient information on these arrangements has not been acquired to allocate liabilities and assets, and therefore these plans are treated as defined contribution plans in the financial statements. Share-based payments: The Group has an incentive programme for the management where the payments are made in part as company shares, and in part as money. The benefits awarded under the programme are measured at fair value at the time of awarding and recognised in the income statement as an expense arising from employee benefits spread over the earnings and engagement period. The amount of money paid in the arrangement is remeasured using the share price at the balance sheet date and recognised in the income statement as an expense from employee benefits evenly from the day of granting until the money is transferred to the recipient. More information on share-based payments in Note 24. Research and development costs Research costs are recognised as an expense in the balance sheet. Development costs related to individual projects are activated in the balance sheet when there is enough certainty that the asset in question can be technically implemented and will probably generate a future financial benefit. Activated development costs are recognised as project-specific costs during the useful life of the asset. The asset is amortised from the time it is ready for use. The Group has no activated development costs. Government grants Grants received as compensation for expenses are recognised in the income statement, while expenses connected with the grant are entered as costs. Such grants are entered under other operating income. In the period under review, production subsidies for agricultural operations in Russia and Estonia have been recognised as government grants. The nature of the grants varies from one country to the next and the grants are only paid after all the terms and conditions of the grant have been met, so the company does not have a repayment obligation regarding grants received. No significant change is anticipated regarding the amount of grants. Government grants, such as grants received for the acquisition of property, plant and equipment, are recognised 68
73 as a deduction in the book value of property, plant and equipment when it is reasonably certain that the grant will be received and that the Group company fulfils the prerequisites for receiving the grant. Grants are recognised as income in the form of lower depreciation during the useful life of the asset. Notes to Financial Statements Income taxes The tax expense in the income statement consists of current tax, tax adjustments from previous financial years, and deferred tax. Taxes are entered in the income statement except if they are connected to other comprehensive income or to items recognised directly in equity. In this case the tax is also entered in other comprehensive income or directly in equity. Current tax is calculated from taxable profit based on the valid tax rate of each country. The tax is adjusted by possible taxes related to previous periods. Deferred tax is calculated from all temporary differences between the book value and tax base. The biggest temporary differences arise from the depreciation of tangible fixed assets and fair value measurement in connection with acquisitions. No deferred tax is recognised for non-deductible goodwill impairment, and no deferred tax is recognised for the undistributed profits of subsidiaries if the difference is not likely to dissolve in the foreseeable future. Deferred tax is calculated using the tax rates provided on the balance sheet date. Deferred tax assets are recognised to the amount for which it is likely that taxable profit will be generated in the future against which the temporary difference can be utilised. 69
74 Notes to the Financial Statements 1. Segment information, EUR 1,000 The Group s operating segments are based on the Group s internal organisation structure and internal financial reporting, which the Group's Board of Directors uses in strategic and operative decision-making. The Group s Board of Directors assesses the performance of the operating segments based on net sales, EBIT and return on capital employed. The Group has four recognisable geographical segments that differ essentially from one another in terms of the functioning of the markets. They are Atria Finland, Atria Scandinavia, Atria Russia and Atria Baltic. In addition, Group costs are now reported separately in unallocated items. Group costs mainly consist of personnel and administration costs as well as costs arising from the share-based payment plan. A segment s assets and liabilities are items that can be directly attributed or reasonably allocated to the segment. The transactions between the segments take place at market price. The group has two customers, with whom the value of the trade is between 10 and 15 percent of the Group s net sales. The net sales in question is reported in the operating segments Finland, Russia and Baltic. Accounting period that ended on 31 Dec 2010 Operating segments Finland Scandinavia Russia Baltic Unallocated Eliminations Group Net sales External 753, , ,248 34,813 1,300,906 Internal 14,114 8, ,706 0 Total net sales 767, , ,248 34,965 1,300,906 EBIT 30,690 13,895-27,943-3,666-3,220 9,756 Financial income and expenses -11,123 Income from joint ventures and associates 1,672 Income taxes -4,532 Profit for the period -4,227 Assets 492, , ,235 52,167-33,878 1,111,615 Liabilities 241, , ,688 16,614-33, ,572 Return on capital employed (ROCE) % 7.9% 5.3% -16.9% -9.6% 1.1% Investments 13,254 9,524 22, ,167 Depreciation 28,749 11,662 8,102 2,985 51,498 Impairment , ,054 Accounting period that ended on 31 Dec 2009 Operating segments Finland Scandinavia Russia Baltic Unallocated Eliminations Group Net sales External 766, , ,956 37,413 1,315,998 Internal 15,312 6, ,646 0 Total net sales 781, , ,956 37,547 1,315,998 EBIT 42,910 9,973-9,819-12,485-3,065 27,514 Financial income and expenses -12,409 Income from joint ventures and associates 1,439 Income taxes -9,097 Profit for the period 7,447 Assets Segment assets 512, , ,402 54,261-26,446 1,093,893 Investments in joint ventures and associates 7, ,444 Total assets 519, , ,402 54,268-26,446 1,101,337 Liabilities 266, , ,518 14,425-26, ,419 Return on capital employed (ROCE) % 10.2% 4.0% -6.9% -26.5% 3.1% Investments 14,154 5,291 11,965 1,616 33,026 Depreciation 29,584 11,245 6,254 3,283 50,366 Impairment ,217 8,275 70
75 2. Net sales, EUR 1, Sale of goods 1,286,489 1,302,033 Sale of services 5,227 5,953 Other sales 9,190 8,012 Total 1,300,906 1,315, Research and development costs, EUR 1,000 The income statement includes R&D costs booked as costs to the amount of 10,287 9,382 Notes to the Financial Statements 4. Fees paid to auditors, EUR 1,000 Fees paid to auditing Reports and statements Tax consulting Other fees Total Other operating income, EUR 1,000 Sales income from fixed assets Cancellation of contingent consideration 2,922 Contributions received Others *) 4,339 4,123 Total 7,714 4,646 *) including rental income and sales income from by-products 6. Other operating expenses, EUR 1,000 Sales loss from fixed assets 1,233 Impairment of fixed assets 1,263 3,481 Depreciation on intangible assets 11,774 4,956 Others *) 3,650 8,165 Total 17,920 16,602 *) including costs related to the sales of by-products, credit losses and non-recurring restructuring costs 7. Personnel expenses, EUR 1,000 Expenses from employee benefits: Salaries and wages 180, ,766 Pension costs - contribution plans 28,061 23,854 Other staff-related expenses 19,795 26,748 Total 228, ,368 Information on management employee benefits is presented in Note 32. Information on granted share incentives is presented in Note 24. Expenses from employee benefits per operation: Costs of goods sold 177, ,353 Sales and marketing expenses 27,945 26,308 Administrative expenses 23,195 25,707 Total 228, ,368 71
76 Notes to the Financial Statements Group personnel on average by segment: Finland 2,089 2,222 Scandinavia 1,205 1,394 Russia 2,048 2,003 Baltic Total 5,812 6, Depreciation and impairment, EUR 1,000 Depreciation and impairment per operation: Costs of goods sold 46,129 44,924 Sales and marketing expenses 1, Administrative expenses 4,066 4,452 Other operating expenses 10,785 8,275 Total 62,552 58, Financial income and expenses, EUR 1,000 Financial income: Interest income from loan assets 2,986 3,472 Exchange rate profits from loan assets 26,470 14,640 Dividends received from financial assets for sale 12 5 Other financial income 28 6,008 Changes in the value of financial assets at fair value through profit or loss - Derivative instruments - not in hedge accounting 2, Total 31,500 24,657 Financial expenses: Interest expenses from financial liabilities valued at amortised cost -10,694-14,780 Exchange rate losses from financial liabilities valued at amortised cost -20,472-12,231 Other financial expenses -2,351-1,598 Changes in the value of financial assets at fair value through profit or loss - Derivative instruments - not in hedge accounting -9,106-8,457 Total -42,623-37,066 Financial income and expenses, total -11,123-12,409 During the year 2009, compensation in the amount of about EUR 6 million for the delayed completion of the meat product plant in Gorelovo, St Petersburg, was recorded under other financial income. Items related to financial instruments and recognised in other items of the total comprehensive income before taxes: Cash flow hedges 4,207-1,950 Financial assets available for sale Translation differences 16,888 2,510 Total 21, Income taxes, EUR 1,000 Taxes in the income statement: Tax based on the taxable profit for the period 6,956 15,221 Retained taxes Deferred tax -2,605-5,970 Total 4,532 9,097 72
77 Balancing of income statement taxes to profit before taxes: Profit before taxes ,544 Taxes calculated with parent company's 26% tax rate 79 4,301 Effect of foreign subsidiaries' deviating tax rates 3,175 2,148 Effect from associates' earnings Retained taxes Effect of tax-free income -1, Effect of costs that are undeductible in taxation 2, Unrecognised deferred tax assets 61 2,995 Other changes Total 4,532 9,097 Notes to the Financial Statements Taxes recognised in other items of the total comprehensive income Before tax Tax effects After tax 2010 Cash flow hedges 4,207-1,051 3,156 Net investment hedge Financial assets available for sale Translation differences 16,888 16,888 Total 21,546-1,167 20, Cash flow hedges -1, ,443 Net investment hedge Financial assets available for sale Translation differences 2,510 2,510 Total Earnings per share, EUR 1,000 Basic earnings per share are calculated by dividing the parent company s shareholder s profit for the period by the weighted average number of outstanding shares. Profit for the period attributable to the owners of the parent company -5,069 7,073 Weighted average of shares for the period (1,000) 28,156 28,160 Basic earnings per share -0,18 0,25 When calculating the earnings per share adjusted by the dilution effect, the dilution effect from all potential dilutive conversions of ordinary shares is taken into account in the weighted average number of shares. Shares transferred through the Group s share incentive plan have a dilution effect. The share incentive plan criteria based on the 2010 result are not met and, therefore, no dilutive shares exist. 73
78 Notes to the Financial Statements 12. Property, plant and equipment, EUR 1,000 Land and water Buildings and structures Machinery and equipment Other tangible assets Acquisitions in progress Total Acquisition cost, 1 Jan , , ,820 5,737 38, ,357 Business combinations Increases 5,849 31,537 41, , ,515 Decreases -3,865-19,687-3,200-58,213-84,965 Exchange differences 439 9,266 19, ,332 30,218 Acquisition cost, 31 Dec , , ,911 2,849 16,109 1,034,125 Accumulated depreciation and impairment, 1 Jan , ,263-2, ,073 Business combinations Decreases 1,556 6,748 1, ,680 Depreciation -12,510-35, ,707 Impairment Exchange differences -3,762-12, ,446 Accumulated depreciation and impairment, 31 Dec , ,871-1, ,026 Book value, 1 Jan , , ,557 3,661 38, ,284 Book value, 31 Dec , , ,040 1,538 16, ,099 Land and water Buildings and structures Machinery and equipment Other tangible assets Acquisitions in progress Total Acquisition cost, 1 Jan , , ,037 8,434 46, ,329 Business combinations Increases 15,721 19, ,825 47,559 Decreases ,883-5,344-3,461-17,886-29,450 Exchange differences , ,229 3,919 Acquisition cost, 31 Dec , , ,820 5,737 38, ,357 Accumulated depreciation and impairment, 1 Jan , ,106-4, ,510 Business combinations Decreases 1,196 5,259 3,212 9,667 Depreciation -12,170-34, ,197 Impairment -3,109-1, ,461 Exchange differences -1,044-3, ,572 Accumulated depreciation and impairment, 31 Dec , ,263-2, ,073 Book value, 1 Jan , , ,931 3,610 46, ,819 Book value, 31 Dec , , ,557 3,661 38, ,284 Assets acquired with financial leasing contracts are included in machinery and equipment. The acquisition cost recognised on the basis of the financial leasing contracts was EUR 5.4 million (EUR 6.9 million) and accumulated depreciation was EUR 1.0 million (EUR 3.7 million). Book value of assets was EUR 4.4 million (EUR 3.3 million). The value of property, plant and equipment does not include borrowing costs. The Group has not received government grants for the acquisition of fixed assets during the 2010 accounting period. The tangible assets used as loan collateral amount to EUR 9.0 million (EUR 9.7 million). 74
79 13. Biological assets, EUR 1, Biological assets: Productive 1,891 1,811 Consumable 5,765 5,440 At end of the period 7,656 7,251 Amounts of biological assets at the end of the period: Boars / number Sows, gilts/number 7,298 7,531 Dairy cattle / number Pigs for fattening / number 58,361 54,615 Yearling, heifer/ number Chicken eggs, chicken chicks / number 1,710,345 1,742,488 Growing crops / hectares 1, Notes to the Financial Statements Production of agricultural products during the period: Pork/1,000 kg 10,369 6,804 Beef/1,000 kg Chicken/1,000 kg 32,886 28,872 Milk/1,000 kg 5,238 5,551 Cereal/1000 kg 15,113 15,090 Agricultural production is practised in order to control raw material risks in the meat product business. Any increase in the cost of agricultural production is, if possible, passed on in the production chain to the meat product business and to the meat product sale prices. 14. Goodwill and other intangible assets, EUR 1,000 Intangible assets Goodwill Trademarks Customer relationships Other intangible assets Total Acquisition cost, 1 Jan ,621 67,085 2,347 18, ,097 Increases 2,270 2,270 Decreases -1, ,562 Exchange differences 17,914 7, ,224 Acquisition cost, 31 Dec ,487 74,143 2,347 20, ,029 Accumulated depreciation and impairment 1 Jan ,820-3, ,965-36,288 Depreciation on decreases Depreciation ,008-2,788 Impairment -10,785-10,785 Exchange differences , ,232 Accumulated depreciation, 31 Dec ,564-5,014-1,325-14,676-51,579 Book value, 1 Jan ,801 63,485 1,444 5, ,809 Book value, 31 Dec ,923 69,129 1,022 5, ,450 Intangible assets Goodwill Trademarks Customer relationships Other intangible assets Total Acquisition cost, 1 Jan ,291 65,176 2,347 16, ,984 Increases 1, ,611 2,784 Decreases Exchange differences 9,197 1, ,588 Acquisition cost, 31 Dec ,621 67,085 2,347 18, ,097 Accumulated depreciation and impairment, 1 Jan ,237-2, ,673-28,431 Depreciation on decreases
80 Notes to the Financial Statements Depreciation ,404-3,169 Impairment -3, ,814 Exchange differences ,132 Accumulated depreciation, 31 Dec ,820-3, ,965-36,288 Book value, 1 Jan ,054 63,087 1,915 5, ,553 Book value, 31 Dec ,801 63,485 1,444 5, ,809 During the 2010 accounting period, the company reached an agreement concerning the contingent consideration for the Campomos acquisition. The change in the purchase price reduced the amount of goodwill created by the acquisition by EUR 1.0 million. Goodwill and intangible assets with indefinite useful lives are allocated to the Group s cash-generating units as follows: Goodwill Trademarks Atria Finland 3,721 3,721 Atria Scandinavia 150, ,975 58,481 52,835 Atria Russia 0 11,043 5,247 4,963 Atria Estonia 9,062 9,062 4,516 4,516 Total 162, ,801 68,244 62,314 Impairment testing The recoverable amount of a cash-generating unit is defined on the basis of value-in-use calculations. These calculations use cash flow forecasts that are based on budgets approved by the management are defined before taxes and extend over a five-year period. Cash flows after the five-year forecast period are extrapolated using the growth rates presented below. The growth rate used does not exceed the average long-term growth rate of the industry in which the unit that generates the cash flow operates. Key assumptions for 2010 Atria Finland Atria Scandinavia Atria Russia brand Atria Estonia Long-term net sales growth rate 1.0% 1.0% 4.5% 1.0% Discount rate defined before taxes 5.4% 6.1% 11.1% 6.1% Key assumptions for 2009 Atria Finland Atria Scandinavia Atria Russia Atria Estonia Long-term net sales growth rate 1.0% 1.0% 5.0% 1.0% Discount rate defined before taxes 5.3% 5.4% 10.0% 7.5% The most important assumptions used in Atria s impairment testing for cash flow forecasts are growth in net sales and long-term EBIT margin. The growth and profitability assumptions used are based on the profitability levels and growth rate in net sales that the company has experienced in the near past in Finland and Scandinavia. EBIT margins are expected to be close to the Group s targeted level of 5%. The improving long-term profitability of the Baltic business area is based on the assumptions that the ongoing improvement measures, the more profitable use of meat raw material and the improvement of the general market situation will make the company profitable in the next few years. Growth percentage assumptions are moderate in all market areas. Russia s higher growth projection is due to its higher market growth expectations and the relatively high growth projection for meat consumption. Due to the relatively stable development of the food industry and moderately optimistic growth forecasts, it is unlikely that the growth rate assumptions will generate impairment losses in the future. As regards EBIT margins, impairment losses must be recognised if the long-term level in Scandinavia remains about 42% below the assumption and 38% below the assumption in Estonia. In Finland, the EBIT percentage should be approximately 93% below the assumption before the need for impairment arises. Discount rates could produce impairment losses (all cash flow forecasts being equal) if they increased by 3.1 percentage points in Scandinavia and 1.7 percentage points in Estonia. In Finland, an increase by over 11 percentage points would lead to impairments. Clearly higher discount rates would mean that the market situation has changed in such a way that the change could affect Atria s cash flows as well. Therefore, the above-mentioned increases in discount rates do not directly mean that there would be a need for impairment. Goodwill impairment testing performed as a result of a decline in market demand, steep rise of meat raw material prices and weakened margins led to the company recording goodwill impairment losses of EUR 10.8 million in Atria Russia during the third quarter of the period. In the financial statements, a separate test was conducted on a trademark with an indefinite useful life for Atria Russia. The testing did not indicate a need for recognising an impairment loss. On the basis of a sensitivity analysis, an impairment loss is not likely to be recognised for the trademark in the coming years, either. 76
81 15. Investments in joint ventures and associates, EUR 1,000 Investments in joint ventures and associates In joint ventures: At the beginning of the period 1, Share of earnings for the period 1, Dividends received Other changes 2,171 At the end of the period 4,752 1,038 Notes to the Financial Statements In associates: At the beginning of the period 6,406 5,248 Share of earnings for the period 96 1,274 Dividends received Other changes 647 At the end of the period 7,110 6,406 Total 11,862 7,444 Joint ventures and associates Domicile Assets Liabilities Net sales Profit/loss Ownership share (%) 2010 Joint ventures: Best-In Oy Kuopio 1, , ,0 Honkajoki Oy Group Honkajoki 17,356 9,519 25,939 2,733 50,0 Länsi-Kalkkuna Oy Säkylä 3,696 2,974 24, ,0 Associates: OOO Dan-Invest Krasnodar, Russia 24,096 16, ,0 Findest Protein Oy *) Kaustinen 3,131 1,690 3, ,7 Finnpig Oy Group Seinäjoki 2,838 2,029 3, ,0 Foodwest Oy Seinäjoki 1, , ,5 KOY Itikanmäen Teollisuustalo Seinäjoki 3, ,2 OÜ LKT Invest Valga, Estonia ,0 LTK Co-operative Hämeenlinna 10,673 2,009 21, ,7 Tuoretie Oy Seinäjoki 8,148 7,231 60, , Joint ventures: Best-In Oy Kuopio 1, , ,0 Länsi-Kalkkuna Oy Säkylä 3,629 2,932 25, ,0 Associates: Finnpig Oy Group Seinäjoki 2,609 1,880 2, ,0 Findest Protein Oy Kaustinen 3,541 2,102 3, ,6 Foodwest Oy Seinäjoki 1, , ,5 Honkajoki Oy Group Honkajoki 14,707 9,622 21,365 1,434 47,8 OÜ LKT Invest Valga, Estonia ,0 LTK Co-operative Hämeenlinna 10,238 2,000 22, ,7 Tuoretie Oy Seinäjoki 7,832 6,913 63, ,3 *) Ownership share: direct 16.6% and indirect 25.1 % 77
82 Notes to the Financial Statements 16. Other financial assets, EUR 1, Other financial assets include financial assets available for sale: Financial assets available for sale, 1 Jan 2,307 2,111 Exchange differences -1 8 Increases Decreases Financial assets available for sale, 31 Dec 1,586 2,307 Financial assets available for sale include the following items: Listed securities Unlisted securities 1,405 2,143 Total 1,586 2,307 Financial assets available for sale are denominated in the following currencies: EUR 1,505 2,225 SEK Total 1,586 2, Trade receivables, loans and other receivables, EUR 1,000 Balance sheet values 2010 Balance sheet values 2009 Trade receivables from producers 11,309 9,428 Loan receivables 6,597 6,406 Other receivables 918 4,538 Derivative financial instruments - in hedge accounting 1,321 Accrued credits and deferred charges Total 20,166 20,394 Fair values do not deviate significantly from balance sheet values. Non-current receivables were divided into currencies as follows: EUR 19,720 19,864 SEK RUR 2 Others Total 20,166 20,394 Trade receivables from producers include feed and animal trading receivables from animal payments, which fall due in more than 12 months. The credit risk of these receivables is explained in Note 20. No impairment has been recognised for loans and other receivables. The maximum credit risk for loans and other receivables is equivalent to their book value. 78
83 18. Deferred tax assets and liabilities, EUR 1,000 Deferred tax assets and liabilities Deferred tax assets: Tax asset to be realised in more than 12 months 11,142 6,697 Tax asset to be realised within 12 months Total 11,453 7,025 Deferred tax liabilities: Tax liability to be realised in more than 12 months 46,306 41,186 Tax liability to be realised within 12 months Total 46,797 41,186 Notes to the Financial Statements Changes to deferred taxes in Jan 2010 Recognised in the income statement Exchange differences Recognised in other items of the total comprehensive income Recognised in equity 31 Dec 2010 Deferred tax assets: Provisions Recognised losses 3,277 5, ,696 Benefit-based pension obligations Depreciation differences and voluntary provisions 1, Other items 2, ,121 Total 7,025 4, ,453 Deferred tax liabilities: Valuation of tangible and intangible assets at fair value upon acquisition -16, , ,459 Depreciation differences and voluntary provisions -24,844-1,140-1,026-27,010 Other items , ,328 Total -41,186-1,782-3, ,797 Changes to deferred taxes in Jan 2009 Recognised in the income statement Exchange differences Recognised in other items of the total comprehensive income Recognised in equity 31 Dec 2009 Deferred tax assets: Recognised losses 386 2, ,277 Benefit-based pension obligations Depreciation differences and voluntary provisions 1, ,270 Other items 534 1, ,462 Total 2,194 4, ,025 Deferred tax liabilities: Valuation of tangible and intangible assets at fair value upon acquisition -16, ,170 Depreciation differences and voluntary provisions -26,233 1, ,844 Other items Total -42,400 1, ,186 Deferred tax assets for unused tax losses are recognised to the amount for which obtaining tax benefits on the basis of taxable profit is likely. The accounting period's losses, for which deferred tax assets have been left unrecognised, amount to EUR 0.4 million. 79
84 Notes to the Financial Statements Deferred tax assets recognised from recognised losses expire as follows: Finland Sweden Russia Total ,075 3, ,465 4, Total ,137 8, Inventories, EUR 1, Materials and supplies 42,979 42,343 Unfinished products 14,616 16,700 Finished products 43,559 47,603 Other inventories 4,180 3,485 Total 105, ,131 During the accounting period, EUR 0.8 million (EUR 1.5 million), i.e., the amount used to lower the book value of the inventories to a value comparable with the net realisable value, was recognised as expenses. 20. Trade receivables and other current receivables, EUR 1, Trade receivables 135, ,393 Trade receivables from producers 30,621 31,362 Loan receivables 3,143 4,109 Other receivables 19,827 21,377 Derivative financial instruments - not in hedge accounting 299 Derivative financial instruments - in hedge accounting 1,871 Accrued credits and deferred charges 8,624 8,950 Total 199, ,191 Fair values do not deviate significantly from balance sheet values. In the Atria Group, credit risk from trade receivables is considered small in proportion to the scope of the operations. The Group s trade receivables are dispersed over several market areas and many customers. The share of retail chains in trade receivables is central in all business areas. Credit risk is managed with securities, such as credit insurances and bank guarantees as well as with advance billing. Each business area has been assigned a separate credit policy that takes the special features of the market area into account. Credit risk is examined and monitored on a case-by-case basis for major customers and customer groups. Trade receivables from producers include feed and animal trading receivables from animal payments. The receivables situation and security values are monitored regularly in accordance with the credit policy. Material items in accrued credits and deferred charges consist of prepaid expenses of purchase invoices, lease receivables and tax amortisations. Breakdown of trade receivables and items booked as credit losses: 2010 Credit losses Net 2010 No due 153, ,705 Overdue Less than 30 days 8, , days 1, , days More than 90 days 2, ,468 Total 166, ,088 80
85 Breakdown of trade receivables and items booked as credit losses: 2009 Credit losses No due 154, ,380 Overdue Less than 30 days 12, , days 1, , days 1, ,493 More than 90 days 5,557-1,376 4,181 Total 174,896-1, ,182 Net 2009 Notes to the Financial Statements Current receivables were divided into currencies as follows: EUR 119, ,932 SEK 41,278 41,060 RUR 24,349 26,917 DKK 6,028 5,157 EEK 4,312 4,278 USD 1,695 1,649 NOK 937 1,474 Others 1, Total 199, , Cash and cash equivalents, EUR 1, Cash in hand and at banks 18,530 35, Non-current assets held for sale, EUR 1,000 Finland Russia Baltic Total 2010 Land and water Buildings and structures 3,046 1,960 3,675 8,681 Machinery and equipment Other intangible assets Total 3,209 1,960 4,005 9, Land and water Buildings and structures 3,046 2,781 3,675 9,502 Machinery and equipment Other intangible assets Total 3,209 2,781 4,005 9,995 Non-current assets held for sale include industrial real estate in Moscow (balance sheet value EUR 2.0 million), industrial real estate and related machinery and equipment in Lithuania (balance sheet value EUR 4.0 million) and logistics real estate in Forssa, Finland, (balance sheet value EUR 3.2 million). The company has actively attempted to sell the real estate, but sales periods are longer due to the depressed market situation. The company expects the sales to come through after markets have recovered. During the 2010 accounting period, an impairment of EUR 1.0 million was recognised for the plant located in Russia. During the 2009 accounting period, an impairment of EUR 1.4 million was recognised for the plant located in Lithuania. 81
86 Notes to the Financial Statements 23. Shareholders equity, EUR 1,000 Shares and share capital Shares are divided into A and KII series, which differ in terms of voting rights. A series shares have one vote per share and KII series shares have ten votes per share. A series shares have preference for a dividend of EUR 0.17, after which KII series shares are paid a dividend of up to EUR If there is still more dividend available for distribution, A and KII series shares have the same entitlement to the dividend. All issued shares have been paid in full. The share has no nominal value or a maximum number. Number of shares outstanding (1,000) A series KII series Total 1 Jan ,017 9,204 28,221 Purchase of treasury shares Return of treasury shares Dec ,950 9,204 28,154 Shares granted in share incentives Dec ,953 9,204 28,157 Reserves included in shareholders equity: Share premium: The portion of share subscription payments recognised in share premium in compliance with the conditions of plans prior to the new Companies Act (21 July 2006/624) taking effect. Treasury shares: The treasury shares reserve contains the acquisition cost of own shares held by the Group. In 2008 and 2009, the Group s parent company, Atria Plc, acquired 145,102 shares on the stock exchange for an acquisition cost of EUR 1.3 million. In 2008, 35,260 of the acquired shares and, in 2010, 3,280 shares were transferred to key persons as a part of the Group s share incentive plan. At the end of the year, the parent company held a total of 110,432 treasury shares (113,712 treasury shares). Other funds: Fair value reserve Hedging fund 1,715-1,766 Total 1,822-1,669 The other funds item includes the fair value reserve and hedging fund. Changes in the fair value of available-for-sale financial assets are recognised in the fair value reserve, while the effective portions of changes in the fair value of the derivative instruments used for hedging are recognised in the hedging fund. Invested unrestricted equity fund: This reserve contains other equity investments and the share subscription price to the extent that it is not recognised in share capital according to a separate decision, as well as the value of shares earned on the basis of the share incentive plan, calculated at the rate of the grant date. Translation differences: This reserve contains the translation differences from the translation of the financial statements of foreign subsidiaries, as well as the translation of fair value adjustments of goodwill, assets and liabilities arising in conjunction with the acquisition of the said companies. Profits and losses arisen from hedges of net investments in foreign operations are also included in translation differences when the hedge accounting criteria are met. Parent company s distributable shareholders equity Invested unrestricted equity fund 110, ,228 Retained earnings 74,397 69,420 Own shares -1,271-1,308 Profit for the period 10,985 12,016 Total 194, ,356 Dividend per share paid for the period Dividend/share, EUR Dividend distributed by the parent company 7,039 5,653 The Board of Directors proposes to the Annual General Meeting, which will be held on 29 April 2011, that the Company pay EUR 0.25 per share in dividend, total of EUR 7,039,
87 24. Share-based payments, EUR 1,000 Atria Plc has a share incentive plan in place as part of the remuneration and commitment plan for the Company s and its subsidiaries key persons. The purpose is to combine the shareholders and key persons goals to increase the Company's value and to commit the persons to the Company by offering them a competitive bonus plan based on the ownership of the Company s shares. The plan has been extended by three 1-year accrual periods that begin on 1 January 2010, 1 January 2011 and 1 January 2012, all ending on 31 December in the respective years. The previous 3-year period comprised the accrual periods 2007, 2008 and The amount of the bonus for the accrual period is determined on the basis of the goals achieved after the accrual period by the end of April. On the basis of the plan, a maximum of 300,300 shares for the accrual periods and the amount in money needed to cover the taxes and tax-like payments incurred by the shares at the date of the share issue are issued. The Board of Directors will decide on the plan s accrual criteria and on the goals to be set annually and separately for each accrual period. The shares earned on the basis of the plan may not be transferred or otherwise used for a period of two years from the end of the accrual period (period of commitment). Key persons must return to the Company without delay the shares paid out gratuitously as a reward if their employment with a company belonging to the Group ends during the period of commitment. Notes to the Financial Statements Earnings periods Grant date 17 Feb April 2009 Earnings period begins 1 Jan Jan 2009 Earnings period ends 31 Dec Dec 2009 Maximum number of shares granted as remuneration 100, ,100 Share release 31 Dec Dec 2011 Number of people Earnings criteria: - Operative EBIT % 50% - Operative EBIT 80% - ROCE % 50% - Capital employed 20% Achievement of earnings criteria, % 0% 4% Number of share incentives granted 0 2,952 Share price listed on grant date, EUR Share price listed on balance sheet date, EUR Impact of share incentive plan on the results for the period Impact of the scheme on the profit for the period Liabilities from the cash payments of the share-based scheme Other non-current liabilities, EUR 1, Pension obligations 63 Other liabilities Derivative financial instruments - in hedge accounting Total 800 1,380 Non-current liabilities consist ofthe following currencies: EUR RUR 364 Others Total 800 1,380 83
88 Notes to the Financial Statements 26. Interest-bearing financial liabilities, EUR 1, Balance sheet values 2009 Balance sheet values Non-current Bonds 80,000 80,000 Loans from financial institutions 158, ,526 Pension fund loans 59,929 51,490 Other liabilities 2,037 3,000 Finance lease obligations 2,302 1,867 Total 302, ,883 Current Loans from financial institutions 21,796 26,211 Commercial papers 92,500 73,500 Pension fund loans 6,157 4,407 Other liabilities 5,108 1,854 Finance lease obligations 1, Total 127, ,914 Total interest-bearing liabilities 429, ,797 The fair values of interest-bearing loans do not deviate significantly from balance sheet values. With fixed interest rates 39,7% 33,0% With variable interest rates 60,3% 67,0% Average interest rate 2,71% 2,44% Non-current liabilities mature as follows: , , , ,478 79, ,451 46, ,407 4, ,012 Later 68,126 15,555 Total 302, ,883 Interest-bearing liabilities are divided into currencies as follows: EUR 228, ,330 SEK 157, ,102 DKK 15,904 19,662 RUR 25,208 25,672 EEK 211 3,109 LTL 2,517 4,922 Total 429, ,797 Finance lease obligations - total amount of minimum lease payments In less than a year 1, Between one and five years 2,513 2,127 After five years Total 4,280 3,174 84
89 Finance lease obligations - present value of minimum lease payments In less than a year 1, Between one and five years 2,251 1,823 After five years Total 3,899 2,809 Future interest accumulation Total 4,280 3, Provisions, EUR 1,000 Notes to the Financial Statements Legal claims 2010 At the beginning of the period 0 New provisions 812 Total 812 Legal claims concern a cancelled sale of real estate in Moscow and a contract dispute in Sweden. 28. Current trade and other payables, EUR 1, Trade payables 111,331 96,688 Advances received 1,096 1,135 Other liabilities 28,447 35,974 Derivative financial instruments - not in hedge accounting 1,741 1,913 Derivative financial instruments - in hedge accounting 217 1,748 Accrued liabilities 43,693 49,384 Total 186, ,842 Material items in accrued liabilities consist of personnel expenses and the amortisation of debt interests. Current liabilities consist of the following currencies: EUR 99, ,929 SEK 57,001 46,343 RUR 13,394 20,674 DKK 6,132 6,064 USD 3,830 4,245 EEK 4,930 4,043 NOK 533 1,081 Others Total 186, ,842 85
90 Notes to the Financial Statements 29. Financial risk management The financing policy approved by the Board of Directors defines the general principles of financial risk management. The Board has delegated the management of financial risks to Treasury Committee, while the practical management of financial risks is centrally handled by the Group s Treasury unit. The goal of financial risk management is to reduce the effect that price fluctuations on the financial markets and other uncertainty factors have on earnings, the balance sheet and cash flow, as well as to ensure sufficient liquidity. Treasury, together with the business areas, aims to identify, assess and hedge against all risks in accordance with the financing policy. The main risks related to financing are interest rate risk, currency risk, liquidity and refinancing risk and credit risk. Commodity risks and capital structure management are also dealt with at the end of this section. Interest rate risk Interest rate risk is managed by dividing financing into instruments with variable and fixed interest rates and by hedging with interest rate derivatives. During the accounting period, the Group used interest rate swaps in interest rate risk management. The Group links interest rate risk management to the interest cover ratio that is forecasted by dividing the 12-month rolling operating margin by the forecasted net interest expense. The lower the operating margin is in relation to net financing costs, the larger is the share of debt that must have a fixed interest rate. The Group s interest-bearing debt at the time of the financial statements was EUR million (EUR million), of which EUR million (EUR million) or 39.7% (33.0%) had fixed interest rates. The ratio of debt with fixed and variable interest rates is at the level defined by the Group s financing policy. The interest rate risk is mainly directed at the Group s interest-bearing liabilities because the amount of money market investments and related interest rate risk is low. The Group s operational cash flow is to a large extent independent of fluctuations in interest rates. At the time of the financial statements, Atria Plc had two open interest rate swaps subject to hedge accounting: -- An interest rate swap amounting to EUR 40 million where Atria pays a fixed interest rate of 2.58% and receives the 6-month Euribor rate, which was 1.137%. The company uses the interest rate swap to hedge a bond with variable interest rate that matures on 28 March An interest rate swap amounting to SEK 370 million (maturity on 9 December 2015) where Atria pays a fixed interest rate of 2.542% and receives the 3-month Stibor rate, which was 1.788%. The company uses the interest rate swap to hedge a SEK 370 million loan. The sensitivity analysis of net interest rate expenses is based on a 1% change in interest rates, which is considered to be reasonably realistic. It is calculated for year-end interest-bearing, variable-rate net liabilities that are expected to remain the same over the accounting period. The interest rate swaps are taken into account in the calculation. In simulations, the same change in interest rate is used for all currencies. On 31 December 2010, variable-rate net liabilities amounted to EUR million (EUR million). At the end of 2010, a +/-1% change in interest rates corresponded to a change of EUR +/-2.4 million in the Group s annual interest rate expenses (EUR +/-2.5 million). Currency risk Atria Group operates in many currency zones and is exposed to currency-related risks. Currency risks arise from forecasted transactions, assets and liabilities booked into the balance sheet and net investments in the operations of foreign subsidiaries. The subsidiaries hedge the currency risk related to commercial, operational items according to their currency risk policy for each business area. Each currency risk policy has been approved by the Treasury Committee. In Finland and Sweden, hedge accounting is applied to the aforementioned currency hedges. Currency risk is monitored according to the 12-month rolling cash flow forecast, and hedges are carried out for periods of 1 to 6 months using forward exchange agreements. During this time the cash flows hedged are expected to occur and affect profit or loss. Among other things, transaction risks come from the euro-denominated meat raw material imports of Atria s Swedish operations and from the USD-denominated imports of its Russian companies. In Atria s Finnish operations, currency flows and risks are relatively low and are mainly related to USD- and SEK-denominated exports. The Group has net investments in the operations of foreign subsidiaries that are exposed to currency risks. The Treasury Committee decides on net investment hedges on a case-by-case basis. At the time of the financial statements, there were no derivative agreements in force for net investment hedging. The parent company grants financing to the subsidiaries in their home currencies and has hedged the currency-denominated loan receivables from the subsidiaries through currency loans and forward exchange agreements. If, at the end of the accounting period, the euro had been 10% weaker/stronger than the Swedish krona (all other factors being equal), profit before taxes would have been EUR 0.4 million higher/lower due to the Swedish subsidiaries euro-denominated accounts payable (EUR 0.3 million). The effect on equity would have been EUR 0.7 million (EUR 0.9 million). Sensitivity analyses also take into account the effects of currency derivatives, which offset the effects of change in exchange rates. If, at the end of the accounting period, the USD had been 10% weaker/stronger than the Russian rouble (all other factors being equal), profit before taxes would have been EUR 0.4 million higher/lower due to the Russian subsidiaries USD-denominated accounts payable (EUR 0.3 million). The effect on equity would have been EUR 0.0 million (EUR 0.0 million). Liquidity and refinancing risk Atria Plc s Treasury raises the majority of the Group s interest-bearing capital. Liquidity and refinancing risks are managed through a balanced loan maturity distribution and by having sufficient committed credit limits with sufficiently long periods of validity at hand, by using many financial institutions and instruments to raise finance and by keeping a sufficient amount of cash funds. Atria also uses commercial papers actively to manage liquidity. There was EUR million (EUR million) in unutilised committed credit limits at the end of the year, and EUR million of the EUR 200 million commercial paper programme had not been used at the end of the accounting period (EUR million). The average maturity of the Group s loans and committed credit limits was 3 years 5 months (2 years 11 months). The main covenant used in loan agreements is a minimum equity ratio covenant of 30%. The Group s equity ratio has been approx. 40% for many years, and the Group will continue to ensure an equity ratio higher than the level required by the covenant. According to the terms of loan agreements, the implementation of covenants is reported to financiers either quarterly or semi-annually. 86
91 According to the Group management s view, there was no significant liquidity accumulation in financial assets or financial sources. The table below shows the maturity analysis for financial liabilities and derivative instruments (undiscounted figures). The capital levies and revenue of derivative liabilities and assets are related to forward exchange agreements, and interest payments to interest rate swaps. Maturity analysis for financial obligations EUR 1,000 Maturity, 31 Dec 2010 < 1 year 1-5 years > 5 years Total Loans Instalments 127, ,652 68, ,937 Interest payments 8,102 22,186 6,182 36,470 Derivative liabilities and assets Capital payments 117, ,866 Capital income -119, ,776 Interest payments 1,523 7,675 9,198 Interest income -2,110-6,872-8,982 Other liabilities Instalments 14, ,000 16,143 Interest payments Trade payables Payments 111, ,331 Accrued liabilities Payments 43, ,726 Total Total payments 423, ,683 76, ,922 Total income -121,886-6, ,758 Net payments 301, ,811 76, ,164 Notes to the Financial Statements EUR 1,000 Maturity, 31 Dec 2009 < 1 year 1-5 years > 5 years Total Loans Instalments 106, ,709 20, ,797 Interest payments 8,209 23,183 2,153 33,545 Derivative liabilities and assets Capital payments 112, ,224 Capital income -109, ,696 Interest payments 1,046 3,661 4,707 Interest income ,449-1,863 Other liabilities Instalments 17,990 3,000 20,990 Interest payments Trade payables Payments 96,688 96,688 Accrued liabilities Payments 49, ,404 Total Total payments 392, ,723 25, ,704 Total income -110,110-1, ,559 Net payments 282, ,274 25, ,145 Credit risk Credit risk is managed at Group level in accordance with the Group s risk management policy approved by the Board of Directors. The credit risk related to financing, i.e., the counterparty risk, is managed by selecting only well-established highly rated counterparties with good credit ratings as counterparties. The Group s liquid assets are only invested with counterparties that meet the above-mentioned criteria. This is also the procedure when entering into financing and derivative agreements. The credit risk related to derivatives is also decreased by the fact that all payments made in relation to derivatives are net payments. The credit risk of the Group s operative business is related to our customers, of which the main ones are large retail chains. Part of the Group s trade receivables are related to feed and animal trading in primary production. The credit risk related to this is higher, but also more dispersed. The Group s trade receivables are dispersed over several market areas and many customers. However, the share of retail chains in trade receivables is central in all business areas. Credit loss risk is managed with securities, such as credit insurances and bank guarantees as well as with advance invoicing. Each business area has been assigned a separate credit policy that takes the special features of the market area into account. Credit risk is examined and monitored on a case-by-case basis for major customers and customer groups. The breakdown at trade receivables is illustrated in Note 20, page
92 Notes to the Financial Statements Commodity risk The Group is exposed to commodity price risks, the most significant of which are related to meat raw material and electricity. Fluctuations in the price of meat raw material affect profitability in the short term, but efforts are made to pass on the price increases to sales prices as soon as possible. Fluctuations in the price of electricity are hedged with forward electricity agreements according to the Group s electricity procurement policy. The hedging levels in the policy are shown in the table below. Period hedging level minimum hedging level maximum 1 10 months 67% 100% months 33% 67% months 0% 33% Hedge accounting in accordance with IFRS is applied to electricity hedges. The effective portion of changes in the value of derivatives has been recognised under equity, and the ineffective portion, which amounts to EUR 0.2 million (EUR -0.2 million) has been recognised in the income statement. If the market price of electricity derivatives changed by +/-10%, the effect on equity would be EUR +/-1.0 million (EUR +/-1.0 million). Capital structure management In capital structure management, the Group aims to ensure normal operating conditions under all circumstances and to maintain an optimal capital structure in terms of capital costs. The Group monitors the development of its capital structure primarily through the equity ratio, for which the Group has set a target level of 40%. Based on this equity ratio, the company estimates that the availability and total cost of new capital are optimal. Equity ratio is affected by balance sheet total and equity. The company is able to affect the balance sheet total and, through that, capital structure by managing working capital, adjusting the amount of investments as well as by selling business operations or assets. Correspondingly, the company can affect the amount of its own equity through dividend distribution and share issues. In the assessment of investments and divestments, the Group uses the Group s weighted average cost of capital (WACC) as reference. This way, the Group tries to ensure that its assets generate at least an amount corresponding to the average cost of its capital. Equity ratio (target 40%) Realised 31 Dec Dec % 39.7% Values for financial assets and liabilities by category EUR 1,000 Financial assets and liabilities recognised at fair value through profit or loss Derivative instruments under hedge accounting Loans and other receivables Financial assets available for sale Financial liabilities Balance sheet value in total 2010 balance sheet item Non-current assets Trade receivables 11,309 11,309 Other financial assets 1,586 1,586 Loan receivables 6,597 6,597 Other receivables Accrued credits and deferred charges *) Derivative instruments 1,321 1,321 Current assets Trade receivables 166, ,088 Loan receivables 3,143 3,143 Other receivables *) 6,595 6,595 Accrued credits and deferred charges *) 8,624 8,624 Derivative instruments 299 1,871 2,170 Cash and cash equivalents 18,530 18,530 Total financial assets 299 3, ,825 1, ,902 Non-current liabilities Interest-bearing financial liabilities 300, ,476 Accrued liabilities **) Derivative instruments Current liabilities Interest-bearing financial liabilities 125, ,561 Trade payables 111, ,331 Other liabilities **) 8,996 8,996 Accrued liabilities **) 43,693 43,693 Derivative instruments 1, ,958 Total financial liabilities 1, , ,815 88
93 EUR 1,000 Financial assets and liabilities recognised at fair value through profit or loss Derivative instruments under hedge accounting Loans and other receivables Financial assets available for sale Financial liabilities Balance sheet value in total 2009 balance sheet item Non-current assets Trade receivables 9,428 9,428 Other financial assets 2,307 2,307 Loan receivables 6,406 6,406 Other receivables 4,538 4,538 Current assets Trade receivables 163, ,754 Loan receivables 4,109 4,109 Other receivables *) 8,765 8,765 Accrued credits and deferred charges *) 8,950 8,950 Cash and cash equivalents 35,300 35,300 Total financial assets 241,250 2, ,557 Notes to the Financial Statements Non-current liabilities Interest-bearing financial liabilities 317, ,016 Derivative instruments Current liabilities Interest-bearing financial liabilities 105, ,972 Trade payables 96,688 96,688 Other liabilities **) 26,150 26,150 Accrued liabilities **) 49,404 49,404 Derivative instruments 1,913 1,748 3,661 Total financial liabilities 1,913 2, , ,816 The fair values of financial assets and liabilities do not deviate significantly from their balance sheet values. *) Do not include VAT or income tax assets. **) Do not include VAT or income tax liabilities. Fair value hierarchy: EUR 1,000 Balance sheet item 31 Dec 2010 Level 1 Level 2 Level 3 Non-current assets Financial assets available for sale - Listed shares Unlisted shares 1,405 1,405 Derivative instruments 1,321 1,321 Current assets Derivative instruments 2,170 2,170 Total 5, ,491 1,405 Non-current liabilities Derivative instruments Current liabilities Derivative instruments 1,958 1,958 Total 2, ,
94 Notes to the Financial Statements Balance sheet item 31 Dec 2009 Level 1 Level 2 Level 3 Non-current assets Financial assets available for sale - Listed shares Unlisted shares 2,143 2,143 Total 2, ,143 Non-current liabilities Derivative instruments Current liabilities Derivative instruments 3,661 3,661 Total 4, ,586 0 Level 1: Prices listed on active markets for identical assets and liabilities The fair value of financial instruments traded in active markets is based on market prices listed on the closing date. Markets are regarded as active if listed prices are readily and regularly available from the stock exchange, broker, industry group, price information service or surveillance authority, and these prices represent actual and regularly occurring market events between independent parties. The current purchase price is used as the listed market price for financial assets. Level 2: Fair values can be determined either directly (i.e., as prices) or indirectly (i.e., derived from prices) A fair value is established through valuation techniques for financial instruments that are not traded in active markets (such as OTC derivatives). These valuation techniques make maximum use of observable market information, when available, and rely as little as possible on company-specific assessments. If all significant input required for determining the fair value of the instrument is observable, the instrument is on level 2. Level 3: Fair values are not based on verifiable market prices If one or more significant piece of input information is not based on observable market information, the instrument is classified on level 3. Assessments by external parties are used for measurement of financial instruments and, if such assessments are not available, the company s own calculations/assessments are used. Changes in financial instruments belonging to level 3: Unlisted shares Opening balance 1 Jan 2,143 1,987 Purchases Decreases -762 Closing balance 31 Dec 1,405 2,143 Derivative instruments Fair values of derivative financial instruments: EUR 1,000 Derivative asssets 31 Dec 2010 Derivative liabilities 31 Dec 2010 Net fair value 31 Dec 2010 Net fair value 31 Dec 2009 Forward exchange agreements Cash flow hedges under IAS 39 hedge accounting Net investment hedges under IAS 39 hedge accounting -434 Other hedges 226 1,735-1,509-1,913 Interest rate swaps, due in more than 1 year Cash flow hedges under IAS 39 hedge accounting 1, Electricity derivatives Cash flow hedges under IAS 39 hedge accounting 2,135 2,135-2,053 Other hedges Total 3,491 2, ,586 90
95 Nominal values of derivative financial instruments: EUR 1, Dec Dec 2009 Forward exchange agreements Cash flow hedges under IAS 39 hedge accounting 13,370 17,982 Net investment hedges under IAS 39 hedge accounting 15,358 Other hedges 107,692 78,163 Interest rate swaps Cash flow hedges under IAS 39 hedge accounting 81,269 40,000 Notes to the Financial Statements Electricity derivatives Cash flow hedges under IAS 39 hedge accounting 7,982 12,375 Other hedges 200 Total 210, , Other leases, EUR 1,000 Group as lessee Minimum lease payments based on non-cancellable leases Within one year Within more than one year and a maximum of five years After five years Total Rents recognised as cost The terms and conditions of the leases vary. The Group companies rent properties, machinery, equipment and cars. 31. Contingent liabilities, EUR 1,000 Debts with mortgages or other collateral given as security Loans from financial institutions Pension fund loans Total Mortgages and other securities given as comprehensive security Real estate mortgages Corporate mortgages Total Guarantee engagements not included in the balance sheet Guarantees
96 Notes to the Financial Statements 32. Related party transactions, EUR 1,000 Group companies by business area Domestic Ownership interest (%) Share of votes (%) Atria Finland: Ab Botnia-Food Oy Finland A-Lihatukkurin Oy Finland A-Logistics Ltd Finland A-Pekoni Nurmo Oy Finland A-Pihvi Kauhajoki Oy Finland A-Pihvi Kuopio Oy Finland A-Rehu Oy Finland A-Sikateurastamo Oy Finland Atria Concept Oy Finland Atria Plc Finland Atria Finland Ltd Finland Atria-Chick Oy Finland Atria-Lihavalmiste Oy Finland Atria-Meetvursti Oy Finland Atria-Tekniikka Oy Finland Atria-Tuoreliha Oy Finland Atria-Valmisruoka Oy Finland A-Farmers Ltd Finland F-Logistiikka Oy Finland Itikka-Lihapolar Oy Finland Kiinteistö Oy Tievapolku 3 Finland Liha ja Säilyke Oy Finland Rokes Oy Finland Suomen Kalkkuna Oy Finland Atria Scandinavia: 3-Stjernet A/S Denmark Atria Concept AB Sweden Atria Concept SP Z.o.o Poland Atria Denmark A/S Denmark Atria Foodservice AB Sweden Atria Lätta Måltider AB Sweden Atria Lätta Måltider Halmstad AB Sweden Atria Lätta Måltider Holding AB Sweden Atria Lätta Måltider Östersund AB Sweden Atria Retail AB Sweden Atria Scandinavia AB Sweden Falbygdens Ostnederlag AB Sweden Gourmet Service i Årsta AB Sweden KB Joddlaren Sweden Nordic Fastfood AB Sweden Nordic Fastfood Etablerings AB Sweden Ridderheims AS Norway Ridderheims Delikatesser AB Sweden Atria Russia: Atria-Invest Oy Finland OOO Atria Group Russia OOO CampoFerma Russia OOO CampoFoods Moscow Russia OOO MPZ CampoMos Russia OOO Pit-Product Russia Atria Baltic: Atria Eesti AS Estonia Atria Farmid OÜ Estonia OÜ Atria Estonia OÜ Puidukaubandus Estonia UAB Vilniaus Mesa Lithuania
97 Group joint ventures and associates and other related parties Domestic Ownership interest (%) Share of votes (%) Group joint ventures: Best-In Oy Finland Honkajoki Oy Finland Länsi-Kalkkuna Oy Finland Group and associates: OOO Dan-Invest Russia Findest Protein Oy Finland Finnpig Oy Finland Foodwest Oy Finland KOY Itikanmäen Teollisuustalo Finland OÜ LKT Invest Estonia Finnish Meat Research Institute, LTK co-operative Finland Tuoretie Oy Finland Notes to the Financial Statements Other related parties: Members of the Board of Directors and Supervisory Board Itikka Co-operative Group Lihakunta Pohjanmaan Liha Co-operative Group The following transactions were completed with related parties: Sale of goods Joint ventures/associates Other related parties 3,913 4,074 Total 4,572 4,801 Sale of services Associates Other related parties Total Rental income Joint ventures/associates Other related parties 35 Total Purchase of goods Joint ventures/associates 15,467 19,565 Other related parties 7,040 4,642 Total 22,507 24,207 Purchase of services Joint ventures/associates 42,829 43,382 Rental costs Other related parties 3,460 2,373 Trade receivables Joint ventures/associates Other related parties Total 587 1,011 Trade payables Joint ventures/associates 4,022 4,017 93
98 Notes to the Financial Statements Receivables from related parties Other related parties (receivables from owners) 1,081 1,813 Debts to related parties Other related parties (debts to owners) 5,921 4,232 The sale of goods and services to related parties is based on the Group's valid price lists. The majority of services purchased were the logistics services of Tuoretie Oy. Debts to related parties are loans that can be called in immediately or as agreed; their interest rate is tied to the 3-month or 6-month Euribor rate. Management employee benefits Salaries and other short-term employee benefits 2,590 2,292 Share-based payments 41 Pensions Total 3,035 2,651 The retirement age for the President and CEO is 62 years. However, the President and CEO has the right to retire at the age of 60. The amount of pension is based on the President and CEO s annual income during employment at Atria Group. The pension group benefits for the management have been arranged for the members of Atria Group Management Team who are within the scope of Finnish social security. For the members of the Management Team, the retirement age of the group pension insurance is 63. The pension plan is contributiondefined, and the annual payment is based on the monthly salary (monetary salary and fringe benefits) of the insured. Equivalent pension benefits have been separately arranged for the members of the Management Team who are not within the scope of Finnish social security. Management salaries, benefits and other employee benefits CEO, Member of the Board Tikkakoski Matti Deputy CEO Juha Gröhn Members of the Board of Directors Selin Martti, Chairman Komulainen Timo, Deputy Chairman Heikkilä Tuomo Kaarto Esa, member since July Lillandt Runar, member until June Maisa Romanainen, member since July Sivula Harri, member since July Tikkakoski Matti, CEO Yliluoma Ilkka, member until June Members of the Supervisory Board Pirkola Ari, Chairman Paavola Seppo, Deputy Chairman since July Other members of the Supervisory Board, total
99 33. Events occurring after the closing date In January 2011, Atria announced its decision to invest approximately EUR 26 million in building and renovating the Kauhajoki bovine slaughterhouse and cutting plant. New production facilities will be built in Kauhajoki, and the existing production facilities will be renovated and automated using the latest production technology. Atria will also buy the shares of Kauhajoen Teurastamokiinteistöt Oy from Itikka Co-operative. The purchase price is approximately EUR 7 million. At the same time, the company launched an efficiency improvement programme to increase the efficiency of bovine slaughtering and cutting operations and bring down the excess capacity in slaughtering. Bovine slaughtering and cutting at the Kuopio facility will be transferred to the Kauhajoki slaughterhouse by the end of Carrying out the efficiency improvement programme means the reduction of approximately 120 man-years of work in Kuopio by the end of The annual cost savings from the efficiency improvement programme are estimated at EUR 6 million. The decision did not affect the earnings for the accounting period. In this context Atria also announced the conclusion of a co-operation agreement with Saarioinen Oy on the slaughtering of cattle reared in Eastern Finland at Saarioinen s Jyväskylä slaughterhouse. Notes to the Financial Statements Mika Ala-Fossi was appointed Managing Director of Atria Finland and member of the management team on 1 February In February 2011, Atria Scandinavia announced a plan for an investment and efficiency improvement programme aimed at streamlining and automating the black pudding production process. According to plan Atria would invest approximately EUR 2.2 million in new production equipment for the Tranås plant. The production of black pudding will be transferred from the Saltsjö-Boo plant in Stockholm to Tranås. Significant synergy benefits will be achieved from moving the production to Tranås. The efficiency improvement programme is expected to generate annual cost savings of approximately one million euros. Matti Tikkakoski resigned as President and CEO of Atria Plc on 4 March He also resigned from the Board of Directors. The Board of Directors started the recruitment process to appoint a new CEO. In the meantime the CEO s duties are performed by Juha Gröhn, Managing Director of Atria Scandinavia and Deputy CEO of Atria Plc. 95
100 Parent Company Financial Statements (FAS) INCOME STATEMENT, EUR 1,000 BALANCE SHEET, EUR 1,000 Note 1 Jan 31 Dec Jan 31 Dec 2009 A s s e t s Note 31 Dec Dec 2009 FIXED ASSETS NET SALES ,641 39,609 Other operating income 2.2 2,961 3,002 Personnel expenses 2.3-2,518-2,624 Depreciation and impairment 2.4 Planned depreciation -26,485-27,097 Other operating expenses 2.5-6,528-5,149 EBIT 20,071 7,741 Financial income and expenses 2.6 4,132 3,907 PROFIT BEFORE EXTRAORDINARY ITEMS 24,203 11,648 Extraordinary items 2.7-1,422-2,550 PROFIT BEFORE APPROPRIA- TIONS AND TAXES 22,781 9,098 Intangible assets 3.1 Intangible rights Other long-term expenditure 4,392 4,164 Intangible assets, total 4,453 4,260 Tangible assets , ,087 Investments 3.2 Holdings in Group companies 245, ,900 Holdings in joint ventures and associates 3,624 2,805 Other shares and interests 1,330 2,066 Investments, total 250, ,771 TOTAL FIXED ASSETS 498, ,118 CURRENT ASSETS Long-term receivables 3.3 5,695 94,122 Short-term receivables , ,167 Cash in hand and at bank 13,747 23,307 TOTAL CURRENT ASSETS 404, ,596 T o t a l a s s e t s 903, ,714 Appropriations ,712 3,000 Income taxes NET PROFIT FOR THE ACCOUNTING PERIOD 10,985 12,016 L i a b i l i t i e s Note 31 Dec Dec 2009 SHAREHOLDERS' EQUITY 3.4 Share capital 48,055 48,055 Share premium 138, ,502 Treasury shares -1,271-1,308 Invested unrestricted equity fund 110, ,228 Retained earnings 74,398 69,420 Profit for the period 10,985 12,016 TOTAL SHAREHOLDERS' EQUITY 380, ,913 ACCRUED APPROPRIATIONS 3.5 Depreciation difference 61,152 49,440 LIABILITIES Non-current liabilities , ,953 Current liabilities , ,408 TOTAL LIABILITIES 461, ,361 T o t a l l i a b i l i t i e s 903, ,714 96
101 CASH FLOW STATEMENT, EUR 1,000 1 Jan 31 Dec Jan 31 Dec 2009 CASH FLOW FROM OPERATING ACTIVITIES Sales income 53,892 38,017 Other business revenue 2,961 2,956 Payments on operating expenses -8,017-9,591 Cash flow from operating activities before financial items and taxes 48,835 31,382 Financial income and expenses, net 4,518 11,856 Tax paid 823-5,794 Cash flow from operating activities 54,176 37,444 CASH FLOW FROM INVESTMENTS Investments in tangible and intangible assets and in investments -43,071-49,274 Change in Group receivables -47,221 1,222 Cash flow from investments -90,292-48,052 Parent Company Financial Statements (FAS) CASH FLOW FROM FINANCING Loan payments 12,418-16,066 Change in Group liabilities 22,561 57,961 Dividends paid -7,039-5,654 Treasury shares Other income 0 47 Group contribution -1,422-2,550 Cash flow from financing 26,555 32,932 CASH FLOW FROM OPERATING ACTIVITIES 54,176 37,444 CASH FLOW FROM INVESTMENTS -90,292-48,052 CASH FLOW FROM FINANCING 26,555 32,932 TOTAL -9,560 22,324 Change in cash and cash equivalents Cash and cash equivalents 1 Jan -23, Cash and cash equivalents 31 Dec 13,747 23,307 Change -9,560 22,324 97
102 Notes to the Parent Company Financial Statements (FAS) 1. PRINCIPLES APPLIED IN PREPARING THE FINANCIAL STATEMENTS 2. NOTES TO THE INCOME STATEMENT General principles applied in preparing the financial statements Atria Plc s financial statements have been drawn up in accordance with Finland's Accounting Act and the other rules and regulations pertaining to the compilation of financial statements (FAS) NET SALES, EUR 1,000 1 Jan -31 Dec Jan - 31 Dec ,641 39,609 Information related to the Group Atria Plc is the parent company of Atria Group, and its domicile is in Kuopio, Finland. Copies of Atria Plc s financial statements are available from the company s head office at Atriantie 1, Nurmo; postal address; P.O. Box 900, FI ATRIA, Finland. Valuation principles In the balance sheet, tangible and intangible assets are entered at their direct acquisition cost less planned depreciation and value adjustments. Depreciation is implemented on a straight-line basis over the service life of the assets. Contributions received for the acquisition of tangible assets are entered as a decrease in acquisition costs. These contributions are not significant. Depreciation periods Buildings Nurmo 40 years other locations 25 years Machinery and equipment Nurmo 10 years other locations 7 years Computer software 5 years Other long-term items 10 years The publicly listed companies shares in the company s fixed assets investments have been measured at acquisition cost. The book value of the shares on 31 December 2010 was EUR 29, and their fair value was EUR 110, In the balance sheet, financial instruments are measured at acquisition cost less value adjustments. Items expressed in foreign currencies Items expressed in foreign currencies have been converted into euro at the exchange rate quoted by the European Central Bank. The exchange differences of the realised currency-denominated loans are presented under financial items. Derivative financial instruments The company enters into derivative agreements in order to control exchange differences, interest rate levels and electricity prices. The derivatives used are forward exchange agreements, interest rate swaps and electricity derivatives. The derivatives hedge accounting is not applied to are measured at fair value. All profits and losses resulting from fair value recognition are presented under the financial items of the income statement. The positive fair value of the derivatives used for hedging is presented under receivables and the negative fair value under liabilities. The derivatives hedge accounting is applied to are recognised in the proper item of the income statement on their expiration date. The fair values of all derivatives are presented in Note 4.3. The company s rental income is presented as net sales because it corresponds with the present nature of the company s operations OTHER OPERATING INCOME, EUR 1,000 Service charges to group companies 2,961 2,904 Others 0 98 Total 2,961 3, PERSONNEL EXPENSES, EUR 1,000 Average number of employees Clerical staff in Finland 10 7 Personnel expenses Salaries: CEO, Executive Vice President and Deputy CEO and members of the Board of Directors Members of the Supervisory Board Other salaries 1,055 1,184 Total 1,972 1,968 Pension costs Other staff-related expenses Total Personnel expenses total 2,518 2,624 Pension commitments of members of the Board of Directors and CEO: The company's statutory pensions are defined contribution plans and have been arranged through an insurance company. The company does not have pension commitments for the CEO and the members of the Board of Directors and the Supervisory Board DEPRECIATION AND IMPAIRMENTS, EUR 1,000 Depreciations of tangible and intangible assets 26,485 27,097 Depreciation specification per balance sheet item included in Section OTHER OPERATING EXPENSES, EUR 1,000 Other operating expenses 6,528 5,149 Including administration, marketing, energy, cleaning, operational and other costs as well as fees paid to auditors. Fees paid to auditors / PricewaterhouseCoopers Oy Auditing fees Tax consulting 8 0 Other remunerations Total The presented figures are based on invoicing. 98
103 2.6. FINANCIAL INCOME AND EXPENSES, EUR 1,000 Return on long-term investments Dividend yield: From group companies 10,707 11,806 From other companies Total 10,790 11,941 Other interest and financial income: From group companies 6,615 9,639 From other companies 26,164 12,651 Total 32,779 22,290 Interest expenses and other financial expenses: To group companies To other companies 38,882 30,317 Total 39,437 30,324 Financial income and expenses total 4,132 3,907 Interest expenses and other financial expenses include exchange rate losses (net) 2,018 4, EXTRAORDINARY ITEMS, EUR 1,000 Group contributions paid 1,422 2, APPROPRIATIONS, EUR 1,000 Difference between planned depreciation and depreciation implemented in taxation -11,712 3, INCOME TAXES, EUR 1,000 Income taxes on operations NOTES TO THE BALANCE SHEET 31 Dec Dec INTANGIBLE AND TANGIBLE ASSETS, EUR 1,000 Intangible rights Acquisition cost 1 Jan 1,448 1,444 Increases 7 4 Decreases 0 0 Acquisition cost 31 Dec 1,455 1,448 Accumulated depreciation 1 Jan -1,352-1,304 Depreciation on decreases 0 0 Depreciation for the accounting period Accumulated depreciation 31 Dec -1,394-1,352 Book value 31 Dec Other long-term expenditure Acquisition cost 1 Jan 14,472 13,269 Increases 1,914 1,203 Decreases 0 0 Acquisition cost 31 Dec 16,386 14,472 Accumulated depreciation 1 Jan -10,309-8,453 Depreciation on decreases 0 0 Depreciation for the accounting period -1,685-1,856 Accumulated depreciation 31 Dec -11,993-10,309 Book value 31 Dec 4,392 4,164 Intangible assets, total 4,453 4,260 Tangible assets: Land and water Acquisition cost 1 Jan 1,469 2,182 Increases Acquisition cost 31 Dec 1,469 1,469 Buildings and structures Acquisition cost 1 Jan 277, ,383 Increases 1,614 6,255 Decreases 0 0 Acquisition cost 31 Dec 279, ,638 Accumulated depreciation 1 Jan -116, ,510 Depreciation on decreases 0 0 Depreciation for the accounting period -6,834-6,722 Accumulated depreciation 31 Dec -123, ,232 Book value 31 Dec 156, ,406 Machinery and equipment Acquisition cost 1 Jan 271, ,511 Increases 3,748 6,557 Decreases 0 0 Acquisition cost 31 Dec 274, ,068 Accumulated depreciation 1 Jan -181, ,927 Depreciation on decreases 0 0 Depreciation for the accounting period -17,777-18,357 Accumulated depreciation 31 Dec -199, ,284 Book value 31 Dec 75,755 89,784 Notes to the Parent Company Financial Statements (FAS) Other tangible assets Acquisition cost 1 Jan 2,099 1,295 Increases Decreases Acquisition cost 31 Dec 2,215 2,099 Accumulated depreciation 1 Jan Depreciation on decreases
104 Notes to the Parent Company Financial Statements (FAS) 31 Dec Dec 2009 Depreciation for the accounting period Accumulated depreciation 31 Dec Book value 31 Dec 1,325 1,355 Advance payments and acquisitions in progress Acquisition cost 1 Jan 2,073 2,878 Changes +/- 6, Acquisition cost 31 Dec 9,034 2,073 Tangible assets total 243, ,087 Non-depreciated acquisition cost of machinery and equipment 75,755 89,784 The share of items other than production machinery and equipment is not significant in amount. The acquisition costs of completely depreciated and scrapped items are presented as decreases INVESTMENTS, EUR 1,000 Group companies Parent holding, % 2010 Parent holding, % 2009 Ab Botnia-Food Oy, Seinäjoki A-Farmers Ltd, Seinäjoki Atria Concept Oy, Seinäjoki Atria Finland Ltd, Kuopio Atria-Invest Oy, Seinäjoki Itikka-Lihapolar Oy, Seinäjoki Kiinteistö Oy Tievapolku 3, Helsinki Liha ja Säilyke Oy, Forssa Atria Scandinavia AB, Sköllersta, Sweden Rokes Oy, Forssa Suomen Kalkkuna Oy, Seinäjoki Atria Eesti AS, Valga, Estonia OU Atria, Tallinn, Estonia UAB Vilniaus Mesa, Vilna, Lithuania Joint ventures and associates Best-In Oy, Kuopio Foodwest Oy, Seinäjoki Honkajoki Oy, Honkajoki Finnish Meat Research Institute, LTK co-operative, Hämeenlinna Länsi-Kalkkuna Oy, Säkylä Tuoretie Oy, Seinäjoki RECEIVABLES, EUR 1,000 Long-term receivables 1 Jan 31 Dec Jan 31 Dec 2009 Receivables from group companies: Loan receivables 5,695 94,122 Short-term receivables Loan receivables Trade receivables Other receivables 505 1,895 Accrued credits and deferred charges 5,771 6,685 Receivables from group companies: Trade receivables 820 2,030 Other receivables 377, ,776 Accrued credits and deferred charges Total short-term receivables 385, ,167 Material items included in the accrued credits and deferred charges: - amortised interests amortised taxes 5,677 6,585 - other Total 6,059 6, SHAREHOLDERS' EQUITY, EUR 1,000 Share capital 1 Jan 48,055 48,055 Share capital 31 Dec 48,055 48,055 Share premium 1 Jan 138, ,502 Share premium 31 Dec 138, ,502 Restricted equity total 186, ,557 Treasury shares 1 Jan -1, Acquisition of own shares Treasury shares 31 Dec -1,271-1,308 Invested unrestricted equity fund 1 Jan 110, ,228 Invested unrestricted equity fund 31 Dec 110, ,228 Retained earnings 1 Jan 81,437 75,074 Dividend distribution -7,039-5,654 Retained earnings 31 Dec 74,398 69,420 Profit for the period 10,985 12,016 Retained earnings 31 Dec 85,383 81,437 Unrestricted equity total 194, ,356 Equity total 380, ,
105 Treasury shares transferred during the accounting period Date Amount Consideration 21 May ,280 EUR / share At the beginning of the period, the number of treasury shares was 113,712, of which 3,280 shares were transferred. At the end of the year, the company held a total of 110,432 treasury shares. The ownership share of the shares held is 0.391% of equity and 0.099% of the voting rights. 31 Dec Dec 2009 Calculation of funds appropriate for distribution as dividends Retained earnings 74,398 69,420 Profit for the period 10,985 12,016 Treasury shares -1,271-1,308 Total 84,111 80,129 The breakdown of the share capital is as follows: Amount EUR Amount EUR A series shares (1 vote/share) 19,063,747 32,408 19,063,747 32,408 KII series shares (10 votes/share) 9,203,981 15,647 9,203,981 15,647 Total 28,267,728 48,055 28,267,728 48, CURRENT LIABILITIES, EUR 1, Dec Dec 2009 Loans from financial institutions 107,646 97,038 Pension fund loans 3,370 0 Trade payables 465 1,600 Other payables 4, Accruals and deferred income 3,749 3,500 Liabilities to group companies Other long-term liabilities 2,788 0 Trade payables Other payables 55,543 58,254 Accruals and deferred income 1,594 3 Total current liabilities 179, ,408 Material items included in accruals and deferred income: - accruals of salaries and social security payments personnel fund interest accruals 1,701 1,496 - valuation of forward contracts 1,707 1,498 - other 1, Total 5,342 3,503 Notes to the Parent Company Financial Statements (FAS) 3.5. ACCRUED APPROPRIATIONS, EUR 1, Dec Dec 2009 Depreciation difference 61,152 49, NON-CURRENT LIABILITIES, EUR 1,000 Bonds 80,000 80,000 Loans from financial institutions 151, ,367 Pension fund loans 29,316 28,586 Total 260, ,952 Liabilities to group companies Other long-term liabilities 21,063 0 Total non-current liabilities 281, ,952 Loans maturing later than in five years Loans from financial institutions 2,500 0 Pension fund loans 1,538 2,857 Other long-term liabilities 9,913 0 Total 13,950 2,857 Atria Plc's bond loan issued in 2006 amounting to EUR 40 million matures in 2013 (interest rate 1.999%). Atria Plc's bond loan issued in 2007 amounting to EUR 40 million matures in 2014 (interest rate 3.28%). 101
106 Notes to the Parent Company Financial Statements (FAS) 4. OTHER NOTES 31 Dec Dec DERIVATIVE FINANCIAL INSTRUMENTS, EUR 1, SECURITIES GIVEN, CONTINGENT LIABILITIES AND OTHER LIABILITIES, EUR 1,000 Fair values of derivative financial instruments Derivative assets 31 Dec 2010 Derivative assets 31 Dec 2009 Contingent liabilities and other liabilities not included in the balance sheet Guarantees For group companies 77,599 67,848 Other leases Minimum rents paid based on other leases Within one year 869 1,629 Within more than one year and a maximum of five years 853 1,150 After more than five years 3,570 3,634 Total 5,292 6, VAT LIABILITIES, EUR 1,000 The company has made the property investments referred to in the Value Added Tax Act. The remaining verification liability of these investments was assessed for each verification period on 31 December The company is obliged to verify reductions in VAT on property investments if the taxable use of the properties decreases during the verification period. Forward exchange agreements: Other hedges 26 Interest rate swaps, due in more than 1 year: Cash flow hedges under hedge accounting 1,030 Total 1,056 Fair values of derivative financial instruments Derivative liabilities 31 Dec 2010 Derivative liabilities 31 Dec 2009 Forward exchange agreements: Net investment hedges under hedge accounting 434 Other hedges 1,733 1,498 Interest rate swaps, due in more than 1 year: Cash flow hedges under hedge accounting Electricity derivatives: Cash flow hedges under hedge accounting 2,053 Total 2,499 4,000 Year of completion of the investment Remaining amount of verification liability , ,011 1, ,101 1, Total 3,360 4,
107 103 Notes to the Parent Company Financial Statements (FAS)
108 Signatures and Auditor s Report Signatures to the financial statements and annual report Auditor's note Seinäjoki, 17 March 2011 Martti Selin Chairman Tuomo Heikkilä Esa Kaarto Timo Komulainen Maisa Romanainen Harri Sivula A report on the audit performed has been issued today. Seinäjoki 17 March 2011 PricewaterhouseCoopers Oy Authorised Public Accountants Juha Wahlroos Authorised Public Accountant Juha Gröhn President and CEO 104
109 Auditor's Report (translation from the Finnish original) To the Annual General Meeting of Atria Corporation We have audited the accounting records, the financial statements, the report of the Board of Directors and the administration of Atria Corporation for the year ended 31 December, The financial statements comprise the consolidated statement of financial position, income statement, statement of comprehensive income, statement of changes in equity and statement of cash flows, and notes to the consolidated financial statements, as well as the parent company s balance sheet, income statement, cash flow statement and notes to the financial statements. Responsibility of the Board of Directors and the Managing Director The Board of Directors and the Managing Director are responsible for the preparation of consolidated financial statements that give a true and fair view in accordance with International Financial Reporting Standards (IFRS) as adopted by the EU, as well as for the preparation of financial statements and the report of the Board of Directors that give a true and fair view in accordance with the laws and regulations governing the preparation of the financial statements and the report of the Board of Directors in Finland. The Board of Directors is responsible for the appropriate arrangement of the control of the company s accounts and finances, and the Managing Director shall see to it that the accounts of the company are in compliance with the law and that its financial affairs have been arranged in a reliable manner. Auditor s Responsibility Our responsibility is to express an opinion on the financial statements, on the consolidated financial statements and on the report of the Board of Directors based on our audit. The Auditing Act requires that we comply with the requirements of professional ethics. We conducted our audit in accordance with good auditing practice in Finland. Good auditing practice requires that we plan and perform the audit to obtain reasonable assurance about whether the financial statements and the report of the Board of Directors are free from material misstatement, and whether the members of the Supervisory Board and Board of Directors of the parent company as well the Managing Director are guilty of an act or negligence which may result in liability in damages towards the company or whether they have violated the Limited Liability Companies Act or the articles of association of the company. An audit involves performing procedures to obtain audit evidence about the amounts and disclosures in the financial statements and the report of the Board of Directors. The procedures selected depend on the auditor s judgment, including the assessment of the risks of material misstatement, whether due to fraud or error. In making those risk assessments, the auditor considers internal control relevant to the entity s preparation of financial statements and report of the Board of Directors that give a true and fair view in order to design audit procedures that are appropriate in the circumstances, but not for the purpose of expressing an opinion on the effectiveness of the company s internal control. An audit also includes evaluating the appropriateness of accounting policies used and the reasonableness of accounting estimates made by management, as well as evaluating the overall presentation of the financial statements and the report of the Board of Directors. We believe that the audit evidence we have obtained is sufficient and appropriate to provide a basis for our audit opinion. Opinion on the Consolidated Financial Statements In our opinion, the consolidated financial statements give a true and fair view of the financial position, financial performance, and cash flows of the group in accordance with International Financial Reporting Standards (IFRS) as adopted by the EU. Opinion on the Company s Financial Statements and the Report of the Board of Directors In our opinion, the financial statements and the report of the Board of Directors give a true and fair view of both the consolidated and the parent company s financial performance and financial position in accordance with the laws and regulations governing the preparation of the financial statements and the report of the Board of Directors in Finland. The information in the report of the Board of Directors is consistent with the information in the financial statements. Other Opinions We support that the financial statements and the consolidated financial statements should be adopted. The proposal by the Board of Directors regarding the use of the profit shown in the balance sheet is in compliance with the Limited Liability Companies Act. We support that the Members of the Supervisory Board and Board of Directors as well the Managing Director of the parent company should be discharged from liability for the financial period audited by us. Seinäjoki 17 March 2011 PricewaterhouseCoopers Oy Authorised Public Accountants Juha Wahlroos Authorised Public Accountant Signatures and Auditor s report 105
110 Atria s Corporate Governance Code Corporate Governance Principles General Meeting Supervisory Board Board of Directors Duties of the Board of Directors Meeting practices and information flow Composition of the Board of Directors Board committees Nomination Committee Remuneration Committee President and CEO Management Team Rewarding Rewarding of the members of the Supervisory Board Rewarding of the members of the Board of Directors Bonus schemes for the President and CEO and other management Internal control, risk management and internal audit Risk management Internal audit Auditing
111 Corporate Governance Principles Atria Plc ( Atria or the company ) is a Finnish public company, and the responsibilities and obligations of its governing bodies are determined by Finnish law. The parent company, Atria Plc, and its subsidiaries constitute the international Atria Group. The company is domiciled in Kuopio. Responsibility for the administration and operations of Atria Group lies with the governing bodies of the parent, Atria Plc. These are the General Meeting, Supervisory Board, Board of Directors and the President and CEO. Atria s decision-making and corporate governance are in compliance with the Finnish Companies Act, regulations applied to publicly listed companies, Atria Plc s Articles of Association, and NASDAQ OMX Helsinki Ltd s rules and guidelines. Atria follows the Finnish Corporate Governance Code ( Corporate Governance Code ). The full Corporate Governance Code may be viewed at In accordance with the Comply or Explain principle, the company departs from the recommendations of the Code as follows: The company has a Supervisory Board. As an exception to recommendation 8, Atria s Supervisory Board elects the Board of Directors in accordance with the Articles of Association. As an exception to recommendation 10, the term of a Board member is three (3) years in accordance with Atria s Articles of Association. Atria Plc has prepared a review of the corporate governance system in accordance with the recommendation of the Finnish Corporate Governance Code. The review is available on the company s website at General Meeting The General Meeting is Atria Plc s supreme decision-making body. At the General Meeting, shareholders decide on the approval of the financial statements and the use of the profit shown on the balance sheet; discharging of the members of the Board of Directors and of the Supervisory Board, as well as the President and CEO, from liability; the number of members of the Supervisory Board, and their election and remuneration; and the election of one or more auditors and the fees for auditing. The Annual General Meeting is held annually by the end of June on a date designated by the Board of Directors, and the agenda includes matters that are to be handled by the Annual General Meeting in accordance with the Articles of Association and any other proposals. The Atria Annual General Meeting has usually been held in April. In addition, the company may hold an Extraordinary General Meeting, if necessary. The General Meeting is convened by the Board of Directors. It is held in the company s domicile, Kuopio, or in Helsinki. The notice to convene the General Meeting is communicated by publishing the notice on the Company s website and by a stock exchange release at the earliest three (3) months and at the latest three (3) weeks before the General Meeting, however, no later than nine (9) days prior to the record date for the General Meeting. In addition, the Board of Directors may decide to publish the notice, or delivery notification of the notice, in one or more national newspapers determined by the Board, or in some other manner it may decide. To have the right to participate in a General Meeting, a shareholder must register with the company no later than on the day mentioned in the notice of meeting, which can be no earlier than ten (10) days before the meeting. The President and CEO, the Chairman of the Board of Directors and the majority of the Board members shall be present in the General Meeting, and also auditors shall be present in the Annual General Meeting. A first-time candidate nominated to the Supervisory Board shall be present in the General Meeting where a decision on his or her appointment is made, unless there is a weighty reason for his or her absence. Supervisory Board In accordance with Atria Plc s Articles of Association, the company has a Supervisory Board elected by the General Meeting. The Supervisory Board consists of a minimum of 18 and a maximum of 21 members, who are elected for terms of three years. A person aged sixty-five (65) or older cannot be elected to the Supervisory Board. The Supervisory Board elects a Chairman and Vice Chairman from amongst its members for terms of one year. The Supervisory Board meets three times a year on average. The duties of the Supervisory Board are specified in the Finnish Companies Act and Atria Plc s Articles of Association. The key duties of the Supervisory Board are to: Supervise the administration of the company by the Board of Directors and the President and CEO. Elect the members of the Board of Directors and decide which of the members shall act as the Chairman and Vice Chairman of the Board of Directors, and decide on their remuneration. Issue instructions to the Board of Directors on matters that are of far-reaching consequence or important in principle. Submit its statement on the financial statements and auditors report to the Annual General Meeting. Corporate Governance 107
112 Corporate Governance Shareholders of the company representing more than 50% of the votes have expressed their contentment with the current model based on the Supervisory Board because it brings a far-reaching perspective on the company s operations and decision-making. In 2010, the members of Atria Plc s Supervisory Board were the following: Chairman of the Supervisory Board: Ari Pirkola born 1959, Farmer, member since 2008 Vice Chairman of the Supervisory Board: Seppo Paavola born 1962, Farmer, member since 2006 Members: Juha-Matti Alaranta born 1965, Farmer, member since 2000 Juho Anttikoski born 1970, Farmer, member since 2009 Mika Asunmaa born 1970, Farmer, member since 2005 Lassi-Antti Haarala born 1966, Agrologist, Farmer, member since 2002 Juhani Herrala born 1959, Farmer, member since 2002 Henrik Holm born 1966, Farmer, member since 2002 Veli Hyttinen born 1973, Agrologist, Farmer, member since 2010 Pasi Ingalsuo born 1966, Agrologist, Farmer, member since 2004 Juha Kiviniemi born 1972, MSc (Agric.), Farmer, member since 2010 Veli Koivisto born 1952, Farmer, member since 2006 Teuvo Mutanen born 1965, Agricultural Officer, Agricultural Entrepreneur, member since 2007 Mika Niku born 1970, Farmer, member since 2009 Heikki Panula born 1955, MSc (Agric.), Farmer, member since 2005 Pekka Parikka born 1951, Farmer, member since 2008 Juho Tervonen born 1950, Farmer, member since 2001 Tomi Toivanen born 1954, Farmer, member since 2009 Timo Tuhkasaari born 1965, Farmer, member since All members of Atria Plc s Supervisory Board are members of the administrative bodies of the company s principal owners Lihakunta, Itikka Co-operative and Pohjanmaan Liha Co-operative. All members of the Supervisory Board are independent of the company and dependent on the company s principal owners. In 2010, Atria Plc s Supervisory Board met three (3) times, and the average attendance percentage of the members was Board of Directors In accordance with the Articles of Association, Atria s Board of Directors shall have a minimum of five (5) and a maximum of seven (7) members. As an exception to recommendation 8 and in line with the Articles of Association, the Supervisory Board elects the members of the Board of Directors and decides which of the members shall act as the Chairman and Vice Chairman of the Board of Directors and decides on their remuneration. Shareholders of the company representing more than 50% of the votes have expressed their satisfaction with the current practice which is in compliance with the Articles of Association, whereby the members of the Board of Directors are appointed by the Supervisory Board. The Supervisory Board appoints the members of the Board of Directors in its organisation meeting, which is held annually in June. The term of office of a member of Atria s Board of Directors differs from the term of one year specified in recommendation 10. As per the Articles of Association, the term of a member of the Board of Directors is three (3) years. Shareholders representing more than 50% of the votes have stated that the term of three years is appropriate for the longterm development of the company and have not seen the need to shorten the term from that specified in the Articles of Association. Duties of the Board of Directors Atria s Board of Directors shall ensure the appropriate organisation of the company s administration, operations, accounting and supervision of asset management. To this end, the Board of Directors has adopted written rules of procedure concerning the duties of the Board, the matters to be dealt with, meeting practices and the decision-making procedure. According to these rules, the Board of Directors discusses and decides on significant matters related to the company s strategy, investments, organisation and financing. The rules of procedure lay down the following key duties for the Board of Directors: Approve the strategic goals and guidelines for the Group 108
113 and its business units Approve the budgets and business plans for the Group and business units Decide on the investment plan for each calendar year and approve major investments (i.e., investments exceeding one million euros) Approve major M&A and restructuring operations Approve the Group s operating principles for important elements of management and supervision Discuss and adopt interim reports and financial statements Prepare the items to be dealt with at General Meetings and ensure that decisions are implemented Approve the audit plan for internal auditing Appoint the CEO and decide on his or her remuneration and other benefits At the CEO s proposal, approve the hiring of his or her direct subordinates and the principal terms of their employment contracts Approve the organisational structure and the key principles of incentive schemes Monitor and evaluate the CEO s performance Decide on other matters that are important in view of the size of the Group and that are not part of day-to-day operations, such as considerable expansion or contraction of business or other material changes in operations, and the sale and pledging of fixed assets Decide on other matters which, under the Finnish Companies Act, fall within the remit of the Board of Directors Perform the Audit Committee s duties referred to in recommendation 27 of the Corporate Governance Code. The Board of Directors evaluates its operation and working methods regularly through self-evaluation once a year. Meeting practices and information flow The Board of Directors meets at regular intervals about 10 times during the term in accordance with a separate meeting schedule confirmed in advance by the Board, and when necessary. In 2010, the Board of Directors met fifteen (15) times. The average meeting attendance percentage of the members of the Board of Directors was During the meetings of the Board of Directors, the President and CEO gives a review of the financial situation of the Group. The review also covers forecasts, investments and organisational changes, and all other important issues from the point of view of the Group. The following reports are reviewed in each regular meeting: report on the development of the company s business operations for each business area report on measures taken between Board meetings. The agenda of the meeting shall be delivered to the members of the Board of Directors no later than one week before the meeting. The meeting material shall be prepared by the President and CEO and the Secretary of the Board of Directors according to the instructions provided by the Chairman. The meeting material shall be delivered to the members no later than three days before the meeting. The majority of the members of the company s Board of Directors are independent of the company. Harri Sivula and Maisa Romanainen are independent of the company and the principal owners, and Martti Selin, Timo Komulainen, Runar Lillandt, Tuomo Heikkilä and Esa Kaarto are members of the administrative bodies of the company s principal owners Lihakunta and Itikka Co-operative. The members of the Board of Directors are obliged to provide the Board with sufficient information to assess their skills and independency and to notify the Board of any changes to the information. Board committees The Board of Directors may set up committees to handle duties designated by the Board. The Board shall approve the rules of procedure for the committees. The committees of the Board of Directors are the Nomination Committee and the Remuneration Committee, whose members are elected by the Board from amongst its members according to the rules of procedure of the committee. The committees have no autonomous decision-making power. Decisions are made by the Board of Directors based on the committees preparations. The committees shall report on their work to the Board of Directors, which also supervises their operations. Nomination Committee The Nomination Committee consists of the Chairmen of the Supervisory Board and the Board of Directors and one member of the Board of Directors elected by the Board itself. In accordance with recommendation 29 of the Corporate Governance Code, the company s President and CEO or the members of the Board of Directors who belong to the company s other management shall not be elected as members of the Nomination Committee. According to the rules of procedure, the duties of the Nomination Committee are as follows: prepares a proposal to be made to the Supervisory Board Corporate Governance 109

114 Corporate Governance Board of Directors Name Selin Martti, Chairman Komulainen Timo Juhani, Vice Chairman Heikkilä Tuomo Juhani Kaarto Esa Year of birth Education Farm school Agrologist Farm school MSc (Agr.) Main occupation Farmer, meat producer Farmer Farmer Farmer Relevant work experience Metal industry, Sweden Farmer Positions of trust Positions of trust Farmer Member of the Board since June 2009 The most important simultaneous positions of trust Chairman of the Supervisory Board of Itikka Co-operative Chairman of the Board of Directors of Kauhajoen Teurastamokiinteistöt Oy Chairman of the Board of Directors of Itikan maaja metsätilat Oy Chairman of the Board of Directors of Lihakunta Chairman of the Board of Directors of A-Farmers Ltd Chairman of the Board of Directors of A-Rehu Oy Vice Chairman of the Board of Directors of Jukola Co-operative Member of the Board of Directors of Lihakunta Chairman of the Board of Directors of Itikka Co-operative Member of the Board of Directors of A-Farmers Ltd Member of the Board of Directors of Feedmix Oy Member of the Board of Directors of Rehukanava Oy Member of the Board of Directors of Suurusrehu Oy Independency Independent of the company and dependent on the principal owners Independent of the company and dependent on the principal owners Independent of the company and dependent on the principal owners Independent of the company and dependent on the principal owners 110

115 Atria Plc s Board of Directors and the Directors of the Supervisory Board, from left: Maisa Romanainen, Member of the Board Seppo Paavola, Vice Chairman of the Supervisory Board Timo Komulainen, Vice Chairman of the Board of Directors Tuomo Heikkilä, Member of the Board Martti Selin, Chairman of the Board of Directors Harri Sivula, Member of the Board Ari Pirkola, Chairman of the Supervisory Board Esa Kaarto, Member of the Board Matti Tikkakoski, Member of the Board until 3 March 2011 Corporate Governance Lillandt, Karl Runar Romanainen, Maisa Annukka Tikkakoski Matti Olavi, President and CEO until 3 March Middle school, farm school MSc (Econ.) BSc (Econ.), Helsinki School of Economics Farmer, meat producer Farmer Department Store Group Manager of Stockmann plc, Group Vice President Brio Oy, Product Manager and Purchasing Manager, among others Stockmann Plc: - Purchasing Manager, Department Store Manager, Moscow, Russia, Department Store Manager, Tallinn, Estonia, Manager, Foreign Department Stores, Manager, Finnish and Baltic Department Stores, 1 Jan 5 Nov Department Store Group Manager, Group Vice President, from 6 Nov 2008 President and CEO Vice President, Huhtamäki Oy Vice President, Å&R Carton AB Sivula, Harri Juhani MSc (Admin.) President and CEO, Restel Ltd Vice President, Ruokakesko Oy Vice President, Kesko Oy CEO, Onninen Oy 2003, member until 18 June June March 2009 Chairman of the Supervisory Board of Metsäliitto Co-operative Member of the Board of Directors of M-Real Corporation Chairman of the Board of Directors of Ab Mellanå Plant Oy Member of the Board of Directors of A-Farmers Ltd Member of the Board of Directors of A-Rehu Oy Chairman of the Board of Directors of Osuuskunta Pohjanmaan Liha Chairman of the Board of Directors of Rannikon Metsäkeskus Independent of the company and dependent on the principal owners Member of the Board of Directors of TUKO and FGTA Independent of the company and the principal owners Member of the Board of Directors of Componenta Plc Dependent on the company and independent of the principal owners Member of the Board of Directors of Olvi Plc Member of the Board of Directors of Norpe Oy Member of the Board of Directors of Top-Sport Oy Member of the Board of Directors of Leipurin Oy Independent of the company and the principal owners 111
116 Corporate Governance regarding new members of the Board of Directors prepares all matters related to the fees and bonuses to be paid to the members of the Board of Directors looks for candidates to fill vacant seats in the Board of Directors makes a proposal to the Supervisory Board regarding new members of the Board of Directors makes the preparations for the nomination of the President and CEO and Vice President makes the preparations for the mapping of the successors to the President and CEO and Vice President performs other duties separately assigned to the Nomination Committee by the Board of Directors. The Chairman shall convene the Nomination Committee as needed. The meetings discuss the matters that belong to the duties of the Nomination Committee. The agenda shall be prepared by the company s President and CEO after consultation with the Chairman of the Committee. During a meeting of the Committee, the matters to be discussed are presented by the company s President and CEO or a person appointed by him/her, provided that the matters in question do not pertain to them. The meetings of the Nomination Committee are attended by the President and CEO and the Vice President. An exception to this is when the Committee discusses matters pertaining to them. The Nomination Committee may invite other people to join its meetings if deemed necessary and may use external experts to assist the Committee in fulfilling its duties. In 2010, the Chairman of the Nomination Committee was Ari Pirkola and the other members were Martti Selin and Maisa Romanainen. All members of the Nomination Committee are independent of the company. Maisa Romanainen is also independent of the principal owners. The Committee met two (2) times in All members of the Committee attended all meetings. Remuneration Committee The Remuneration Committee consists of the Chairman, Vice Chairman and one member of the Board of Directors elected by the Board itself. In accordance with recommendation 32 of the Corporate Governance Code, the President and CEO or people belonging to the company s other management shall not be elected as members of the Remuneration Committee. The aim of the Remuneration Committee is to ensure the objectivity of decision-making, enhance the achievement of the company s goals through bonus schemes, increase the company s value and ensure that bonus schemes are transparent and systematic. The aim of the Remuneration Committee is also to ensure that the merit pay systems are connected with the company s strategy and the results obtained. According to the rules of procedure, the duties of the Remuneration Committee are as follows: prepares the terms of employment of the President and CEO and Vice President and brings them before the Board of Directors prepares the remuneration, fees and other employment benefits of the directors that report to the President and CEO and brings them before the Board of Directors prepares the forms and criteria of the bonus and incentive schemes of top management and brings them before the Board of Directors prepares the content and group assignments of the pension programmes of the company s management and brings them before the Board of Directors submits its statement on the bonus arrangements for the whole personnel before their approval and assesses their functionality and the achievement of the goals of the systems if required, discusses possible interpretation problems related to the application of the approved bonus schemes and recommends a solution if required, reviews information to be published in the financial statements and, where applicable, in other bonusrelated documents performs other duties separately assigned to it by the Board of Directors. The Chairman of the Remuneration Committee shall convene the Committee as needed, but no less than two times per year. The meetings discuss the matters that belong to the duties of the Remuneration Committee. The agenda shall be prepared by the company s President and CEO after consultation with the Chairman of the Committee. During a meeting of the Committee, the matters to be discussed are presented by the company s President and CEO, provided that the matters in question do not pertain to him/her. The Remuneration Committee may invite other people to join its meetings if deemed necessary and may use external experts to assist the Committee in fulfilling its duties. In 2010, the Chairman of the Remuneration Committee was Martti Selin and the other members were Timo Komulainen and Harri Sivula. All members of the Remuneration Committee are independent of the company. Harri Sivula is also independent of the principal owners. The 112

117 Atria Group Management Team 18 March 2011 President and CEO Juha Gröhn Corporate Governance Business Areas ATRIA FINLAND Mika Ala-Fossi ATRIA BALTIC Tomas Back ATRIA SCANDINAVIA acting Björn Widegren ATRIA RUSSIA Juha Ruohola Meat Raw Material Producement and Atria Concept Juha Gröhn Quality, Product Safety and Sustainability Merja Leino Product Leadership Jarmo Lindholm Strategic Process Pasi Luostarinen Primary Production Juha Ruohola Purchasing, Steering, Logistics and IT Jukka Mäntykivi Finance and Administration Tomas Back Human Resources Kirsi Matero Product Leadership comprises Group-wide brand management, R&D and product group management functions. The Group Vice President in charge of the Strategy Process is responsible for implementing and monitoring the process throughout the Group. Remuneration (in euros) of the members of the Supervisory Board in 2010 Procedures of the Supervisory Board Benefits from Group companies Total Pirkola Ari, Chairman 51,000 51,000 Paavola Seppo, Vice Chairman 30,900 30,900 Alaranta Juha-Matti 1,500 1,500 Anttikoski Juho 1,500 1,500 Asunmaa Mika 1,500 1,500 Haarala Lassi Antti 1,750 1,750 Herrala Juhani 1,500 1,500 Holm Henrik 1,000 2,700 3,700 Hyttinen Veli, from May ,000 1,000 Ingalsuo Pasi 1,500 4,200 5,700 Kiviniemi Juha, from May Koivisto Veli 2,000 3,900 5,900 Kuja-Lipasti Olavi, until April Mutanen Teuvo 1,750 1,750 Niku Mika 1,500 1,500 Panula Heikki 1,250 1,250 Parikka Pekka 1,750 1,750 Riekkinen Marita, until April ,000 1,000 Tervonen Juho 2, ,600 Toivanen Tomi 1,500 1,500 Tuhkasaari Timo 1,500 1, ,650 11, ,
118 Corporate Governance Remuneration Committee met four (4) times in All members of the Committee attended all meetings. President and CEO The company has a President and CEO in charge of managing the company s operations in accordance with the instructions and orders issued by the Board of Directors, as well as informing the Board of Directors of the development of the company s operations and financial performance. The President and CEO also sees to the organisation of the company s day-to-day administration and ensures reliable asset management. The President and CEO is appointed by the Board of Directors, which decides on the terms of his or her employment. The President and CEO of Atria Plc was Matti Tikkakoski, MSc (Econ.) until 3 March After that, Juha Gröhn, MSc (Food Sc.) was appointed to the position. His task is to attend to the day-to-day administration of the company in accordance with the instructions and orders issued by the Board of Directors. The personal details of the President and CEO can be found in connection with the presentation of the members of the Management Team. Management Team Atria Group has a Management Team chaired by the President and CEO. The Management Team assists the President and CEO in planning the operations and in operational management. The duties of the Management Team include, among others, preparing strategic plans and putting them into practice, handling significant projects and organisational changes as well as reviewing and implementing the Group s risk management measures in their respective areas of responsibility. In 2010, the Management Team met eleven (11) times. Rewarding Rewarding of the members of the Supervisory Board The Annual General Meeting decides yearly on the remuneration of the members of the Supervisory Board. In 2010, the Supervisory Board met three (3) times and the remunerations were as follows: Meeting compensation 250 euros/meeting Compensation for loss of working time 250 euros for meeting and proceeding dates The fee of the Chairman of the Supervisory Board 3,000 euros/month The fee of the Vice Chairman of the Supervisory Board 1,500 euros/month Travel allowance according to the State s Travelling Regulations (national railway in first class) The members of the Supervisory Board have no share incentive plans or share-based bonus schemes. In 2010, monthly fees and meeting fees paid to the members of the Supervisory Board for participating in the procedures of the Supervisory Board (including being a member of the Supervisory Board of another company that is part of the same Group) are presented on the page 113. Rewarding of the members of the Board of Directors The Supervisory Board decides on the remuneration of the members of the Atria Board of Directors yearly. The remuneration to the members of the Board of Directors is paid as monetary compensation. With the exception of the President and CEO, the members of the Board have no share incentive plans or share-based bonus schemes. The principles governing the rewarding of the President and CEO are set out in a different section. Remuneration of Board members: Meeting compensation 300/meeting and compensation for loss of working time 300/meeting and proceeding date Fee of the Chairman of the Board of Directors 4,400/ month Fee of the Vice Chairman of the Board of Directors 2,200/ month Fee of a member of the Board of Directors 1,700/month In 2010, monthly fees and meeting fees paid to the members of the Board for participating in the procedures of the Board of Directors (including being a member of the Board of another company that is part of the same Group) were the following: 114
119 Name Position Board of Directors and committee work Benefits from Group companies Total Martti Selin Chairman 66,600 66,600 Timo Komulainen Vice Chairman 39,600 36,900 76,500 Tuomo Heikkilä Member 33,000 33,000 Esa Kaarto Member 31,800 20,180 51,980 Runar Lillandt Member 18,900 2,700 21,600 Maisa Romanainen Member 12,048 12,048 Harri Sivula Member 27,000 27,000 Matti Tikkakoski Member TOTAL 228,948 59, ,728 Corporate Governance The members of the Board have no share incentive plans or share-based bonus schemes. Bonus schemes for the President and CEO and other management The bonus scheme for the management of Atria Plc consists of a fixed monthly salary, merit pay, pension benefits and a share incentive plan. The company has no option scheme in place. The Atria Plc Board of Directors decides on the remuneration, other financial benefits and the criteria applied in the merit pay system for the Group CEO and the Management Team, as well as the merit pay principles used for other management members. The Group s vice-president and the CEO decide on the rewarding of the members of the management teams of the various business units according to the one-over-one principle. The merit pay systems for the management teams of business areas are approved by the President and CEO. The retirement age for the President and CEO is 63 years. However, the President and CEO has the right to retire at age 60. The amount of pension is based on the President and CEO s annual earnings at Atria Group as specified by the Board of Directors. In 2010, the group pension contributions of the President and CEO were 24% of annual earnings, which included monetary salary and fringe benefits without cash payments of incentive schemes. According to the President and CEO s contract, the period of notice is 6 months and the salary for the period of notice is 12 months salary. There are no terms and conditions for any other compensation based on termination of employment. Merit pay system The maximum amount of merit pay for Atria Plc s President and CEO and the Management Team is 30% to 50% of the annual salary, depending on the effect on the result and the level of competence required to perform the duties. The criteria in Atria Plc s merit pay system are the profit requirements at Group level and in the person s responsibility area, the working capital and, for some employees, the personal performance. In addition to the President and CEO, Deputy CEO and Management Team, Atria Plc s merit pay system covers approximately 60 people at the executive and supervisory levels. Share incentive plan In addition to the merit pay system, Atria Plc s Board of Directors has decided to adopt a share-based incentive programme for Atria Group s key personnel. The aim of the share incentive plan is to combine the objectives of the owners and key personnel in order to increase the company s value. The aim is also to commit the key personnel to the company and to offer them a competitive incentive plan based on holding the company shares. In 2010, the financial benefits included for the President and CEO and the Management Team were the following: Fixed monthly salary Merit pay Fringe benefits Share-based incentive Pension contributions 2010 Total President and CEO 457,057 68,796 19,292 9, , ,647 Management Team 1,694, , ,331 32, ,820 2,347,427 TOTAL 2,151, , ,623 41, ,193 3,035,

 MSc (Food Sc.) MSc (Agriculture and Forestry), emba MSc (Econ.")


120 Corporate Governance Management Team Name Matti Tikkakoski President and CEO until 3 March 2011, Atria Plc, Atria Finland Executive Vice President Juha Gröhn Vice President & Deputy CEO, President & CEO, Atria Plc, since 18 March 2011, Executive Vice President, Atria Scandinavia Juha Ruohola Executive Vice President, Atria Russia Tomas Back CFO, Executive Vice President, Atria Baltic Responsibility Atria Group Meat Raw Material Producement and Atria Concept Primary Production Finance and Administration Joined Atria in Year of Birth Education BSc (Econ.) MSc (Food Sc.) MSc (Agriculture and Forestry), emba MSc (Econ.) Relevant work experience Product Manager, Orion Corporation various managerial positions at Huhtamäki Plc, Vice President Vice President, Å&R Carton AB March 2011 President and CEO, Atria Plc 1 September February 2011 Managing Director, Atria Finland Ltd Foreman, Lihapolar Business Development Manager, Itikka- Lihapolar Director, Slaughterhouse Industry, Atria Ltd Director, Meat Product and Convenience Food Industries, Atria Ltd Director, Steering, Vice President, Atria Ltd Director, Meat Industry, Vice President, Atria Ltd Managing Director, Atria Finland Ltd, Vice President, Atria Plc, Atria Baltic 2010 Deputy CEO, Executive Vice President, Atria Scandinavia 18 March 2011 President and CEO, Atria Plc Agronomist, Central Union of Agricultural Producers and Forest Owners (MTK), Tampere Region Acting Executive Director, Central Union of Agricultural Producers and Forest Owners (MTK), Tampere Region Purchasing Director, LSO Foods Oy President and CEO, Lihakunta Co-operative President and CEO, Lithells AB Director, Convenience Food Industry, Atria Ltd Director, Meat Product and Convenience Food Industries, Atria Ltd Director, Meat Product Industry, Atria Ltd 2006 Director, Atria Russia business area Business Controller, Chief Financial Officer, Huhtamäki Oyj (Helsinki, Lausanne, DeSoto, Kansas, Espoo) CFO, Atria Plc 2010 CFO, Executive Vice President, Atria Baltic 116

 MSc")
 1987 1991 Product Developer, Huhtamäki Oy Jalostaja 1991 1995 Packaging Development Manager, Unilever Oy 1995 1996 National Coordinator, Networked Centre of Expertise for the Food Processing")


121 Corporate Governance Merja Leino Group Vice President Jarmo Lindholm Group Vice President Pasi Luostarinen Group Vice President Jukka Mäntykivi Group Vice President Kirsi Matero Group Vice President Quality, Product Safety and Sustainability Product Leadership Strategic Process Purchasing, Steering, Logistics and IT Human Resources PhD (Phil.) MSc (Econ.) MSc (Econ.) MSc (Soc.Sc.) MSc (Econ.) Product Developer, Huhtamäki Oy Jalostaja Packaging Development Manager, Unilever Oy National Coordinator, Networked Centre of Expertise for the Food Processing Industry (ELO) Group Vice President, Convenience Food, Quality Development and Product Safety, Atria Finland Ltd/ Atria Plc 2010 Group Vice President, Quality, Product Safety and Sustainability, Atria Plc / Atria Finland Ltd, Director, Convenience Food, Atria Finland Ltd Customer Service Manager & e-business, Unilever Finland Account Manager, Marketing Manager, AC Nielsen Marketing Manager, Atria Ltd Group Vice President, Product Group Management and Product Development, Commercial Director, Atria Finland Ltd 2010 Group Vice President, Product Leadership, Brand Management and Product Development, Atria Plc Product Manager, Oy Mallasjuoma Product Group Manager, Fazer Confectionery Ltd Trade Development Manager, British American Tobacco Nordic Marketing Director, Valio Marketing Director, Atria Plc Group Vice President, Brand Management and Cold Cuts, Atria Plc 2010 Group Vice President, Strategy Process, Atria Plc Controller, Valio Ltd, Northern Finland profit centre, Oulu IT Systems Manager, Valio Ltd, Northern Finland profit centre, Oulu IT Manager, Valio Ltd, Butter and Powdered Ingredients, Seinäjoki Chief Financial Officer, Valiojäätelö Ice Cream business, Helsinki Chief Information Officer, Valio Ltd, Group Administration, Helsinki Chief Information Officer, Atria Plc Group Vice President, Information Management, Steering and Logistics, Atria Plc 2010 Group Vice President, Procurement, Information Management, Steering and Logistics, Atria Plc Business HR Manager, Competence Development Manager / Consultant, Nokia Networks and Nokia Mobile Phones Senior Business HR Manager, Nokia Mobile Phones HR Director, Pfizer Oy 2010 Group Vice President, Human Resources, Atria Plc 117
Table of Contents. Atria Plc. Atria Group s financial year Review of operations. Product development and marketing 28. Corporate responsibility
 Annual Report 2009 Table of Contents Atria Group s financial year 2009 Financial summary CEO s review 2 Atria s brands 4 Atria s strategy 6 Atria Plc Atria Plc is a powerfully growing and internationalizing
Atria Plc 1 January 31 March 2010
 Atria Plc 1 January 31 March President and CEO Matti Tikkakoski 28 April, Review Net sales 305.9 310.7 1,316.0 EBIT 1.0-0.4 27.5 EBIT % 03 0.3-0.1 01 21 2.1 Profit before taxes -1.8-5.5 16,5 Earnings per
Interim Report. Atria Plc. Company Announcement 28 April 2009
 Q1 Interim Report Atria Plc 1.1.-31.3.2009 Company Announcement 28 April 2009 INTERIM REPORT OF ATRIA PLC 1 January 31 March, 2009 THE EARNINGS OF ATRIA FINLAND IMPROVED - PROFITABLITY IN OTHER BUSINESS
Atria Group 1 January 30 September 2018
 1 Atria Group 1 January 30 September 2018 Q3 Q3 Q1-Q3 Q1-Q3 Net sales 357.1 360.8 1,061.6 1,061.7 1 436.2 EBIT 12.7 16.2 21.5 27.5 40.9 EBIT % 3.5 % 4.5 % 2.0 % 2.6 % 2.8 % Adjusted EBIT 12.7 16.2 21.5
BalTic STRaTEgy. Good food better mood. is Atria Group s mission approved in It is also the visual theme of this Annual Report.
 Annual Report 2006 BalTic STRaTEgy Atria Group aims to achieve growth based on its Baltic strategy, through which the Group strives to become the leading meat processing and meal solution company in the
Atria Plc Interim Report
 Atria Plc Interim Report 1 January 31 March 2017 1/17 INTERIM REPORT OF ATRIA PLC 1 JANUARY 31 MARCH 2017 Atria records growth in net sales in all business areas January March 2017 - Consolidated net sales
Atria s Healthy Growth. Growth investments and development projects without compromising profitability.
 Atria s Healthy Growth Growth investments and development projects without compromising profitability. Annual Report 2016 Atria s Annual Report 2016 Key Figures Atria Group s key indicators 2016 2015 Net
Half-Year Financial Report 1 January 30 June 2017
 Half-Year Financial Report 1 January 30 June 2017 Juha Gröhn, CEO, Atria Group 1 January 30 June 2017 Q2 Q2 H1 H1 EUR million 2017 2016 2017 2016 2016 Net sales 368.4 341.3 701.0 655.8 1,351.8 EBIT 10.0
Atria Group 1 January 30 June 2018
 1 Firstname Surname / Presentation title Atria Group 1 January 30 June 2018 Q2 Q2 H1 H1 Net sales 359.1 368.4 704.6 701.0 1,436.2 EBIT 5.4 10.0 8.8 11.2 40.9 EBIT % 1.5 % 2.7 % 1.3 % 1.6 % 2.8 % Adjusted
Atria Plc Interim Report
 Atria Plc Interim Report 1 January 30 September 2018 1/21 INTERIM REPORT OF ATRIA PLC 1 JANUARY 30 SEPTEMBER 2018 Atria Group's net sales were at the previous year s level. In Finland, the result improved
Atria Plc Interim Report
 Atria Plc Interim Report 1 January 31 March 2018 1/21 INTERIM REPORT OF ATRIA PLC 1 JANUARY 31 MARCH 2018 Atria's net sales grew and earnings improved Atria Finland leads the growth January March 2018
Atria Russia Review 1 January 30 September 2012
 Capital Markets Day Atria Russia Jarmo Lindholm, 4 December 2012, Atria Russia Review 1 January 30 September 2012 Million Q3 2012 Q3 2011 Q1-Q3 2012 Q1-Q3 2011 2011 Net sales 33.9 31.0 93.5 91.8 123.0
Capital Markets Day Atria Plc CEO Juha Gröhn, 3 December 2014
 Capital Markets Day Atria Plc CEO Juha Gröhn, 1 Atria Capital Markets Day 3.12. -ohjelma 1.Tervetuloa / toimitusjohtaja Juha Gröhn, Atria Oyj (12.00 12.30) Atrian strategia ja Q3 katsaus Taloudelliset
Apetit Plc Interim Report for January June 2014 Briefing for Analysts and Media 14th August 2014 at am - Scandic Simonkenttä, Helsinki
 Apetit Plc Interim Report for January June 2014 Briefing for Analysts and Media 14th August 2014 at 10.00 am - Scandic Simonkenttä, Helsinki Veijo Meriläinen, CEO 1 Apetit Group in brief Apetit Product
HKScan Group Interim Report Q1-Q2/2013 Group overview. Hannu Kottonen, CEO Investor and media briefing 9 August 2013
 HKScan Group Interim Report Q1-Q2/2013 Group overview Hannu Kottonen, CEO Investor and media briefing 9 August 2013 HKScan Group *) *) Modest financial performance in Q2, but Poland continues strongly
Apetit Plc Interim Report for January September 2014 Briefing for Analysts and Media 6th November 2014 at am - Scandic Simonkenttä, Helsinki
 Apetit Plc Interim Report for January September 2014 Briefing for Analysts and Media 6th November 2014 at 10.00 am - Scandic Simonkenttä, Helsinki Veijo Meriläinen, CEO New CEO appointed The Board of Directors
1 World Economy. Value of Finnish Forest Industry Exports Fell by Almost a Quarter in 2009
 1 World Economy The recovery in the world economy that began during 2009 has started to slow since spring 2010 as stocks are replenished and government stimulus packages are gradually brought to an end.
HKScan Group Interim Report Q1-Q3/2012. Hannu Kottonen, CEO Information meeting 6 November 2012
 HKScan Group Interim Report Q1-Q3/2012 Hannu Kottonen, CEO Information meeting 6 November 2012 HKScan Group Q3/2012 Q3/2011 Q1- Q3/2012 Q1- Q3/2011 2011 Net sales, EUR million 623,0 618,1 1 873,3 1 841,4
Atria Finnish with international presence. Atria s annual report Atria Plc Year 2017 Atria Plc Year 2017
 Annual Report 217 Atria Plc Year 217 Atria Plc Year 217 Atria Finnish with international presence Atria s annual report 217 Atria is one of the leading meat and food companies in the Nordic countries,
Interim report January 1 - March 31, 2007
 LÄNNEN TEHTAAT OYJ Interim report January 1 - March 31, 2007 l Net sales of all operations increased by 15.9% and came to EUR 112.4 (2006: 97.0) million. l The profit for the period after taxes was EUR
Result still in loss strategy implementation proceeds with increased focus on efficiency improvement
 HALF YEAR FINANCIAL REPORT 2018 2 HALF YEAR FINANCIAL REPORT 2018 HKscan Group s Half Year Financial Report 1 January 30 June 2018: Result still in loss strategy implementation proceeds with increased
Func Food Group Financial Release / Q1 2018
 Func Food Group Financial Release / Q1 2018 Func Food Group Financial Release / Q1 2018 Func Food Group / Q1 2018 3 FUNC FOOD GROUP IN BRIEF Func Food Group ( FFG ) is a Nordic wellness company, which
Atria Plc. Half-year financial report
 Atria Plc Half-year financial report 1 January 30 June 2017 1/20 ATRIA PLC HALF-YEAR FINANCIAL REPORT 1 JANUARY 30 JUNE 2017 Atria Group's EBIT increased and net sales grew in all business areas. April
HKScan Group Interim Report Q1/2013 Group overview. Hannu Kottonen, CEO Investor and media briefing 7 May 2013
 HKScan Group Interim Report Q1/2013 Group overview Hannu Kottonen, CEO Investor and media briefing 7 May 2013 HKScan Group *) *) *) Restated 7.5.2013 HKScan Interim Report Q1/2013 2 HKScan Group Net sales
Altia Financial Statements Release
 Altia Financial Statements Release 1 January 31 December 2016 Renewed Altia further improved its profitability Altia s profitability continued to improve in 2016 in spite of net sales being lower than
Finland's Balance of Payments. Annual Review 2007
 Finland's Balance of Payments Annual Review 27 Direct investment, stock 1998 27 9 8 7 6 5 4 3 2 1 1998 1999 2 21 22 23 24 25 26 27 In Finland (LHS) Abroad (LHS) In Finland, of GDP (RHS) Abroad, of GDP
Metsäliitto Group s operating profit excluding non-recurring items EUR 178 million in the first half of the year
 1/16 Metsäliitto Group Interim Report January June Metsäliitto Group s operating profit excluding non-recurring items EUR 178 million in the first half of the year Result for the first six months of Sales
Finland falling further behind euro area growth
 BANK OF FINLAND FORECAST Finland falling further behind euro area growth 30 JUN 2015 2:00 PM BANK OF FINLAND BULLETIN 3/2015 ECONOMIC OUTLOOK Economic growth in Finland has been slow for a prolonged period,
INTERIM REPORT 1 JANUARY-30 JUNE 2008
 SUSTAINED GROWTH AND IMPROVED PROFITABILITY FOR RAISIO In April June Raisio s turnover increased by 16 per cent year-over-year, amounting to EUR 122.9 million (EUR 106.1 million in April June ). Operating
Upturn in HKScan s profitabilty compared with early part of the year
 HKScan Group interim report 1 January - 30 September 2011-1- HKSCAN GROUP S INTERIM REPORT 1 JANUARY 30 September 2011 Stock Exchange Release, 4 November 2011 at 08:00 Upturn in HKScan s profitabilty compared
HKScan Group interim report 1 January - 30 June 2009
 HKScan Group interim report 1 January - 30 June 2009 Published on 6 August 2009, at 8am * EBIT for the first half of 2009 stood at EUR 22.5 million. HKScan achieved positive and improved results in all
HKScan Corporation Q1 Interim report CEO Matti Perkonoja Investor briefing 4 May 2010
 HKScan Corporation Q1 Interim report 2010 CEO Matti Perkonoja Investor briefing 4 May 2010 HKScan s mission and vision Mission statement: MEAT AND MORE HKScan is a responsible food company which creates
Atria Plc. Half-year financial report
 Atria Plc Half-year financial report 1 January 30 June 2018 1/22 ATRIA PLC HALF-YEAR FINANCIAL REPORT 1 JANUARY 30 JUNE 2018 Atria Group's net sales stable, profits weakened April June 2018 Consolidated
HKScan Group s interim report 1 January 31 March 2013: Restructuring continued financial performance remained flat
 HKScan Group s Interim Report Q1/2013-1- 7 May 2013, at 8:00 am HKScan Group s interim report 1 January 31 March 2013: Restructuring continued financial performance remained flat * Net sales were EUR 590.8
Interim Report January-June Nordea Bank Finland Plc
 Interim Report January-June 2003 Nordea Bank Finland Plc Interim Report, January-June 2003 Summary (The income statement comparison figures in brackets refer to the figures for the first six months of
Half Year Report Q2/2017 Tuomo Valkonen, CFO Info meeting, 19 July 2017, Vantaa
 Half Year Report Q2/2017 Tuomo Valkonen, CFO Info meeting, 19 July 2017, Vantaa 1 Challenges continued operational restructuring finalized 2 HKScan Group Q2/2017 Group s net sales decreased All market
Lemminkäinen Interim Report 1 January 30 June 2013:
 Lemminkäinen Interim Report 1 January 30 June 2013: Profitability challenges especially in international operations; Lemminkäinen to cut costs by EUR 30 million. Lemminkäinen Interim Report 1 Jan 30 June
ITELLA CORPORATION STOCK EXCHANGE RELEASE October 26, 2011, AT 10:00 A.M. Itella Interim Report for January September 2011
 ITELLA CORPORATION STOCK EXCHANGE RELEASE October 26, 2011, AT 10:00 A.M. Itella Interim Report for January September 2011 July September 2011 Itella Group s net sales grew by 5% in July September and
1 World Economy. about 0.5% for the full year Its GDP in 2012 is forecast to grow by 2 3%.
 1 World Economy The short-term outlook on the Finnish forest industry s exports markets is overshadowed by uncertainty and a new setback for growth in the world economy. GDP growth in the world economy
First Quarter Report 2011
 Copenhagen, Helsinki, Oslo, Stockholm, 28 April 2011 First Quarter Report 2011 Solid quarter CEO Christian Clausen s comment to the report: I am proud to present another strong quarter. Our relationship
Good revenue growth continued; Q3 operating profit somewhat down on Q3 2010
 STOCKMANN GROUP S INTERIM REPORT Q3/2011 Stockmann Group, Interim report 1 January - 30 September 2011 Good revenue growth continued; Q3 operating profit somewhat down on Q3 2010 July - September 2011:
BUSINESS REVIEW Q3/2018 / CRAMO PLC Q3
 BUSINESS REVIEW /2018 / CRAMO PLC 1 PROFITABLE GROWTH CONTINUED BUSINESS REVIEW /2018 / CRAMO PLC JULY SEPTEMBER 2018 Sales EUR 197.9 (191.9) million, up by 3.1%. In local currencies, sales grew by 7.5%.
Interim report of the HKScan Group 1 January 30 September 2009
 Interim report of the HKScan Group 1 January 30 September 2009 * HKScan Group s competitiveness continued to grow stronger and supplier shares increased in all of the company s market areas. * HKScan had
TIKKURILA INSPIRES YOU TO COLOR YOUR LIFE. TM. Tikkurila's Interim Report for January September 2013 Record-high third quarter profitability 1 (30)
") Interim Report Q3 January September 2013 1 Tikkurila Oyj Interim Report November 7, 2013 at 9:00 a.m. (CET+1) Tikkurila's Interim Report for January September 2013 Record-high third quarter profitability
Interim Report Q3 January September 2013 1 Tikkurila Oyj Interim Report November 7, 2013 at 9:00 a.m. (CET+1) Tikkurila's Interim Report for January September 2013 Record-high third quarter profitability
Strategy implementation proceeds result still in loss
 INTERIM REPORT Q1/2018 2 INTERIM REPORT Q1/2018 HKScan Group s Interim Report 1 January 31 March 2018: Strategy implementation proceeds result still in loss January March 2018 in brief Net sales were EUR
M-real s operating result excluding non-recurring items for the first half of 2011 EUR 75 million
 M-real s operating result excluding non-recurring items for the first half of 2011 EUR 75 million Result for the first half of 2011 Sales EUR 1,345 million (Q1 Q2/2010: 1,278) Operating result excluding
Apetit Half-Year Financial Report January June 2018
 Apetit Half-Year Financial Report January June 2018 Apetit Plc Half-Year Financial Report 1 January 30 June 2018 1 Apetit Half-Year Financial Report 1 January 30 June 2018 A weak harvest lowered Grain
H1 results presentation
 10 AUGUST 2018 H1 results presentation CEO PEKKA TENNILÄ & CFO MATTI PIRI Agenda 1. Highlights 2. Segments and business 3. Financials 4. Strategy 5. Q&A Leading Nordic alcoholic beverage brand company
Highlights of Handelsbanken s annual report
 Highlights of Handelsbanken s annual report January - December 2008 * Summary of Q4 2008, compared with Q3 2008 Operating profits rose by 39% to SEK 5,216m (3,758). Excluding capital gains, operating profits
The Group s net sales and result decreased due to the weak grain crop Positive development continued in Food Solutions
 Apetit Plc Financial Statements Release 1 January to 31 December 2018 1 Apetit Plc: Financial Statements Release 1 January to 31 December 2018 The Group s net sales and result decreased due to the weak
Func Food Group Financial Release / Q2 2017
 Func Food Group Financial Release / Q2 2017 Func Food Group Financial Release / Q2 2017 Func Food Group / Q2 2017 3 FUNC FOOD GROUP IN BRIEF Func Food Group ( FFG ) is a Nordic wellness company, which
INTERIM REPORT 1 Jan-30 Jun 2013 RTRKS
 www.ruukki.com Q2 INTERIM REPORT 1 Jan-30 Jun 2013 RTRKS 8 August 2013 RAUTARUUKKI CORPORATION Rautaruukki Corporation Stock exchange release 8 August 2013 at 9am EEST Rautaruukki Corporation Interim report
Ramirent a progressive rental solutions group
 Ramirent a progressive rental solutions group SEB Enskilda Nordic Seminar, 9 January 2013, Copenhagen Magnus Rosén, President and CEO, Ramirent Plc Helsinki centre, Finland 1 Contents Company in brief
Interim Report January-September CEO Hannu Penttilä 30 October 2013
 Interim Report January-September 2013 CEO Hannu Penttilä 30 October 2013 Q3 2013 in brief Very weak market, particularly in Finland Fashion market down 5.2% year-to-date in Finland (TMA) and down 0.8%
Fourth quarter result improved but still in loss further corrective actions under way
 FINANCIAL STATEMENTS BULLETIN 2018 2 FINANCIAL STATEMENTS RELEASE 2018 HKScan Group s Financial Statements Release 1 January 31 December 2018: Fourth quarter result improved but still in loss further corrective
HKScan Corporation INTERIM REPORT 4 May 2016, at 8:00 am
 HKSCAN GROUP S INTERIM REPORT 1 JANUARY 31 MARCH 2016: TOUGH BUSINESS ENVIRONMENT PUTS PRESSURE ON MARGINS * Net sales were EUR 439.1 (466.0) million in the first quarter. * Reported EBIT was EUR -4.3
Innofactor Plc Financial Statement 2015 (IFRS)
") FINANCIAL STATEMENT 2015 1 (46) Financial Statement March 1, 2016, at 8:30 Finnish time Financial Statement 2015 (IFRS) Summary Quarter 10 12/2015: Growth of net sales was 2.9%, which we estimate to exceed
FINANCIAL STATEMENT 2015 1 (46) Financial Statement March 1, 2016, at 8:30 Finnish time Financial Statement 2015 (IFRS) Summary Quarter 10 12/2015: Growth of net sales was 2.9%, which we estimate to exceed
TALENTUM OYJ INTERIM REPORT 25 April 2013 at 08:30
 TALENTUM OYJ INTERIM REPORT 25 April 2013 at 08:30 Talentum Oyj, Interim Report Q1/2013 January-March 2013 in brief - Talentum Group s net sales came to EUR 19.8 million (EUR 20.5 million), a decrease
Corporate responsibility at HKScan Report of the Board of Directors Consolidated income statement for 1 January 31 December...
 TABLE OF CONTENTS Business...5 HKScan in brief...5 Market areas...7 Operating environment...9 Graphs... 13 CEO's review... 17 Strategy... 19 Corporate responsibility... 22 Value chain... 23 Stakeholders...
AFFECTO PLC INTERIM REPORT 4 AUGUST 2009 at 9.30 MEUR 4-6/09 4-6/08 1-6/09 1-6/
 1 INTERIM REPORT 1-6/2009 AFFECTO PLC INTERIM REPORT 4 AUGUST 2009 at 9.30 AFFECTO PLC'S INTERIM REPORT 1-6/2009 GROUP KEY FIGURES MEUR 4-6/09 4-6/08 1-6/09 1-6/08 2008 Net sales 26.2 36.2 53.7 69.8 131.6
Customers needs were met by strengthening digital and content services
 Financial Statements Bulletin February 17, 2016 NORDIC MORNING GROUP S FINANCIAL STATEMENTS BULLETIN 2015 Customers needs were met by strengthening digital and content services Net revenue was EUR 104.9
Func Food Group Financial Release / Q2 2018
 Func Food Group Financial Release / Q2 2018 Func Food Group Financial Release / Q2 2018 Func Food Group / Q2 2018 3 FUNC FOOD GROUP IN BRIEF Func Food Group ( FFG ) is a Nordic wellness company, which
Pohjola Bank plc Interim Report for 1 January 30 June 2010
 Pohjola Bank plc s Interim Report for 1 January 1 Pohjola Bank plc Company Release, 4 August, 8.00 am Release category: Interim Report Pohjola Bank plc Interim Report for 1 January January June Year on
Interim Report January 1 September 30, 2007
 LÄNNEN TEHTAAT PLC Interim Report January 1 September 30, 2007 July-September l Third quarter profit totalled EUR 3.1 million (Q3 2006: 3.5 million). l Earnings per share came to EUR 0.49 (0.56). l Net
Posti Group Corporation Interim Report January-September Posti Group s result satisfactory while net sales decreased
 Posti Group Corporation Interim Report January-September 2015 Posti Group s result satisfactory while net sales decreased POSTI GROUP CORPORATION INTERIM REPORT, JANUARY SEPTEMBER 2015 NOVEMBER 2, 2015
HKScan Corporation Q3 Interim report, 3 Nov CEO Matti Perkonoja Press conference, 3 November 2009
 HKScan Corporation Q3 Interim report, 3 Nov 2009 CEO Matti Perkonoja Press conference, 3 November 2009 Group structure HKScan Corporation Net sales in 2008: EUR 2 294.6m, CEO Matti Perkonoja Finland Sweden
Metsä Board Corporation s operating result for the first half of 2012 excluding nonrecurring items was EUR 24 million
 Metsä Board Corporation Interim Report 1 January 30 June 2012 Metsä Board Corporation s operating result for the first half of 2012 excluding nonrecurring items was EUR 24 million Result for the first
Apetit. Financial Statements Bulletin Apetit Plc s Financial Statements Bulletin for 1 January 31 December
 Apetit Financial Statements Bulletin Apetit Plc s Financial Statements Bulletin for 1 January 31 December 1 Apetit Plc s Financial Statements Bulletin 1 January 31 December A turnaround in Food Solutions
Uponor Corporation Stock exchange release 3 Aug :00 JANUARY-JUNE 2006: UPONOR REPORTS CONTINUED STRONG DEVELOPMENT
 Uponor Corporation Stock exchange release 3 Aug. 11:00 JANUARY-JUNE : UPONOR REPORTS CONTINUED STRONG DEVELOPMENT - Net sales and results remained strong in the second quarter - Net sales (January-June)
Annual General Meeting 2 April, 2009
 Annual General Meeting 2 April, 2009 President and CEO Magnus Rosén 1 2.4.2009 AGM 2009 2009 Ramirent Forward-looking statements A number of forward-looking statements will be made during this presentation.
Finland's Balance of Payments. Preliminary Review 2007
 Finland's Balance of Payments Preliminary Review 27 1 Current account, 198 27 1 Credit Net - -1 198 198 199 199 2 2 Current transfers Income Services Goods Curent account, net Debit Bank of Finland Financial
METSÄ BOARD CORPORATION HALF YEAR FINANCIAL REPORT JANUARY-JUNE 2016
 METSÄ BOARD CORPORATION HALF YEAR FINANCIAL REPORT JANUARY-JUNE 2016 Half year financial report 1 January 30 June 2016 4 August 2016 at 12:00 noon Page 1/30 METSÄ BOARD CORPORATION S OPERATING RESULT EXCLUDING
Itella Corporation. Interim Report for January June Market Overview
 Itella Corporation Interim Report for January June 2008 Market Overview The general economical downtrend was not yet evident in the demand for Itella services with the exception of the Danish and Baltic
AFFECTO PLC INTERIM REPORT 5 MAY 2009 at 9.30
 1 INTERIM REPORT 1-3/2009 AFFECTO PLC INTERIM REPORT 5 MAY 2009 at 9.30 AFFECTO PLC'S INTERIM REPORT 1-3/2009 GROUP KEY FIGURES MEUR 1-3/09 1-3/08 2008 Net sales 27.5 33.6 131.6 Operational segment result
Lännen Tehtaat Oyj INTERIM REPORT Q Scandic Simonkenttä. Matti Karppinen CEO. Interim report Q August
 Lännen Tehtaat Oyj INTERIM REPORT Q2 2009 14 August 2009 Scandic Simonkenttä Matti Karppinen CEO Interim report Q2 2009 14 August 2009 1 Lännen Tehtaat Group structure on 30.06.2009 06 Lännen Tehtaat plc
Apetit Plc Financial statements bulletin 1 January to 31 December
 Apetit Plc Financial statements bulletin 1 January to 31 December 2016 1 Apetit Plc s financial statements bulletin for 2016 Good profitability development in fish products strong consolidated cash flow
Economic Outlook. Global And Finnish. Technology Industries In Finland Significant growth in the value of orders due to ship orders s.
 Economic Outlook Technology Industries of Finland 1 218 Global And Finnish Economic Outlook Good global economic outlook s. 3 Technology Industries In Finland Significant growth in the value of orders
Premia Foods: Q4 & 12 months, February 21st, 2012
 Premia Foods: Q4 & 12 months, 2011. February 21st, 2012 1 2011 satisfying year The consolidated turnover of 12 months was 88.3 meur, y-o-y increase 11 m EUR, i.e. 14% Turnover on target markets 12 months,
AGREEMENT TO ACQUIRE MANOR FARM THE LEADING CHICKEN PROCESSOR IN IRELAND
 AGREEMENT TO ACQUIRE MANOR FARM THE LEADING CHICKEN PROCESSOR IN IRELAND Scandi Standard AB (publ.) (SCST SS) is pleased to announce that it has entered into an agreement to acquire Manor Farm, the largest
Atria Plc. Financial Statement Release
 Atria Plc 1 January 31 December 2016 1/29 INTERIM REPORT OF ATRIA PLC 1 JANUARY 31 DECEMBER 2016 Atria executes a strategy of Healthy Growth - investments, acquisitions and new market areas October December
Huhtamaki Strong positions i for profitable growth. CEO Jukka Moisio Pohjola One-on-one Day March 9, 2011
 Huhtamaki Strong positions i for profitable growth CEO Jukka Moisio Pohjola One-on-one Day March 9, 2011 Huhtamaki in 2011 Key Fig gures 201 0 EUR 2.0 Billion in net sales 12,000 People employed Globally
AFFECTO PLC -- FINANCIAL STATEMENTS BULLETIN FEBRUARY 2013 at MEUR 10-12/ /
 1 FINANCIAL STATEMENTS BULLETIN 2012 AFFECTO PLC -- FINANCIAL STATEMENTS BULLETIN -- 14 FEBRUARY 2013 at 12.30 Affecto Plc's Financial Statements Bulletin 2012 Group key figures MEUR 10-12/12 10-12/11
Interim Report for January June 2009
 1 (7) Interim Report for January June 2009 Market overview The global economic downturn has significantly decreased the demand for Itella s services. In Finland, the logistic and mail volumes saw a sharp
Nordea Construction Seminar 26 August 2008, Kämp Hotel
 Nordea Construction Seminar 26 August 2008, Kämp Hotel Kari Kallio, President and CEO 1 26 August, 2008 Nordea Construction Seminar 2008 Ramirent Ramirent in Brief Leading equipment rental company in Northern,
Continuously improved performance in Stockmann Retail and Real Estate Group s operating result negatively impacted by Lindex
 Interim report Q3 2017 2 STOCKMANN S INTERIM REPORT Q3 2017 STOCKMANN plc, Interim report 27.10.2017 at 8:00 EET Continuously improved performance in Stockmann Retail and Real Estate Group s operating
II. ESTONIAN BALANCE OF PAYMENTS FOR 2001
 18 II ESTONIAN BALANCE OF PAYMENTS FOR 2001 In 2001 a rapid slowdown of economic growth was registered with all Estonia s major export partners The negative import growth of the euro area Finland and Sweden
WULFF GROUP PLC S INTERIM REPORT FOR JANUARY 1 SEPTEMBER 30, 2015
 WULFF GROUP PLC INTERIM REPORT November 5, 2015 at 9:00 A.M. WULFF GROUP PLC S INTERIM REPORT FOR JANUARY 1 SEPTEMBER 30, 2015 Operating result without non-recurring items increased in January-September
Raisio s Interim Report January-June CEO Matti Rihko Raisio plc 11 August 2015 Q2/2015
 Raisio s Interim Report January-June 2015 CEO Matti Rihko Raisio plc 11 August 2015 Q2/2015 Highlights Q2/2015 Raisio s EBIT of 14.0 M is the fourth consecutive quarterly result better than in the comparison
FINANCIAL STATEMENTS Stockmann Group 14 February 2018
 FINANCIAL STATEMENTS 2017 Stockmann Group 14 February 2018 HIGHLIGHTS IN 2017 Group s gross margin 55.8% (55.7) Group s adjusted operating result, EUR mill. 12.3 (30.9) Fair value of properties, EUR mill.
Economic Outlook. Global And Finnish. Technology Industries In Finland Economic uncertainty has not had a major impact yet p. 5.
 Economic Outlook Technology Industries of 1 219 Global And Finnish Economic Outlook Uncertainty dims growth outlook p. 3 Technology Industries In Economic uncertainty has not had a major impact yet p.
II BANKING SECTOR STABILITY AND RISKS
 II BANKING SECTOR STABILITY AND RISKS Strategic development of the banking sector The influence of economic adjustment in the last half-year is reflected in the changes in the structure of domestic financial
INTERIM REPORT Q Stockmann Group 27 October 2017
 INTERIM REPORT Q3 2017 Stockmann Group 27 October 2017 Q3 2017 IN BRIEF Group s gross margin 56.2% (56.6) Group s adjusted operating result, EUR mill. -1.4 (4.8) Retail s operating result, EUR mill. -10.8
REPORT / 2 ND QUARTER OF 2018 AND 18 MONTHS OF 2017/ October 2018
 REPORT / 2 ND QUARTER OF 2018 AND 18 MONTHS OF 2017/2018 31 October 2018 2018 Q2 + 18 MONTHS 2017/2018 2 CONTENTS BRIEF OVERVIEW OF THE GROUP 3-5 KEY HIGHLIGHTS 6-10 FINANCIAL POSITION 12-15 REVENUE ANALYSIS
Interim Report January September 2013
 Interim Report January September 2013 Juhani Pitkäkoski President and CEO November 1, 2013 Contents Financial development Development by business Financial position Market outlook and guidance July September
IV SECURITIES AND MONEY MARKET
 FINANCIAL STABILITY REVIEW, NOVEMBER 25 IV SECURITIES AND MONEY MARKET Money Market The key interest rates in the euro area have remained at a low level ever since mid-23. Thus, the money market interest
RAMIRENT GROUP INTERIM REPORT
 RAMIRENT GROUP Interim report january JUNE 2008 Q2 LIVE AUDIOCAST AND CONFERENCE CALL ON 15 AUGUST, 2008 AT 10:00 AM LOCAL TIME A briefing for investment analysts and the press will be arranged on Friday
HKSCAN GROUP S INTERIM REPORT 1 JANUARY 30 JUNE 2012: Challenging first half of the year slight recovery during the second quarter
 HKScan Group s interim report 2/2012-1- HKSCAN GROUP S INTERIM REPORT 1 JANUARY 30 JUNE 2012: Challenging first half of the year slight recovery during the second quarter 10 August 2012 at 8:00 AM - Group
Carnegie Small Mid Cap Seminar 9 September 2008, Stockholm
 Carnegie Small Mid Cap Seminar 9 September 2008, Stockholm Kari Kallio, President and CEO 1 9 Sept, 2008 Carnegie Small Mid Cap Seminar 2008 Ramirent Ramirent in Brief Leading equipment rental company
Pohjola Bank plc s Interim report for 1 January 30 June 2014
 Pohjola Bank plc s Interim report for 1 January 30 June 2014 Pohjola Bank plc Stock exchange release 6 August 2014, 8.00 am Interim Report Pohjola Group Performance for January June 1) Consolidated earnings
- Net sales 24.5 MEUR - EBIT 2.9 MEUR (margin 12%) - Profit before taxes 2.7 MEUR - Net Profit 1.9 MEUR - Earnings per share 0.
 - Profit before taxes 2.7 MEUR - Net Profit 1.9 MEUR - Earnings per share 0.") 1 INTERIM REPORT 1-6/2005 INTERIM REPORT 1-6/2005 KEY FIGURES 1-6/2005 - Net sales 24.5 MEUR - EBIT 2.9 MEUR (margin 12%) - Profit before taxes 2.7 MEUR - Net Profit 1.9 MEUR - Earnings per share 0.14
1 INTERIM REPORT 1-6/2005 INTERIM REPORT 1-6/2005 KEY FIGURES 1-6/2005 - Net sales 24.5 MEUR - EBIT 2.9 MEUR (margin 12%) - Profit before taxes 2.7 MEUR - Net Profit 1.9 MEUR - Earnings per share 0.14