FY19 Interim Results Presentation
|
|
|
- Sybil Hensley
- 5 years ago
- Views:
Transcription


1 FY19 Interim Results Presentation Argosy Property Limited 20 November


2 AGENDA Highlights Page 4 Strategy / Portfolio Page 6 Financials Page 13 Leasing Update Page 22 Looking Ahead Page 26 PRESENTED BY: Peter Mence CEO Dave Fraser CFO Note: This result should be read in conjunction with the NZX release dated 20 November Due to rounding, numbers presented in this presentation may not add up exactly to the totals provided and percentages may not reflect exactly absolute figures. 2


3 Our strength lies in the diversity of our properties across sectors, location and sizes allowing us to adapt to the changing needs of our tenants. Peter Mence CEO 3

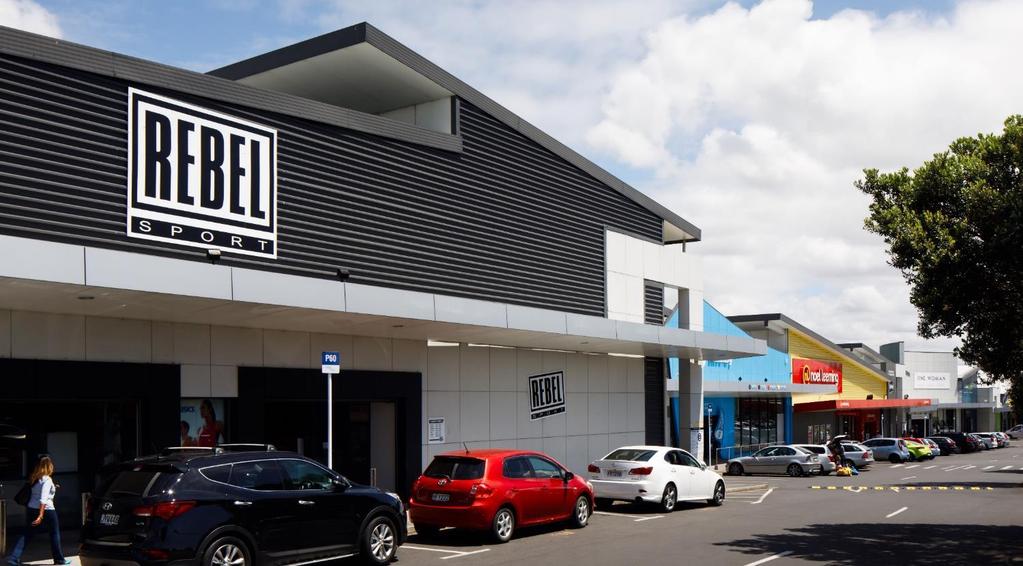
4 HIGHLIGHTS Change image 4
 5.")
5 FY19 Interim Highlights 4.7% Increase in Net Property Income 3.1% Annualised rental growth on rents reviewed 9.2% Uplift in Net Distributable Income Q2 dividend cents per share 98.4% Occupancy (by rental) 5.6 years WALT 5

6 Strategy / Portfolio 6
7 Strategy Shareholder return focus Diversified approach Transition Value Add properties to drive earnings and capital growth with an environmental focus. Streamlined tenant led development process and execution. AFFO based dividend policy by Continue to invest in a diverse range of properties across sectors, locations and sizes. Investment Strategy underpinned by Core and Value Add properties Core properties between 75-90% of the portfolio by value. Investment Policy sector bands well established. Industrial 40-50%, Office 30-40%, Retail 15-25%. Ongoing commitment to corporate governance best practice Experienced Board with a proven track record. Renewal process underway with appointment of Stuart McLaughlan and Chris Gudgeon. More changes pending over the next 12 months. 7
8 Portfolio at a Glance TOTAL PORTFOLIO VALUE BY SECTOR TOTAL PORTFOLIO VALUE BY REGION PORTFOLIO MIX BY VALUE 22% 41% 24% 5% 7% 10% 37% 71% 83% Industrial Office Retail Auckland Wellington Regional North Island & South Island Core properties Value Add properties Properties and land to divest Divestment of non Core assets continuing with recent sales of 31 El Prado Drive, Palmerston North and 1478 Omahu Road, Hastings (both included in 10% above). Expect to move towards the higher end of the industrial band and lower end of the retail band over the medium term. Data as at 30 September
 $670.0 OCCUPANCY (BY INCOME) 100% WALT (YEARS) 7.0 CONTRACT YIELD 6.")
 96.4% WALT (YEARS) 3.7 CONTRACT YIELD 6.")
 100% WALT (YEARS) 6.6 CONTRACT YIELD 6.")
9 INDUSTRIAL OFFICE RETAIL Sector Summary NUMBER OF BUILDINGS 37 MARKET VALUE OF ASSETS ($M) $670.0 OCCUPANCY (BY INCOME) 100% WALT (YEARS) 7.0 CONTRACT YIELD 6.5% NUMBER OF BUILDINGS 16 MARKET VALUE OF ASSETS ($M) $596.8 OCCUPANCY (BY INCOME) 96.4% WALT (YEARS) 3.7 CONTRACT YIELD 6.9% NUMBER OF BUILDINGS 9 MARKET VALUE OF ASSETS ($M) $356.2 OCCUPANCY (BY INCOME) 100% WALT (YEARS) 6.6 CONTRACT YIELD 6.5% Data as at 30 September Contract yields exclude NZ Post and Stewart Dawson Corner. 9

 103.1 56 Jamaica Drive Land Wellington 1.1 15 Unity Drive Land Auckland 4.4 246 Puhinui Road Land Auckland 3.")
10 Value Add The following properties have been designated as Value Add and make up ~7% of the total portfolio: Property Sector Location Valuation $m Springs Road, East Tamaki Industrial Auckland Springs Road, East Tamaki Industrial Auckland Albany Highway, Albany Industrial Auckland Great South Road, Penrose Industrial Auckland Khyber Pass Road, Grafton Office / Retail Wellington Willis Street Retail Wellington Hutt Road, Kaiwharawhara Retail Wellington 16.3 Stewart Dawsons Corner Retail Wellington 17.7 TOTAL $m (excl. land) Jamaica Drive Land Wellington Unity Drive Land Auckland Puhinui Road Land Auckland Roscommon Road, Wiri Land Auckland 8.7 TOTAL $m As at 30 September
11 7 Waterloo Quay Update Damage Assessment Interim damage assessment reports and reinstatement scope reports with insurers. Next stage is cost assessment which should be completed by early Insurance Claim Six interim claims made under Argosy s material damage and business interruption insurance. Total received to 31 October is $14.9m (after deductible). In the interim period $2.3m has been allocated to loss of rents and $2.8m to material damage reinstatement. Reinstatement Reinstatement of affected floors will be complete by March 2019 (apart from level 12). Recent changes in the method of measurement for seismic resilience has meant an upgrade is required to bring the building up to required standard for long term government occupation. Cost is not final but estimated at $15-20m to complete this work. All works to enable leasing expected to be complete by September Leasing NZ Post to pay Argosy a termination fee of $2.9m on 30 November Calculated based on previous rent for levels 2-4 and 7 from 30 November through to 31August Office leasing environment in Wellington is favourable and currently in negotiations for the remaining space. 11
12 Revaluations 30 Sep 18 Book Value ($m) 30 Sep 18 Valuation ($m) Δ $m Δ % Market Yield * 30 Sep Mar 18 Auckland 1, , % 6.50% 6.75% Wellington (0.8) -0.2% 7.32% 7.60% North Island Regional & South Island % 7.47% 7.96% Total 1, , % 6.70% 6.98% 30 Sep 18 Book Value ($m) 30 Sep 18 Valuation ($m) Δ $m Δ % Market Yield * 30 Sep Mar 18 Industrial % 6.54% 6.74% Office (0.7) -0.1% 7.23% 7.37% Retail % 6.23% 6.80% Total 1, , % 6.70% 6.98% Solid revaluation gain 2.2% above book value Regionally, Auckland biggest contributor Wellington office: Stout Street recorded $4m increase but overall result offset by 7 Waterloo Quay Big increases for two Auckland retail assets in Albany and 320 Ti Rakau Drive following leasing successes there. Portfolio market yield¹ firmed 28bps with Auckland firming 25bps and Retail 57bps 1 Yields exclude Waterloo Quay and Stewart Dawson Corner. Due to rounding, numbers presented in this presentation may not add up exactly to the totals provided and percentages may not exactly reflect absolute figures. 12

13 FINANCIALS Change image 13


14 Income Reconciliation 14
15 Financial Performance 1H19 1H18 $m $m Net property income Administration expenses (5.1) (4.7) Profit before financial income/(expenses), other gains/(losses) and tax Interest expense (12.2) (12.6) Gain/(loss) on derivatives (1.5) (2.7) Revaluation gains Realised gains/(losses) on disposal Net: Insurance proceeds & earthquake expense 1.7 (1.3) Profit before tax Taxation expense (4.5) (4.3) Like-for-like growth of 5.5% driving increase in net income Expenses up due to mixture of restructuring and additional resourcing costs across the business Interim revaluation gains largely driven by cap rate firming Solid realised gains in favourable vendor market Profit after tax Basic and diluted earnings per share (cents) Note: Due to rounding, numbers presented in this presentation may not add up exactly to the totals provided and percentages may not exactly reflect the absolute figures. 15
16 Distributable Income 1H19 1H18 $m $m Profit before income tax Adjusted for: Revaluations gains (34.6) - Realised losses/(gains) on disposal (2.9) (0.2) Derivative fair value loss/(gain) Earthquake expense net of recoveries Gross distributable income Depreciation recovered Current tax expense (4.9) (5.3) Net distributable income Weighted average number of ordinary shares (m) Current tax slightly lower due to disposal write-downs at 7 Waterloo Quay and Wyndham St Gross distributable income per share (cents) Net distributable income per share (cents) Net distributable income per share up by 8.8% 16


17 Investment Properties Portfolio growth driven by a combination of capital projects, acquisitions and revaluation gains. 17

18 Movement in NTA per share Interim revaluation gain strong driver of ~4.5% uplift for the period. 18
19 Gearing 1H19 FY18 $m $m Investment properties 1, ,513.1 Assets held for sale Other assets Total assets 1, ,544.8 Bank debt (excl. capitalised borrowing costs) Debt-to-total-assets ratio 36.8% 35.9% The asset held for sale is 626 Gt South Rd (Auckland), sold for $10.6m and which settles in November The sale of 626 Great South Road and further divestments recently announced totalling ~$46m will reduce gearing by approximately 2.2%. Target policy gearing range is between 30-40%. 36.8% 19 Debt-to-total assets ratio
20 Funding & Interest Rate Management Argosy maintains strong relationships with its banking partners ANZ Bank New Zealand Limited, Bank of New Zealand and The Hongkong and Shanghai Banking Corporation Limited, and remains well within its banking covenants. Argosy restructured its syndicated bank facility in October 2018, by adding a further tranche of $25 million, expiring October 2020 (Tranche E). Argosy is reviewing its long term debt funding options with a view to diversifying its debt funding base over the next 12 months. 1H19 FY18 Weighted average duration of bank facility 2.6 years 3.1 years Weighted average interest rate % 4.98% Interest Cover Ratio 3.3x 3.3x % of fixed rate borrowings 57% 62% Average fixed interest rate % 4.56% 3.3x ¹ Including margin and line fees 2 Excluding margin and line fees 20 Interest Cover Ratio
21 Dividends A second quarter cash dividend of cents per share has been declared, with imputation credits of cents per share attached, and will be paid on 19 December FY19 dividend guidance of 6.25 cents per share remains unchanged, an increase of ~1.0% on the previous year. The FY19 dividend reflects the Board s wish for shareholders to share in the continued strong results whilst allowing Argosy to maintain its momentum towards an AFFO based dividend policy by c 19 Dec FY19 dividend guidance 2 nd quarter dividend paid 21

22 Leasing Update Change image 22
23 Leasing Success Strong results over the first half of the year, maintaining a high portfolio WALT of 5.6 years. 24 leasing transactions completed during the period, totalling ~39,500m² of NLA. Notable leasing successes include: Property Tenant NLA (sqm) Lease Term 320 Ti Rakau Drive, East Tamaki, Auckland Bunnings Limited 12, years Albany Lifestyle Centre, Albany, Auckland E Road Limited 1,690 9 years Albany Lifestyle Centre, Albany, Auckland Peterken Enterprises Ltd 1,225 6 years Albany Mega Centre, Albany, Auckland Outdoor Holdings Ltd years Property Some larger FY19 lease expiries to address include: Tenant NLA (sqm) Status 147 Gracefield Road, Wellington The Information Management Group 8,018 In discussions with tenant 8-14 Willis Street, Wellington Reserve Bank of New Zealand 3,234 In discussions with tenant Albany Mega Centre, Auckland North Beach Trading Limited 1,085 In discussions with tenant 23

24 Lease Maturity Normalised lease maturity profile relatively stable over the medium term. Government tenants showing strong interest in 7 Waterloo Quay space. Levels 2-4 and 7 of 7 Waterloo Quay paid through to 31 August
25 NZ Market Update Office Flexible working environments driving disconnect between employment growth and net absorption. Structural trend is occupiers relocating taking ~10% less space per person than they had previously. Rental growth impacted by new supply and there has been an increase in incentives to reflect this. The 2016 earthquake created structural change in the Wellington market, strong demand, low vacancy and stock levels. There is a shortage of large floor plate/high quality stock with upward rental growth pressure as a result. Prime vacancy is minimal given pending new supply. Market vacancy is mostly C grade stock. Industrial Retail Steady economic growth driving occupier demand. Offshore capital flows driving yields/cap rates lower. Continued low supply forecast with 1.4% new supply expected per annum between Land values are at historic highs. New rental benchmarks being set with ~$ m2 for prime warehouse. Vacancy at historic lows for both prime and secondary (< 2%). Generally a more negative retail spending outlook. Waning migration, increasing fuel prices and flat housing prices are providing headwinds. However, some offset from rising minimum wage and a booming tourism sector. Approximately 200,000m2 of retail space to be added by Continued increase in online retailing. Large format retail expected to see biggest rental growth. 25

26 Looking Ahead Change image 26
27 Looking ahead Income and earnings sustainability Earnings per share growth AFFO based dividend policy in medium term Sound capital position Liquid, flexible and diverse capital base Longer term debt options being considered Improve portfolio metrics and quality Reduce key vacancies and proactive management of expiry profile Undertake Value Add projects to enhance portfolio quality Corporate governance Maintain appropriate Board composition to deliver strategy Ongoing commitment to corporate governance best practice 27
28 Appendices 28
29 Adjusted Funds from Operations (AFFO) 1H19 1H18 $m $m Net distributable income Amortisation of tenant incentives and leasing costs Funds from operations (FFO) Capitalisation of tenant incentives and leasing costs (3.0) (1.8) Maintenance capital expenditure (2.5) (3.6) Tax effected maintenance capital expenditure recovered Adjusted funds from operations (AFFO) Weighted average number of shares on issue (m) AFFO per share (cents) Dividends paid/payable in relation to period Dividend payout ratio (to AFFO) 102% 110% +9.2% +8.1% +9.0% Note: Due to rounding, numbers presented in this presentation may not add up exactly to the totals provided and percentages may not exactly reflect absolute figures. AFFO is an alternative performance measure used to assist investors in assessing the Company s underlying performance and to determine income available for distribution. This reconciliation is based on guidelines for disclosing AFFO as provided by the Property Council of Australia. 29
30 Rent Reviews Type # Previous Rent (000's) New rent (000's) $ Increase (000's) % Increase Annualised $ Increase (000's) Annualised % Increase % of rent reviewed Total 42 15,508 16, % % 100.0% By review type Fixed 27 8,792 9, % % 56.7% Market 4 2,200 2, % % 14.2% CPI 11 4,516 4, % % 29.1% By sector Industrial 9 7,802 8, % % 50.3% Office 17 2,719 2, % % 17.5% Retail 16 4,987 5, % % 32.2% By location Auckland 36 12,943 13, % % 83.5% Wellington 5 1,854 1, % % 12.0% Other % % 4.5% 30
31 Rent Reviews Auckland # Previous Rent (000's) New rent (000's) $ Increase (000's) % Increase Annualised $ Increase (000's) Annualised % Increase % of rent reviewed Office 14 2,195 2, % % 13.8% Industrial 6 5,760 5, % % 44.5% Retail 16 4,988 5, % % 41.7% 36 12,943 13, % % 100.0% Wellington Office % % 28.2% Industrial 2 1,331 1, % % 71.8% Retail % 0 0.0% 0.0% 5 1,854 1, % % 100.0% 31
32 Portfolio Metrics The strength of our diversified portfolio is in the breadth and depth of our tenant base and sectors they represent. Rent Roll by Industry Government Administration Retail Transport and Storage Top 10 Customers by Rent MBIE NZ Post General Distributors Cardinal Logistics Manufacturing The Warehouse Property & Business Services Ezibuy Wholesale Trade Finance and Insurance Government Property Services (MBIE) Mitre 10 Te Puni Kokiri Electricity, Gas and Water Supply Tonkin & Taylor All other All other Note: Data as at 30 September
33 Portfolio Snapshot Our focus is delivering improved portfolio quality and is reflected in our strong portfolio metrics Occupancy WALT (years) 100.0% % % % % % FY15 FY16 FY17 FY18 1H FY15 FY16 FY17 FY18 1H19 Net Tangible Assets Debt-to-total-assets $ % $1.20 $ % 35.0% 30.0% $ % $ % $0.40 $ % 10.0% 5.0% $0.00 FY15 FY16 FY17 FY18 1H19 0.0% FY15 FY16 FY17 FY18 1H19 33
34 Disclaimer This presentation has been prepared by Argosy Property Limited. The details in this presentation provide general information only. It is not intended as investment or financial advice and must not be relied upon as such. You should obtain independent professional advice prior to making any decision relating to your investment or financial needs. This presentation is not an offer or invitation for subscription or purchase of securities or other financial products. Past performance is no indication of future performance. All values are expressed in New Zealand currency unless otherwise stated. 20 November
2018 Retail Roadshow Presentation
 2018 Retail Roadshow Presentation Argosy Property Limited 28 May 2018 to 18 June 2018 www.argosy.co.nz AGENDA Highlights Page 4 Financials Page 6 Strategy Page 16 Leasing Update Page 31 Outlook Page 35
Annual Results Presentation
 Annual Results Presentation Argosy Property Limited 25 May 2017 www.argosy.co.nz Agenda Highlights Page 4 Financials Page 6 Strategy Overview Page 16 Leasing Update Page 26 Outlook Page 30 PRESENTED BY:
MARKET RELEASE ARGOSY 2019 INTERIM RESULT BUILDING MOMENTUM FOR THE 6 MONTHS TO 30 SEPTEMBER November 2018
 20 November 2018 MARKET RELEASE ARGOSY 2019 INTERIM RESULT BUILDING MOMENTUM FOR THE 6 MONTHS TO 30 SEPTEMBER 2018 Argosy will present the 2019 interim results via a teleconference and webcast at 10am
BNZ/NAB First Look Investor Conference Sydney, st October 2018
 BNZ/NAB First Look Investor Conference Sydney, 30-31 st October 2018 Strength in diversity Argosy Property Limited www.argosy.co.nz Agenda 1. Argosy at a Glance 3 2. History 4 3. Investment Strategy /
MARKET RELEASE ARGOSY 2018 ANNUAL RESULT FOR THE 12 MONTHS TO 31 MARCH May 2018
 23 May 2018 MARKET RELEASE ARGOSY 2018 ANNUAL RESULT FOR THE 12 MONTHS TO 31 MARCH 2018 Argosy will present the 2018 annual results via a teleconference and webcast at 10am today. Please visit https://edge.media-server.com/m6/go/argosy-annual-results-2018
MARKET RELEASE ARGOSY 2018 INTERIM RESULT FOR THE SIX MONTHS TO 30 SEPTEMBER November 2017
 21 November 2017 MARKET RELEASE ARGOSY 2018 INTERIM RESULT FOR THE SIX MONTHS TO 30 SEPTEMBER 2017 Argosy will present the 2018 interim results via a teleconference and webcast at 10am today. Please visit
HIGHLIGHTS PROPERTY FOR INDUSTRY 2018 INTERIM RESULTS BRIEFING
 HIGHLIGHTS Significant portfolio activity: 58,000 square metres or 8% of the portfolio leased during the interim period to 11 tenants for an average increase in term of 6.5 years Increased earnings and
HIGHLIGHTS PROPERTY FOR INDUSTRY 2017 ANNUAL RESULTS BRIEFING
 HIGHLIGHTS Significant acquisition activity: $84.3 million of property acquired, improving portfolio metrics and providing significant medium to long-term development potential Transition of the Penrose
HIGHLIGHTS PROPERTY FOR INDUSTRY 2017 INTERIM RESULTS BRIEFING
 HIGHLIGHTS Internalisation of management on 30 June 2017 Increased guidance: distributable profit of between 7.70 and 7.90 cents per share, cash dividend of 7.45 cents per share Transition of the Penrose
PRESENTING TODAY. Craig Peirce Chief Finance and Operating Officer. Simon Woodhams Chief Executive Officer
 PRESENTING TODAY Simon Woodhams Chief Executive Officer Craig Peirce Chief Finance and Operating Officer 2 2018 HIGHLIGHTS Increased earnings and dividends: profit after tax up $58.4 million, 3.2% increase
INTERIM RESULTS 31 DECEMBER 2016
 INTERIM RESULTS 31 DECEMBER 2016 BUILDING A HEALTHY FUTURE 23 February 2017 David Carr, Chief Executive Officer Stuart Harrison, Chief Financial Officer AGENDA Highlights Strategy Financials Portfolio
EARNINGS AND DIVIDEND GROWTH, MANAGEMENT TRANSITION
 EARNINGS AND DIVIDEND GROWTH, MANAGEMENT TRANSITION The PFI management team will present these results via live webcast from 10.30 am NZT today. To view and listen to the webcast, please visit https://edge.media-server.com/m6/p/3d97n233.
PCT announces full year profit of $162.1 million
 NZX announcement 17 August 2017 PCT announces full year profit of $162.1 million Performance summary for the twelve months ended 30 June 2017 17.3% rise in net profit after tax and 3.6% increase in dividend
Interim Results. For the six months ended 30 September 2016
 Interim Results For the six months ended 30 September 2016 Agenda & Contents Highlights Financial Performance Capital Management Portfolio Overview Development Projects Acquisitions Strategy Overview Conclusion
Stride Property Group (NS) Annual Results For the year ended 31 March 2018
 Annual Results For the year ended 31 March 2018") Stride Property Group (NS) Annual Results For the year ended 31 March 2018 30 May 2018 Agenda and Contents Page Welcome Highlights 3 Strategy 5 Philip Littlewood Chief Executive Officer Financial Performance
Stride Property Group (NS) Annual Results For the year ended 31 March 2018 30 May 2018 Agenda and Contents Page Welcome Highlights 3 Strategy 5 Philip Littlewood Chief Executive Officer Financial Performance
Interim Results For the six months ended 30 September 2017
 Interim Results For the six months ended 30 September 2017 Agenda & Contents Page Welcome Highlights 3 Financial Performance 6 Capital Management 10 Portfolio Overview 12 Development Project 16 Asset Management
AGENDA. 1. Highlights 2. Portfolio 3. Market & Strategy Annual Results 5. Capital Management 6. Closing & Questions 7.
 AGENDA 1. Highlights 2. Portfolio 3. Market & Strategy 4. 2015 Annual Results 5. Capital Management 6. Closing & Questions 7. Appendices 2 HIGHLIGHTS Profit after tax for the year of $72.8 million or
Precinct Properties New Zealand Interim Results. 28 February 2018
 Precinct Properties New Zealand Interim Results 28 February 2018 Agenda Highlights Page 3 Section 1 Strategy progress Page 4 Section 2 Development summary Page 6 Section 3 Interim results and capital management
2016 FINANCIAL YEAR RESULTS PRESENTATION
 2016 FINANCIAL YEAR RESULTS PRESENTATION 22 August 2016 www.industriareit.com.au ASX CODE: IDR Agenda 01 Highlights and Investment Proposition 02 Financial results 03 Portfolio performance 04 Capital management
PFI s strategy is to invest in quality industrial property in prime locations in order to deliver attractive returns with a low level of volatility
 PFI OVERVIEW Property for Industry (PFI) is an NZX listed property vehicle focused on industrial property PFI s strategy is to invest in quality industrial property in prime locations in order to deliver
16.1c c c
 1 2016 Interim Result Highlights Successful delivery, ahead of PDS 2 Exceeded revised earnings guidance Six months to 31 Dec 15 Solid capital management 7.97c 7.65c $2.15 28.3% Earnings per unit Distribution
Stride Property Group (NS) Interim Results For the six months ended 30 September 2016
 Interim Results For the six months ended 30 September 2016") Stride Property Group (NS) Interim Results For the six months ended 30 September 2016 17 November 2016 Agenda & Contents Page Highlights 3 Peter Alexander Chief Executive Financial Performance 7 Capital
Stride Property Group (NS) Interim Results For the six months ended 30 September 2016 17 November 2016 Agenda & Contents Page Highlights 3 Peter Alexander Chief Executive Financial Performance 7 Capital
Record after-tax profit delivered in strong year
 NZX RELEASE 16 May 2016 Record after-tax profit delivered in strong year Kiwi Property today announced a record result, delivering an after-tax profit of $250.8 million 1 for the year ended 31 March 2016,
Multiplex Prime Property Fund
 Multiplex Prime Property Fund 2009 Interim Results 23 February 2009 1 Important Notices Whilst every effort is made to provide accurate and complete information, this presentation has been prepared in
Stride Property Group. Interim Report For the six months ended 30 September 2017
 Stride Property Group Interim Report For the six months ended 30 September 2017 Contents 2 Highlights 4 Stride Property Group s Leading Business Model 6 Owned and Managed Properties 7 Portfolio Composition
FIXED RATE SENIOR SECURED BOND OFFER
 FIXED RATE SENIOR SECURED BOND OFFER July 2014 Arranger and Joint Lead Manager Joint Lead Manager Joint Lead Manager 1 DISCLAIMER A simplified disclosure prospectus (SDP) dated 1 July 2014 has been prepared
For personal use only
 17 August 2016 2016 Annual results Positioned for future growth DEXUS Property Group (DEXUS) today posted a strong 2016 financial result, with Funds from Operations and distribution per security growth
ANNUAL RESULTS 30 JUNE 2015
 ANNUAL RESULTS 30 JUNE 2015 SECURING TODAY, WITH A FOCUS ON TOMORROW 12 August 2015 David Carr, Chief Executive Officer Stuart Harrison, Chief Financial Officer AGENDA Result summary Financial summary
Financial Results for 4 th Quarter 2017 and Year Ended 31 December 2017
 Financial Results for 4 th Quarter 2017 and Year Ended 31 December 2017 31 January 2018 Important Notice This presentation shall be read in conjunction with OUE Commercial REIT s Financial Results announcement
Australian Unity Office Fund
 Australian Unity Office Fund (ASX: AOF) 2018 Full Year Results Presentation 24 August 2018 Webcast: https://fnn.webex.com/fnn/onstage/g.php?mtid=e0f48b0535622fe807610ffb3ef1ac4ab Teleconference details:
GMT+ Full year results to 31 March 2013
 GMT+ Full year results to 31 March 2013 Contents + Section 01 Overview + Section 02 Financial overview + Section 03 Investment activity + Section 04 Investment portfolio + Section 05 Development portfolio
INTERIM REPORT THE PROPERTIES OF QUALITY GMT BOND ISSUER LIMITED GOODMAN PROPERTY TRUST. Interim Report Interim Report 2017
 INTERIM REPORT 2017 THE PROPERTIES OF QUALITY GOODMAN PROPERTY TRUST Interim Report 2017 GMT BOND ISSUER LIMITED Interim Report 2017 CONTENTS GOODMAN PROPERTY TRUST Interim Report 2017 GMT BOND ISSUER
INTERIM RESULTS 31 DECEMBER 2014
 INTERIM RESULTS 31 DECEMBER 2014 DEVELOPING OUR PORTFOLIO DELIVERING ON STRATEGY 26 February 2015 David Carr, Chief Executive Officer Stuart Harrison, Chief Financial Officer AGENDA Result summary Financial
ING Medical Properties Trust (NZSX: IMP)
") ING Medical Properties Trust (NZSX: IMP) Investor roadshow presentation May/June 2010 David Carr, General Manager and Stuart Harrison, Chief Financial Officer www.ingmedicalproperties.co.nz Columba, Ascot
ING Medical Properties Trust (NZSX: IMP) Investor roadshow presentation May/June 2010 David Carr, General Manager and Stuart Harrison, Chief Financial Officer www.ingmedicalproperties.co.nz Columba, Ascot
Precinct Properties New Zealand Annual Results. August Developing the future
 Precinct Properties New Zealand Annual Results August 2017 Developing the future Agenda Highlights Page 3 Section 1 Strategy Page 4 Section 2 Major initiatives Page 12 Section 3 Financial results and capital
ASX/Media Announcement
 ASX/Media Announcement 13 February 2018 Propertylink delivers a strong HY18 result, well positioned to deliver FY18 guidance Propertylink Group (ASX:PLG) today announces strong financial and operational
Arena Office Fund FY14 annual results presentation. 3 September 2014
 Arena Office Fund FY14 annual results presentation 3 September 2014 www.arenainvest.com.au Presenters James Goodwin Andrew Nicol Rob de Vos Joint Managing Director Appointed to the Board in January 2012.
OPERATIONAL HIGHLIGHTS
 Dexus (ASX:DXS) ASX release 14 February 2018 2018 Half year results Positive momentum Dexus today announced a strong result for the first six months of FY18 and upgraded its guidance for distribution per
Australian Education Trust
 Australian Education Trust ASX ANNOUNCEMENT 18 February 2014 AET Results for the Half-Year Ended 31 December 2013 Folkestone Investment Management Limited (FIML) as the Responsible Entity of the Australian
nzx release+ GMT Strategy Delivering Quality Results Date 18 May 2017 Release Immediate
 nzx release+ GMT Strategy Delivering Quality Results Date 18 May 2017 Release Immediate, the manager of Goodman Property Trust ( GMT or Trust ) is pleased to announce the Trust s financial results for
Centuria Urban REIT 576 SWAN STREET, RICHMOND VIC
 Centuria Urban REIT 576 SWAN STREET, RICHMOND VIC PAGE 01 01. 02. 03. 04. 05. Results Overview Porfolio Overview Capital Mangement Strategy & Guidance Appendices Results Overview Section 1 Results Overview
For personal use only
 NATIONAL STORAGE REIT JP MORGAN AUSTRALIAN REIT FORUM ASIA MARCH 2017 IMPORTANT NOTE & DISCLAIMER This presentation has been prepared by National Storage REIT ( NSR ) comprising National and may involve
SCA PROPERTY GROUP. 12 December Kwinana Marketplace, WA
 SCA PROPERTY GROUP 12 December 2017 Kwinana Marketplace, WA SCP HISTORY SCP was created by Woolworths Limited and listed on the ASX in December 2012 to act as a landlord for a number of its shopping centres
Interim Result. Goodman Property Trust
 Interim Result 2019 Goodman Property Trust Contents Overview 3 Presented by: John Dakin Chief Executive Officer Andy Eakin Chief Financial Officer James Spence Director Investment Management Financial
INTERIM REPORT AS AT 31 DECEMBER 2017 INVESTING IN AUSTRALASIA'S HEALTHCARE INFRASTRUCTURE
 INTERIM REPORT AS AT 31 DECEMBER 2017 INVESTING IN AUSTRALASIA'S HEALTHCARE INFRASTRUCTURE Vital is commited to working with our operating partners and their patients to achieve positive healthcare outcomes.
Corporate profile. Strong foundations Positive momentum. years being listed as Dexus
 Corporate profile Strong foundations Positive momentum years being listed as Dexus Company overview Dexus is a Top 50 entity by market capitalisation listed on the Australian Securities Exchange (trading
FINANCIAL STATEMENTS GOODMAN PROPERTY TRUST PROFIT OR LOSS 22 BALANCE SHEET 23 CASH FLOWS 24 CHANGES IN EQUITY 25
 GOODMAN PROPERTY TRUST for the year ended 31 March 2017 CONTENTS PROFIT OR LOSS 22 BALANCE SHEET 23 CASH FLOWS 24 CHANGES IN EQUITY 25 The Board of Goodman (NZ) Limited, the Manager of Goodman Property
Annual Results FY A U G U S T V I T A L H E A L T H C A R E P R O P E R T Y T R U S T
 V I T A L H E A L T H C A R E P R O P E R T Y T R U S T Annual Results FY 2 0 1 8 0 9 A U G U S T 2 0 1 8 IN V E S T IN G IN A U S T R A L A S IA S H E A L T H C A R E IN F R A S T R U C T U R E H I G
Overview 3 Financial Summary 5 Investment Portfolio 11 Development Update 15 Summary & Outlook 22. Appendices 25. Presented by:
 1 Presented by: John Dakin Chief Executive Officer Andy Eakin Chief Financial Officer James Spence Director Investment Management Overview 3 Financial Summary 5 Investment Portfolio 11 Development Update
SGX - DBS Vickers - REITAS SREITS Corporate Day Investor Presentation
 SGX - DBS Vickers - REITAS SREITS Corporate Day Investor Presentation 27 Feb 1 Mar 2018 Important Notice This presentation shall be read in conjunction with OUE Commercial REIT s Financial Results announcement
Financial Results for 3 rd Quarter November 2017
 Financial Results for 3 rd Quarter 2017 2 November 2017 Important Notice This presentation shall be read in conjunction with OUE Commercial REIT s Financial Results announcement for 3Q 2017 dated 2 November
Goodman Property Trust Financial Statements For the year ended 31 March 2018
 Goodman Property Trust Financial Statements The Board of Goodman (NZ) Limited, the Manager of Goodman Property Trust, authorised these financial statements for issue on 28 May 2018. For and on behalf of
Amount $000's. Amount. Imputed amount Foreign tax credit per share. per share per share Dividend payable N/A. N/A N/A Special dividend payable
 Trustpower Limited Results for announcement to the market Reporting period 6 months to 30 September 2016 Previous reporting period 6 months to 30 September 2015 Amount $000's Percentage change Revenue
31 DECEMBER 2014 HALF YEAR RESULTS PRESENTATION. 19 February 2015
 31 DECEMBER 2014 HALF YEAR RESULTS PRESENTATION 19 February 2015 Contents Results Highlights Financial Results Portfolio Performance Capital Management Industria REIT Overview Outlook & Guidance Appendices
11 February 2019 Charter Hall Long WALE REIT FY19 Half Year Results 6 months to 31 December 2018 Optima Centre, Perth, WA
 11 February 2019 Charter Hall Long WALE REIT FY19 Half Year Results 6 months to 31 December 2018 Optima Centre, Perth, WA 2019 half year results Agenda 1. FY19 half year highlights 3 2. Financial performance
For personal use only
 GROWTHPOINT PROPERTIES AUSTRALIA TRUST ARSN 120 121 002 GROWTHPOINT PROPERTIES AUSTRALIA LIMITED ABN 33 124 093 901 AFSL 316409 ASX ANNOUNCEMENT GROWTHPOINT PROPERTIES AUSTRALIA (ASX Code: GOZ) RESULTS
VECTOR LIMITED Financial and Operational Results
 Financial and Operational Results HALF YEAR ENDED 31 DECEMBER 2015 Disclaimer This presentation contains forward-looking statements. Forward-looking statements often include words such as "anticipates",
PROPERTY FUND 2015 FULL YEAR RESULTS PRESENTATION 28 AUGUST GARDA DIVERSIFIED PROPERTY FUND 2015 FULL YEAR RESULTS PRESENTATION
 INSERT GARDA TITLE DIVERSIFIED HERE PROPERTY FUND 2015 FULL YEAR RESULTS PRESENTATION 28 AUGUST 2015 1 GARDA DIVERSIFIED PROPERTY FUND 2015 FULL YEAR RESULTS PRESENTATION CONTENTS GARDA DIVERSIFIED PROPERTY
GOODMAN BONDS FEBRUARY 2018
 GOODMAN BONDS FEBRUARY 2018 Arranger and Joint Lead Manager Joint Lead Managers This presentation contains the key terms of an offer of fixed rate secured debt securities by GMT Bond Issuer Limited (Issuer),
INTERIM REPORT AS AT 31 DECEMBER 2016 BUILDING A HEALTHY FUTURE SOUTH EASTERN PRIVATE HOSPITAL, VIC
 INTERIM REPORT AS AT 31 DECEMBER 2016 BUILDING A HEALTHY FUTURE SOUTH EASTERN PRIVATE HOSPITAL, VIC Vital's continued strong financial and portfolio position sees it well positioned to build a healthy
AUGUSTA CAPITAL LIMITED FY2017 ANNUAL RESULT BRIEFING. 30 May 2017
 FY2017 ANNUAL RESULT BRIEFING 30 May 2017 FY2017 ANNUAL RESULT BRIEFING Contents 1. HIGHLIGHTS 2. KEY EVENTS 3. ANNUAL RESULTS 4. FUNDS MANAGEMENT 5. LOOKING FORWARD 2 FY2017 ANNUAL RESULT BRIEFING - HIGHLIGHTS
FY17 RESULTS PRESENTATION
 FY17 RESULTS PRESENTATION 23 August 2017 www.industriareit.com.au ASX: IDR Agenda 01 Highlights and financial results 02 Investment Proposition 03 Portfolio performance 04 Outlook Appendices 2 01 FY17
THE PROPERTIES OF QUALITY GOODMAN PROPERTY TRUST
 THE PROPERTIES OF QUALITY GOODMAN PROPERTY TRUST INTERIM RESULT 2017 CONTENTS 01 OVERVIEW 02 FINANCIAL RESULT 03 INVESTMENT PORTFOLIO 04 DEVELOPMENT PORTFOLIO 05 OUTLOOK Appendices 01 OVERVIEW Highbrook
Stride Property Group (NS) Annual Shareholder Meetings
 Annual Shareholder Meetings") Stride Property Group (NS) Annual Shareholder Meetings 2018 Board of Directors Tim Storey Independent John Harvey Independent Michelle Tierney Independent David van Schaardenburg Independent Philip Ling
Stride Property Group (NS) Annual Shareholder Meetings 2018 Board of Directors Tim Storey Independent John Harvey Independent Michelle Tierney Independent David van Schaardenburg Independent Philip Ling
ASX CEO CONNECT PRESENTATION. Viva Energy REIT ASX CEO Connect Presentation 29 March 2018
 ASX CEO CONNECT PRESENTATION Viva Energy REIT ASX CEO Connect Presentation 29 March 2018 AGENDA Highlights 4 Financial Results 7 Portfolio Update 11 Industry Update 18 Strategy & Outlook 20 Questions &
FINANCIAL RESULTS For First Quarter ended 31 March 2015
 FINANCIAL RESULTS For First Quarter ended 31 March 2015 AGENDA Q1 Highlights Financial Performance Portfolio Performance AEI Updates Looking Ahead Unit Performance 2 Q1 HIGHLIGHTS Q1 HIGHLIGHTS FINANCIAL
2017 Annual General Meeting Chairman and CEO Addresses
 ASX Announcement 27 October 2017 2017 Annual General Meeting Chairman and CEO Addresses In accordance with ASX Listing Rule 3.13, attached are the addresses and accompanying presentation slides to be given
INVESTOR BRIEFING. Goodman Property Trust 2018
 INVESTOR BRIEFING Goodman Property Trust 2018 CONTENTS 12 MARCH 2018 Presenters: John Dakin Chief Executive Officer James Spence Director - Investment Management Michael Gimblett General Manager Development
The National Property Trust 2011 Annual Meeting Presentation and NPT Limited Shareholder Briefing
 The National Property Trust 2011 Annual Meeting Presentation and NPT Limited Shareholder Briefing Presented 29 August 2011 by: Jim Sherwin Chairman, The National Property Trust Limited (as at 31 March
Infratil Market Update and Share Buyback 27 September Context
 Infratil Market Update and Share Buyback 27 September 2013 1. Context Infratil has generated total shareholder returns of 17.8% per annum since listing in 1994. This long-term performance has been sustained
Citi-REITAS-SGX C-Suite Singapore REITs and Sponsors Forum
 Citi-REITAS-SGX C-Suite Singapore REITs and Sponsors Forum 23 August 2018 Important Notice This presentation shall be read in conjunction with OUE Commercial REIT s Financial Results announcement for 2Q
3Q2010 Financial Results. 20 October 2010
 3Q2010 Financial Results 20 October 2010 important notice The value of units in CIT ( Units ) and the income derived from them may fall as well as rise. Units are not investments, liabilities or obligations
For personal use only
 Good morning, and welcome to the GPT Metro Office Fund Annual Results for 2015. In recognition of GPT s commitment to a Reconciliation Action Plan, I would like to acknowledge and pay respect to the traditional
Better energy. MERIDIAN ENERGY LIMITED RESULTS PRESENTATION YEAR ENDING 30th June 2014
 Better energy MERIDIAN ENERGY LIMITED RESULTS PRESENTATION YEAR ENDING 30th June 2014 Disclaimer The information in this presentation was prepared by Meridian Energy with due care and attention. However,
Charter Hall Long WALE REIT
 Bunnings, South Mackay, Queensland Australian Tax Office, Adelaide, South Australia Coles Distribution Centre, Perth, Western Australia 18 August 2017 Charter Hall Long WALE REIT FY17 Results Agenda 1.
Important notice and disclaimer
 1 Important notice and disclaimer + This document has been prepared by Goodman Group (Goodman Limited (ABN 69 000 123 071), Goodman Funds Management Limited (ABN 48 067 796 641; AFSL Number 223621) as
building partnerships+
 Goodman Property Trust Interim Report 2014 GMT Bond Issuer Limited Interim Report 2014 building partnerships+ building partnerships+ Long-term relationships with key stakeholders have helped GMT achieve
Sales increased 8.1% to $128.0m (HY17: $118.4m)
") Nick Scali Limited NCK.ASX HY18 Results Presentation 7th February 2018 Key Highlights Sales increased 8.1% to $128.0m (HY17: $118.4m) Sales Like for like sales growth of +2.6% for Nick Scali Furniture
Nick Scali Limited NCK.ASX HY18 Results Presentation 7th February 2018 Key Highlights Sales increased 8.1% to $128.0m (HY17: $118.4m) Sales Like for like sales growth of +2.6% for Nick Scali Furniture
KATHMANDU FY10 RESULTS PRESENTATION
 KATHMANDU FY10 RESULTS PRESENTATION 1 CONTENTS Results Overview Key Line Items Country Results Cash Flow, Dividend, Balance Sheet FY11 Outlook Growth Strategy Update Questions 2 RESULTS OVERVIEW 3 RESULTS
Tegel Group Holdings Limited
 Tegel Group Holdings Limited FY17 Interim Results Presentation 15 December 2016 TEGEL GROUP HOLDINGS LIMITED FY17 INTERIM RESULTS 1 Disclaimer This presentation contains summary information about Tegel
REITs Symposium May 2018
 REITs Symposium 2018 19 May 2018 Important Notice This presentation shall be read in conjunction with OUE Commercial REIT s Financial Results announcement for 1Q 2018 dated 10 May 2018. This presentation
Contents. 2 Highlights. 4 The Investore Premise. 5 Strategy. 6 Chair's Report. 8 Capital Management & Portfolio Overview. 10 Manager's Report
 Interim Report For the six months ended 30 September 2018 Contents 2 Highlights 4 The Investore Premise 5 Strategy 6 Chair's Report 8 Capital Management & Portfolio Overview 10 Manager's Report 12 Featured
Interim Results Presentation. For the six months ended 31 December 2018
 Interim Results Presentation For the six months ended 31 December 2018 1 STEEL & TUBE IS One of New Zealand s leading providers of steel solutions, and a proud New Zealand company, with over 65 years of
Infratil Full Year Results Presentation 18 MAY 2016
 Infratil 2016 Full Year Results Presentation 18 MAY 2016 Full Year Overview Successful divestments lead to record net surplus and opportunity for renewal Record net parent surplus of $438 million boosted
DEXUS Property Group. Institutional placement 3 December m securities at $0.73 to $0.84 raising $286m - $329m
 DEXUS Property Group Institutional placement 3 December 2008 391.7m securities at $0.73 to $0.84 raising $286m - $329m DEXUS Funds Management Limited ABN 24 060 920 783 Australian Financial Services Licence
Bank of Queensland Full year results 31 August Bank of Queensland Limited ABN AFSL No
 Bank of Queensland Full year results 31 August 2013 Bank of Queensland Limited ABN 32 009 656 740. AFSL No 244616. Agenda Result overview Stuart Grimshaw Managing Director and CEO Financial detail Anthony
Highlights. Commonwealth Property Office Fund (CPA) Quarterly update to 31 March April Solid result in a challenging environment
 Quarterly update to 31 March April Solid result in a challenging environment") Commonwealth Property Office Fund (CPA) Quarterly update to 31 March 2013 23 April 2013 Highlights Solid result in a challenging environment 96.2% occupancy 1 4,382 sqm of space leased or renewed WALE
Commonwealth Property Office Fund (CPA) Quarterly update to 31 March 2013 23 April 2013 Highlights Solid result in a challenging environment 96.2% occupancy 1 4,382 sqm of space leased or renewed WALE
THE PROPERTIES OF QUALITY GMT BOND ISSUER LIMITED GOODMAN PROPERTY TRUST. Annual Report 2016
 THE PROPERTIES OF QUALITY A focus on quality encompasses all aspects of our business. CONTENTS 03 EXPERIENCE RESULTS Chairman s Report 17 GMT 07 LEADING FROM THE FRONT Management Report 59 ISSUER 12 PERFORMANCE
Investore Property Limited
 Investore Property Limited Retail Bond Presentation 5 March 2018 Arranger & Joint Lead Manager Joint Lead Managers Disclaimer This presentation has been prepared by Investore Property Limited (Investore)
OSK DMG ASEAN & Hong Kong Corporate Day June 2012
 OSK DMG ASEAN & Hong Kong Corporate Day 26-28 June 2012 2 Important Notice This material shall be read in conjunction with CIT s financial statements for the financial period ended 31 March 2012. The value
For personal use only
 AIMS Property Securities Fund (APW or the Fund) AIMS Fund Management Limited (AIMS or the Responsible Entity) Annual Results Presentation August 2015 Balance Sheet 2015 2014 Current Assets Cash and cash
Financial Results for the Quarter / Year Ended 31 Mar April 2012
 Financial Results for the Quarter / Year Ended 31 Mar 2012 19 April 2012 Disclaimer This Presentation is focused on comparing results for the three months ended 31 Mar 2012 versus results achieved in the
Financial Results for 3 rd Quarter 2016
 Financial Results for 3 rd Quarter 2016 1 November 2016 Important Notice This presentation shall be read in conjunction with OUE Commercial REIT s Financial Results announcement for 3Q 2016 dated 1 November
For personal use only
 Growthpoint Properties Australia (ASX Code: GOZ) Half Year Results Presentation Six Months Ended 31 December 2011 20 February 2012 Growthpoint Properties Australia Trust ARSN 120 121 002 Growthpoint Properties
ALE Property Group December 2014 Half Year Results 5 February 2015
 ALE Property Group December 2014 Half Year Results 5 February 2015 The Breakfast Creek Hotel, Brisbane, QLD New: Follow ALE Property on: 1 Contents Highlights December 2014 Half Year Results Properties
An investor/analyst briefing teleconference call, with a question and answer session, will be held on 4 August 2016 at 10:00am AEST (8.00am AWST).
.") 4 August 2016 The Manager Company Announcements Office Australian Securities Exchange Limited Level 4 20 Bridge Street SYDNEY NSW 2000 Dear Sir/Madam BWP results for the full-year ended 30 June 2016 In
4 August 2016 The Manager Company Announcements Office Australian Securities Exchange Limited Level 4 20 Bridge Street SYDNEY NSW 2000 Dear Sir/Madam BWP results for the full-year ended 30 June 2016 In
Management Discussion and Analysis. Macquarie Group. Year ended 31 March 2016 MACQUARIE GROUP LIMITED ACN
 Management Discussion and Analysis Macquarie Group Year ended 31 March 2016 MACQUARIE GROUP LIMITED ACN 122 169 279 The Holey Dollar In 1813 Governor Lachlan Macquarie overcame an acute currency shortage
For personal use only
 ASX / MEDIA ANNOUNCEMENT 9 February 2015 SCA PROPERTY GROUP ANNOUNCES FIRST HALF FY15 RESULTS SCA Property Group (ASX: SCP) ( SCP or the Group ) announces its results for the six months ended 31 December
Financial Results for 4 th Quarter and Year Ended 31 December January 2019
 Financial Results for 4 th Quarter and Year Ended 31 December 2018 30 January 2019 Important Notice This presentation should be read in conjunction with the announcements released by OUE Commercial REIT
Fliway Group Limited Results for announcement to the market NZX Appendix 1. 6 months to 31 December months to 31 December 2015
 Fliway Group Limited Results for announcement to the market NZX Appendix 1 Reporting Period 6 months to 31 December 2016 Previous Reporting Period 6 months to 31 December 2015 Amount (000s) Percentage