TEXAS STATE UNIVERSITY SYSTEM. Investment Report For the Quarter Ended February 29, 2016
|
|
|
- Camron Black
- 5 years ago
- Views:
Transcription

1 TEXAS STATE UNIVERSITY SYSTEM Investment Report For the Quarter Ended February 29, 2016
2 Texas State University System Consolidated Institutions OPERATING & NON OPERATING QUARTERLY INVESTMENT REPORT PERIOD ENDING 02/29/2016 (TRADE DATE FULL ACCRUAL BASIS) Agency/Description Beginning Market Value Ending Market Value Book Balance Quarter Ending 02/29/16 As of 11/30/15 As of 02/29/16 As of 02/29/16 Investment Income Return Operating Short-Intermediate Lamar University $ 67,861, $ 96,430, $ 96,430, $ 41, % Sam Houston State University $ 83,650, $ 129,540, $ 129,907, $ 238, % Sul Ross State University $ 21,138, $ 24,457, $ 24,457, $ 17, % Texas State University $ 248,955, $ 303,943, $ 304,021, $ 174, % Lamar Institute of Technology $ 5,770, $ 7,366, $ 7,366, $ 3, % Lamar State College - Orange $ 19,553, $ 21,258, $ 21,258, $ 13, % Lamar State College - Port Arthur $ 6,681, $ 7,533, $ 7,533, $ 7, % Texas State University System Office $ 17,101, $ 18,316, $ 18,316, $ 10, % Operating Short-Intermediate Total $ 470,713, $ 608,847, $ 609,292, $ 507, % 6 Month T-Bill 0.17% Operating Long Lamar University $ - $ - $ - $ - - Sam Houston State University $ 27,033, $ 26,197, $ 27,351, $ 314, % Sul Ross State University $ - $ - $ - $ - - Texas State University $ 79,541, $ 80,022, $ 79,213, $ 510, % Lamar Institute of Technology $ - $ - $ - $ - - Lamar State College - Orange $ - $ - $ - $ - - Lamar State College - Port Arthur $ - $ - $ - $ - - Texas State University System Office $ - $ - $ - $ - - Operating Long Total $ 106,574, $ 106,220, $ 106,565, $ 825, % ML 1-3 Year Treasury 0.63% 1
3 Texas State University System Consolidated Institutions OPERATING & NON OPERATING QUARTERLY INVESTMENT REPORT PERIOD ENDING 02/29/2016 (TRADE DATE FULL ACCRUAL BASIS) Agency/Description Beginning Market Value Ending Market Value Book Balance Quarter Ending 02/29/16 As of 11/30/15 As of 02/29/16 As of 02/29/16 Investment Income Return Bond Proceeds Lamar University $ - $ - $ - $ - - Sam Houston State University $ 81,655, $ 63,419, $ 63,419, $ 24, % Sul Ross State University $ - $ - $ - $ - - Texas State University $ 46,528, $ 34,060, $ 34,060, $ 13, % Lamar Institute of Technology $ - $ - $ - $ - - Lamar State College - Orange $ - $ - $ - $ - - Lamar State College - Port Arthur $ - $ - $ - $ - - Texas State University System Office $ 4,100, $ 4,103, $ 4,103, $ 2, % Bond Proceeds Total $ 132,284, $ 101,582, $ 101,582, $ 40, % 6 Month T-Bill 0.17% Grand Total $ 709,572, $ 816,650, $ 817,440, $ 1,372, % 2
4 Texas State University System Consolidated Institutions ENDOWMENT QUARTERLY INVESTMENT REPORT PERIODS ENDING 02/29/2016 (TRADE DATE FULL ACCRUAL BASIS) Allocation Market Quarter FYTD Current Endowment Value Return Return 100% Total System Return $ 182,079, % -4.96% 16.5% Lamar University 30,061, % -1.16% 27.4% Russell 3000, 3.6% BC Credit, 69.1% at 0% Annual Return % -0.68% 46.9% Sam Houston State University 85,483, % -4.92% *Currently the policy benchmark is a blend of 27% S&P 500, 12% Russell Mid, 12% Russell 2000, 9% MSCI EAFE, 5% S&P Developed ex-us SC, 26.33% BC Aggregate, 5.66% BC Muni Bond, and 3% ML 6 Month T-Bill % -2.58% 8.7% Sul Ross State University 15,787, % -7.82% *Currently the policy benchmark is a blend of 27% S&P 500, 24% Russell -5.13% -2.57% 2500, 7% MSCI EAFE, 7% S&P Developed Ex-US SC, and 35% BC Aggregate. 27.9% Texas State University 50,746, % -6.37% *Currently the Total Blended Index consists of 23.1% S&P 500, 22.2% -5.03% -2.61% Russell 2500, 9.2% MSCI ACWI ex US, 5.5% S&P Developed SC Ex-US, 5% ML All Invest ex Man V0A1, 30% BC Aggregate, 1% 91-Day T-Bill, and 4% ML 6 Month T-Bill. 0.0% Lamar Institute of Technology N/A N/A N/A 0.0% Lamar State College - Orange N/A N/A N/A 0.0% Lamar State College - Port Arthur N/A N/A N/A 0.0% Texas State University System Office N/A N/A N/A 0.0% 0.0% 0.0% 0.0% 0.0% 0.0% Index Listing Quarter FYTD Russell Domestic Equity -7.60% -2.67% S&P Domestic Equity -6.59% -0.91% MSCI EAFE - International Equity % -9.37% FTSE NAREIT - Real Estate -2.61% 5.02% BC Int. Gov't - Fixed Income Government / Agency 1.90% 1.99% BC Credit - Fixed Income Corporates 0.59% 1.35% BC 3 Yr Muni - Fixed Income Municipal Bonds 0.96% 1.36% 91-Day T-Bill - Fixed Income Money Market 0.06% 0.06% ML All Invest ex Man V0A1 - Convertibles -5.01% -1.38% ML 1-3 Year Treasury - Fixed Income Money Market 0.63% 0.59% 6 Month T-Bill - Fixed Income Money Market 0.17% 0.23% Alerian MLP - Fixed Income MLP % % 3
5
6 Lamar University ENDOWMENT QUARTERLY INVESTMENT REPORT PERIODS ENDING 02/29/2016 (TRADE DATE FULL ACCRUAL BASIS) Allocation Market Quarter FYTD Current Mutual Fund / Manager Value Return Return % Total Plan Composite $ 30,061, % -1.16% Total Blended Index -2.06% -0.68% 27.4 % Domestic Equity $ 8,229, % -4.49% Russell % -2.67% 27.4 Commonfund MS Equity Fund 8,229, % -4.49% 3.6 % Total Fixed Income $ 1,070, % 0.24% 3.6 % Corporates $ 1,070, % 0.24% BC Credit 0.59% 1.35% 3.6 Commonfund MS Bond Fund 1,070, % 0.24% 69.1 % Other $ 20,761, % 0.09% 0.0 Cash in Bank 4, % 0.00% 69.0 Texpool Series ,756, % 0.09% Blended Indexes are based on the current weights of each asset class and their respective benchmarks. Currently the Total Blended Index is: 27.4% Russell 3000, 3.6% BC Credit, 69.1% at 0% Annual Return. 5
7 Lamar University ENDOWMENT QUARTERLY INVESTMENT REPORT PERIOD ENDING 02/29/2016 (TRADE DATE FULL ACCRUAL BASIS) Mutual Fund / Manager Beginning Market Value Deposits Withdrawals Income Fees Gains / Losses Ending Market Value Total Plan Composite $30,989,995 $50,129 -$302,005 $49,090 $8,330 -$733,973 $30,061,567 All Equity Composite $8,948,307 $0 -$26,766 $26,766 $7,532 -$726,074 $8,229,766 Domestic Equity $8,948,307 $0 -$26,766 $26,766 $7,532 -$726,074 $8,229,766 Commonfund MS Equity Fund $8,948,307 $0 -$26,766 $26,766 $7,532 -$726,074 $8,229,766 Total Fixed Income $1,077,863 $0 -$9,356 $9,356 $798 -$7,899 $1,070,762 Corporates $1,077,863 $0 -$9,356 $9,356 $798 -$7,899 $1,070,762 Commonfund MS Bond Fund $1,077,863 $0 -$9,356 $9,356 $798 -$7,899 $1,070,762 Other $20,963,825 $50,129 -$265,883 $12,968 $0 $0 $20,761,039 Cash in Bank $146,297 $24,906 -$166,436 $0 $0 $0 $4,767 Texpool Series 0001 $20,817,528 $25,223 -$99,447 $12,968 $0 $0 $20,756,273 6


8


9

10


11

12
13
14


15
16


17


18


19

20
21


22
23

24


25
26
27
28


29

30


31

32
33

34

35
36
37

38
39

40
41
42
43
44
45

46

47


48


49

50

51
52
53 Sam Houston State University ENDOWMENT QUARTERLY INVESTMENT REPORT PERIODS ENDING 02/29/2016 (TRADE DATE FULL ACCRUAL BASIS) Allocation Market Quarter FYTD Current Mutual Fund / Manager Value Return Return % Total Plan Composite $ 85,483, % -4.92% Total Blended Index -5.19% -2.58% 65.7 % All Equity Composite $ 56,185, % -6.63% Blended Equity Index -8.09% -3.97% 53.0 % Domestic Equity $ 45,328, % -6.38% Russell % -2.67% 0.7 Vanguard Prime Cap Fund - VPMAX 589, % -1.57% 9.8 Vanguard Instl Index - VINIX 8,390, % -0.50% 9.8 Laudus LCG Fund - LGILX 8,369, % -7.16% 10.2 Parnassus LCV Fund - PRILX 8,718, % -0.31% 10.8 Columbus Circle SMID G 9,222, % % 11.7 Baird Investment Mgmt SMID V 10,037, % -5.56% 12.7 % International Equity $ 10,856, % -7.77% MSCI EAFE % -9.37% 4.8 Driehaus Intl SCG - DRIOX 4,103, % -7.32% 7.9 Pear Tree Polaris (QFVIX) 6,752, % -7.63% 17.6 % Real Estate $ 15,003, % 4.24% FTSE NAREIT -2.61% 5.02% 17.6 Rems RE Income - RREIX 15,003, % 4.24% 14.5 % Total Fixed Income $ 12,432, % -1.34% Blended Fixed Index -1.32% 0.23% 3.7 % Corporates $ 3,172, % 1.78% BC Credit 0.59% 1.35% 3.7 Agincourt Capital Mgmt 3,172, % 1.78% 3.8 % Municipal Bonds $ 3,236, % 3.36% BC 3 Yr Muni 0.96% 1.36% 3.8 ishares S&P Natl Muni - MUB 3,236, % 3.36% 2.0 % Money Markets $ 1,733, % -0.30% 91-Day T-Bill 0.06% 0.06% 2.0 Ridgeworth Ultra Short- SIGVX 1,733, % -0.30% 5.0 % Hybrid Securities $ 4,290, % % ML All Invest ex Man V0A1-5.01% -1.38% 0.1 Invesco Convertibles - Class A 57, % -8.14% 5.0 Tortoise Capital - MLP 4,232, % % 2.2 % Other $ 1,862, % 0.08% 0.1 Money Market Sweep 117, % 0.01% 0.3 TexPool Series , % 0.09% 1.7 TexPool Series ,493, % 0.09% Blended Indexes are based on the current weights of each asset class and their respective benchmarks. *Currently the policy benchmark is a blend of 27% S&P 500, 12% Russell Mid, 12% Russell 2000, 9% MSCI EAFE, 5% S&P Developed ex-us SC, 26.33% BC Aggregate, 5.66% BC Muni Bond, and 3% ML 6 Month T-Bill. 10
54 Beginning Gains / Ending Market Mutual Fund / Manager Market Value Deposits Withdrawals Income Fees Losses Value Total Plan Composite $92,446,264 $55,502 -$95,695 $2,979,866 -$60,351 -$9,842,007 $85,483,579 All Equity Composite $62,099,438 $27,203 -$66,186 $1,222,234 -$48,938 -$7,048,730 $56,185,020 Domestic Equity $50,265,552 $27,203 -$66,186 $956,266 -$47,838 -$5,806,887 $45,328,110 Vanguard Prime Cap Fund - VPMAX $658,400 $5,000 -$20,000 $37,379 $0 -$90,839 $589,940 Vanguard Instl Index - VINIX $8,983,132 $0 $0 $52,645 -$551 -$644,376 $8,390,850 Laudus LCG Fund - LGILX $9,457,831 $0 $0 $569,209 -$550 -$1,657,006 $8,369,483 Parnassus LCV Fund - PRILX $9,195,385 $0 $0 $124,497 -$550 -$600,801 $8,718,531 Columbus Circle SMID G $10,957,254 $22,203 -$23,023 $43,435 -$23,023 -$1,754,635 $9,222,211 Baird Investment Mgmt SMID V $11,013,548 $0 -$23,163 $129,101 -$23,163 -$1,059,229 $10,037,094 International Equity $11,833,886 $0 $0 $265,968 -$1,100 -$1,241,843 $10,856,910 Driehaus Intl SCG - DRIOX $4,498,159 $0 $0 $120,043 -$550 -$513,653 $4,103,999 Pear Tree Polaris (QFVIX) $7,335,727 $0 $0 $145,925 -$550 -$728,190 $6,752,912 Real Estate $15,544,339 $0 $0 $1,606,936 -$550 -$2,147,149 $15,003,576 Rems RE Income - RREIX $15,544,339 $0 $0 $1,606,936 -$550 -$2,147,149 $15,003,576 Total Fixed Income $12,956,160 $8,920 -$24,857 $149,588 -$10,613 -$646,370 $12,432,829 Corporates $3,135,486 $0 -$2,434 $26,586 -$250 $13,197 $3,172,586 Agincourt Capital Mgmt $3,135,486 $0 -$2,434 $26,586 -$250 $13,197 $3,172,586 Municipal Bonds $3,197,472 $0 -$12,781 $19,361 -$550 $32,620 $3,236,122 ishares S&P Natl Muni - MUB $3,197,472 $0 -$12,781 $19,361 -$550 $32,620 $3,236,122 Money Markets $1,736,607 $0 $0 $3,510 -$550 -$6,073 $1,733,494 Ridgeworth Ultra Short- SIGVX $1,736,607 $0 $0 $3,510 -$550 -$6,073 $1,733,494 Hybrid Securities $4,886,596 $8,920 -$9,643 $100,131 -$9,262 -$686,115 $4,290,628 Invesco Convertibles - Class A $62,849 $0 -$380 $380 $0 -$5,215 $57,635 Tortoise Capital - MLP $4,823,746 $8,920 -$9,262 $99,751 -$9,262 -$680,900 $4,232,993 Other $1,846,326 $19,380 -$4,652 $1,108 -$250 $241 $1,862,154 Money Market Sweep TexPool Series 0010 TexPool Series 0011 Sam Houston State University ENDOWMENT QUARTERLY INVESTMENT REPORT PERIOD ENDING 02/29/2016 (TRADE DATE FULL ACCRUAL BASIS) $102,656 $19,380 -$4,652 $19 -$250 $241 $117,394 $251,289 $0 $0 $157 $0 $0 $251,446 $1,492,382 $0 $0 $932 $0 $0 $1,493,314 11


55
56 Sul Ross State University ENDOWMENT QUARTERLY INVESTMENT REPORT PERIODS ENDING 02/29/2016 (TRADE DATE FULL ACCRUAL BASIS) Allocation Market Quarter FYTD Current Mutual Fund / Manager Value Return Return % Total Plan Composite $ 15,787, % -7.82% Total Blended Index -5.13% -2.57% 53.4 % Domestic Equity $ 8,434, % -5.63% Russell % -2.67% 10.2 Parnassus Equity Income - PRILX 1,611, % -0.31% 9.9 Vanguard Institl Index - VINIX 1,569, % -0.93% 10.2 Laudus Growth Investors -LGILX 1,617, % -7.16% 11.5 Quantum Capital Management 1,808, % % 11.6 Baird SMID V 1,827, % -5.44% 10.4 % International Equity $ 1,644, % -9.33% MSCI EAFE % -9.37% 0.0 Hancock Horizon - HHDTX % 5.2 Franklin Intl SCG - FKSCX 820, % -9.68% 5.2 Nationwide Bailard - NWHNX 823, % -5.74% 13.9 % Real Estate $ 2,188, % 4.24% FTSE NAREIT -2.61% 5.02% 13.9 REMS RE 50/50 Income - RREIX 2,188, % 4.24% 14.2 % Total Fixed Income $ 2,239, % % Blended Fixed Index -4.98% -1.37% 0.1 % Municipal Bonds $ 10, % 2.23% BC 3 Yr Muni 0.96% 1.36% 0.1 Tampa Fl, Alleghany Health 10, % 2.23% 14.1 % Hybrid Securities $ 2,229, % % ML All Invest ex Man V0A1-5.01% -1.38% 14.1 Tortoise MLP 2,229, % % 8.1 % Other $ 1,281, % 0.08% 8.0 TexPool Series ,261, % 0.08% 0.1 Cash in Bank- Trustmark 19, % 0.00% Blended Indexes are based on the current weights of each asset class and their respective benchmarks. *Currently the policy benchmark is a blend of 27% S&P 500, 24% Russell 2500, 7% MSCI EAFE, 7% S&P Developed Ex-US SC, and 35% BC Aggregate. 16
57 Sul Ross State University ENDOWMENT QUARTERLY INVESTMENT REPORT PERIOD ENDING 02/29/2016 (TRADE DATE FULL ACCRUAL BASIS) Mutual Fund / Manager Beginning Market Value Deposits Withdrawals Income Fees Gains / Losses Ending Market Value Total Plan Composite $17,193,852 $1,098,931 -$1,085,319 $511,229 -$10,003 -$1,921,074 $15,787,615 Domestic Equity $9,305,709 $446 -$4,290 $170,031 -$4,629 -$1,032,670 $8,434,597 Parnassus Equity Income - PRILX $1,699,318 $0 $0 $23,007 -$113 -$111,017 $1,611,194 Vanguard Institl Index - VINIX $1,680,206 $0 $0 $9,847 -$113 -$120,514 $1,569,425 Laudus Growth Investors -LGILX $1,828,307 $0 $0 $110,035 -$113 -$320,312 $1,617,917 Quantum Capital Management $2,097,195 $0 -$4,040 $3,707 -$4,040 -$284,396 $1,808,427 Baird SMID V $2,000,684 $446 -$250 $23,435 -$250 -$196,431 $1,827,634 International Equity $1,805,947 $1,012,469 -$1,013,469 $51,954 -$226 -$212,603 $1,644,074 Hancock Horizon - HHDTX $1,051,084 $0 -$1,013,469 $0 $0 -$37,615 $0 Franklin Intl SCG - FKSCX $754,863 $138,888 $0 $32,226 -$113 -$104,993 $820,871 Nationwide Bailard - NWHNX $0 $873,581 $0 $19,729 -$113 -$69,994 $823,202 Real Estate $2,267,168 $0 $0 $234,374 -$113 -$313,133 $2,188,297 REMS RE 50/50 Income - RREIX $2,267,168 $0 $0 $234,374 -$113 -$313,133 $2,188,297 Total Fixed Income $2,553,342 $4,702 -$5,208 $54,110 -$4,952 -$362,750 $2,239,243 Municipal Bonds $10,026 $0 -$256 $256 $0 -$1 $10,025 Tampa Fl, Alleghany Health $10,026 $0 -$256 $256 $0 -$1 $10,025 Hybrid Securities $2,543,315 $4,702 -$4,952 $53,853 -$4,952 -$362,749 $2,229,218 Tortoise MLP $2,543,315 $4,702 -$4,952 $53,853 -$4,952 -$362,749 $2,229,218 Other $1,261,685 $81,314 -$62,353 $759 -$83 $81 $1,281,403 TexPool Series 0001 $1,242,214 $18,886 $0 $756 $0 $0 $1,261,856 Cash in Bank- Trustmark $19,471 $62,428 -$62,353 $4 -$83 $81 $19,547 17


58

59


60


61

62

63


64


65


66


67
68 Texas State University ENDOWMENT QUARTERLY INVESTMENT REPORT PERIODS ENDING 02/29/2016 (TRADE DATE FULL ACCRUAL BASIS) Allocation Market Quarter FYTD Current Mutual Fund / Manager Value Return Return % Total Plan Composite $ 50,746, % -6.37% Total Blended Index -5.03% -2.61% 64.7 % All Equity Composite $ 32,821, % -6.84% Blended Equity Index -8.07% -3.93% 52.6 % Domestic Equity $ 26,688, % -7.12% Russell % -2.67% 9.2 Seizert LCV - SA 4,683, % -3.92% 11.6 Vanguard Instl Index - VINIX 5,910, % -0.93% 10.7 APEX SMIDG - SA 5,443, % % 11.3 Systematic SMIDV - SA 5,741, % -8.43% 9.7 Silvant Capital 4,909, % -6.46% 12.1 % International Equity $ 6,133, % -8.85% MSCI EAFE % -9.37% 5.3 Franklin Intl SCG - FKSCX 2,701, % -9.74% 6.8 Pear Tree Polaris For Value - QFVIX 3,431, % -8.20% 6.9 % Real Estate $ 3,512, % 4.24% FTSE NAREIT -2.61% 5.02% 6.9 REMS RE Income - RREIX 3,512, % 4.24% 27.7 % Total Fixed Income $ 14,075, % -6.93% Blended Fixed Index -1.78% 0.02% 11.7 % Corporates $ 5,936, % 1.73% BC Credit 0.59% 1.35% 11.7 Sage FI 5,936, % 1.73% 4.8 % Money Markets $ 2,418, % -0.30% 91-Day T-Bill 0.06% 0.06% 0.0 Endowment Cash Account 3, % 0.01% 4.8 RidgeWorth UltraShort - SIGVX 2,415, % -0.30% 11.3 % Hybrid Securities $ 5,720, % % ML All Invest ex Man V0A1-5.01% -1.38% 4.0 Balanced Growth- SA 2,046, % -5.99% 7.2 Tortoise MLP 3,673, % % 0.7 % Other $ 337, % 0.08% 0.0 Cash - Wells Fargo 14, % 0.00% 0.6 TexPool Series , % 0.09% 0.0 Money Market Sweep 1, % 0.00% Blended Indexes are based on the current weights of each asset class and their respective benchmarks. *Currently the Total Blended Index consists of 23.1% S&P 500, 22.2% Russell 2500, 9.2% MSCI ACWI ex US, 5.5% S&P Developed SC Ex-US, 5% ML All Invest ex Man V0A1, 30% BC Aggregate, 1% 91-Day T-Bill, and 4% ML 6 Month T-Bill. 22
69 Texas State University ENDOWMENT QUARTERLY INVESTMENT REPORT PERIOD ENDING 02/29/2016 (TRADE DATE FULL ACCRUAL BASIS) Mutual Fund / Manager Beginning Market Value Deposits Withdrawals Income Fees Gains / Losses Ending Market Value Total Plan Composite $55,241,703 $358,442 -$239,161 $871,070 -$63,006 -$5,422,353 $50,746,695 All Equity Composite $36,767,601 $35,839 -$45,375 $307,079 -$46,215 -$4,197,401 $32,821,529 Domestic Equity $30,097,224 $35,839 -$45,375 $126,865 -$45,655 -$3,480,737 $26,688,161 Seizert LCV - SA $5,145,738 $6,456 -$7,303 $27,213 -$7,303 -$481,751 $4,683,050 Vanguard Instl Index - VINIX $6,327,903 $0 $0 $37,084 -$280 -$454,020 $5,910,687 APEX SMIDG - SA $6,392,590 $12,978 -$13,543 $16,153 -$13,543 -$950,835 $5,443,800 Systematic SMIDV - SA $6,664,375 $13,216 -$13,918 $35,545 -$13,918 -$944,220 $5,741,081 Silvant Capital $5,566,618 $3,189 -$10,612 $10,870 -$10,612 -$649,911 $4,909,543 International Equity $6,670,377 $0 $0 $180,214 -$560 -$716,663 $6,133,368 Franklin Intl SCG - FKSCX $2,942,250 $0 $0 $106,053 -$280 -$346,586 $2,701,437 Pear Tree Polaris For Value - QFVIX $3,728,127 $0 $0 $74,161 -$280 -$370,077 $3,431,931 Real Estate $3,638,745 $0 $0 $372,179 -$280 -$498,485 $3,512,159 REMS RE Income - RREIX $3,638,745 $0 $0 $372,179 -$280 -$498,485 $3,512,159 Total Fixed Income $14,616,625 $43,792 -$31,386 $191,642 -$16,511 -$728,546 $14,075,616 Corporates $5,839,217 $9,763 -$3,048 $26,861 -$3,048 $66,856 $5,936,601 Sage FI $5,839,217 $9,763 -$3,048 $26,861 -$3,048 $66,856 $5,936,601 Money Markets $2,416,818 $26,285 -$20,229 $3,484 -$363 -$7,456 $2,418,537 Endowment Cash Account -$2,549 $26,285 -$20,229 $1 -$83 $83 $3,507 RidgeWorth UltraShort - SIGVX $2,419,367 $0 $0 $3,482 -$280 -$7,539 $2,415,031 Hybrid Securities $6,360,589 $7,745 -$8,109 $161,297 -$13,099 -$787,946 $5,720,477 Balanced Growth- SA $2,166,100 $0 -$167 $72,669 -$5,054 -$186,666 $2,046,883 Tortoise MLP $4,194,489 $7,745 -$7,942 $88,628 -$8,045 -$601,280 $3,673,594 Other $218,732 $278,811 -$162,400 $170 $0 $2,079 $337,391 Cash - Wells Fargo $4,694 $168,811 -$161,000 $0 $0 $2,079 $14,584 TexPool Series 0023 $211,633 $110,000 $0 $169 $0 $0 $321,802 Money Market Sweep $2,405 $0 -$1,400 $0 $0 $0 $1,005 23
70
71
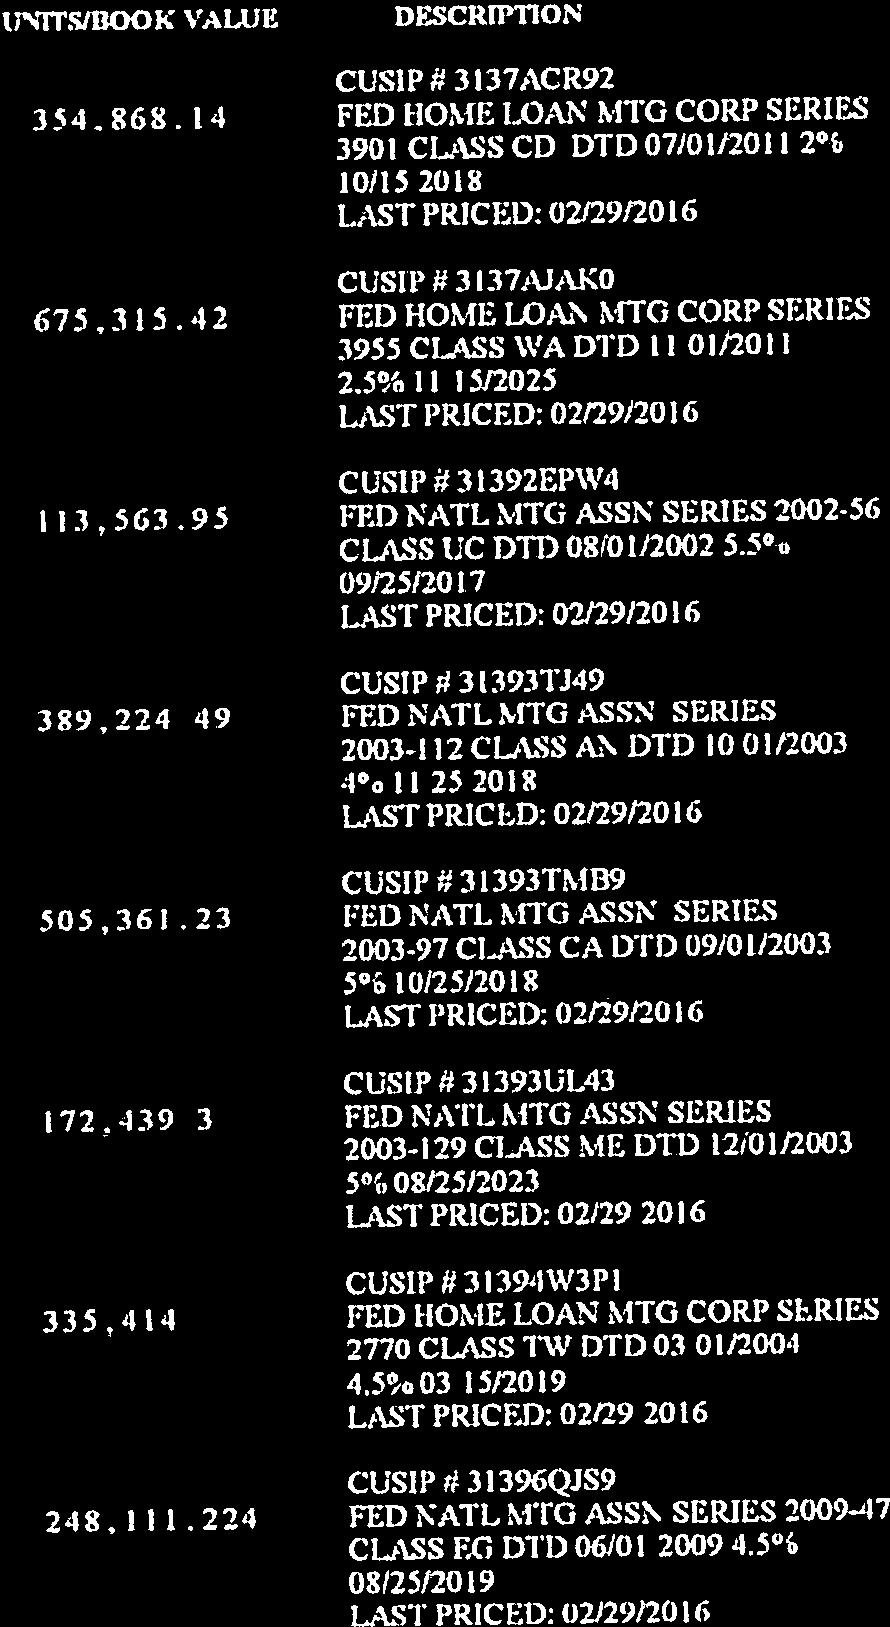
72 %LLO %I.'0 %0 L 0 %90O %9 I. '0 %9'OL %CI. 0 %61.O %9V0 %LO 0 gig(' 7n/ 7N/kw-A 014 eau s wen 7 10v lueues9aul epund 3vind ;0 sups!noicl wens's.' Lipm pue sepiod )uauesenui waisas ApSJOANI1 awls SeXel Ui pessaidx9 A6elees luauesenu! uom Aidwoo sopipod luewleene! Jmn.rci Pod eleis Jewel u0IN 9 LL ILL 8 9gg' LC 8I. L4 0 I.L' I. 4L Z ZL ' l VL LOZ Z4 0E9 $ $ $ $ $ $ $ $ $ wri4eh LII 91./6Z/Z0 6wpu3 Jepeno ZS I.S6' US' L LL 1.1.6' 6 L' I. I. 64 '9Z I. 81. Z8 '96g' I '9V$.4g LO L99' 1.6 LI. 6n:0n Y9 L6 Z4 $ $ S $ $ $ S $ $ 91./6Z/Z0 le ev eouelea >loos Zg Lg6' 9'L LL I. 1.66EL E LI. 64 '9Z I. 8 L Z8 '96S'L t'69k 869S LI. 6ZI.091. Z4 9 LL' Z6 $ $ $ $ $ $ $ $ $ 9 /6Z/Z0 Jo ev aniea 48NJevi 6uipu3 Z8 LO6' L E 9EL 08 OLZ'SZ I. Ll I. OZ L'OL 04'LOZ '941. Z ' Treic7L 9Wpd 100dXa1 $ $ $ $ $ $ $ $ 51./0C/1.1. JO sti aniea )avevy 6upo6ag PV ILL1 61/N yseo deems a;e1s 0,93 qsio Nati Ply u!j lun000v 6upeolO lunomv 6upe810 luncoov ilo8aed alea Awnleiti alea aseqamd JaqwnN disn0 WOO Gwud 100d)(91 L000 seuas loodxai kinseau u! Liseo g6zl..)1ueeu 1-lee0 L8ZL..)luee u! Ilee0 SZL..)1ue 1 Liseo 94ZL.Aue9 ul Use0 909S Nue9 u! Llse0 ale!petwalui -polis bupiad0 uogiu3seaiaoue6v (sisve -ninaoov 11n33J.VO 30V21.I.) 91.0Z/6Z/ZO ONION] SO01213d.1.80d38.I.N S3ANI A1831NVO0 ONI1V83d0 NON It ON111/213d0 Jrniptli-10c1- abeiloo ems Jewel


73
F U N D E V A L U A T I O N R E P O R T
 F U N D E V A L U A T I O N R E P O R T Santa Barbara Foundation Performance Update M E K E T A I N V E S T M E N T G R O U P BOSTON MASSACHUSETTS CHICAGO ILLINOIS MIAMI FLORIDA PORTLAND OREGON SAN DIEGO
Community Foundation of Northern Virginia - Pooled Investment Fund
 //207 through 3/3/207 Quarterly Performance Report 207 Black Diamond Performance Reporting, LLC - 42008 Page of 3 Portfolio Overview Portfolio Value Summary Month Quarter Year to Date Last 2 Months Last
ACE USA Employee Retirement Savings Plans
 ACE USA Employee Retirement Savings Plans Annual Fee Disclosure Statement Important Information About Your Investment Options, Fees, and Other Expenses as of June 2014 ACE USA Employee Retirement 401(k)
plan investment review performance summary
 CASH AND EQUIVALENTS - MONEY MARKET CREF Money Market R2 0.28% 0.49% 0.44% 0.06% 0.00% 0.00% 0.00% 0.79% 0.33% 0.20% 0.22% Vanguard Federal Money Market 0.42% 0.75% 0.81% 0.30% 0.04% 0.01% 0.02% 1.26%
AMERICAN BUS ASSOC. FOUNDATION 111 K ST. NE 9TH FL WASHINGTON DC
 AMERICAN BUS ASSOC. FOUNDATION 111 K ST. NE 9TH FL WASHINGTON DC 20002-8110 Investor Statement April 10, 2017 Prepared for American Bus Association Foundation AMERICAN BUS ASSOC. FOUNDATION 111 K ST. NE
3Q17 Investment Review Presented to Lisle Woodridge FPD Pension Fund
 3Q17 Investment Review Presented to Lisle Woodridge FPD Pension Fund November 20th 2017 Jon Willhite, CIMA UBS Institutional Consulting 1780 Hughes Landing Blvd., Ste 200 The Woodlands, TX 77380 281-362-2250
Parasol Long-Term Investment Horizon 3.2% 17.0% 17.0% 6.7% 8.6% 8.0% 5.9% Long-Term Composite Index (Policy) 4.0% 15.6% 15.6% 7.0% 8.8% 7.6% 5.
 4.0% 15.6% 15.6% 7.0% 8.8% 7.6% 5.") Long Term Investment Horizon As of December 31, 17 Annualized Performance (Net of Fees) 3 Mo YTD 1 Year 3 Years 5 Years 7 Years 1 Years Parasol Long-Term Investment Horizon 3.% 17.% 17.%.7%.%.% 5.9% Long-Term
Long Term Investment Horizon As of December 31, 17 Annualized Performance (Net of Fees) 3 Mo YTD 1 Year 3 Years 5 Years 7 Years 1 Years Parasol Long-Term Investment Horizon 3.% 17.% 17.%.7%.%.% 5.9% Long-Term
Annual Participant Fee Disclosure
 Annual Participant Fee Disclosure For Currently Available and Legacy Investment Options NAVICENT HEALTH, INC. NAVICENT HEALTH 403(B) RETIREMENT SAVINGS PLAN This disclosure contains important information
City of Los Angeles. Performance Evaluation Report. Deferred Compensation Plan. First Quarter 2016 Flash Report
 City of Los Angeles Deferred Compensation Plan Performance Evaluation Report First Quarter 2016 Flash Report Services provided by Mercer Investment Consulting, Inc. Cash FDIC-Insured Savings Account 1
BOARD OF VISITORS OF THE COLLEGE OF WILLIAM AND MARY IN VIRGINIA
 BOARD OF VISITORS OF THE COLLEGE OF WILLIAM AND MARY IN VIRGINIA COMMITTEE MEETINGS Board Rooms - Blow Memorial Hall April 17-19, 2013 INVESTMENTS SUBCOMMITTEE of the COMMITTEE ON FINANCIAL AFFAIRS
Annual Participant Fee Disclosure
 Annual Participant Fee Disclosure For Currently Available and Legacy Investment Options WELLMONT HEALTH SYSTEM WELLMONT HEALTH SYSTEM 403(B) RETIREMENT SAVINGS PLAN This disclosure contains important information
457 Deferred Compensation Plan
 457 Deferred Compensation Plan Third Quarter Plan Executive Summary October 31, Kristin Finney-Cooke, CAIA Senior Consultant Kristen Jackson, CFA Senior Analyst Metropolitan St. Louis Sewer District Deferred
Sample Portfolio. Bret R. Tackett, MS, CFP 304 W. Venice Ave, Suite 218 Venice, FL /13/2009 through 9/30/2013 Portfolio Review
 This report is intended to illustrate the quality of reporting we provide our clients each quarter. It is not an advertisement of performance. Performance reflected in this report is not indicative of
UWINCO Investment Performance Quarterly Report Quarter Ended December 31, 2017
 STANDING COMMITTEES F 11 Finance and Asset Management Committee UWINCO Investment Performance Quarterly Report Quarter Ended December 31, 2017 INFORMATION This item is for information only. Attachment
BALANCED FUND UNITED METHODIST CHURCH FOUNDATION AS OF 12/31/2002. Asset Allocation ($000) Equity Fund Fixed Income Fund Total
 Equity Fund Fixed Income Fund Total") BALANCED FUND UNITED METHODIST CHURCH FOUNDATION AS OF 12/31/22 Asset Allocation ($) Fixed Income Fund Total 25,713 1,33,7 - - -12 Fixed Income Fund 35.% 6.2% -16 Calendar Trailng Since Investment Returns
BALANCED FUND UNITED METHODIST CHURCH FOUNDATION AS OF 12/31/22 Asset Allocation ($) Fixed Income Fund Total 25,713 1,33,7 - - -12 Fixed Income Fund 35.% 6.2% -16 Calendar Trailng Since Investment Returns
D NONE (No reportable positions.)
") AOO Rev. /20I FINANCIAL DISCLOSURE REPORT FOR CALENDAR YEAR 2010 Report Required by the Ethics in Government Act of 1978 (5 U.S.C. app. 101-111) 1. Person Reporting (last name, first, middle initial) Court
AOO Rev. /20I FINANCIAL DISCLOSURE REPORT FOR CALENDAR YEAR 2010 Report Required by the Ethics in Government Act of 1978 (5 U.S.C. app. 101-111) 1. Person Reporting (last name, first, middle initial) Court
UWINCO Board Update and Investment Performance Quarterly Report Quarter Ended September 30, 2017
 STANDING COMMITTEES F 9 Finance and Asset Management Committee UWINCO Board Update and Investment Performance Quarterly Report Quarter Ended September 30, 2017 INFORMATION This item is being presented
Florida United Methodist Foundation Cautious As Of: September 30, 2017
 Cautious Low 0.85% The Cautious Portfolio is designed for a short-term investment horizon and/or risk-averse investor. It seeks a regular and constant income stream, high liquidity and muted volatility.
LOUISIANA SCHOOL EMPLOYEES RETIREMENT SYSTEM
 LOUISIANA SCHOOL EMPLOYEES RETIREMENT SYSTEM Investment Performance Analysis through March 31, 2008 May 2008 Copyright 2008 by Segal Advisors, Inc. All rights reserved. 1300 East Ninth Street, Suite 1900
Annual Participant Fee Disclosure
 Annual Participant Fee Disclosure For Currently Available and Legacy Investment Options ROGER WILLIAMS UNIVERSITY ROGER WILLIAMS UNIVERSITY RETIREMENT PLAN This disclosure contains important information
UBS DONOR-ADVISED FUND PERSONALIZED MUTUAL FUND OPTION PERFORMANCE PERIODS ENDING SEPTEMBER 30, 2017
 UBS DONOR-ADVISED FUND PERSONALIZED MUTUAL FUND OPTION PERFORMANCE PERIODS ENDING SEPTEMBER 30, 2017 UBS Select Treasury Institutional* ** UBS Select Government Institutional+ Metropolitan West Total Return
Total Fund Review. Investment Performance (% Rate of Return) As of December 31, Inception Date. % of Portfolio 1 Mo. 3 Mo.
 As of December 31, Inception Date. % of Portfolio 1 Mo. 3 Mo.") Total Fund Review Investment Performance (% Rate of ) As of December 31, 2018 Portfolio 1 Mo. 3 Mo. $127,536,171 100.0 Total Fund -4.2-7.8-3.2-3.2 6.8 5.3 7.6 8.9 6.4 Aug-99 Policy Index -2.9-6.7-3.8-3.8
Total Fund Review Investment Performance (% Rate of ) As of December 31, 2018 Portfolio 1 Mo. 3 Mo. $127,536,171 100.0 Total Fund -4.2-7.8-3.2-3.2 6.8 5.3 7.6 8.9 6.4 Aug-99 Policy Index -2.9-6.7-3.8-3.8
plan investment review performance summary
 CASH AND EQUIVALENTS - MONEY MARKET Vanguard Federal Money Market Investor 0.54% 1.78% 0.81% 0.30% 0.04% 0.01% 0.02% 1.78% 0.96% 0.59% 0.34% ICE BofA ML US Treasury Bill 3 Mon USD 0.56% 1.87% 0.86% 0.33%
City of Fort Walton Beach, Florida Beal Memorial Cemetery Perpetual Care Fund
 City of Fort Walton Beach, Florida Beal Memorial Cemetery Perpetual Care Fund Investment Performance Review Investment Advisors Steven Alexander, CTP, CGFO, CPPT, Managing Director Khalid Yasin, CIMA,
Investment Market Update (As of July 31, 2017)
") Investment Market Update (As of ) David Barnes, CFA, CAIA Senior Consultant Rhett Humphreys, CFA, Partner Index Performance Summary as of 07/31/2017 2009 2010 2011 2012 2013 2014 2015 2016 Q1 Q2 July MSCI
Investment Market Update (As of ) David Barnes, CFA, CAIA Senior Consultant Rhett Humphreys, CFA, Partner Index Performance Summary as of 07/31/2017 2009 2010 2011 2012 2013 2014 2015 2016 Q1 Q2 July MSCI
Texas Tech University System
 Texas Tech University System Capital Markets Overview October 2016 Timothy Bruce, Partner Index Performance Summary as of July 29 2016 2009 2010 2011 2012 2013 2014 2015 Q1 Q2 July YTD Barclays US STRIPS
Market Overview As of 1/31/2019
 Asset Class Leadership Periodic Table Worst Best 78.51 58.21 41.45 37.21 34.47 27.45 26.46 20.58 19.69 29.09 27.58 2 18.88 16.71 15.51 15.12 15.06 11.15 7.84 7.28 4.98 2.64 2.11 0.39-2.91-5.50-13.71 20.14
Market Overview As of 4/30/2018
 Asset Class Leadership Periodic Table Worst Best 5.24-26.16-28.92-36.85-37.00-37.34-38.44-38.54-45.53 78.51 58.21 41.45 37.21 34.47 27.45 26.46 20.58 19.69 29.09 27.58 24.50 18.88 16.71 15.51 15.12 15.06
Market Overview As of 11/30/2018
 Asset Class Leadership Periodic Table Worst Best 5.24-26.16-28.92-36.85-37.00-37.34-38.44-38.54-45.53 78.51 58.21 41.45 37.21 34.47 27.45 26.46 20.58 19.69 29.09 27.58 24.50 18.88 16.71 15.51 15.12 15.06
1000G 1000G HY
 Asset Class Leadership Periodic Table Worst Best 5.24-26.16-28.92-36.85-37.00-37.34-38.44-38.54-45.53 78.51 58.21 41.45 37.21 34.47 27.45 26.46 20.58 19.69 29.09 27.58 24.50 18.88 16.71 15.51 15.12 15.06
Liberty Mutual 401(k) Plan Annual Fee Disclosure Statement
 Plan Annual Fee Disclosure Statement") Liberty Mutual 401(k) Plan Annual Fee Disclosure Statement Important information about Your Options, Fees and Other Expenses The Liberty Mutual 401(k) Plan (the Plan ) is a great way to build savings for
Liberty Mutual 401(k) Plan Annual Fee Disclosure Statement Important information about Your Options, Fees and Other Expenses The Liberty Mutual 401(k) Plan (the Plan ) is a great way to build savings for
Market Overview As of 8/31/2017
 Asset Class Leadership Periodic Table Worst Best 39.42 16.65 11.81 7.05 6.97 5.49 1.87-0.17-9.78 5.24-26.16-28.92-36.85-37.00-37.34-38.44-38.54-45.53 78.51 58.21 41.45 37.21 34.47 27.45 26.46 20.58 19.69
Market Overview As of 10/31/2017
 Asset Class Leadership Periodic Table Worst Best 39.42 16.65 11.81 7.05 6.97 5.49 1.87-0.17-9.78 5.24-26.16-28.92-36.85-37.00-37.34-38.44-38.54-45.53 78.51 58.21 41.45 37.21 34.47 27.45 26.46 20.58 19.69
Total Fund Review. Investment Performance (% Rate of Return) As of November 30, Inception Date. % of Portfolio 1 Mo. 3 Mo.
 As of November 30, Inception Date. % of Portfolio 1 Mo. 3 Mo.") Total Fund Review Investment Performance (% Rate of ) As of November 30, 2018 Portfolio 1 Mo. 3 Mo. $132,626,601 100.0 Total Fund 0.8-3.2 1.0 2.3 8.0 6.5 8.1 9.5 6.6 Aug-99 Policy Index 0.9-3.5-0.9 0.7
Total Fund Review Investment Performance (% Rate of ) As of November 30, 2018 Portfolio 1 Mo. 3 Mo. $132,626,601 100.0 Total Fund 0.8-3.2 1.0 2.3 8.0 6.5 8.1 9.5 6.6 Aug-99 Policy Index 0.9-3.5-0.9 0.7
PORTFOLIO REVIEW. South Dakota School of Mines & Technology Foundation
 PORTFOLIO REVIEW 1Q18 South Dakota School of Mines & Technology Foundation Scott Middleton, CFA, CIMA Steve Karsh Sloan Smith, CAIA Kristy LeGrande, CFA Richard Todd Prepared by: Joe Lemming 4643 S Ulster
PALM TRAN / A.T.U. LOCAL 1577 PENSION FUND
 INVESTMENT PERFORMANCE EVALUATION For the Quarter Ended Decmber 31, 2006 Presented on February 22, 2007 NOTE: For a free copy of Part II of Burgess Chambers and Associates, Inc.'s most recent Form ADV
North Carolina Supplemental Retirement Plans. Performance Review First Quarter 2017
 North Carolina Supplemental Retirement Plans Performance Review First Quarter 2017 Asset Allocation Summary Current Asset Allocation As of March 31, 2017 Prior Period Asset Allocation As of December 31,
BOYNTON BEACH POLICE PENSION FUND INVESTMENT PERFORMANCE PERIOD ENDING MARCH 31, 2013
 BOYNTON BEACH POLICE PENSION FUND INVESTMENT PERFORMANCE PERIOD ENDING MARCH 31, 2013 NOTE: For a free copy of Part II (mailed w/i 5 bus. days from request receipt) of Burgess Chambers and Associates,
Donor Advised Funds Average Annual Performance
 Donor Advised Funds Average Annual as of March 31, 2018 Allocation Inception* DAF GROWTH FUND TRADITIONAL IV 4/3/00 0.04 0.04 13.95 7.37 9.36 5.77 0.85 Blended Benchmark: Growth -0.86-0.86 14.42 9.46 11.25
... Overview Group Variable Annuity Investment Options
 Overview Document Summary This document includes important information that may help you compare the different investment options (if available) under your retirement plan. For additional information about
Returns Analysis Performance as of 9/30/2018
 Returns Analysis Performance as of 9/30/2018 Asset Allocation Conservative Asset Allocation QTR YTD Vanguard Target Retirement Income Inv VTINX 1.33 1.26 3.31 5.36 4.52 5.67 5.19 10/27/03 10/27/03 0.13
The UPMC Savings Plan: Information about your investment options, fees, and other expenses
 UPMC Annual Fee Disclosure Notice January 2018 The UPMC Savings Plan: Information about your investment options, fees, and other expenses The UPMC Savings Plan (Savings Plan or Plan ) is a great way to
Brexit and Market Implications Special Commentary & Webinar
 Brexit and Market Implications Special Commentary & Webinar June 27, 2016 SR# 904360 Today s Speakers Envestnet PMC Zachary Karabell Head of Global Strategy, Envestnet As Head of Global Strategy, Mr. Karabell
Benchmarking Analysis
 Benchmarking Analysis Prepared for: XYZ Corp Plan Name: XYZ Corp 401k Plan Month Ending: November 30, 2016 Prepared By: George Washington AAA Wealth Management, Inc. 1600 Pennsylvania Ave NW Washington,
OKMRF FUND DESCRIPTIONS
 OKMRF FUND DESCRIPTIONS Page 1 The INTERNATIONAL EQUITY FUND is invested primarily in mutual funds which invest in companies headquartered in countries outside the United States. Of all common stock available
REQUEST FOR PROPOSAL For OUTSOURCED CHIEF INVESTMENT OFFICER SERVICES CONCORDIA UNIVERSITY, NEBRASKA
 REQUEST FOR PROPOSAL For OUTSOURCED CHIEF INVESTMENT OFFICER SERVICES CONCORDIA UNIVERSITY, NEBRASKA April 18, 2014 TIMETABLE The following is the time schedule for selection of a firm to provide what
Dear Participant: Please refer to Part IV of the attached document for information on who to call with questions.
 Dear Participant: You are receiving the attached notification as the result of a regulation passed by the Department of Labor (DOL) in October 2010. This participant fee disclosure regulation, referred
Fiscal YTD. $341,964, Consolidated Investment Portfolio Dec-01
 $341,964,987 107.8 Consolidated Investment Portfolio 0.1 5.3-4.1 1.6-4.1 2.8 3.8 7.3 4.2 5.8 Dec-01 $317,317,234 100.0 Endowment Pool 0.1 5.3-3.8 1.8-3.8 2.8 3.9 7.4 4.2 7.8 Jan-97 Policy Index 0.0 6.2-2.0
Disclosure Documents Under Section 404(a)(5) of ERISA for Transamerica Retirement Plan Services Plan Name
(5) of ERISA for Transamerica Retirement Plan Services Plan Name") Johnson Service Group, Inc. 401(k) Retirement Savings Plan - Contract Employees Disclosure Documents Under Section 404(a)(5) of ERISA for Transamerica Retirement Plan Services Plan Name Johnson Service
Johnson Service Group, Inc. 401(k) Retirement Savings Plan - Contract Employees Disclosure Documents Under Section 404(a)(5) of ERISA for Transamerica Retirement Plan Services Plan Name Johnson Service
Dear Participant: Please refer to Part IV of the attached document for information on who to call with questions.
 Dear Participant: You are receiving the attached notification as the result of a regulation passed by the Department of Labor (DOL) in October 2010. This participant fee disclosure regulation, referred
a glance
 Investments @ a glance We ve made saving for a brighter retirement easier with simple, low-cost investments solutions designed specifically for your plan. Sun Life Financials investment solutions provide
General Amendment To Be Attached To and Read as. Part of the Group Annuity Contract. Issued By
 General Amendment To Be Attached To and Read as Part of the Group Annuity Contract Issued By John Hancock Life Insurance Company (U.S.A.) (herein called the Company) In accordance with the provisions under
Presentation to University of South Florida Board of Trustees
 Presentation to University of South Florida Board of Trustees November 29, 2012 Alan C. Bomstein Chairman USF Foundation Investment Committee Mark E. Brubaker, CFA Managing Director Wilshire Consulting
Performance Report. September 30, 2015
 Performance Report September 30, 2015 About ASC Trust Corporation ASC Trust Corporation is the leader of retirement plan management in Micronesia. With a team of over 60,in three locations throughout the
Federated Investors, Inc. Analyst Update
 Stability Investment Solutions Diligence Federated Investors, Inc. Analyst Update Data as of March 31, 2018 4/18; data as of 3/31/18 18-74239 Forward-Looking Information This presentation is provided as
Summit Strategies Group
 April 0, 205 US Equity: All Cap Russell 000 Index 0.45 5.9 2.26 2.74 6.86 4. 8.68 8.66 Dow Jones US Total Stock Market Index 0.46 5.9 2.27 2.67 6.78 4.7 8.78 8.8 US Equity: Large Cap Russell 000 Index
Annual Participant Fee Disclosure
 Annual Participant Fee Disclosure For Currently Available and Legacy Investment Options DUKE UNIVERSITY THE DUKE UNIVERSITY FACULTY AND STAFF RETIREMENT PLAN This disclosure contains important information
Stay on Track with TARGET
 Stay on Track with TARGET Whether you re spending time with your family or focusing on your career, your time is valuable. The time you spend searching for that hot dot or keeping abreast of market events
TEMPLE UNIVERSITY POLICIES AND PROCEDURES MANUAL
 TEMPLE UNIVERSITY POLICIES AND PROCEDURES MANUAL Title: Investment Policies Policy Number: 05.50.01 Issuing Authority: Board of Trustees Responsible Officer: Vice President, CFO& Treasurer Date Created:
The industry s largest underlying fund line-up. All the choice you need to manage tax-deferred assets in today s rapidly changing markets.
 The industry s largest underlying fund line-up. All the choice you need to manage tax-deferred assets in today s rapidly changing markets. ISSUERS: JEFFERSON NATIONAL LIFE INSURANCE COMPANY JEFFERSON NATIONAL
BOYNTON BEACH POLICE PENSION FUND INVESTMENT PERFORMANCE PERIOD ENDING MARCH 31, 2011
 BOYNTON BEACH POLICE PENSION FUND INVESTMENT PERFORMANCE PERIOD ENDING MARCH 31, 2011 NOTE: For a free copy of Part II (mailed w/i 5 bus. days from request receipt) of Burgess Chambers and Associates,
10/25/ Dear Participant:
 Dear Participant: You are receiving the attached notification as the result of a regulation passed by the Department of Labor (DOL) in October 2010. The regulation requires this disclosure to be made on
University of Washington
 University of Washington Quarterly Investment Performance Report University of Washington Investment Management Company Published November 2018 University of Washington Quarterly Investment Performance
... Overview Resource B Variable Annuity Investment Options
 Overview Document Summary This document includes important information that may help you compare the different investment options (if available) under your retirement plan. For additional information about
SCERA Investment Summary Periods Ending 06/30/2017
 SCERA Investment Summary Periods Ending 06/30/2017 June Overall return of 0.3% / 7 basis points under the Plan Target Policy Index Equity returns (R3000 +0.9%, EAFE -0.2%, EMG MKTS +1.0%) Real Estate (NCREIF
Fourth Quarter 2015 Market Review. March 2016
 Fourth Quarter 2015 Market Review March 2016 Agenda Market Review Investment Outlook and Portfolio Positioning 2 2015 was a Challenging Year for Investment Returns Last year was the first time since 2001
LOS ANGELES WATER AND POWER EMPLOYEES RETIREMENT PLAN AND RETIREE HEALTH BENEFITS FUND TOTAL PLAN ASSETS. April 30, 2018
 LOS ANGELES WATER AND POWER EMPLOYEES RETIREMENT PLAN AND RETIREE HEALTH BENEFITS FUND TOTAL PLAN ASSETS Market Value Retirement Fund.. $12,128,463,152 Retiree Health Benefits Fund.. $2,072,086,248 Disability
LCEC Retirement Plan Oversight and Performance Update. March 17, 2016
 LCEC Retirement Plan Oversight and Performance Update March 17, 2016 Retirement Plan Structure LCEC provides two types of retirement benefits under two separate plans: Defined Benefits Traditional Plan
DeKalb County, Georgia
 December 31, 2016 Investment Measurement Service Quarterly Review The following report was prepared by Callan Associates Inc. ("CAI") using information from sources that include the following: fund trustee(s);
University of South Carolina Development Foundation
 COMPOSITE PERFORMANCE REVIEW Report for Periods Ending March 31, 2018 University of South Carolina Development Foundation Presented by: Scott B. Harsh President & CEO Stephen M. Hodson, CFA, CAIA Senior
Annual Participant Fee Disclosure
 Annual Participant Fee Disclosure For Currently Available and Legacy Investment Options DIALYSIS CLINIC, INC. DIALYSIS CLINIC, INC. THRIFT PLAN This disclosure contains important information about the
Quarterly Investment Performance Analysis
 Quarterly Investment Performance Analysis Municipality of Anchorage Trust Fund Period Ended: March 31, 2018 Agenda Item III..D. (Detail) Table Of Contents 1 Capital Markets Review Page 3 2 Total Portfolio
Investment Performance Review Period Ending June 30, City of Trenton Fire & Police Retirement System
 Investment Performance Review Period June 30, 2017 City of Trenton Fire & Police Retirement System Market Update June 30, 2017 Index Returns (%) Equities Month 3 M YTD 1 Year 3 Yr 5 Yr Ann Ann S&P 500
Monthly Risk-Return Report As of May 31, 2016
 Monthly Risk-Return Report As of May 31, 2016 Asset Allocation......Page 1 Returns........Page 2 Risk............Page 3 Portfolio Changes......Page 4 Benchmarks..... Page 5 Based on actual BNY Mellon data
Summit Strategies Group
 As of December 3, 203 US Equity: All Cap Russell 3000 Index 2.64 0.0 33.55 33.55 6.24 8.7 6.50 7.88 7.09 Dow Jones US Total Stock Market Index 2.63 0. 33.47 33.47 6.23 8.86 6.68 8.0 6.90 US Equity: Large
UNC Investment Fund, LLC Fiscal Year 2008 Summary Presentation To: The Board of Trustees of The University of North Carolina at Chapel Hill
 , LLC Fiscal Year 2008 Summary Presentation To: The Board of Trustees of The University of North Carolina at Chapel Hill November 20, 2008 Organizational Structure UNC Management Company, Inc Formed 2002,
PALM TRAN, INC./ATU LOCAL 1577 PENSION FUND INVESTMENT PERFORMANCE PERIOD ENDING MARCH 31, 2011
 PALM TRAN, INC./ATU LOCAL 1577 PENSION FUND INVESTMENT PERFORMANCE PERIOD ENDING MARCH 31, 2011 NOTE: For a free copy of Part II (mailed w/i 5 bus. days from request receipt) of Burgess Chambers and Associates,
Nationwide Fiduciary Series SM Important Disclosures
 Nationwide Fiduciary Series SM Important Disclosures For more information about the available underlying investment options, including all charges and expenses, please consult the respective fund prospectus.
Highlighted Performance as of COB 9/30/ 'I' Share Classes in RED for Illustrative Purposes Performance as of COB 11/14/2018 Investment Fund
 Highlighted Performance as of COB 9/30/2018 - 'I' Share Classes in RED for Illustrative Purposes Performance as of COB 11/14/2018 Investment Fund Investment Category YTD 1 Year 3 Year 5 Year 10 Year Ticker
Summit Strategies Group
 May, 208 US Equity: All Cap Russell 000 Index 2.82.4 2.55 5.06 0.72 2.85 2.6 9.2 Dow Jones US Total Stock Market Index 2.8.5 2.57 5.09 0.68 2.78 2.58 9.27 US Equity: Large Cap Russell 000 Index 2.55 0.57
Summit Strategies Group
 June 0, 208 US Equity: All Cap Russell 000 Index 0.65.89.22 4.78.58.29.0 0.2 Dow Jones US Total Stock Market Index 0.66.87.25 4.79.56.22 2.98 0.28 US Equity: Large Cap Russell 000 Index 0.65.57 2.85 4.54.64.7.2
Summit Strategies Group
 August, 208 US Equity: All Cap Russell 000 Index.5 7.65 0.9 20.25 5.86 4.25 5.50 0.89 Dow Jones US Total Stock Market Index.48 7.64 0.4 20.26 5.82 4.2 5.45 0.94 US Equity: Large Cap Russell 000 Index.45
Summit Strategies Group
 October, 208 US Equity: All Cap Russell 000 Index -7.6 -.95 2.4 6.60.27 0.8.8.5 Dow Jones US Total Stock Market Index -7.4-4.04 2.9 6.56.24 0.76.75.6 US Equity: Large Cap Russell 000 Index -7.08 -.5 2.67
Integrity Fixed Income Management, LLC
 Integrity Fixed Income Management, LLC Presents: The City of Sanibel Operating, Reserve, Surplus & Restricted Funds As of December 31, 2012 Investment Summary as of 12/31/2012 Total Portfolio Market Value
The industry s largest underlying fund line-up. All the choice you need to manage tax-deferred assets in today s rapidly changing markets.
 The industry s largest underlying fund line-up. All the choice you need to manage tax-deferred assets in today s rapidly changing markets. ISSUERS: JEFFERSON NATIONAL LIFE INSURANCE COMPANY JEFFERSON NATIONAL
University of Washington
 University of Washington Investment Performance Report to Board of Regents Fourth Quarter Fiscal Year 200 As of June 30, 200 Treasurer Board of Regents Treasury Office Published August 200 Table of Contents
Duquesne University Plans Available Investment Options Report For Periods Ending September 30, 2016
 Large Cap Core Equity Fidelity Fidelity 500 Index Pr FUSVX 0.05% 3.8 7.8 15.4 11.1 16.3 13.1 7.2 Top 25% MATCHED Fidelity Neuberger Berman Socially Responsive Fund 4 NRSRX 0.60% 5.0 6.5 12.9 8.9 - - -
ST. JUDE'S CHILDREN'S RESEARCH HOSPITAL DC RETIREMENT PLAN
 Quarterly Investment Update ST. JUDE'S CHILDREN'S RESEARCH HOSPITAL DC RETIREMENT PLAN Investment Performance as of 12/31/2018 The performance data quoted represents past performance, and is no guarantee
PARTICIPANT FEE DISCLOSURE STATEMENT Amerisafe, Inc. 401(k) Plan ("Plan") November 30, 2015
 Plan (Plan) November 30, 2015") PARTICIPANT FEE DISCLOSURE STATEMENT Amerisafe, Inc. 401(k) Plan ("Plan") November 30, 2015 This Disclosure Statement is provided by your employer to explain the costs associated with participating in
PARTICIPANT FEE DISCLOSURE STATEMENT Amerisafe, Inc. 401(k) Plan ("Plan") November 30, 2015 This Disclosure Statement is provided by your employer to explain the costs associated with participating in
Portfolio Summary 31-Dec-10
 Portfolio Summary Portfolio Return (NCRS) vs. Benchmark 13.1% 12.85% 12.41% 11.61% 1,496 12,68 Assets Under Management ($mil) $85.43 Billion as of December 31, 21 1,351 9,879 1,45 11,248 1,597 11,415 4.67%
Supplemental Financial Report
 Laborers and Retirement Board Employees Annuity and Benefit Fund of Chicago A Component Unit of the City of Chicago State of Illinois Supplemental Financial Report For the fiscal year ended December 31,
TEXAS STATE UNIVERSITY SYSTEM
 TEXAS STATE UNIVERSITY SYSTEM Investment Policy for Operating Funds and Endowment Funds September 2017 1 Table of Contents I. PREFACE... 3 II. POLICY AND OBJECTIVES... 3 A. OPERATING FUNDS... 3 B. ENDOWMENT
Investment Policy Statement for Joe Client
 Investment Policy Statement for I. PURPOSE The purpose of this Investment Policy Statement (IPS) is to establish a clear understanding of the investment objectives, goals and guidelines for your portfolio
City of Los Angeles. Performance Evaluation Report. Deferred Compensation Plan. Second Quarter 2015
 City of Los Angeles Deferred Compensation Plan Performance Evaluation Report Second Quarter 2015 Services provided by Mercer Investment Consulting, Inc. Contents Market Environment... 1 Summary... 14 Fund
Statement of Investment Policies and Objectives. University of Rochester Retirement Plan. February 2017
 Statement of Investment Policies and Objectives University of Rochester Retirement Plan February 2017 Contents Purpose 1 Philosophy 2 Delegation of Responsibilities 3 Investment Structure and Investment
Monthly Risk-Return Report As of February 28, 2017
 Monthly Risk-Return Report As of February 28, 2017 Asset Allocation......Page 1 Returns........Page 2 Risk............Page 3 Portfolio Changes......Page 4 Benchmarks..... Page 5 Based on actual BNY Mellon
Summit Strategies Group
 US Equity: All Cap Russell 000 Index -.69 2.40.9 6.22 0.59 4.7 2.79 9.78 Dow Jones US Total Stock Market Index -.70 2.4.4 6.2 0.55 4.2 2.76 9.8 US Equity: Large Cap Russell 000 Index -.67 2.75.62 6.70
Summit Strategies Group
 US Equity: All Cap Russell 000 Index.72 7.7 5.67 26.29 9.92.85.87 7.64 Dow Jones US Total Stock Market Index - - - - - - - - US Equity: Large Cap Russell 000 Index.87 7.95 5.96 25.5 0.9.94.9 7.69 Russell
Invest Confidently for Your Future
 Invest Confidently for Your Future OPENING Getting started Saving for retirement Buying a new home Helping pay for college Paying off debt OPENING Building and maintaining a portfolio STEP 1 STEP 2 STEP
Hand Composite Employee Benefit Trust Trademark Tactical Risk Funds Independent Auditor's Report and Financial Statements.
 Funds Independent Auditor's Report and Financial Statements Contents Independent Auditor's Report... 1 Basic Financial Statements Statements of Assets and Liabilities Selected Funds... 3 Schedules of Investments