Cautionary Statement
|
|
|
- Rodney Heath
- 5 years ago
- Views:
Transcription

1 December 2017
2 Cautionary Statement Certain statements included herein contain forward-looking statements within the meaning of federal securities laws about the financial condition and results of operations of the Company that are based on management s beliefs, assumptions and expectations about our future economic performance, considering the information currently available to management. The words believe, may, could, will, should, would, anticipate, plan, estimate, project, expect, intend, seek, strive and words of similar import, or the negative of such words, identify or signal the presence of forward-looking statements. These statements are not statements of historical fact, and they involve risks and uncertainties that may cause our actual results, performance or financial condition to differ materially from the expectations of future results, performance or financial condition that we express or imply in any forward-looking statement. Factors that could contribute to such differences include, but are not limited to: the competitive nature of the textile industry and the impact of global competition; changes in the trade regulatory environment and governmental policies and legislation; the availability, sourcing and pricing of raw materials; general domestic and international economic and industry conditions in markets where the Company competes, including economic and political factors over which the Company has no control; changes in consumer spending, customer preferences, fashion trends and end-uses for products; the financial condition of the Company s customers; the loss of a significant customer; the success of the Company s strategic business initiatives; volatility of financial and credit markets; the ability to service indebtedness and fund capital expenditures and strategic business initiatives; availability of and access to credit on reasonable terms; changes in foreign currency exchange, interest and inflation rates; fluctuations in production costs; the ability to protect intellectual property; employee relations; the impact of environmental, health and safety regulations; the operating performance of joint ventures and other equity investments; and the accurate financial reporting of information from equity method investees. All such factors are difficult to predict, contain uncertainties that may materially affect actual results and may be beyond our control. New factors emerge from time to time, and it is not possible for management to predict all such factors or to assess the impact of each such factor on the Company. Any forward-looking statement speaks only as of the date on which such statement is made, and we do not undertake any obligation to update any forward-looking statement to reflect events or circumstances after the date on which such statement is made, except as may be required by federal securities laws. The above and other risks and uncertainties are described in the Company s most recent annual report on Form 10-K, and additional risks or uncertainties may be described from time to time in other reports filed by the Company with the Securities and Exchange Commission pursuant to the Securities Exchange Act of1934, asamended. Non-GAAP Financial Information The presentation contains non-gaap financial information, specifically Earnings Before Interest, Taxes, Depreciation and Amortization ( EBITDA ), Adjusted EBITDA, Adjusted Net Income, Adjusted EPS and Adjusted Working Capital. Reconciliations of these non-gaap measures with the most comparable financial measures calculated and presented in accordance with GAAP are presented in the Appendix to this presentation. For use in the U.S. - Unifi and REPREVE are registered trademarks of Unifi, Inc. For International use - Unifi and REPREVE are registered trademarks of Unifi, Inc. in the U.S. and certain other countries 2
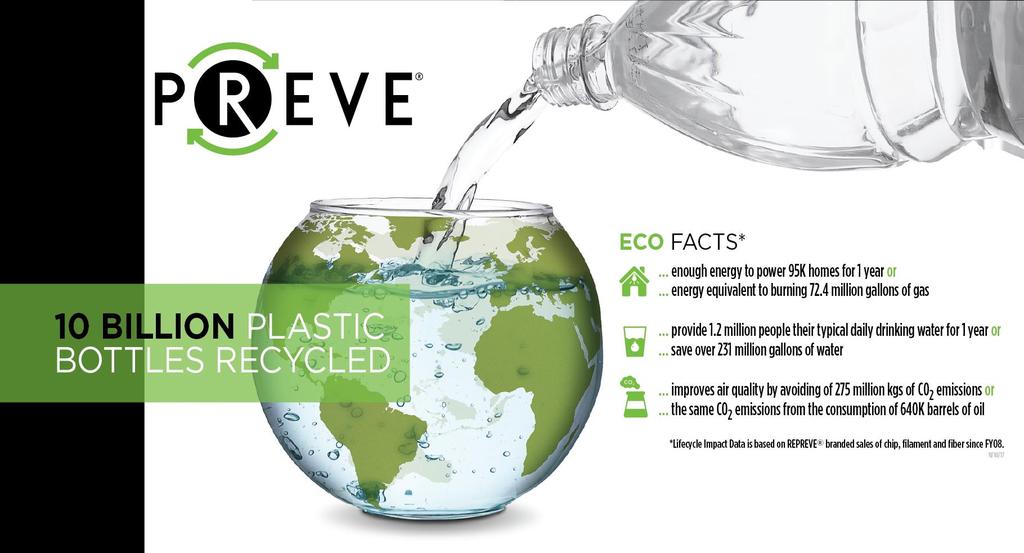
3 A Global & Growing Textile Solutions Provider Leading Innovators in Synthetic and Recycled Fiber Wide array of polyester and nylon products across an extensive variety of applications Specialized yarns and premium value-added (PVA) yarns, meeting the technological and complex demands of global customers Global Supply Chain Excellence Multi-region and multi-faceted, serving all the primary production centers REPREVE Most-Recognized Offering for Sustainable Solutions Significant adoption and growth; over 10 billion plastic bottles transformed Strong Brand Partnerships Increasing and Expanding Focus on innovation and differentiation to meet today s demands and tomorrow s expectations Further Growth Potential Strong financial position and results provide opportunities for further strategic investment Synthetics continue to gain share in the apparel industry Sustainable solutions available across all verticals 3
4 Investing in Growth & Margin Expansion Investment Thesis Favorable industry dynamics: Global consumer preferences toward synthetic products with innovative attributes Strong interest in sustainable solutions, with customers maintaining brand integrity Defensible scale and foundation Global footprint with proximity to world-class brands and production centers Significant U.S. asset base with state-of-the-art technology and recycled fiber production Flexible operating model for expansion into new markets and geographies Ability to use contract manufacturing or make direct investment Diverse markets and broad product lines drive long-term opportunities Strong balance sheet and cash flows could provide other avenues to accelerate growth and fuel strategic investments 4
5 Overview of Sales and End-Markets Furnishings 9% Automotive 7% Other 5% PVA Product Sales as a Percentage of Consolidated Annual Net Sales Industrial 18% Sales by End Market Apparel 44% 40% Hosiery 17% 30% 35% 24% 25% 27% Polyester 55% Sales by Segment Other 1% Nylon 17% International 27% FY 12 FY 13 FY 14 FY 15 FY 16 FY 17 FY 18e Source: Unifi FY 2017 Form 10-K and Unifi Internal Estimates 5

6 Diverse Global Footprint CANADA TURKEY UTSC UMI USA EUROPE CHINA VIETNAM ISRAEL TAIWAN UCA CENTRAL AMERICA ULA COLOMBIA UTCL SRI LANKA UdB BRAZIL Asia / Other 10% Trade Compliant 68% NonCompliant 32% Sales By Region North/Central America 73% Source: Unifi FY 2017 Form 10-K and Unifi Internal Estimates 6

7 Strategic Growth from Strong Fundamentals STRONG FUNDAMENTALS TO BECOME FOCUSED INVESTMENTS Offering the entire spectrum of polymer to yarn to value-added solutions in polyester and nylon. in Brand Growth in Technology and Innovation in Strategic Partnerships in People and Teams The global innovation and recycling partner of choice for fiber and polymer solutions for world class brands, retailers and mills. 7

8 Adding Value Throughout the Supply Chain Polyester & Nylon Base PVA Technology Portfolio + Superior Consumer Benefits Recycled + Superior Consumer Benefits Trade Compliant Speed / Response Time Quality & Reliability Ease of Business Regional & Global Footprint Competitively Priced 8


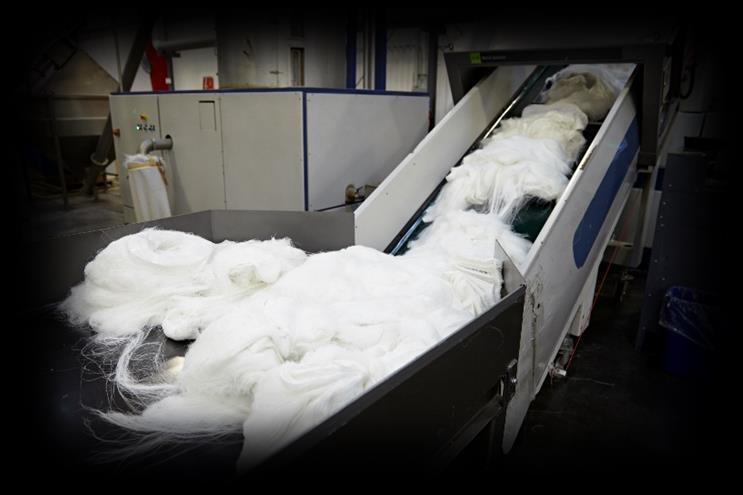
9 Transformation into Earth-Friendly Fibers 9

10 Our Recycling Process Baled bottles are delivered to Unifi and sorted, washed and chopped into Flake Flake is sent to the Recycling Center where it is melted into Chip Chip is then extruded into REPREVE Fiber REPREVE Fiber can be further enhanced with consumer-meaningful benefits 10


11 Brand Growth REPREVE adoption has led to significant partnerships Based on quality, innovation, integrity and diversification Brands and retailers continue to add to their own sustainability story U-Trust and FiberPrint technology provides transparency and validity for recycled content 11


12 Global Supply Chain Excellence Asia Increase global availability of REPREVE through license agreements and distribution networks: Sri Lanka, Taiwan, Vietnam, Pakistan Successful expansion of asset-light model, providing global supply chain solutions; most recognized for recycled portfolio Proximity to world class customers and partners Brazil Strong management team Innovation and mix enrichment strategy Recent market share gains Disciplined price management Manufacturing efficiencies and cost control 12
13 Capital Allocation: Investing for the Future FY16: Invested ~ $60 million Neared completion of bottle processing plant (currently operating) Commenced another expansion of our REPREVE Recycling Center Enhanced our automation systems FY17: Invested ~ $40 million Neared completion of fourth REPREVE Recycling Center production line (coming online) (increase Chip production from 72 to 100 million pounds) Additional machinery modifications to accommodate dynamic customer preferences Added bi-component machinery for technical manufacturing FY18 and Near-Term: Invest first in the Business: Investments in Asia for growth (supporting our customers global supply chains) Continue to evaluate opportunities to expand existing business and pursue PVA growth opportunities Continue maintenance capex of approx. $12 - $15 million per year Maintain leverage ratio 1 around 1.5x, consistent with recent years Consider share repurchases under the existing $27 million of remaining authority 1 Calculated as debt principal divided by Adjusted EBITDA Source: Unifi Internal Estimates 13
14 Summary Financial Data 14
15 Profitability Trends Net Income 1 and Diluted EPS (GAAP) In US$ MM and $/Share $42.2 $28.8 $34.4 $ Net income attributable to Unifi, Inc. * Approximates the performance metric for Unifi, Inc., excluding equity in earnings of Parkdale America, LLC. Unifi Excluding PAL * PAL Underlying ** PAL Bargain Purchase Gains (FY 2015 only) EPS: $1.47 $2.24 $1.87 $1.78 FY 2014 FY 2015 FY 2016 FY 2017 ** Approximates applying a 35% tax rate to the Company s equity in earnings of Parkdale America, LLC, excluding the relevant bargain purchase gains (presented separately with no tax impact) Adjusted Net Income 2 and Adjusted EPS 2 In US$ MM and $/Share $1.47 $28.8 $1.88 $35.3 $1.95 $1.87 $35.9 $ % $52.0 Adjusted EBITDA 2 In US$ MM and as % of Net Sales 8.7% $ % 10.1% $65.4 $65.6 FY 2014 FY 2015 FY 2016 FY 2017 FY 2014 FY 2015 FY 2016 FY See the Appendix for reconciliation of this non-gaap metric. Source: Unifi FY 2017 Form 10-K and Appendix 15
16 Profitability by Segment 12.1% Gross Profit Consolidated Total In US$ MM and as % of Net Sales 13.2% $ % 14.5% $93.6 $94.2 Gross Profit International Segment In US$ MM and as % of Net Sales 12.1% 15.9% 21.9% 24.5% $42.6 $83.3 $16.3 $21.4 $26.9 FY 2014 FY 2015 FY 2016 FY 2017 Gross Profit Polyester Segment In US$ MM and as % of Net Sales 12.8% 12.9% 11.8% 11.3% $50.8 $47.6 $49.5 $40.1 FY 2014 FY 2015 FY 2016 FY 2017 Gross Profit Nylon Segment In US$ MM and as % of Net Sales 13.0% 12.7% 13.5% $19.3 $19.0 $ % $12.1 FY 2014 FY 2015 FY 2016 FY 2017 FY 2014 FY 2015 FY 2016 FY 2017 Source: Unifi FY 2017 Form 10-K and FY 2015 Form 10-K 16
17 Cash Flow, Balance Sheet Highlights Cash Flow from Operating Activities (In US$ MM) Adjusted Working Capital 1 $56.4 $38.9 $56.0 $46.1 Adjusted Working Capital (US$ MM) Adjusted Working Capital (% of net sales) $137 $134 $127 $ % 19.5% 19.7% 20.8% FY 2014 FY 2015 FY 2016 FY Receivables, net plus inventories, less accounts payable and accrued expenses. FY 2014 FY 2015 FY 2016 FY % $83.6 Net Debt * and Average Interest Rate In US$ MM 2.4% 2.6% $94.1 $ % $94.0 * debt principal less cash and cash equivalents. Share Repurchases (In US$ MM) and Shares Outstanding - (MM) $36.6 $10.4 $6.2 $0.0 FY 2014 FY 2015 FY 2016 FY 2017 FY 2014 FY 2015 FY 2016 FY 2017 Source: Unifi FY 2017 Form 10-K and Unifi FY 2015 Form 10-K 17
18 Investing in Growth & Margin Expansion Investment Thesis Favorable industry dynamics: Global consumer preferences toward synthetic products with innovative attributes Strong interest in sustainable solutions, with customers maintaining brand integrity Defensible scale and foundation Global footprint with proximity to world-class brands and production centers Significant U.S. asset base with state-of-the-art technology and recycled fiber production Flexible operating model for expansion into new markets and geographies Ability to use contract manufacturing or make direct investment Diverse markets and broad product lines drive long-term opportunities Strong balance sheet and cash flows could provide other avenues to accelerate growth and fuel strategic investments 18
19 Appendix 19


20 REPREVE Bottle Processing Center One of the most advanced, 150,000 sq. ft. state-of-the-art recycling centers in the U.S. Annual capacity to produce 75 million pounds of the highest quality, clean Flake Full capacity can consume the equivalent of 2.2 billion water bottles per year 10 tons of bottles/hr. Letter of No Objection from the FDA; allows for the sale of Flake for Food-Grade Packaging 20


21 REPREVE Recycling Center pre-consumer waste post-consumer waste REPREVE Chip 21


22 Wide Selection of Recycled Products Filament performance & sustainability spun yarns blends Staple Fiber Nylon pre-consumer fiber waste PET Flake post & preconsumer fiber waste PET Resin / Chip post- & preconsumer fiber waste Fiberprint Technology SCS Certified 22

 - Cotton Polyester Nylon All Other Source: PCI")
23 Global Textile Fibers Market is Growing % 22% 9% 22% 37% 41% 6% 16% e 2018e 2019e 2020e Billion Pounds 14% 33% 49% 5% 13% 27% 55% 5% 14% 58% 23% 5% 3% AAGR 2% AAGR 4% AAGR Flat to -1% 2 to 3% AAGR ( ) - Cotton Polyester Nylon All Other Source: PCI Fibers 23
24 % 54% 48% 43% 38% 34% 30% 24% 22% 18% 18% 18% 18% 18% 18% 17% 18% 19% 16% 31% 34% 41% 41% 49% 50% 49% 49% 49% 50% 49% 48% 13% 10% 10% 2% 4% 5% 0% 0% 4% 5% 6% 7% 8% 8% 8% 9% 10% 10% 11% 12% Billion SME (Square Meters) 34% 36% 37% 38% 38% 31% 32% 29% 29% 25% 24% 25% 24% 24% 22% 23% 22% Synthetic Apparel Supply Growing Synthetic Apparel Consumption Share Synthetic Apparel Consumption 100% 18 90% 16 80% 70% 60% 50% 40% 30% 20% % 2 0% - REGION CHINA VIETNAM REST OF THE WORLD REGION CHINA VIETNAM REST OF THE WORLD Regional supply share stabilized, volume in units growing at the rate of 4 to 6% per year * Region includes NAFTA, CAFTA, Colombia FTA, and Peru FTA Source: OTEXA, Census Bureau, DOC, Federal Reserve, and Internal Estimates 24

25 Investment in Parkdale America, LLC 34% Ownership Provides Diversity to UNIFI Fluctuations in fiber preferences and global dynamics provide a natural hedge Increased Production of Cotton Blends Opportunity for combined expansion and growth Experienced Management Team Long-standing customer relationships and competitive position Efficient Asset Base and Operational Diligence Insight and experience driving long-term high-quality operations Generating Cash After Large CapEx Plan Minimal related-party debt; no third-party debt 25
26 Parkdale America, LLC Highlights $49.0 PAL EBITDA (In US$ MM) $53.9 $42.4 Selected Balance Sheet Data In US$ MM $20.0 $26.4 $11.4 $8.9 $5.0 Cash Debt $0.0 CY 2014 CY 2015 CY 2016 Dec 2014 Dec 2015 Dec 2016 (In thousands) CY 2014 CY 2015 CY 2016 Net income $ 41,205 $ 37,048 $ 11,447 Interest expense, net (59) Provision for income taxes ,026 Depreciation and amortization 27,848 41,922 44,951 Cotton rebate income (15,980) (16,570) (14,949) Gain on acquisitions (4,430) (9,382) - EBITDA $ 49,013 $ 53,939 $ 42,416 Cash Flow from Operating Activities (In US$ MM) $53.9 $91.6 $50.8 Source: Audited financial statements for Parkdale America, LLC within the Company's Forms 10-K/A for fiscal 2016, 2015 and 2014 Source: Unifi s Forms 10-K/A for fiscal 2016 and fiscal 2014 CY 2014 CY 2015 CY
27 Non-GAAP Reconciliations Adjusted EBITDA FY 2017 FY 2016 FY 2015 FY 2014 Net Income Attributable to Unifi, Inc. $ 32,875 $ 34,415 $ 42,151 $ 28,823 Interest Expense, Net 3,030 2,884 3,109 2,539 Provision for Income Taxes 10,898 15,073 13,346 20,161 Depreciation and Amortization 19,851 16,893 17,367 17,334 EBITDA including Equity Affiliates 66,654 69,265 75,973 68,857 Equity in Earnings of PAL (2,723) (6,074) (17,403) (17,846) EBITDA excluding Equity in Earnings of PAL 63,931 63,191 58,570 51,011 Loss on Sale of Business 1, Key Employee Transition Costs - 2, Loss on Extinguishment of Debt - - 1,040 - Adjusted EBITDA $ 65,593 $ 65,357 $ 59,610 $ 51,952 Note: Amounts presented in the reconciliation above may not be consistent with amounts included in the Company s Consolidated Financial Statements. Any inconsistencies are insignificant and are integral to the reconciliations. Note: See the FY 2017 and FY 2016 Forms 10-K for additional descriptions of these reconciliations. 27
28 Non-GAAP Reconciliations Adjusted Working Capital The following table presents the components of the Companyʾs working capital and the reconcilation from working capital to Adjusted Working Capital: June 25, 2017 June 26, 2016 June 28, 2015 June 29, 2014 Cash and Cash Equivalents $ 35,425 $ 16,646 $ 10,013 $ 15,907 Receivables, Net 81,121 83,422 83,863 93,925 Inventories 111, , , ,370 Other Current Assets 15,686 8,292 7,473 6,231 Accounts Payable (41,499) (41,593) (45,023) (51,364) Accrued Expenses (16,144) (18,474) (16,640) (18,588) Other Current Liabilities (18,411) (15,241) (13,061) (10,350) Working Capital $ 167,583 $ 136,584 $ 138,240 $ 149,131 Less: Cash and Cash Equivalents (35,425) (16,646) (10,013) (15,907) Less: Other Current Assets (15,686) (8,292) (7,473) (6,231) Less: Other Current Liabilities 18,411 15,241 13,061 10,350 Adjusted Working Capital $ 134,883 $ 126,887 $ 133,815 $ 137,343 Note: See the FY 2017 and FY 2016 Forms 10-K for additional descriptions of these reconciliations. 28
29 Non-GAAP Reconciliations Adjusted Net Income and Adjusted EPS Fiscal Year 2017 Pre-tax income Tax Impact Net Income Diluted EPS GAAP results $ 43,275 $ (10,898) $ 32,875 $ 1.78 Loss on sale of business 1,662-1, Adjusted results $ 44,937 $ (10,898) $ 34,537 $ Weighted average common shares outstanding 18,443 Fiscal Year 2016 Pre-tax income Tax Impact Net Income Diluted EPS GAAP results $ 48,243 $ (15,073) $ 34,415 $ 1.87 Key employee transition costs 2,330 (673) 1, Adjusted results $ 50,573 $ (15,746) $ 35,908 $ Weighted average common shares outstanding 18,415 Note: See the FY 2017 and FY 2016 Forms 10-K for additional descriptions of these reconciliations. 29
30 Non-GAAP Reconciliations Adjusted Net Income and Adjusted EPS - (Continued) Fiscal Year 2015 Pre-tax income Tax Impact Net Income Diluted EPS GAAP results $ 53,812 $ (13,346) $ 42,151 $ 2.24 Change in deferred tax liability for unremitted foreign earnings assertion - (7,639) (7,639) (0.41) Change in deferred tax asset for certain foreign currency transactions - 3,008 3, Change in uncertain tax positions - 2,879 2, Renewable energy tax credits - (1,036) (1,036) (0.05) Bargain purchase gains for an equity affiliate (4,696) - (4,696) (0.25) Loss on extinguishment of debt 1,040 (364) Adjusted results $ 50,156 $ (16,498) $ 35,343 $ Weighted average common shares outstanding 18,836 Fiscal Year 2014 Pre-tax income Tax Impact Net Income Diluted EPS GAAP results $ 47,881 $ (20,161) $ 28,823 $ 1.47 Severance charges 941 (329) Change in deferred tax liability for unremitted foreign earnings assertion Change in uncertain tax positions - (174) (174) (0.01) Interest income related to judicial claim (1,084) 369 (715) (0.03) Adjusted results $ 47,738 $ (20,046) $ 28,795 $ Weighted average common shares outstanding 19,621 Note: See the FY 2017 and FY 2016 Forms 10-K for additional descriptions of these reconciliations. 30
31 Non-GAAP Financial Measures Certain non-gaap financial measures included herein are designed to complement the financial information presented in accordance with GAAP. These non-gaap financial measures include Earnings Before Interest, Taxes, Depreciation and Amortization ( EBITDA ), Adjusted EBITDA, Adjusted Net Income and Adjusted EPS (collectively, the non-gaap financial measures ). EBITDA represents Net income attributable to Unifi, Inc. before net interest expense, income tax expense, and depreciation and amortization expense. Adjusted EBITDA represents EBITDA adjusted to exclude equity in earnings of Parkdale America, LLC and, from time to time, certain other adjustments necessary to understand and compare the underlying results of the Company. Adjusted Net Income represents Net income attributable to Unifi, Inc. calculated under GAAP, adjusted to exclude the approximate after-tax impact of certain income or expense items (as well as specific impacts to the provision for income taxes) necessary to understand and compare the underlying results of the Company. Adjusted Net Income excludes certain amounts which management believes do not reflect the ongoing operations and performance of the Company, such as key employee transition costs and loss on sale of business. Adjusted EPS represents Adjusted Net Income divided by the Company s diluted weighted average common shares outstanding. Adjusted Working Capital (receivables plus inventory, less accounts payable and accrued expenses), which is an indicator of UNIFI s production efficiency and ability to manage inventory and receivables. The non-gaap financial measures are not determined in accordance with GAAP and should not be considered a substitute for performance measures determined in accordance with GAAP. The calculations of the non-gaap financial measures are subjective, based on management s belief as to which items should be included or excluded in order to provide the most reasonable and comparable view of the underlying operating performance of the business. We may, from time to time, modify the amounts used to determine our non-gaap financial measures. When applicable, management s discussion and analysis includes specific consideration for items that comprise the reconciliations of its non-gaap financial measures. We believe that these non-gaap financial measures better reflect the Company s underlying operations and performance and that their use, as operating performance measures, provides investors and analysts with a measure of operating results unaffected by differences in capital structures, capital investment cycles and ages of related assets, among otherwise comparable companies. Management uses Adjusted EBITDA (i) as a measurement of operating performance because it assists us in comparing our operating performance on a consistent basis, as it removes the impact of (a) items directly related to our asset base (primarily depreciation and amortization) and (b) items that we would not expect to occur as a part of our normal business on a regular basis; (ii) for planning purposes, including the preparation of our annual operating budget; (iii) as a valuation measure for evaluating our operating performance and our capacity to incur and service debt, fund capital expenditures and expand our business; and (iv) as one measure in determining the value of other acquisitions and dispositions. Adjusted EBITDA is a key performance metric utilized in the determination of variable compensation. We also believe Adjusted EBITDA is an appropriate supplemental measure of debt service capacity, because it serves as a high-level proxy for cash generated from operations and is relevant to our fixed charge coverage ratio. Equity in earnings of PAL is excluded from Adjusted EBITDA because such earnings do not reflect our operating performance. Management uses Adjusted Net Income and Adjusted EPS (i) as measurements of net operating performance because they assist us in comparing such performance on a consistent basis, as they remove the impact of (a) items that we would not expect to occur as a part of our normal business on a regular basis and (b) components of the provision for income taxes that we would not expect to occur as a part of our underlying taxable operations; (ii) for planning purposes, including the preparation of our annual operating budget; and (iii) as measures in determining the value of other acquisitions and dispositions. Historically, EBITDA, Adjusted EBITDA, Adjusted Net Income and Adjusted EPS aimed to exclude the impact of the non-controlling interest in Repreve Renewables, LLC, while the consolidated amounts for such entity were required to be included in the Company s financial amounts reported under GAAP. In evaluating non-gaap financial measures, investors should be aware that, in the future, we may incur expenses similar to the adjustments included herein. Our presentation of non-gaap financial measures should not be construed as indicating that our future results will be unaffected by unusual or non-recurring items. Each of our non-gaap financial measures has limitations as an analytical tool, and you should not consider it in isolation or as a substitute for analysis of our results or liquidity measures as reported under GAAP. Some of these limitations are (i) it is not adjusted for all non-cash income or expense items that are reflected in our statements of cash flows; (ii) it does not reflect the impact of earnings or charges resulting from matters we consider not indicative of our ongoing operations; (iii) it does not reflect changes in, or cash requirements for, our working capital needs; (iv) it does not reflect the cash requirements necessary to make payments on our debt; (v) it does not reflect our future requirements for capital expenditures or contractual commitments; (vi) it does not reflect limitations on or costs related to transferring earnings from our subsidiaries to us; and (vii) other companies in our industry may calculate this measure differently than we do, limiting its usefulness as a comparative measure. Because of these limitations, these non-gaap financial measures should not be considered as a measure of discretionary cash available to us to invest in the growth of our business or as a measure of cash that will be available to us to meet our obligations, including those under our outstanding debt obligations. You should compensate for these limitations by relying primarily on our GAAP results and using these measures only as supplemental information. 31
Conference Call Presentation
 Conference Call Presentation First Quarter Ended September 24, 207 (Unaudited Results) Cautionary Statement on Forward-Looking Statements Certain statements included herein contain forward-looking statements
INVESTOR MEETINGS November 2007
 INVESTOR MEETINGS November 2007 Cautionary Statement Certain statements included herein contain forward-looking statements within the meaning of federal security laws about Unifi, Inc. s (the Company )
Fourth Quarter and FY 2017 Earnings Presentation November 29, 2017
 Fourth Quarter and FY 2017 Earnings Presentation November 29, 2017 Cautionary statements This presentation contains forward-looking statements that are subject to known and unknown risks and uncertainties,
Kraton Corporation. First Quarter 2018 Earnings Presentation. April 26, 2018
 Kraton Corporation First Quarter 2018 Earnings Presentation April 26, 2018 Disclaimers Forward Looking Statements Some of the statements and information in this presentation contain forward-looking statements
Gardner Denver Reports Strong Second Quarter 2018 Results and Raises Full Year 2018 Adjusted EBITDA Midpoint Guidance
 August 1, 2018 Gardner Denver Reports Strong Second Quarter 2018 Results and Raises Full Year 2018 Adjusted EBITDA Midpoint Guidance Revenues of $668.2 million increased 15% over the prior year, supported
Owens Corning Focused on Shareholder Value
 Owens Corning Focused on Shareholder Value Q3 2017 This presentation shared at the following event(s): 8/29/17 OC Roadshow Hosted by KeyBanc West Coast Michael McMurray, Chief Financial Officer Forward-Looking
SHAREHOLDERS TO OUR. We FINANCED with discipline, bolstering our balance sheet by reloading the term loan to improve our financial flexibility.
 ANNUAL REPORT 2016 TO OUR SHAREHOLDERS Our financial results for fiscal 2016 exhibit further growth in our core business. These results reflect strong sales of Premium Value-Added (PVA) products, supported
Unifi, Inc. Second Quarter Ended December 24, 2006 Conference Call
 Unifi, Inc. Second Quarter Ended December 24, 2006 Conference Call Cautionary Statement Certain statements included herein contain forward-looking statements within the meaning of federal securities laws
Fourth Quarter 2017 Earnings Conference Call
 Fourth Quarter 2017 Earnings Conference Call NYSE: CVA Photos courtesy of LCSWMA. Cautionary Statements All information included in this earnings presentation is based on continuing operations, unless
Debt. interested. reduction. Form 10-K. Margin EBITDA.
 RECONCILIATION OF NON-GAAP FINANCIAL MEASURESS TO THE MOST DIRECTLY COMPARABLE GAAP FINANICAL MEASURES Fourth Quarter and Fulll Year Ended December 31, 2017 USE OF NON-GAAP FINANCIAL MEASURES Kraton Corporation
Our Transformation Continues. March 21, 2018
 Our Transformation Continues March 21, 2018 Disclosure Regarding Forward-Looking Statements Forward-Looking Statements and Factors That May Affect Future Results: Throughout this presentation, we make
4Q 2016 Earnings Webcast. Solutions that Protect and Promote the World s Great Brands
 4Q 2016 Earnings Webcast Solutions that Protect and Promote the World s Great Brands Net Sales (US$ millions) $500 $1,900 $1,835.2 $450 $1,800 $1,738.6 $1,741.6 $1,700 $400 $379.8 $373.8 $379.8 $373.8
ADVANSIX ANNOUNCES SECOND QUARTER 2018 FINANCIAL RESULTS
 AdvanSix.com News Release ADVANSIX ANNOUNCES SECOND QUARTER 2018 FINANCIAL RESULTS Sales of $400 million, up 11% versus prior year Cash Flow from Operations of $33 million, up 12% versus prior year Earnings
FAIR ISAAC CORPORATION CONDENSED CONSOLIDATED BALANCE SHEETS (In thousands) (Unaudited)
 (Unaudited)") CONDENSED CONSOLIDATED BALANCE SHEETS (In thousands) March 31, September 30, 2016 2015 ASSETS: Current assets: Cash and cash equivalents $ 85,374 $ 86,120 Accounts receivable, net 155,207 158,773 Prepaid
CONDENSED CONSOLIDATED BALANCE SHEETS (In thousands) March 31, September 30, 2016 2015 ASSETS: Current assets: Cash and cash equivalents $ 85,374 $ 86,120 Accounts receivable, net 155,207 158,773 Prepaid
FAIR ISAAC CORPORATION CONDENSED CONSOLIDATED BALANCE SHEETS (In thousands) (Unaudited)
 (Unaudited)") CONDENSED CONSOLIDATED BALANCE SHEETS (In thousands) June 30, September 30, 2016 2015 ASSETS: Current assets: Cash and cash equivalents $ 118,155 $ 86,120 Accounts receivable, net 155,196 158,773 Prepaid
CONDENSED CONSOLIDATED BALANCE SHEETS (In thousands) June 30, September 30, 2016 2015 ASSETS: Current assets: Cash and cash equivalents $ 118,155 $ 86,120 Accounts receivable, net 155,196 158,773 Prepaid
ADVANSIX ANNOUNCES FOURTH QUARTER AND FULL YEAR 2017 FINANCIAL RESULTS. 4Q17 Sales of $370 million, up 43% versus prior year
 AdvanSix.com News Release ADVANSIX ANNOUNCES FOURTH QUARTER AND FULL YEAR 2017 FINANCIAL RESULTS 4Q17 Sales of $370 million, up 43% versus prior year 4Q17 Cash Flow from Operations of $36 million, down
FAIR ISAAC CORPORATION CONDENSED CONSOLIDATED BALANCE SHEETS (In thousands) (Unaudited)
 (Unaudited)") CONDENSED CONSOLIDATED BALANCE SHEETS (In thousands) June 30, September 30, 2018 2017 ASSETS: Current assets: Cash and cash equivalents $ 119,929 $ 105,618 Accounts receivable, net 182,419 168,586 Prepaid
CONDENSED CONSOLIDATED BALANCE SHEETS (In thousands) June 30, September 30, 2018 2017 ASSETS: Current assets: Cash and cash equivalents $ 119,929 $ 105,618 Accounts receivable, net 182,419 168,586 Prepaid
FAIR ISAAC CORPORATION CONDENSED CONSOLIDATED BALANCE SHEETS (In thousands) (Unaudited)
 (Unaudited)") CONDENSED CONSOLIDATED BALANCE SHEETS (In thousands) 2018 2017 ASSETS: Current assets: Cash and cash equivalents $ 90,023 $ 105,618 Accounts receivable, net 208,865 168,586 Prepaid expenses and other current
CONDENSED CONSOLIDATED BALANCE SHEETS (In thousands) 2018 2017 ASSETS: Current assets: Cash and cash equivalents $ 90,023 $ 105,618 Accounts receivable, net 208,865 168,586 Prepaid expenses and other current
Kraton Performance Polymers, Inc.
 Kraton Performance Polymers, Inc. Third Quarter 2015 Earnings Conference Call October 29, 2015 Forward Looking Statement Disclaimer This presentation includes forward looking statements that reflect our
Gardner Denver Reports Record First Quarter 2018 Results and Increases EBITDA Guidance for Full Year
 April 26, 2018 Gardner Denver Reports Record First Quarter 2018 Results and Increases EBITDA Guidance for Full Year Revenues of $619.6 million increased 29% over the prior year, supported by strong and
Our Transformation Continues Sidoti NDR May 29-30, 2018
 Our Transformation Continues Sidoti NDR May 29-30, 2018 Disclosure Regarding Forward-Looking Statements Forward-Looking Statements and Factors That May Affect Future Results: Throughout this presentation,
Investor Presentation. March 2018
 Investor Presentation March 2018 Forward Looking Statements This presentation contains forward-looking statements within the meaning of the Private Securities Litigation Reform Act of 1995, including but
CPI Card Group Inc. Reports Fourth Quarter and Full Year 2016 Results
 NEWS RELEASE CPI Card Group Inc. Reports Fourth Quarter and Full Year 2016 Results 3/1/2017 Q4 Net Sales of $67.4 million, Full Year 2016 Net Sales of $308.7 million Full Year Net Income from Continuing
Itron, Inc. Comparison of Key 2015 Financial Metrics to Preliminary Results Announced February 17, Total operating expenses 486, ,839
 Itron, Inc. Comparison of Key 2015 Financial Metrics to Preliminary Results Announced February 17, 2016 (Unaudited, in thousands, except per share data) (announced Feb. 17, 2016) Preliminary FY 2015 Final
Gardner Denver Holdings, Inc. (Exact name of registrant as specified in its charter)
") UNITED STATES SECURITIES AND EXCHANGE COMMISSION Washington, D.C. 20549 FORM 8-K CURRENT REPORT Pursuant to Section 13 or 15(d) of the Securities Exchange Act of 1934 Date of Report (Date Earliest Event
UNITED STATES SECURITIES AND EXCHANGE COMMISSION Washington, D.C. 20549 FORM 8-K CURRENT REPORT Pursuant to Section 13 or 15(d) of the Securities Exchange Act of 1934 Date of Report (Date Earliest Event
CSG SYSTEMS INTERNATIONAL, INC. DISCLOSURES FOR NON-GAAP FINANCIAL MEASURES
 CSG SYSTEMS INTERNATIONAL, INC. DISCLOSURES FOR NON-GAAP FINANCIAL MEASURES Use of Non-GAAP Financial Measures and Limitations To supplement its condensed consolidated financial statements presented in
Avery Dennison Jefferies Industrials Conference
 Avery Dennison Jefferies Industrials Conference August 9, 2016 Anne Bramman SVP and Chief Financial Officer 1 Avery Dennison Investor Presentation Forward-Looking Statements Certain statements contained
Kraton Performance Polymers, Inc.
 Kraton Performance Polymers, Inc. September 17, 2015 Forward Looking Statement Disclaimer This presentation includes forward looking statements that reflect our plans, beliefs, expectations and current
Steve Martens VP Investor Relations FY13 Q3
 Steve Martens VP Investor Relations steve.martens@molex.com FY13 Q3 Forward-Looking Statement Statements in this presentation that are not historical are forward-looking and are subject to various risks
Third Quarter 2018 Earnings Conference Call
 Third Quarter 2018 Earnings Conference Call NYSE: CVA Cautionary Statements All information included in this earnings presentation is based on continuing operations, unless otherwise noted. Forward-Looking
KRATON PERFORMANCE POLYMERS, INC. FOURTH QUARTER 2012 EARNINGS CONFERENCE CALL. February 28, 2013
 KRATON PERFORMANCE POLYMERS, INC. FOURTH QUARTER 2012 EARNINGS CONFERENCE CALL February 28, 2013 Forward-Looking Statement Disclaimer This presentation includes forward-looking statements that reflect
First Quarter 2018 Earnings Conference Call
 First Quarter 2018 Earnings Conference Call NYSE: CVA Cautionary Statements All information included in this earnings presentation is based on continuing operations, unless otherwise noted. Forward-Looking
ON Semiconductor Reports First Quarter 2018 Results
 News Release ON Semiconductor Reports First Quarter Results Revenue of $1,377.6 million Gross margin of 37.6 percent GAAP operating margin of 13.5 percent and non-gaap operating margin of 15.7 percent
RECONCILIATION OF NON-GAAP FINANCIAL MEASURES TO THE MOST DIRECTLY COMPARABLE GAAP FINANCIAL MEASURES
 RECONCILIATION OF NON-GAAP FINANCIAL MEASURES TO THE MOST DIRECTLY COMPARABLE GAAP FINANCIAL MEASURES For the Quarter Ended September 30, 2018 USE OF NON-GAAP FINANCIAL MEASURES Kraton Corporation ( Kraton
ITRON, INC. CONSOLIDATED STATEMENTS OF OPERATIONS
 , INC. CONSOLIDATED STATEMENTS OF OPERATIONS (Unaudited, in thousands, except per share data) Revenues $ 447,536 $ 571,640 Cost of revenues 307,413 388,535 Gross profit 140,123 183,105 Operating expenses
CPI Card Group Inc. Reports Fourth Quarter and Full Year 2015 Results
 CPI Card Group Inc. Reports Fourth Quarter and Full Year 2015 Results Fourth Quarter Net Sales of $93.6 million and Pro Forma Adjusted Diluted EPS of $0.16 Initiates Quarterly Dividend Announces 2016 Financial
ITRON, INC. CONSOLIDATED STATEMENTS OF OPERATIONS
 , INC. CONSOLIDATED STATEMENTS OF OPERATIONS (Unaudited, in thousands, except per share data) Revenues $ 474,795 $ 447,536 Cost of revenues 320,260 307,413 Gross profit 154,535 140,123 Operating expenses
ITRON, INC. CONSOLIDATED STATEMENTS OF OPERATIONS
 , INC. CONSOLIDATED STATEMENTS OF OPERATIONS (Unaudited, in thousands, except per share data) Revenues $ 489,353 $ 482,175 $ 964,148 $ 929,711 Cost of revenues 326,312 322,587 646,572 630,000 Gross profit
ITRON, INC. CONSOLIDATED STATEMENTS OF OPERATIONS
 , INC. CONSOLIDATED STATEMENTS OF OPERATIONS (Unaudited, in thousands, except per share data) Revenues $ 571,640 $ 563,691 Cost of revenues 388,535 378,713 Gross profit 183,105 184,978 Operating expenses
For more information, contact: Brad Pogalz (952)
") For more information, contact: Brad Pogalz (952) 887-3753 Donaldson Reports Fourth Quarter and Full-Year 2017 Earnings Fourth quarter 2017 sales increased 11.2 percent, full-year sales increased 6.8 percent
For more information, contact: Brad Pogalz (952) 887-3753 Donaldson Reports Fourth Quarter and Full-Year 2017 Earnings Fourth quarter 2017 sales increased 11.2 percent, full-year sales increased 6.8 percent
Fourth-Quarter and Full-Year 2016 Financial Results. Mark Costa, Board Chair & CEO Curt Espeland, EVP & CFO January 27, 2017
 Fourth-Quarter and Full-Year 2016 Financial Results Mark Costa, Board Chair & CEO Curt Espeland, EVP & CFO January 27, 2017 Forward-looking statements During this presentation, we make certain forward-looking
Fourth Quarter and Full Year 2018 Financial Review and Analysis
 Fourth Quarter and Full Year 2018 Financial Review and Analysis (preliminary, unaudited) Supplemental Presentation Materials Unless otherwise indicated, comparisons are to the same periods in the prior
Waste Management Announces First Quarter Earnings
 Waste Management Announces First Quarter Earnings April 29, 2015 Disciplined Core Price Growth and Continued Cost Control Focus Contributed to Solid Quarter Company Reaffirms Full-Year Guidance HOUSTON--(BUSINESS
ADVANSIX ANNOUNCES THIRD QUARTER 2017 FINANCIAL RESULTS. Sales of $367 million, up 13% versus prior year
 AdvanSix.com News Release ADVANSIX ANNOUNCES THIRD QUARTER 2017 FINANCIAL RESULTS Sales of $367 million, up 13% versus prior year Cash Flow from Operations of $38 million, up $13 million versus prior year
Teradyne, Inc. Certain Non-GAAP financial measures discussed during the Third Quarter of 2011 Earnings Conference Call October 2011
 Teradyne, Inc. Certain Non-GAAP financial measures discussed during the Third Quarter of 2011 Earnings Conference Call October 2011 On the Company s earnings conference call on October 27, 2011, the following
Q1 FY18 Results and Acquisition of KapStone Paper & Packaging Corporation. January 29, 2018
 Q1 FY18 Results and Acquisition of KapStone Paper & Packaging Corporation January 29, 2018 Forward Looking Statements This presentation contains forward-looking statements within the meaning of the Private
ON Semiconductor Reports Fourth Quarter and 2017 Annual Results
 News Release ON Semiconductor Reports Fourth Quarter and 2017 Annual Results For the fourth quarter of 2017, highlights include: Revenue of $1,377.5 million GAAP gross margin of 37.3 percent and non-gaap
ITRON, INC. CONSOLIDATED STATEMENTS OF OPERATIONS
 , INC. CONSOLIDATED STATEMENTS OF OPERATIONS (Unaudited, in thousands, except per share data) Revenues $ 504,063 $ 615,555 $ 1,654,843 $ 1,791,647 Cost of revenues 332,266 438,559 1,103,196 1,237,722 Gross
ITRON, INC. CONSOLIDATED STATEMENTS OF OPERATIONS
 , INC. CONSOLIDATED STATEMENTS OF OPERATIONS (Unaudited, in thousands, except per share data) Revenues $ 523,335 $ 642,477 $ 2,178,178 $ 2,434,124 Cost of revenues 359,835 449,944 1,463,031 1,687,666 Gross
ITRON, INC. CONSOLIDATED STATEMENTS OF OPERATIONS
 , INC. CONSOLIDATED STATEMENTS OF OPERATIONS (Unaudited, in thousands, except per share data) Revenues $ 470,103 $ 489,353 $ 918,350 $ 964,148 Cost of revenues 351,532 326,312 661,580 646,572 Gross profit
Results Presentation Q1FY2014
 Results Presentation Q1FY2014 Financials & Key Ratios 2 Q1FY2014 Financials (Consolidated) Focus on niche high value products combined with improved raw material sourcing enables strong increase in profitability
Cooper Standard Reports Record Sales, Strong Net Income and Record Adjusted EBITDA
 August 3, 2017 Cooper Standard Reports Record Sales, Strong Net Income and Record Adjusted EBITDA NOVI, Mich., Aug. 3, 2017 /PRNewswire/ -- Cooper-Standard Holdings Inc. (NYSE: CPS) today reported results
A X A L T A C O A T I N G S Y S T E M S. Q4 & FULL YEAR 2016 FINANCIAL RESULTS February 8 th, 2017
 A X A L T A C O A T I N G S Y S T E M S Q4 & FULL YEAR 2016 FINANCIAL RESULTS February 8 th, 2017 Legal Notices Forward-Looking Statements This presentation and the oral remarks made in connection herewith
Investor Contact: Aida Orphan Media Contact: Amber McCasland (415) (415)
 (415)") FOR IMMEDIATE RELEASE Investor Contact: Aida Orphan Media Contact: Amber McCasland Levi Strauss & Co. Levi Strauss & Co. (415) 501-6194 (415) 501-7777 Investor-relations@levi.com newsmediarequests@levi.com
FOR IMMEDIATE RELEASE Investor Contact: Aida Orphan Media Contact: Amber McCasland Levi Strauss & Co. Levi Strauss & Co. (415) 501-6194 (415) 501-7777 Investor-relations@levi.com newsmediarequests@levi.com
Gardner Denver Reports Strong Third Quarter 2018 Results
 Gardner Denver Reports Strong Third Quarter 2018 Results October 25, 2018 Revenues of $689 million increased 6% over the prior year Reported net income of $72 million compared to prior year of $28 million
Gildan Investor Presentation
 Gildan Investor Presentation National Bank Financial Markets 7 th Annual Quebec Conference Toronto June 7, 2017 Rhodri J. Harries Executive Vice-President, Chief Financial & Administrative Officer Forward-looking
Net sales of $1,206.5 million increased 10.8% year-over-year including acquisition contribution of 5.6%
 News Release Axalta Coating Systems 2001 Market Street Suite 3600 Philadelphia, PA 19103 USA Contact Christopher Mecray D +1 215 255 7970 Christopher.Mecray@axalta.com Immediate Release Axalta Releases
INVESTOR BRIEFING. March 2013
 INVESTOR BRIEFING March 2013 Safe Harbor Statement This presentation includes forward-looking statements within the meaning of the Safe Harbor provisions of the Securities Litigation Reform Act of 1995.
ON Semiconductor Reports Third Quarter 2018 Results
 News Release Revenue of $1,541.7 million Gross margin of 38.7 percent GAAP operating margin of 15.7 percent and non-gaap operating margin of 17.8 percent Operating cash flow of $358.2 million and free
2017 THIRD-QUARTER EARNINGS REVIEW October 24, 2017
 2017 THIRD-QUARTER EARNINGS REVIEW October 24, 2017 CAUTIONARY STATEMENT This presentation contains forward-looking statements about Whirlpool Corporation and its consolidated subsidiaries ( Whirlpool
First Quarter 2018 Financial Review and Analysis (preliminary, unaudited)
") First Quarter 2018 Financial Review and Analysis (preliminary, unaudited) Supplemental Presentation Materials Unless otherwise indicated, comparisons are to the same period in the prior year. 1 First Quarter
First Quarter 2018 Financial Review and Analysis (preliminary, unaudited) Supplemental Presentation Materials Unless otherwise indicated, comparisons are to the same period in the prior year. 1 First Quarter
MERCER INTERNATIONAL INC. REPORTS STRONG 2017 THIRD QUARTER RESULTS
 For Immediate Release MERCER INTERNATIONAL INC. REPORTS STRONG 2017 THIRD QUARTER RESULTS Selected Highlights Record quarterly pulp production and energy sales volumes; Higher pulp prices, sales realizations
September 2018 MINERALS TECHNOLOGIES INC. MTI OVERVIEW INNOVATION LEADERSHIP EXCELLENCE
 MINERALS TECHNOLOGIES INC. September 2018 MTI OVERVIEW INNOVATION LEADERSHIP EXCELLENCE SAFE HARBOR STATEMENT This presentation may contain forward-looking statements within the meaning of the Private
Fiscal 2014 Second Quarter Earnings Conference Call Presentation. April 29, 2014
 Fiscal 2014 Second Quarter Earnings Conference Call Presentation April 29, 2014 RockTenn s Fiscal 2014 Second Quarter Earnings Conference Call Presentation Page 1 Cautionary Statement Regarding Forward-Looking
A X A L T A C O A T I N G S Y S T E M S. Q FINANCIAL RESULTS October 27, 2016
 A X A L T A C O A T I N G S Y S T E M S Q3 2016 FINANCIAL RESULTS October 27, 2016 Legal Notices Forward-Looking Statements This presentation and the oral remarks made in connection herewith may contain
PROPOSED COMBINATION OF KRATON PERFORMANCE POLYMERS, INC. WITH THE SBC BUSINESS OF LCY CHEMICAL CORP.
 UPDATE CALL PROPOSED COMBINATION OF KRATON PERFORMANCE POLYMERS, INC. WITH THE SBC BUSINESS OF LCY CHEMICAL CORP. KRATON PERFORMANCE POLYMERS, INC. KEVIN M. FOGARTY, PRESIDENT AND CHIEF EXECUTIVE OFFICER
XYLEM INC. Q EARNINGS RELEASE FEBRUARY 1, 2018
 XYLEM INC. Q4 2017 EARNINGS RELEASE FEBRUARY 1, 2018 Q4 2017 EARNINGS RELEASE FORWARD-LOOKING STATEMENTS This presentation contains information that may constitute forward-looking statements. Forward-looking
Fourth Quarter and Full Year 2017 Results. March 1, 2018
 1 Fourth Quarter and Full Year 2017 Results March 1, 2018 Impax Cautionary Statement Regarding Forward Looking Statements 2 "Safe Harbor" statement under the Private Securities Litigation Reform Act of
USG Corporation 3 rd Quarter 2017 Earnings. Earnings Conference Call and Webcast October 26, 2017
 USG Corporation 3 rd Quarter 2017 Earnings Earnings Conference Call and Webcast October 26, 2017 Cautionary Statements This presentation contains forward-looking statements within the meaning of the Private
Sysco Earnings Results 3Q18
 Sysco Earnings Results 3Q18 FORWARD LOOKING STATEMENTS Statements made in this presentation or in our earnings call for the third quarter of fiscal 2018 that look forward in time or that express management
Sealed Air Reports Fourth Quarter and Full Year 2018 Results
 Exhibit 99.1 Sealed Air Corporation 2415 Cascade Pointe Blvd. Charlotte, NC 28208 For release: February 7, 2019 Sealed Air Reports Fourth Quarter and Full Year 2018 Results Solid year-over-year sales and
FOURTH-QUARTER 2017 EARNINGS REVIEW January 25, 2018
 FOURTH-QUARTER 2017 EARNINGS REVIEW January 25, 2018 GLOBAL OVERVIEW INSERT PHOTO HERE Marc Bitzer Chief Executive Officer 2 2017 FOURTH-QUARTER HIGHLIGHTS Ongoing EPS of $4.10 in Q4 and $13.74 for the
Copyright 2018 CPI Card Group. Fourth Quarter & FY 2017 Earnings Conference Call March 12, 2018
 Fourth Quarter & FY 2017 Earnings Conference Call March 12, 2018 Safe Harbor Forward-Looking Statements Statements in this presentation that are not statements of historical fact are forward-looking statements
Fiscal 2018 Third Quarter Results. 28 June 2018
 Fiscal 2018 Third Quarter Results 28 June 2018 Safe harbor and non-gaap Cautionary Note Regarding Forward-Looking Statements: All statements in these materials and the related presentation that are not
FOURTH QUARTER 2017 EARNINGS PRESENTATION FEBRUARY 8, 2018
 FOURTH QUARTER 2017 EARNINGS PRESENTATION FEBRUARY 8, 2018 REGARDING FORWARD-LOOKING STATEMENTS Statements contained in this press release that are not historical facts are forward-looking statements.
Sysco 1Q18 Earnings Results
 Sysco 1Q18 Earnings Results 11.06.17 Forward-Looking Statements Statements made in this presentation or in our earnings call for the first quarter of fiscal 2018 that look forward in time or that express
EARNINGS PRESENTATION
 EARNINGS PRESENTATION Fourth Quarter & Full Year 2017 Aleris Corporation March 19, 2018 Forward-Looking and Other Information IMPORTANT INFORMATION This information is current only as of its date and may
USA Truck, Inc. (NASDAQ: USAK) Investor Presentation February 2016
 Investor Presentation February 2016") USA Truck, Inc. (NASDAQ: USAK) Investor Presentation February 2016 DISCLOSURE STATEMENT This presentation and accompanying comments may contain forward-looking statements within the meaning of Section
USA Truck, Inc. (NASDAQ: USAK) Investor Presentation February 2016 DISCLOSURE STATEMENT This presentation and accompanying comments may contain forward-looking statements within the meaning of Section
Q4 and Full Year 2015 Financial Results March 3, 2016
 Q4 and Full Year 2015 Financial Results March 3, 2016 Trademark of Trinseo S.A. or its affiliates Introductions & Disclosure Rules Introductions Chris Pappas, President & CEO David Stasse, Vice President,
ON Semiconductor Reports Fourth Quarter and 2018 Annual Results
 ON Semiconductor Reports Fourth Quarter and Annual Results For the fourth quarter of, highlights include: Revenue of $1,503.1 million Gross margin of 37.9 percent GAAP operating margin of 14.8 percent
Second Quarter 2018 Earnings
 Second Quarter 2018 Earnings John Visentin, CEO Bill Osbourn, CFO July 26, 2018 http://www.xerox.com/investor Forward-Looking Statements This presentation, and other written or oral statements made from
KRATON PERFORMANCE POLYMERS, INC. SECOND QUARTER 2013 EARNINGS CONFERENCE CALL. August 1, 2013
 KRATON PERFORMANCE POLYMERS, INC. SECOND QUARTER 2013 EARNINGS CONFERENCE CALL August 1, 2013 Forward-Looking Statement Disclaimer This presentation includes forward-looking statements that reflect our
Fourth Quarter and Full Year Earnings Call March 1, 2019
 Fourth Quarter and Full Year Earnings Call March 1, 2019 Safe Harbor & Non-GAAP Financial Measures Cautionary Notice Statements in this news release and the schedules hereto that are not purely historical
Fourth Quarter and FY 2018 Earnings Presentation November 28, 2018
 Fourth Quarter and FY 2018 Earnings Presentation November 28, 2018 Cautionary statements This presentation contains forward-looking statements that are subject to known and unknown risks and uncertainties,
COVANTA HOLDING CORPORATION REPORTS 2018 FOURTH QUARTER AND FULL YEAR RESULTS AND PROVIDES 2019 GUIDANCE
 COVANTA HOLDING CORPORATION REPORTS 2018 FOURTH QUARTER AND FULL YEAR RESULTS AND PROVIDES 2019 GUIDANCE MORRISTOWN, NJ, February 14, 2019 - Covanta Holding Corporation (NYSE: CVA) ("Covanta" or the "Company"),
2016 THIRD-QUARTER EARNINGS REVIEW October 25, 2016
 2016 THIRD-QUARTER EARNINGS REVIEW October 25, 2016 0 THIRD-QUARTER EARNINGS PRESENTATION WHIRLPOOL CORPORATION ADDITIONAL INFORMATION This presentation contains forward-looking statements about Whirlpool
Virtu Announces Fourth Quarter and Full Year 2017 Results
 Virtu Announces Fourth Quarter and Full Year 2017 Results NEW YORK, NY, February 8, 2018 Virtu Financial, Inc. (NASDAQ: VIRT), a leading technology-enabled market maker and liquidity provider to the global
First Quarter 2019 Earnings Presentation February 6, 2019
 First Quarter 2019 Earnings Presentation February 6, 2019 Cautionary statements This presentation contains forward-looking statements that are subject to known and unknown risks and uncertainties, many
Company Delivers Record Quarterly Net Sales of $1.7 Billion, up 12% over the Prior Year
 Company Delivers Record Quarterly Net Sales of $1.7 Billion, up 12% over the Prior Year Mike Thaman Chairman & Chief Executive Officer Michael C. McMurray Chief Financial Officer Third-Quarter Results
September 2018 MINERALS TECHNOLOGIES INC. MTI OVERVIEW INNOVATION LEADERSHIP EXCELLENCE
 MINERALS TECHNOLOGIES INC. September 2018 MTI OVERVIEW INNOVATION LEADERSHIP EXCELLENCE SAFE HARBOR STATEMENT This presentation may contain forward-looking statements within the meaning of the Private
Executing Our Strategy, Delivering Exceptional Value
 Executing Our Strategy, Delivering Exceptional Value Fiscal 2013 Fourth Quarter Earnings Conference Call Presentation November 5, 2013 RockTenn s Fiscal 2013 Fourth Quarter Earnings Conference Call Presentation
Fourth Quarter and Full Year 2017 Financial Results February 19, 2018
 Fourth Quarter and Full Year 2017 Financial Results February 19, 2018 Trademark of Trinseo S.A. or its affiliates Introductions & Disclosure Rules Introductions Chris Pappas, President & CEO Barry Niziolek,
Cash Interest. Adjusted EBITDA Reconciliations
 Non-GAAP Financial Measures Cash Interest Cash Interest is a supplemental non-gaap financial measure that is used by management and external users of the Company s financial statements, such as industry
Waste Management, Inc.
 Waste Management, Inc. Raymond James Institutional Investors Conference March 6, 2018 Cautionary Statement Certain statements provided in this presentation are forward-looking statements within the meaning
Momentive Performance Materials Inc. 22 Corporate Woods Blvd. Albany, NY 12211
 Momentive Performance Materials Inc. 22 Corporate Woods Blvd. Albany, NY 12211 NEWS RELEASE FOR IMMEDIATE RELEASE Momentive Performance Materials Inc. Reports Fourth Quarter and Fiscal Year 2010 Results
GOLDMAN SACHS 17 TH ANNUAL AGRIBUSINESS CONFERENCE. February 26, 2013
 GOLDMAN SACHS 17 TH ANNUAL AGRIBUSINESS CONFERENCE February 26, 2013 DENNIS LEATHERBY, CFO FORWARD-LOOKING STATEMENTS Certain information contained in this presentation may constitute forward-looking statements,
Waste Management Announces First Quarter Earnings
 FOR IMMEDIATE RELEASE Waste Management Announces First Quarter Earnings Revenue Grows 8.3%, Producing Strong Net Income and Cash Flow Earnings Per Diluted Share Grows More Than 15% HOUSTON April 26, 2017
Driving Value Through Culture, Innovation and Results
 Driving Value Through Culture, Innovation and Results THIRD QUARTER 2018 EARNINGS PRESENTATION November 2, 2018 1 Agenda Introduction Business Overview Financial Overview Roger Hendriksen Director, Investor
Fourth Quarter and Full- Year 2017 Earnings February 1, 2018
 Fourth Quarter and Full- Year 207 Earnings February, 208 Forward-Looking Statements Certain statements in these slides and made during this presentation may be considered forward-looking statements. These
CFO Commentary. Third Quarter. Third-quarter diluted earnings per. share increased 33% year over year; non- GAAP diluted. earnings per share
 Third Quarter CFO Commentary As reflected in our earnings release, there are a number of items that impact the comparability of our results with those in the trailing quarter and prior quarter of last