Investor Presentation. November 2018
|
|
|
- Donna Nash
- 5 years ago
- Views:
Transcription

1 Investor Presentation November 2018
2 Forward Looking Statements Certain information discussed today constitutes forward-looking statements. Actual results could differ materially from those presented in the forward looking statements as a result of many factors including general economic conditions, weather, competitive conditions in the Company s industries, both in the U.S. and internationally, and additional factors that are described in the Company s publicly-filed documents, including its 34 Act filings and the prospectuses prepared in connection with the Company s offerings. This presentation includes financial information which the Company s independent auditors have not completely reviewed. Although the Company believes that the assumptions upon which the financial information and its forward looking statements are based are reasonable, it can give no assurances that these assumptions will prove to be accurate. This presentation contains non-gaap financial measures. The Company believes adjusted pretax income, EBITDA and adjusted EBITDA provide additional information to investors and others about its operations, allowing an evaluation of underlying operating performance and better period-to-period comparability. Adjusted pretax income, EBITDA and adjusted EBITDA do not and should not be considered as alternatives to net income or income before income taxes as determined by generally accepted accounting principles. Reconciliations of the GAAP to non-gaap measures may be found in the appendix of this presentation. 2
3 Table of Contents Company and Financial Overview 6 Lansing Trade Group Acquisition 14 Grain Group 18 Ethanol Group 24 Plant Nutrient Group 32 Rail Group Outlook 44 Company Strategy and Goals 45 Appendix 49 3
4 This page left intentionally blank 4


5 Leadership Team Pat Bowe President & CEO Joined: 2015 Brian Valentine SVP & CFO 2018 (August) Val Blanchett VP, Human Resources 2016 Naran Burchinow SVP, General Counsel 2004 Corey Jorgenson President, Grain 2016 Mike Irmen President, Ethanol 1977 Jeff Blair President, Plant Nutrient 2017 (December) Joe McNeely President, Rail 2017 (December) New to ANDE within the last 3 years 5

 Top 10 U.S.")

, which reported 2017 EBITDA of ($6.9M).")
6 The Andersons Founded Listed (NASDAQ) Market Cap 1 Employees U.S. Locations Dividend History , ANDE ~$1.0B ~1,850 ~ Years 5 Year Avg. Adj. EBITDA by Business 3 $48M Grain (23%) $49M Plant Nutrient (24%) $49M Ethanol (24%) $60M Rail (29%) Top 10 U.S. Player in All Four Sectors Diversified Company Rooted in Agriculture Conducting Business Across North America 1 As of 11/2/18. 2 Consecutive years of paying a dividend. 3 Excludes Retail Group (closed in June 2017), which reported 2017 EBITDA of ($6.9M). Ethanol and Grain results exclude ratable portion of IDA adjustments on equity income from affiliates. Non-GAAP measure. See reconciliation tables in Appendix. 6
7 Leveraging Our Solid Foundation CORE STRENGTHS Culture built on strong values and community stewardship Focus on safety and operational efficiency Merchandising, plant operations, logistics and risk management COMPETITIVE DIFFERENTIATORS 70 years of market expertise and ingenuity with unique assets in place to provide customer solutions Well respected history as partner of choice with deep customer relationships Strong market presence in Eastern Corn Belt Strong portfolio and balance sheet to weather industry cycles Solid reputation due to nimble and customized approach Experienced, dedicated leadership focused on profitable growth 7
8 Volume Facilities The Andersons Grain Ethanol Rail Plant Nutrient Purchase, store, handle and merchandize grain Provide value-added risk management and pricing tools to growers Focused in Eastern Corn Belt Growing food ingredients and specialty grains business Refiner of corn into ethanol and coproducts Partnership with Marathon Petroleum; ownership structure mitigates risk Top quartile ethanol production plants Subject to different economic factors than the ag businesses, creating portfolio effect Offsetting cycle value buyers Diversified by car fleet and end markets Growing network of railcar repair facilities Supplier of primary nutrients; strong asset network Manufacturer and distributor of specialty nutrients Diversified product offerings Growing lawn and contract manufacturing fertilizer ~550M Bushels Traded ~475M Gallons ~22,500 Railcar Fleet 2M+ Tons 8


9 Strong Geographic Footprint SK C A N A D A MN WI MI NY CA UT NE IA MO IL IN OH NJ MD TX MS TN AL SC NC Puerto Rico Grain Group Ethanol Group Plant Nutrient Group Rail Group 9

10 Q3 18 Headlines Lower corn and soybean basis levels at harvest create short-term drop in base grain income; Lansing leads affiliate income improvement Year-over-year results up almost 50 percent on higher ethanol and coproduct sales, timely hedging and better DDG values Weaker margins in specialty nutrients, lawn and contract manufacturing more than offset improved primary nutrient margins Leasing income lower on higher interest expense, lower other income despite higher utilization and cars on lease; repair business strong again 10
11 Key Financial Data $M except per share data, long-term debt-to-equity Q3 18 Q3 17 VPY YTD 18 YTD 17 VPY Sales and merchandising revenues $685.6 $836.6 ($151.0) $2,232.7 $2,682.3 ($449.6) Gross profit $53.9 $69.7 ($15.8) $208.0 $234.0 ($26.0) Operating and general expenses $66.0 $68.2 ($2.2) $190.1 $219.2 ($29.1) Equity in earnings of affiliates $7.2 $3.6 $3.6 $20.6 $8.1 $12.5 Income (loss) before income taxes ($3.6) $5.0 ($8.6) $23.2 ($19.6) $42.8 Adjusted income (loss) before income taxes ($3.6) $5.0 ($8.6) $23.2 $22.4 $0.8 Net income (loss) attributable to The Andersons, Inc. Adjusted net income (loss) attributable to The Andersons, Inc. ($2.1) $2.5 ($4.6) $17.7 ($27.2) $44.9 ($2.1) $2.5 ($4.6) $17.7 $14.8 $2.9 Diluted earnings (loss) per share (EPS) ($0.07) $0.09 ($0.16) $0.62 ($0.96) $1.58 Adjusted diluted earnings (loss) per share (EPS) ($0.07) $0.09 ($0.16) $0.62 $0.52 $0.40 Depreciation and amortization $22.7 $21.7 $1.0 $68.0 $64.5 $3.5 EBITDA $24.0 $32.0 ($8.0) $111.4 $62.3 $49.1 Adjusted EBITDA $24.0 $32.0 ($8.0) $111.4 $104.3 $7.1 Effective tax rate 48.5% 47.7% 0.8% 24.4% (38.2%) 62.6% Corporate unallocated net expenses 1 $2.1 $2.0 $0.1 $13.7 $27.7 ($14.0) Long-term debt $437.3 $371.3 $66.0 Long-term debt-to-equity ratio Includes net pretax impact of $4.4 for Q3 17 and ($9.1) for YTD 17 from the former Retail business segment 11
12 ($000) Pretax Income Q3 17 Pretax Income to Q3 18 Pretax Income $6,000 $4,000 $4,922 $2,000 $0 ($3,862) ($2,000) ($4,000) $2,960 ($56) ($395) ($33) ($6,000) ($8,000) 1 ($11,260) Q3 '17 Grain Ethanol Plant Nutrient Rail Other Q3 ' Excludes net income attributable to the noncontrolling interests of $83 in Q3 17 and $223 in Q
13 ($000) Pretax Income YTD 17 Adjusted Pretax Income to YTD 18 Reported Pretax Income $25,000 $4,548 $13,931 $20,000 $22,297 $23,400 $15,000 ($3,269) ($6,687) $10,000 ($7,420) $5,000 $0 Adjusted YTD '17 1,2 Grain Ethanol Plant Nutrient 2 Rail Other 1 Reported YTD '18 1 Excludes net income attributable to the noncontrolling interests of $73 in YTD 17 and ($175) in YTD 18 2 Excludes Plant Nutrient Group goodwill impairment charge of $42,000 13
14 Lansing Transaction Highlights Transaction Details Acquiring remaining 67.5% of Lansing equity not currently owned for approximately $305M, subject to customary post-closing adjustments Transaction values equity at approximately $450M; estimate a purchase price multiple of 8.7 times EBITDA (1) for the twelve months ended August 31, 2018 Expected to close before January 31, 2019, subject to Lansing shareholder and regulatory approvals Expected Results EPS-accretive within a year after close Annual run-rate cost synergies of at least $10M achieved by year-end 2020 Increases combined trailing twelve month gross profit by 65% and EBITDA (1) by 47% Financial Details $130M of newly issued shares priced at closing based on 90% of the volume-weighted average price Projected transaction costs of approximately $8M to be incurred in 2H 2018 Company to assume a total of approximately $166 million of Lansing and Thompsons long-term debt (1) Non-GAAP measure. See reconciliation tables in Appendix. 14
 Commodities Traded Gross Profit (1),(2) $162M EBITDA (1),(2) $66M Employees (3) ~550 ~25% ~40% Grain & Oilseeds: diverse range of corn, wheat, soybeans and various")
15 Lansing Trade Group at a Glance Focused on the trading and movement of physical commodities including grains, feed ingredients, energy products, and freight within North America and internationally Key Highlights Gross Profit Mix (1) Commodities Traded Gross Profit (1),(2) $162M EBITDA (1),(2) $66M Employees (3) ~550 ~25% ~40% Grain & Oilseeds: diverse range of corn, wheat, soybeans and various oilseeds across North America and internationally Energy Products: logistics and transload services for ethanol, NGLs and frac sand The Andersons Initial Investment JV Ownership in Thompsons Limited % ~35% Grain Energy Feed Ingredients & Specialty Feed Ingredients: cottonseed, wheat middlings, distillers grains (DDGs), protein meals and other feed ingredients (1) For twelve months ended August 31, 2018; (2) Non-GAAP measure. See reconciliation tables in Appendix. (3) as of September 30,
16 Combined Company Creates More Formidable Business Key Highlights $9B $510M $239M ~2,650 Revenues (1) Gross Profit (2) Adjusted EBITDA (2) Employees (3) Combined Statistics Gross Profit (2) Adjusted EBITDA (2) 36 Additional Facilities Benefits Increases combined gross profit and EBITDA (2) Diversifies income streams and adds income from new markets Potential for further upside from additional cost and revenue synergies 100% Ownership of Thompsons: Leading Canadian provider of risk management, advanced agronomy, food grade beans and grain marketing services Andersons Lansing Thompsons (1) Combined revenues of $3.7B, $4.8B and $0.6B for The Andersons, Inc., LTG and Thompsons, respectively, for the calendar year Combined figure does not eliminate transactions between entities; (2) non-gaap measure; see reconciliation tables in Appendix; (3) as of September 30, 2018; includes Lansing and Thompsons employees; Eliminates equity method of accounting for Lansing and Thompsons, increasing financial transparency 16
17 Transaction Aligned with Acquisition Strategy S T R A T E G I C F I L T E R S Fits Strategically; Core or Adjacent Supports growth in originations, trading and food and feed ingredients Addresses Validated Customer Needs Expands product and services portfolio Strengthens Geographic Footprint Complementary footprint and assets Increases Scale Combined scale will drive efficiencies Provides Differentiation Deep focus on farm originations, pointto-point trade and specialty food and feed ingredients F I N A N C I A L C R I T E R I A Accretive to EPS within One Year ROIC Above Cost of Capital by Year 3 (risk-adjusted) Payback Period on Long- lived Assets < 10 Years 17
18 Complementary Geographic Assets and Footprint Expands Geographic Footprint Geographic expansion into Western Corn Belt/Great Plains, and Eastern Canada Further diversification of activities outside of traditional product and geographic regions Greater scale in the agricultural marketplace Andersons facilities Lansing facilities Thompsons facilities 18


19 Grain Group Production Metrics ~550M Bushels ~140M Bushels 1.3M Tons 50-60M Bushels 50M Bushels ~500k Acres Total Grain Traded Total Space Capacity DDG Marketed Risk Management Products Food Grain Supply Crops Insured Champaign, IL Dunkirk, IN Melfort, SK Toledo, OH Top 10 U.S. Grain Merchant 19
20 Grain Group Q3 18 Highlights Base Grain results fell due to significant basis declines and less wheat income Lansing Trade Group posted its fourth consecutive stronger year-over-year performance $41 Adj. Pretax Income ($M) $24 $14 ($16) $1 1 1, Q1 Q2 Q3 Q4 1 Excludes gains of $17.1 in 2014 and $23.1 in 2015 from partial redemptions of our investment in Lansing Trade Group. 2 Excludes goodwill impairment charges of $ Excludes asset impairment charges of $ Includes asset impairment charge of $1.6. Unaudited in $M Q3 18 Q3 17 VPY YTD 18 YTD 17 VPY Revenues 1 $343.4 $497.6 ($154.2) $986.2 $1,464.6 ($478.4) 4 Gross Profit $16.6 $32.3 ($15.7) $77.4 $86.4 ($9.0) Base Grain Pretax Income (loss) ($10.9) $3.4 ($14.3) ($8.1) $4.0 ($12.1) Affiliates Pretax Income (loss) $2.3 ($0.8) $3.1 $9.3 $0.5 $8.8 Total Pretax Income (loss) ($8.6) $2.6 ($11.2) $1.2 $4.5 ($3.3) EBITDA ($2.4) $9.2 ($11.6) $22.5 $25.5 ($3.0) revenues revenues are are $170.4 $185 lower lower for for the the quarter quarter and and $349 $515.4 lower year lower to year date as to the date result as the of new result accounting of new accounting rules effective rules January effective 1, 2018 January 1,

21 In millions Millions of Bushels Grain Group Grain Storage Capacity/Adjusted Pretax Income Per Bushel Core Grain Average Storage Capacity Target Range Excess wheat basis appreciation Adj. Pre-tax Income per Bushel Excess Wheat Basis $0.70 $0.60 $0.50 $0.40 $0.30 $0.20 $0.10 $0.00 ($0.10) 1 Excludes the impact of goodwill impairment charges of $ Excludes the impact of asset impairment charges of $ Adjusted pretax income per bushel Grain Inventory U.S. Harvested Acres 1 In million Q3 16 Q3 17 Q3 18 Bushels owned Bushels stored for others Total bushels inventory Corn Soybeans Wheat estimate 1 Source: Pro Exporter Network as of 10/11/18 21

22 Grain Group Strategic Growth Strengthen Share & Presence in Eastern Corn Belt Drive Income through Trading & Risk Management Solutions Aggressively Grow Food Ingredients & Specialty Grains Drive origination through disciplined processes, talent and leadership, accountability Enhance existing facilities Active pipeline of acquisition targets in Eastern Corn Belt Create value for customers Disciplined approach driven by understanding farm economics to market opportunities Fee structure incents ANDE to help customers secure selling prices above benchmarks Expand portfolio of products Link growers to food manufacturers Identify, pursue and close accretive acquisitions 22
23 Near- and Long-term Goals Grow grain market share by 20M bushels, driving additional gross profit of ~$2M Grow market value-added products from 13% to 14%+ of total gross profit Generate Annual EBITDA of $70M to $75M 15% total trade flow growth, driving additional 40M bushels and ~$4M gross profit (beyond the initial $20M/$2M) Grow market value-added products to ~20% of total gross profit Generate Annual EBITDA of $85M to $95M Executing on Growth Initiatives to Improve Earnings Capacity 23


24 Ethanol Group Overview Strategically Located Ethanol Plants Albion, MI Clymers, IN KS IA OH IN MI Greenville, OH Denison, IA ELEMENT LLC Coming Mid 2019 Top 10 U.S. Ethanol Producer 24


25 The Andersons and ICM Form ELEMENT, LLC The Andersons and ICM Have a Long History and Are a Formidable Team 25

26 ELEMENT, LLC Project Summary 70 million gallons per year ethanol capacity $175 million joint investment The Andersons will provide grain origination; ethanol, RIN and carbon credit marketing; and risk management and other support services Next Steps and Timeline Construction began March 2018 Initial production expected to commence in mid 2019 Facility is expected to be fully operational by late 2019 ICM will provide plant construction, engineering, manufacturing, operations and management services Significantly enhanced margins ($0.10 to $0.25 per gallon) ELEMENT site in Colwich, Kansas, August 31,
27 ELEMENT, LLC Technology Innovations Improved ethanol and corn oil production and yield ICM s technologies will help ELEMENT make these advancements Production of low carbon intensity ethanol, generating carbon credits Production of cellulosic ethanol, generating cellulosic RINs Production of higher value feed products Significant energy usage reduction in both natural gas and electricity 27
28 Ethanol Group Investments Investment The Andersons Albion Ethanol The Andersons Clymers Ethanol The Andersons Marathon Ethanol The Andersons Denison Ethanol Date Capacity (MGY) Ownership Aug % Apr % Feb % May % Key Benefits Stable service fee income Strategic partnership with the largest end user of ethanol in the U.S. Diversified geographic footprint Negotiation leverage to drive production costs lower Technology vetting opportunities Improved benchmarking and market intelligence Production Capacity Attributable to ANDE: ~240MGY 28
29 Ethanol Group Q3 18 Highlights Pretax income up almost 50 percent on margin hedging and better DDG values Improved plant productivity continues $92 Pretax Income Attributable to The Andersons, Inc. ($M) $29 $25 $19 $ Q1 Q2 Q3 Q4 Unaudited in $M Q3 18 Q3 17 VPY YTD 18 YTD 17 VPY Revenues $194.8 $191.5 $3.3 $568.6 $533.5 $35.1 Equity in Earnings of Affiliates $4.8 $4.3 $0.5 $10.7 $7.2 $3.5 Consolidated Operations and Services Fees $4.5 $1.9 $2.6 $6.1 $5.3 $0.8 Pretax Income $9.3 $6.2 $3.1 $16.8 $12.5 $4.3 Attributable to Noncontrolling Interest Pretax Income Attributable to The Andersons, Inc. $0.2 $0.1 $0.1 ($0.2) $ - ($0.2) $9.1 $6.1 $3.0 $17.0 $12.5 $4.5 29

30 Ethanol Group Strategic Growth Fine-tune Plant Productivity and Efficiency Develop Higher Value Coproducts Increase Gallons Under Management Employ technology to efficiently produce ethanol and high value coproducts Run facilities to maximize margin per bushel Manage risk with unique collection of cross-industry expertise Develop higher-protein DDGs Produce cellulosic ethanol from corn kernel fiber Grow E85 volume by 20 percent per year Double current corn oil product value by refining to food-grade quality Continue disciplined and strategic approach to footprint expansion Invest in targets that meet specific technology, feedstock, coproduct value and demand criteria 30
31 Near- and Long-term Goals Lower controllable costs by $0.01/gallon Add high-protein DDGs production at 1 to 2 plants Increase gallons under management from ~475M to 550M+ Product cellulosic ethanol from corn kernel fiber Add high-protein DDGs production at all plants Increase gallons under management to 660M+ Executing on Growth Initiatives to Improve Earnings Capacity 31
32 Plant Nutrient Group Overview Plant Nutrient Foundation with a Valueadded Focus Natural adjacency to the Grain business, leveraging grower relationships and intelligence and a drive to bring growers value sustainability Founded in wholesale distribution of basic row crop fertilizer (NPK) Significant expansion of specialty nutrient capabilities Creates value for Farmers and Shareholders Delivers sustainable and precision agriculture solutions Specialty nutrients helps maximize yields and minimize environmental impact Improves economics for growers NE MN WI MI IA IL OH IN Wholesale Fertilizer Facility AL NC Farm Center Facility Lawn Facility Cob Facility Puerto Rico 32
33 Plant Nutrient Group Background Tons Sold (000s) 2 2.2M tons sold is about 4.5% of total ~50M ton fertilizer market Our market share is 15% to 18% 1 in our core areas Maintaining our market share Volumes steady, lower margins Wholesale entitlement radius 100 miles, retail 30 miles Q3 '16 Q3 '17 Q3 '18 Primary Nutrients Specialty Nutrients Other Tons Committed to Growth of Specialty Nutrients 1 Based on Company estimates. 2 Primary nutrients = nitrogen, phosphorous, potassium (including those sold by farm centers); specialty nutrients = low-salt liquid starter fertilizers, and micro-nutrient (including those sold by farm centers) and lawn fertilizers; other tons = cob products. 33
34 Plant Nutrient Group Q3 18 Highlights Significant drop in specialty nutrient margin per ton resulted in lower overall gross profit Primary nutrient prices and margins improved, but volume was down $25 Adj. Pretax Income ($M) $14 $15 $14 $ Q1 Q2 Q3 Q4 1 Excludes goodwill impairment charges of $9.7 and one-time acquisition costs of $ Excludes goodwill impairment charges of $59.1. Unaudited Tons in 000 s, $M Q3 18 Q3 17 VPY YTD 18 YTD 17 VPY Primary Nutrients Tons (40) 1,072 1,099 (27) Specialty Nutrients Tons (1) Other Tons (2) (11) Revenues $104.2 $103.6 $0.6 $542.9 $514.9 $28.0 Gross Profit $15.5 $17.3 ($1.8) $74.9 $83.1 ($8.2) Gross Profit Margin 14.9% 16.7% (1.8%) 13.8% 16.1% (2.3%) Reported Pretax Income (loss) ($8.0) ($7.9) ($0.1) $8.2 ($27.1) $35.3 Adjusted Pretax Income (loss) ($8.0) ($7.9) ($0.1) $8.2 $14.9 ($6.7) Adjusted EBITDA $0.1 $0.2 ($0.1) $32.9 $40.1 ($7.2) 34
35 Physical Product Flow: Factory to Field 75% of Supply Moves through Distributors Like ANDE Manufacturers Storage (Distribution) Retailers, Dealers and Co-ops Farmers Wholesale Distribution Capacity is Critical to Ag Supply Chain 35

36 Plant Nutrient Group Strategic Growth Selectively Grow Primary NPK Business Grow, Invest in and Develop Specialty Products Expand Technology and Product Development in Turf Pursue organic growth opportunities Collaborate with suppliers Standardize transportation Ensure risk-mitigated supply agreements in place Deploy SAP Reduce production costs Develop environmentally and agronomically sound products Leverage Grain and Plant Nutrient market intelligence Leverage operating efficiencies Launch new turf and commercial agriculture products Standardize processes Utilize our knowledge of Regulatory compliance issues 36
37 Near- and Long-term Goals Implement new IT system successfully Align organizational structure for productivity and future growth Continue to expand in valueadded businesses EBITDA of $60M - $65M Build best-in-class sales organization Continue to establish strategic alliances with customers and suppliers Develop new products that are sustainable and environmentally friendly Grow specialty tons by 3% to 5% per year EBITDA of $80M - $85M Executing on Growth Initiatives to Improve Earnings Capacity 37
38 Rail Group Overview Key Metrics Railcar Fleet by Commodity 2 ~22,500 Railcars Grain/Grain Products Fertilizer/Minerals 10% 26% 92.0% Average Utilization Rate 1 Sand/Sand Products Plastics 9% 9% ~20,900 Cars on Lease 2 Wood & Forestry/Paper Ethanol & Gasoline 7% 7% 24 Railcar Repair Facilities 2 Chemicals 5% Metals & Products 5% ~150 Commodities Handled Aggregates & Limestone Other 4% 18% 1 Average of Q As of 9/30/18. 38

 to broad")


39 Rail Group Diverse Fleet ANDE Focus Railcar Percent of North American Fleet 1 Expanded from ag-related cars (grain and fertilizer covered hopper) to broad range of car types Industry / ANDE Fleet 2 Have only ~1% of railcars in the pressured crude oil and coal markets Covered Hopper 32% / 68% Tank Car 22% / 14% Gondola 15% / 7% Open-Top Hopper 10% / 4% Limited exposure to intermodal/flat car market Focused on improving the average remaining life of the fleet Boxcar 8% / 5% Flat Car 5% / 2% Intermodal Platform 4% / NA Auto Rack 4% / NA We Are an Active Player in Most Primary Car Types 1 Source: SFG Research and Company estimates. 2 As of 9/30/18 39

40 Rail Repair Network Strategically located and geographically diverse network High-quality repairs Broad range of capabilities (from simple repairs to remanufacturing) Growing tank car capabilities CA UT IA IL IN OH MO MS NY NJ MD NC SC Serves both ANDE fleet and third-party shippers and railroads TX Income growing steadily Repair Facility Tank Car Repair Capable 40
41 Rail Group Q3 18 Highlights Lease income lower on higher interest expense, lower end-of-lease income Utilization improved, more cars on lease; lease rates rising but were lower than rates they replaced Repair business records another strong Pretax Income ($M) Q1 Q2 Q3 Q4 quarter 1 Includes 1 asset impairment charge of $4.7. Includes asset impairment charge of $4.7. Unaudited in $M Q3 18 Q3 17 VPY YTD 18 YTD 17 VPY Revenues $43.1 $43.1 $ - $135.0 $121.6 $13.4 Gross Profit $14.8 $13.4 $1.4 $40.9 $38.4 $2.5 Gross Profit Margin 34.3% 31.1% 3.2% 30.3% 31.6% (1.3%) Lease Income $2.5 $3.5 ($1.0) $6.7 $7.1 ($0.4) Railcar Sales Income $1.9 $2.6 ($0.7) $1.2 $7.6 ($6.4) Service and Other Income $1.3 $ - $1.3 $2.7 $3.4 ($0.7) Pretax Income $5.7 $6.1 ($0.4) $10.6 $18.1 ($7.5) $31 $51 $32 1 $25 $11 EBITDA $15.7 $13.9 $1.8 $40.0 $40.6 ($0.6) 41


42 Rail Group Strategic Growth Grow Railcar Fleet in a Disciplined Manner Expand Railcar Repair Network Replace railcars as they age out with midlife railcars Maintain our diversified railcar and customer portfolios Grow railcar fleet in selective car types Address tank car fleet impacted by retrofit regulations Continue growth of full service facilities and small mobile locations Maintain focus on improving safety, efficiency and volume Increase volume throughout network with new sales staff 42
43 Near- and Long-term Goals Grow railcar fleet from 23,000+ to 24,000 25,000 cars Increase repair facilities from 19 to 22 Generate Annual EBITDA of $65M to $70M Grow railcar fleet to 28,000 30,000 cars Increase repair facilities to EBITDA of $85M - $95M Executing on Growth Initiatives to Improve Earnings Capacity 43


44 Outlook Expect full-year base business to exceed 2017 results; optimistic about 2019; looking forward to maximizing Lansing opportunities High industry stocks and production, tariffs drive challenging near-term outlook; weather delays in Kansas plant construction lower 2019 forecast Full-year results adjusted for goodwill and farm center sales likely to fall short of 2017 results; specialty nutrients margins to remain challenged Anticipate steady improvement in lease income; repair business to remain solid 44


45 Company Strategic Growth Invest to Grow Our Core Businesses and Product Lines Ensure Proper Talent Management to Support a High Performance Culture Emphasize Greater Sales Force Effectiveness to Deepen Relationships Focus on Accountability to Deliver Results Expand highervalue, highermargin offerings Grow portfolio through acquisitions Employ new technology in ethanol production Grow Rail assets Invest in ag startups through Maumee Ventures Continue robust talent management process Link talent management to group and company strategies Continue to improve individual development planning Reenergize our customer-facing sales force in Grain and Plant Nutrient Recruit external talent to bolster skills in all four groups Leverage use of new digital tools Personal Safety Partner of Choice People Productivity Profitable Growth 45
46 Strategic Execution Is Underway REFOCUSED Investing in performance improvement in core businesses New leadership, perspective and higher accountability Hired new CFO and presidents for Plant Nutrient and Rail Greater emphasis on talent management and productivity to achieve operational excellence REORGANIZING Optimizing portfolio Sale of four TN grain elevators is latest of several moves Improving productivity $20M run-rate cost savings goal achieved in two years, and one year early Announced additional cost savings goal of $7.5M to be reached by year-end 2018 REENERGIZED Leveraging core capabilities and expand into value-added, high margin offerings Originations excellence Risk management tools Specialty nutrients Lawn and contract manufacturing Investing in systems and tools SAP in Plant Nutrient Procurement 46
47 Near- and Long-term Goals Achieve run-rate cost savings of $20M by end of 2018 from 2015 base Achieved in Q4 2017; announced additional $7.5M goal for remainder of 2018 Further integrate technology platforms across organization Drive continued, steady financial performance improvement in 2018 Drive shareholder value with greater focus on disciplined, strategic growth Grow value-added products to ~20% of gross profit in Grain and more than 50% in Plant Nutrient, respectively Grow EBITDA to $300M+ Committed to Delivering Shareholder Value 47

48 EBITDA by Segment Target 2017 EBITDA E EBITDA 1 Rail 31% 24% to 27% Grain 29% 27% to 30% Plant Nutrient 26% 21% to 24% Ethanol 14% 22% to 25% EBITDA and Cashflow Generation Remains Healthy for All Four Groups 1 Excludes corporate expenses and Retail segment closed in June
49 Appendix 49
50 Definitions EBITDA: Earnings before interest, taxes, depreciation and amortization; a non-gaap measure. A primary measure of period-over-period comparisons, and we believe they are meaningful measures for investors to compare our results from period to period Base Grain: Grain operations owned and operated by The Andersons (does not include affiliates) Ethanol Margin Hedging: From time to time we establish hedge positions with futures and derivative contracts that lock in prices for sales of ethanol and purchases of corn and natural gas with the intent of securing portions of our future sales margins Bushels Owned: Bushels delivered to an Andersons elevator or storage facility rented by The Andersons for which title to the grain is transferred to The Andersons Bushels Stored for Others: Bushels stored by The Andersons for the owner of the grain for which the company charges a storage fee Railcar Fleet Utilization: Percentage of railcars in leased service divided by total railcars controlled by company Primary Nutrients: Nitrogen, phosphorous, potassium (including those sold by farm centers) Specialty Nutrients: Low-salt liquid starter fertilizers, micro-nutrients, lawn fertilizers (including those sold by farm centers) Other Tons: Corn-cob products 50
51 Historical Performance ($M) Gross Profit Adj. EBITDA 1 Adj. Pretax Income 1 Capital Investments 2 $238 $365 $397 $376 $346 $319 $220 $175 $144 $154 $118 $111 $106 $141 $157 $124 $76 $49 $42 $ Non-GAAP measure. See reconciliation tables in Appendix. 2 Investments in PP&E and net investments in Rail Group assets as disclosed in statement of cashflows. 51
52 Reconciliation to EBITDA and Adjusted EBITDA Combined $M The Andersons, Inc. (1) Lansing Trade Group (2) Thompsons (2), (3) Combined (4) Gross profit $ $ $ 39.4 $ Net Income attributable to the Company $ 92.0 $ 34.7 $ 1.5 $ Provision (benefit) for income taxes (60.8) 4.3 (1.3) (57.8) Interest expense Depreciation and amortization Earnings before interest, taxes, depreciation and amortization (EBITDA) Adjusting items impacting EBITDA: Goodwill impairment Asset impairment Elimination of Lansing and Thompsons equity earnings (5) (10.4) (0.8) - (11.2) Total adjusting items 17.6 (0.8) Adjusted EBITDA $ $ 64.9 $ 11.9 $ (1) - Based on results from trailing 12 months as of June 30, 2018; see additional GAAP to Non-GAAP reconciliation on following slide (2) - Based on results from latest trailing 12 months as of August 31, 2018 (3) - Includes Thompsons Limited and related U.S. operating company held by joint ventures (4) - Combined results include immaterial intercompany transactions between entities that were not eliminated (5) - Eliminates The Andersons' equity earnings from Lansing and Thompsons; eliminates Lansing's equity earnings in Thompsons 52
53 Reconciliation to EBITDA and Adjusted EBITDA The Andersons, Inc. $M Twelve months ended December 31, 2017 Six months ended June 30, 2017 Six months ended June 30, 2018 Trailing twelve months ended June 30, 2018 (1) Trailing twelve months June 30, 2018 Gross profit $ $ $ $ Net Income attributable to the Company Provision (benefit) for income taxes Interest expense $ 42.5 $ (29.7) $ 19.8 $ 92.0 (63.1) (60.8) Depreciation and amortization Earnings before interest, taxes, depreciation and amortization (EBITDA) Adjusting items impacting EBITDA: Goodwill impairment Asset impairment Elimination of Lansing and Thompsons equity earnings (2) (5.1) (1.8) (7.1) (10.4) Total adjusting items Adjusted EBITDA (7.1) 17.6 $ $ 70.6 $ 80.1 $ (1) Twelve months ended December 31, 2017, less six months ended June 30, 2017, plus six months ended June 30, 2018 (2) Eliminates The Andersons' equity earnings from Lansing and Thompsons 53
54 Reconciliation to EBITDA and Adjusted EBITDA $M Grain Ethanol Plant Nutrient Rail Other Total Nine Months Ended September 30, 2018 Income (loss) before income taxes $ 1.2 $ 16.8 $ 8.2 $ 10.6 $ (13.6) $ 23.2 Income (loss) attributable to the noncontrolling interests - (0.2) (0.2) Income (loss) before income taxes attributable to The Andersons, Inc (13.6) 23.4 Interest expense 9.0 (1.1) Deprecation and amortization Earnings before interest, taxes, depreciation and amortization (EBTIDA) $ 22.5 $ 20.5 $ 32.9 $ 40.0 $ (4.5) $ Income (loss) before income taxes attributable to The Andersons, Inc. for each Group is defined as net sales and merchandising revenues plus identifiable other income less all identifiable operating expenses, including interest expense for carrying working capital and long-term assets and is reported net of the noncontrolling interest share of income (loss). 54
55 Reconciliation to EBITDA and Adjusted EBITDA $M Grain Ethanol Plant Nutrient Rail Other Total Nine Months Ended September 30, 2017 Income (loss) before income taxes $ 4.5 $ 12.5 $ (27.1) $ 18.1 $ (27.6) $ (19.6) Income (loss) attributable to the noncontrolling interests Income (loss) before income taxes attributable to The Andersons, Inc (27.1) 18.1 (27.6) (19.6) Interest expense Deprecation and amortization Goodwill impairment Earnings before interest, taxes, depreciation and amortization (EBTIDA) $ 25.5 $ 16.9 $ 40.1 $ 40.6 $ (18.8) $ Income (loss) before income taxes attributable to The Andersons, Inc. for each Group is defined as net sales and merchandising revenues plus identifiable other income less all identifiable operating expenses, including interest expense for carrying working capital and long-term assets and is reported net of the noncontrolling interest share of income (loss). 55
56 Reconciliation to EBITDA and Adjusted EBITDA $M Grain Ethanol Year Ended December 31, 2017 Plant Nutrient Rail Retail Other Total Income (loss) before income taxes $ 12.8 $ 19.0 $ (45.1) $ 24.8 $ (7.3) $ (24.7) $ (20.5) Income (loss) attributable to the noncontrolling interests Income (loss) before income taxes attributable to The Andersons, Inc (45.1) 24.8 (7.3) (24.7) (20.6) Interest expense 8.3 (0.1) (0.4) 21.6 Deprecation and amortization Earnings before interest, taxes, depreciation and amortization (EBTIDA) (12.0) 54.9 (6.9) (13.3) 87.4 Adjusting items impacting EBITDA: Goodwill impairment Asset impairment Total adjusting items Adjusted EBITDA $ 50.8 $ 24.8 $ 47.1 $ 54.9 $ (6.9) $ (13.3) $ Income (loss) before income taxes attributable to The Andersons, Inc. for each Group is defined as net sales and merchandising revenues plus identifiable other income less all identifiable operating expenses, including interest expense for carrying working capital and long-term assets and is reported net of the noncontrolling interest share of income (loss). 56
57 Reconciliation to EBITDA and Adjusted EBITDA $M Grain Ethanol Plant Nutrient Rail Retail Other Total Year Ended December 31, 2016 Income (loss) before income taxes $ (15.7) $ 27.6 $ 14.2 $ 32.4 $ (8.8) $ (28.3) $ 21.4 Income (loss) attributable to the noncontrolling interests Income (loss) before income taxes attributable to The Andersons, Inc. 1 (15.7) (8.8) (28.3) 18.5 Interest expense (0.3) 21.1 Deprecation and amortization Earnings before interest, taxes, depreciation and amortization (EBTIDA) (5.9) (19.6) Adjusting items impacting EBITDA: Total adjusting items Adjusted EBITDA $ 10.5 $ 30.6 $ 49.3 $ 59.0 $ (5.9) $ (19.6) $ Income (loss) before income taxes attributable to The Andersons, Inc. for each Group is defined as net sales and merchandising revenues plus identifiable other income less all identifiable operating expenses, including interest expense for carrying working capital and long-term assets and is reported net of the noncontrolling interest share of income (loss). 57
58 Reconciliation to EBITDA and Adjusted EBITDA $M Grain Ethanol Year Ended December 31, 2015 Plant Nutrient Rail Retail Other Total Income (loss) before income taxes $ (9.5) $ 30.3 $ 0.1 $ 50.7 $ (0.5) $ (82.7) $ (11.6) Income (loss) attributable to the noncontrolling interests Income (loss) before income taxes attributable to The Andersons, Inc. 1 (9.5) (0.5) (82.7) (13.4) Interest expense (0.4) 20.1 Deprecation and amortization Earnings before interest, taxes, depreciation and amortization (EBTIDA) (75.9) 85.2 Adjusting items impacting EBITDA: Goodwill impairment Pension adjustment Partial redemption of investment in Lansing Trade Group (23.1) (23.1) One-time acquisition costs Total adjusting items Adjusted EBITDA $ 38.8 $ 34.5 $ 47.1 $ 76.2 $ 2.4 $ (24.5) $ Income (loss) before income taxes attributable to The Andersons, Inc. for each Group is defined as net sales and merchandising revenues plus identifiable other income less all identifiable operating expenses, including interest expense for carrying working capital and long-term assets and is reported net of the noncontrolling interest share of income (loss). 58
59 Reconciliation to EBITDA and Adjusted EBITDA $M Grain Ethanol Year Ended December 31, 2014 Plant Nutrient Rail Retail Other Total Income (loss) before income taxes $ 58.1 $ $ 24.5 $ 31.4 $ (0.6) $ (34.5) $ Income (loss) attributable to the noncontrolling interests Income (loss) before income taxes attributable to The Andersons, Inc (0.6) (34.5) Interest expense (0.5) 21.8 Deprecation and amortization Earnings before interest, taxes, depreciation and amortization (EBTIDA) (30.8) Adjusting items impacting EBITDA: Partial redemption of investment in Lansing Trading Group (17.1) (17.1) Total adjusting items (17.1) (17.1) Adjusted EBITDA $ 66.3 $ 98.3 $ 49.4 $ 51.9 $ 2.8 $ (30.8) $ Income (loss) before income taxes attributable to The Andersons, Inc. for each Group is defined as net sales and merchandising revenues plus identifiable other income less all identifiable operating expenses, including interest expense for carrying working capital and long-term assets and is reported net of the noncontrolling interest share of income (loss). 59
60 Company Achieves $20 Million Cost Savings and Productivity Goal Early Examples of Run-rate Adjustments Achieved $20M of run-rate cost and productivity savings by year-end 2017 Announced new, $7.5M goal to achieve by year-end replaces 2015 as the new baseline year Savings to date include more than $6M in labor savings, net of two years of merit increases Gross Profit or Expense Type Raw material purchasing and optimization improvements Plant Nutrient Group Reset business acquisitions in Texas and Tennessee eliminate, consolidate, centralize Grain Group Savings ($M) ~ $3M ~ $3M Chemical and denaturant optimization Ethanol Group ~ $2M Changes to retiree healthcare plan ~ $1.5M Productivity Enhancements and Investments Lead to Leaner Operation 60
61 Implemented Leverage and Liquidity Strategy Long-term Debt to Equity < 1:1 for Grain, Ethanol and Plant Nutrient < 3:1 for Rail $M 9/30/18 9/30/17 Cash $ 17 $ 24 Other Current Assets Non-Current Assets 1,274 1,161 No more than 20% of longterm debt maturing in any single year Working capital >$175M Net Debt to Adjusted EBITDA expected to remain < 4.0x Total Assets $ 2,152 $ 1,964 Current Liabilities, excluding Current Portion of Long-Term Debt $ 675 $ 536 Non-Current Liabilities Long-Term Debt, including Current Portion Equity Total Liabilities & Equity $ 2,152 $ 1,964 Long-term Debt / Equity To Ensure Financial Flexibility 61
62 M&A Strategy S T R A T E G I C F I L T E R S Fits Strategically; Core Or Adjacent Addresses Validated Customer Needs Strengthens Geographic Footprint Increases Scale Provides Differentiation: Enables Ability to Move Up Value Chain F I N A N C I A L C R I T E R I A Accretive to EPS within Two Years ROIC Above Cost of Capital by Year 3 (risk-adjusted) Payback Period on Longlived Assets < 10 Years Disciplined, Focused and Strategic Approach 62
63 Capital Allocation Framework Uses of Cash: 2013 to 2017 $810M 9% 6% INVEST IN ORGANIC GROWTH Invest in adjacencies to increase penetration of existing service offerings and expand footprint 22% 63% PURSUE STRATEGIC ACQUISITIONS Seek strategic, bolt-on targets Selectively use minority partner capital Capital Investments Acquisitions and Investments Dividends Share Repurchases 2 1 RETURN CASH TO SHAREHOLDERS 20+ years of consecutive dividend payout, totaling more than $75M over the past five years 1 Acquisitions of businesses, purchases of investments (including investments in affiliates) and distributions to noncontrolling interests, net of proceeds from return on investments in affiliates, as disclosed in the statement of cash flows. 2 Purchases of treasury stock, offset by proceeds from sale of treasury shares to employees and directors and excess tax benefit from share-based payment arrangements, as disclosed in the statement of cash flows. 63
64 Grain Group Ref: Variable Storage Rates (VSR) Background: Variable Storage Rates (VSR) were proposed by the CME Group and approved by the Commodity Futures Trading Commission in 2009 The VSR allows the maximum charge that a facility that is registered as regular for delivery can charge for storage The amount of variance in the maximum storage charge depends on spread relationships determined in the futures market VSR is designed to improve cash-futures convergence at futures contract expiration The basic idea of VSR is to trigger higher storage rates that allow wider spreads when spreads are near financial full carry and trigger lower storage rates when spreads are narrow or inverted For The Andersons: Variable Storage Rates (VSR) can improve storage income, as our elevators in Maumee, OH are registered as regular for delivery points During the second quarter of 2016 the max storage charge for outstanding wheat shipping certificates was $ per bushel per day a tick was triggered near the end of Q Beginning July 19, 2016, the max storage charge increased to $ per bushel per day The Andersons primarily handles corn, soybeans and wheat, and typically dedicates 20 to 35 million bushels of our available space to wheat Each tick up or down in the VSR raises or lowers storage $0.001 per bushel per day and can potentially impact future earnings by $2 to $3 million per quarter Source: For more details see the CME Group s website at: 64
 ($0.")
 ($0.25) ($0.29) ($0.24) ($0.25) ($0.30) ($0.35) ($0.25) ($0.21) 2013 2014 2015 2016 2017 13-17 Ave ($0.")
 2013 2014 2015 2016 2017 13-17 Ave ($0.55) 2018 65")
65 Grain Group Corn and Soybeans Basis History Maumee, Ohio; at September 20, Corn Soybeans $0.00 $0.00 $0.00 ($0.05) ($0.10) ($0.05) ($0.10) ($0.11) ($0.08) ($0.20) ($0.15) ($0.15) ($0.20) ($0.13) ($0.30) ($0.25) ($0.29) ($0.24) ($0.25) ($0.30) ($0.35) ($0.25) ($0.21) Ave ($0.30) 2018 ($0.40) ($0.50) ($0.60) ($0.44) Ave ($0.55)

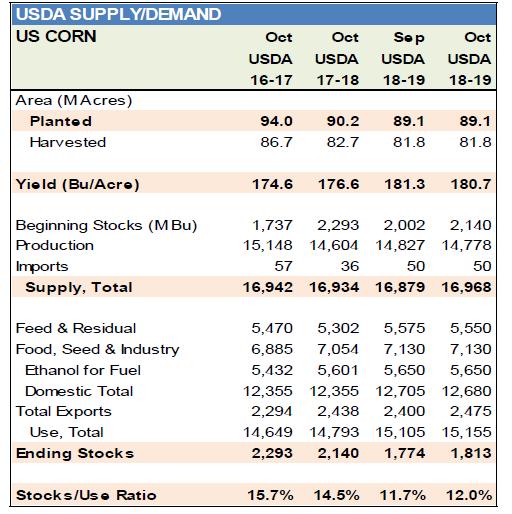
66 USDA Supply/Demand Source: USDA 10/11/18 66

67 U.S. Corn Condition Percentage Harvest Completed Harvest completed change from 2017 November 4, % 78% Gold states = ahead of 2017 Grey states = behind % November 4, % 65% 59% 65% 85% 59% 72% 93% 92% 57% 83% 70% 92% 96% 60% 98% Five-year average 90% 77% Source: USDA crop progress report 11/5/18 67

68 U.S. Soybeans Harvest Percentage Harvest Completed Harvest completed change from 2017 November 4, % 94% Gold states = ahead of 2017 Grey states = behind % 92% 78% 74% November 4, % 88% 92% 82% 87% 89% 63% 64% 72% 68% 64% 45% Five-year average 92% 95% 89% Source: USDA crop progress report 11/5/18 68
69 U.S. Grain Storage Capacity U.S. Off Farm Storage Capacity 1 In millions of bushels Illinois 1,500 Iowa 1,470 Nebraska 930 Texas 640 Indiana 540 Ohio 455 Michigan 230 Tennessee 75 ANDE Storage Capacity In millions of bushels State ANDE 2 ANDE % of Total Illinois % Iowa % Nebraska % Texas % Indiana % Ohio % Michigan % Tennessee % Total % 4 Total US commercial (off-farm) storage capacity of 11,240 million bushels, and 13,450 million on-farm storage 1 Source: USDA 1/12/18 Grain Storage Capacity 2 As of 9/30/18; includes temporary pile storage 3 Doesn t include 0.6 million bushel in Canada 4 ANDE percent of total U.S. off-farm storage capacity 69


70 (B) of bushels U.S. Storage Capacity/Supply Impact (B) of bushels Crop Year '18E Supply Capacity Utilization 2 91% 97% 93% 98% 94% 86% 79% 91% 94% 93% 102% 100% Carry-out Grains Are Harvested Once and Needed throughout Each Year; Total Supply Growing Faster than Capacity '06-'07 '07-'08 '08-'09 '09-'10 '10-'11 '11-'12 '12-'13 '13-'14 '14-'15 '15-'16 '16-'17 17-'18 Industry Has Grown Into New On-farm Storage Capacity Off-Farm On-Farm U.S. Grain Storage Will Continue to Have Value Based on Strong Market Demand Source: PRX (The ProExporter Network) as of 8/10/18, USDA 1/12/18 Grain Storage Capacity, USDA Supply & Demand 10/11/18. 1 Total supply = corn, soybeans, wheat. 2 Storage capacity utilization = Total supply/total storage capacity. 70
71 Sources of Octane Extremely high RVP Limited to 1% of the blend 101 Banned in 26 states. No liability protection for producers Not covered by OEM warranties 95 Premium Gasoline Regular Gasoline Sub-octane Butane Benzene Toluene Xylene MTBE Ethanol Methanol Ethanol Demand Driven by Economic, Clean Source of Octane Source: U.S Department of Energy, National Renewable Energy Lab 71
72 Ethanol Group Overview of Ethanol Production Capacity 2018 Forecast Contribution Margin Per Gallon of Ethanol Produced Ethanol is a low cost, clean burning, high octane, renewable fuel product E85, Distillers Dried Grains (DDGs), Corn Oil and CO 2 Ethanol E85 Flex Fuel 475M Gal. 50M+ Gal. CO 2 Corn Oil DDGs Ethanol MARGIN Depreciation Fixed Variable Gas & Electric Corn We market the CO 2 produced as part of the process at 3 out of our 4 plants DDGs 1.3M Tons Our ethanol customers are primarily refiners and fuel blenders Corn Oil 100M+ lbs. Revenue Streams Input Costs 72
73 U.S. Ethanol Exports 2018 Ethanol Exports by Destination (MGY) 1 August YTD 1,157M 2017 YTD 913M U.S. Ethanol Exports (MGY) 2 1,683 Mexico, 17 Philippines, 51 UAE, 44 China, 53 Colombia, 31 Peru, 38 Other, 144 India, 90 S. Korea, 52 Nigeria, 18 Brazil, 365 Canada, 227 1,367 1,193 1, E Exports Growth Expected to Continue Sources: 1 EIA ; 2 Pro Exporter Network 10/18/18 73
74 Ethanol Group Production Ethanol Gallons Produced E-85 Gallons Shipped DDG Tons Shipped Corn Oil Pounds Shipped in millions in millions in thousands in millions Q3 YTD Q3 YTD Q3 YTD Q3 YTD Charts include activity at nonconsolidated ethanol plants 74
 Application Micro-Nutrient Application Spring & Summer Growing Season: Planting: Starter, Low Salt Side Dressing: Nitrogen supports yields Protecting: Pesticides Emergence Tassel &")
75 Life Cycle of Nutrients Spring Pre-Planting Spring & Summer Growing Season Fall Post Harvest Mar Apr May Jun Jul Aug Sept Oct Pre-Season: Agronomy Testing Base load of Nitrogen, Phosphorus and Potassium (NPK) Application Micro-Nutrient Application Spring & Summer Growing Season: Planting: Starter, Low Salt Side Dressing: Nitrogen supports yields Protecting: Pesticides Emergence Tassel & Ear Initiation Pollination Tasseling Silking Maturity Post-Season: Agronomy Testing Base load of Phosphorous and Potassium Application Micro-Nutrient Applications: Zinc and Manganese 75
76 Nutrient Demand Crop nutrient (N,P,K) use is highest for Corn Nitrogen Phosphorous K Potassium 44% 41% 43% 17% 15% 14% 19% 2% 5% 5% 5% 6% Corn Wheat Soybeans Cotton Corn Wheat Soybeans Cotton Corn Wheat Soybeans Cotton Strong corn acreage supports NPK demand 76
77 2018 U.S. Farm Income Expected to Remain Very Low $ billion F 2018F Net Farm Income Net Cash Income Average since 2000: $75B $91B Over the Cycle, Farmer Income Is a Key Driver Source: USDA as of 8/30/
78 Rail Group Top 10 Player - 50, , , , , , , ,000 Background Top 25 Private Railcar Owners ~1.6M U.S. railcars 65% private owners 35% railroad owned More nimble than larger players, providing speed and flexibility More cars than smaller players to provide us with scale advantage Greenbrier Management Services TTX Trinity Industries Leasing GATX (N.A. Fleet) Union Tank Car Wells Fargo Rail CIT Group/Capital Finance (N.A. Fleet) SMBC Rail Services Procor American Railcar Leasing The Andersons ExxonMobil ADM Transportation American Railcar Industries Midwest Railcar Dow Chemical Chicago Freight Car Leasing Equistar Chemicals Progress Rail Leasing Halliburton Energy Services Cargill Greenbrier Leasing Georgia Power David J. Joseph CAI Rail 163, , , , ,849 89,305 57,000 29,861 26,918 22,772 14,986 13,624 13,605 12,101 10,694 10,620 9,593 9,322 8,278 7,276 7,000 6,418 5,883 5,272 Lessor Manufacturer Shipper 362,000 Well Positioned in Industry with Strong Customer Service Focus Source: AAR Reporting Mark as of April
 Existing tank cars must be retrofitted in accordance with the DOT-prescribed retrofit design or performance standard for use in HHFTs Retrofits must")

79 Rail Tank Car Regulation Tank cars constructed after October 1, 2015 are required to meet new DOT Specification 117 design of performance criteria for use in an High-Hazard Flammable Trains (HHFTs) Existing tank cars must be retrofitted in accordance with the DOT-prescribed retrofit design or performance standard for use in HHFTs Retrofits must be completed based on a mandated schedule. The retrofit timeline focuses on two risk factors: the packing group and differing types of DOT-111 and CPC-1231 tank car A retrofit reporting requirement is triggered if consignees owning or leasing tank cars covered under this rulemaking do not meet the initial retrofit milestone DOT 117 Specification 79
Second Quarter Earnings Call. August 8, 2018
 Second Quarter Earnings Call August 8, 2018 1 Safe Harbor and Non-GAAP Financial Measures Certain information discussed today constitutes forward-looking statements. Actual results could differ materially
Investor Presentation. September 2018
 Investor Presentation September 2018 Forward Looking Statements Certain information discussed today constitutes forward-looking statements. Actual results could differ materially from those presented in
Fourth Quarter and Full Year Earnings Call. February 14, 2019
 Fourth Quarter and Full Year Earnings Call February 4, 209 Safe Harbor and Non-GAAP Financial Measures Certain information discussed today constitutes forward-looking statements. Actual results could differ
Third Quarter Earnings Call. November 8, 2016
 Third Quarter Earnings Call November 8, 2016 Forward Looking Statements & Non-GAAP Measures Certain information discussed today constitutes forward-looking statements. Actual results could differ materially
The Andersons Investor Day. December 7, 2017
 The Andersons Investor Day December 7, 2017 1 Safe Harbor and Non-GAAP Financial Measures Certain information discussed today constitutes forward-looking statements. Actual results could differ materially
2015 Full Year and Fourth Quarter Earnings Call. February 11, 2016
 2015 Full Year and Fourth Quarter Earnings Call February 11, 2016 Forward Looking Statements & Non GAAP Measures Certain information discussed today constitutes forward-looking statements. Actual results
2015 Third Quarter Earnings Call. November 5, 2015
 2015 Third Quarter Earnings Call November 5, 2015 20 5 The Andersons, Inc. Forward Looking Statements Certain information discussed today constitutes forward-looking statements. Actual results could differ
The Andersons, Inc. Third Quarter Conference Call We are well-positioned to capitalize on macro trends such as
 We are well-positioned to capitalize on macro trends such as» Expanding world population» Escalating global demand for protein» Increasing North American crop production which continues to drive strong
The Andersons, Inc. Second Quarter Conference Call We are well-positioned to capitalize on macro trends such as
 We are well-positioned to capitalize on macro trends such as» Expanding world population» Escalating global demand for protein» Increasing North American crop production which continues to drive strong
BMO Farm to Market Conference
 BMO Farm to Market Conference May 21, 2015 ANDE is well-positioned to capitalize on macro trends: World population Middle class Demand for protein Leveraging deep operational experience to: Be a Partner
FINANCIAL HIGHLIGHTS
 2018 ANNUAL REPORT FINANCIAL HIGHLIGHTS OPERATING RESULTS (IN THOUSANDS) 2O18 2O17 % Change Sales and merchandising revenues $3,045,382 $3,686,345 (17.4%) Gross profit 302,005 318,799 (5.3%) Equity in
A N N UA L R E P O R T
 ANNUAL REPORT FINANCIAL HIGHLIGHTS OPERATING RESULTS (IN THOUSANDS) 2O17 2O16 % Change Sales and merchandising revenues $3,686,345 $3,924,790 (6.1%) Gross profit 318,799 345,506 (7.7%) Equity in earnings
BMO Farm to Market Conference. May 18, 2017
 BMO Farm to Market Conference May 18, 2017 Todd Becker President & Chief Executive Officer Green Plains Inc. NASDAQ: GPRE www.gpreinc.com Green Plains Partners LP NASDAQ: GPP www.greenplainspartners.com
FINANCIAL HIGHLIGHTS
 2016 ANNUAL REPORT FINANCIAL HIGHLIGHTS OPERATING RESULTS (IN THOUSANDS) 2O16 2O15 % Change Sales and merchandising revenues $3,924,790 $4,198,495 (6.5%) Gross profit 345,506 375,838 (8.1%) Equity in earnings
2017 MLPA Investor Conference. May 31, 2017
 2017 MLPA Investor Conference May 31, 2017 Jerry Peters Chief Financial Officer Green Plains Inc. NASDAQ: GPRE www.gpreinc.com Green Plains Partners LP NASDAQ: GPP www.greenplainspartners.com Forward-Looking
FINANCIAL HIGHLIGHTS
 2015 A N N U A L R E P O R T FINANCIAL HIGHLIGHTS OPERATING RESULTS (in thousands) 2O15 2O14 % Change Sales and merchandising revenues $4,198,495 $4,540,071 (7.5%) Gross profit 375,838 397,139 (5.4%) Equity
Baird 2017 Global Industrial Conference. November 7, 2017
 Baird 2017 Global Industrial Conference November 7, 2017 Todd Becker President & Chief Executive Officer Forward-Looking Statements This presentation includes forward-looking statements that reflect management
Third Quarter 2014 Earnings Release
 Third Quarter Earnings Release October 23, Jack Koraleski, CEO 1 Third Quarter Record Results Positives Best-Ever Quarter Operating Revenue Operating Income Operating Ratio Earnings Franchise Diversity
Jefferies 2014 Global Industrials Conference. August 11, 2014
 Jefferies 2014 Global Industrials Conference August 11, 2014 Disclaimer Safe Harbor Statement under the Private Securities Litigation Reform Act of 1995 This presentation contains forward-looking statements
Fourth Quarter 2014 Earnings Conference Call. 26 November 2014
 Fourth Quarter 2014 Earnings Conference Call 26 November 2014 Safe Harbor Statement & Disclosures The earnings call and accompanying material include forward-looking comments and information concerning
FINANCIAL HIGHLIGHTS
 20 4 Annual Report FINANCIAL HIGHLIGHTS OPERATING RESULTS 2O14 2O13 % Change Sales and merchandising revenues $4,540,071 $5,604,574 (19.0%) Gross profit 397,139 365,225 8.7% Equity in earnings of affiliates
Fortress Transportation and Infrastructure Investors LLC. Supplemental Information Third Quarter 2018
 Fortress Transportation and Infrastructure Investors LLC Supplemental Information Third Quarter 2018 Disclaimers IN GENERAL. This disclaimer applies to this document and the verbal or written comments
SECURITIES AND EXCHANGE COMMISSION Washington, D. C FORM 10-K
 SECURITIES AND EXCHANGE COMMISSION Washington, D. C. 20549 FORM 10-K [X] ANNUAL REPORT PURSUANT TO SECTION 13 OR 15(d) OF THE SECURITIES EXCHANGE ACT OF 1934 For the fiscal year ended December 31, 2008
Cautionary Information
 September 6, Cowen & Company 10 th Annual Global Transportation Conference Rob Knight CFO 1 Cautionary Information This presentation and related materials contain statements about the Company s future
Bunge Reports Third Quarter 2017 Results
 Bunge Reports Third Quarter 2017 Results White Plains, NY - November 1, 2017 - Bunge Limited (NYSE:BG) Q3 GAAP EPS of $0.59 vs. $0.79 last year, $0.75 vs $0.73 on an adjusted basis Agribusiness improved
Cautionary Information
 November 29, 2017 Credit Suisse 5 th Annual Industrials Conference Rob Knight CFO 1 Cautionary Information This presentation and related materials contain statements about the Company s future that are
Financial Statements August 31, 2018 and 2017 Redfield Energy, LLC
 Financial Statements August 31, 2018 and 2017 Redfield Energy, LLC eidebailly.com Financial Statements August 31, 2018 Page No. Balance Sheet s 2-3 Statements of Operations 4 Statements of Changes in Members
2012 Fourth Quarter Financial Results
 2012 Fourth Quarter Financial Results February 20, 2013 NYSE: CF Safe Harbor Statement All statements in this communication, other than those relating to historical facts, are forward-looking statements.
TransMontaigne Partners L.P. (NYSE TLP) Wells Fargo th Annual Energy Symposium December 10 th, 2013
 Wells Fargo th Annual Energy Symposium December 10 th, 2013") TransMontaigne Partners L.P. (NYSE TLP) Wells Fargo 2013 12 th Annual Energy Symposium December 10 th, 2013 Forward Looking Statements All statements, other than statements of historical facts, contained
TransMontaigne Partners L.P. (NYSE TLP) Wells Fargo 2013 12 th Annual Energy Symposium December 10 th, 2013 Forward Looking Statements All statements, other than statements of historical facts, contained
Fertilizer Overview DREW BURKE, CFO, BUNGE LIMITED BUNGE INVESTOR DAY
 Fertilizer Overview DREW BURKE, CFO, BUNGE LIMITED 1 2012 BUNGE INVESTOR DAY Forward-Looking Statements Today s presentation includes forward-looking statements that reflect Bunge s current views with
Burlington Northern Santa Fe, LLC
 Burlington Northern Santa Fe, LLC 2016 FIXED-INCOME INVESTOR CALL NOVEMBER 9, 2016 This presentation is intended to provide information to certain investors in Burlington Northern Santa Fe, LLC and BNSF
Investor Relations. September 2018
 Investor Relations 1 September 2018 Forward-Looking Statements The following presentation contains forward-looking statements which are protected as forward-looking statements under the PSLRA, and which
NYSE: GBX. May Investor Contact: Website:
 NYSE: GBX May 2018 Investor Contact: Investor.Relations@gbrx.com Website: www.gbrx.com Safe Harbor Statement UNDER THE PRIVATE SECURITIES LITIGATION REFORM ACT OF 1995: This presentation may contain forward-looking
NYSE: GBX. Stephens Investment Conference November Investor Contact: Website:
 NYSE: GBX Stephens Investment Conference November 2017 Investor Contact: Investor.Relations@gbrx.com Website: www.gbrx.com Safe Harbor Statement UNDER THE PRIVATE SECURITIES LITIGATION REFORM ACT OF 1995:
Fourth Quarter Earnings Conference Call. February 2, 2016
 Fourth Quarter 2015 Earnings Conference Call February 2, 2016 Safe Harbor Statement 2 Some of our comments constitute forward-looking statements that reflect management s current views and estimates of
Transformation through Distinctive Performance Simmons Energy Conference. February 27, 2014
 Transformation through Distinctive Performance Simmons Energy Conference February 27, 2014 Forward Looking Statements This Presentation includes forward looking statements within the meaning of the Private
CARS.COM. Fourth Quarter and Full Year 2017 Earnings March 6, 2018
 CARS.COM Fourth Quarter and Full Year 2017 Earnings March 6, 2018 Forward-Looking Statements This presentation contains forward-looking statements within the meaning of the federal securities laws. All
Annual Report 2000 INITIATING NEW GROWTH
 Annual Report 2000 INITIATING NEW GROWTH THE ANDERSONS, INC. (NASDAQ: ANDE) IS A DIVERSIFIED AGRIBUSINESS AND RETAILING COMPANY WITH ANNUAL REVENUES OF APPROXIMATELY $1 BILLION. THE COMPANY, WHICH BEGAN
Cautionary Information
 February 13, 2018 Stifel Nicolaus Transportation & Logistics Conference Rob Knight CFO 1 Cautionary Information This presentation and related materials contain statements about the Company s future that
Cautionary Information
 March 8, 2017 Raymond James 38 th Annual Institutional Investors Conference Rob Knight CFO 1 Cautionary Information This presentation and related materials contain statements about the Company s future
Cautionary Information
 February 14, 2017 Stifel 2017 Transportation & Logistics Conference Rob Knight CFO 1 Cautionary Information This presentation and related materials contain statements about the Company s future that are
AGI ANNOUNCES STRATEGIC ACQUISITION OF GLOBAL INDUSTRIES, INC.
 AGI ANNOUNCES STRATEGIC ACQUISITION OF GLOBAL INDUSTRIES, INC. Complementary product catalogue adds grain dryer line and strong on farm stationary handling capabilities Improves grain bin and handling
Driven to Create Value Goldman Sachs 2017 Global Energy Conference January 2017
 Driven to Create Value Goldman Sachs 2017 Global Energy Conference January 2017 2015 Corporation. All Rights Reserved. Forward Looking Statements On November 17, 2016, we announced our plans to acquire
First American Financial KBW Mortgage Finance & Asset Management Conference June 1, 2017
 First American Financial KBW Mortgage Finance & Asset Management Conference June 1, 2017 2015 First American Financial Corporation and/or its affiliates. All rights reserved. q NYSE: FAF Safe Harbor Statement
Second Quarter 2011 Earnings Conference Call. 18 May 2011
 Second Quarter 2011 Earnings Conference Call 18 May 2011 Safe Harbor Statement & Disclosures The earnings call and accompanying material include forward-looking comments and information concerning the
Chapter 4 Assessing the Financial Performance and Returns of Ethanol Production: A Case Study Analysis Paul N. Ellinger 5
 Chapter 4 Assessing the Financial Performance and Returns of Ethanol Production: A Case Study Analysis Paul N. Ellinger 5 This primary objective of this case study is to illustrate the factors that impact
News Release NYSE: BPL
 News Release NYSE: BPL Buckeye Partners, L.P. One Greenway Plaza Suite 600 Houston, TX 77046 Contact: Kevin J. Goodwin Vice President & Treasurer irelations@buckeye.com (800) 422-2825 BUCKEYE PARTNERS,
Second Quarter 2016 Results
 July 21, 2016 Second Quarter 2016 Earnings Release Lance Fritz Chairman, President & CEO 1 Second Quarter 2016 Results Earnings Per Share Second Quarter $1.43 $1.38 Earnings Per Share -15% Down 15% $1.17
First Quarter 2018 Business Update. May 7, 2018
 First Quarter 2018 Business Update May 7, 2018 Forward-Looking Statements This presentation includes forward-looking statements that reflect management s current views of company performance, industry
Investor Relations. January 2019
 Investor Relations 1 January 2019 Forward-Looking Statements The following presentation contains forward-looking statements which are protected as forward-looking statements under the PSLRA, and which
NYSE: GBX. 3Q18 Earnings Slides & Supplemental Information. Investor Contact: Website:
 NYSE: GBX 3Q18 Earnings Slides & Supplemental Information Investor Contact: Investor.Relations@gbrx.com Website: www.gbrx.com Safe Harbor Statement UNDER THE PRIVATE SECURITIES LITIGATION REFORM ACT OF
3Q 2018 Earnings Call. 17 August 2018
 3Q 2018 Earnings Call 17 August 2018 1 Safe Harbor Statement & Disclosures The earnings call and accompanying material include forward-looking comments and information concerning the company s plans and
BMO Farm to Market Conference. May 16, 2018
 BMO Farm to Market Conference May 16, 2018 Todd Becker President & Chief Executive Officer Forward-Looking Statements This presentation includes forward-looking statements that reflect management s current
Successful Execution of Business Transformation Driving Sustainable Growth. CL King 15 th Annual Best Ideas Conference 2017 September 14, 2017
 Successful Execution of Business Transformation Driving Sustainable Growth CL King 15 th Annual Best Ideas Conference 2017 September 14, 2017 Preliminary Statements Forward Looking Statements This document
2Q 2018 Earnings Call. 18 May 2018
 2Q 2018 Earnings Call 18 May 2018 1 Safe Harbor Statement & Disclosures The earnings call and accompanying material include forward-looking comments and information concerning the company s plans and projections
Second Quarter 2016 Earnings Conference Call. 20 May 2016
 Second Quarter 2016 Earnings Conference Call 20 May 2016 Safe Harbor Statement & Disclosures The earnings call and accompanying material include forward-looking comments and information concerning the
Fall 2017 Crop Outlook Webinar
 Fall 2017 Crop Outlook Webinar Chris Hurt, Professor & Extension Ag. Economist James Mintert, Professor & Director, Center for Commercial Agriculture Fall 2017 Crop Outlook Webinar October 13, 2017 50%
Stifel 2018 Cross Sector Insight Conference. June 12, 2018
 N Stifel 2018 Cross Sector Insight Conference June 12, 2018 Forward-Looking Statements Certain statements in this presentation, including without limitation statements about the company; market growth
Fourth Quarter 2016 Earnings Conference Call. 23 November 2016
 Fourth Quarter 2016 Earnings Conference Call 23 November 2016 Safe Harbor Statement & Disclosures The earnings call and accompanying material include forward-looking comments and information concerning
CARS.COM. First Quarter 2018 Earnings May 9, 2018
 CARS.COM First Quarter 2018 Earnings May 9, 2018 Forward Looking Statements This presentation contains forward looking statements within the meaning of the federal securities laws, including those statements
Second Quarter 2018 Business Update. August 1, 2018
 Second Quarter 2018 Business Update August 1, 2018 Forward-Looking Statements This presentation includes forward-looking statements that reflect management s current views of company performance, industry
Q1 FY18 Results and Acquisition of KapStone Paper & Packaging Corporation. January 29, 2018
 Q1 FY18 Results and Acquisition of KapStone Paper & Packaging Corporation January 29, 2018 Forward Looking Statements This presentation contains forward-looking statements within the meaning of the Private
Second Quarter 2017 Financial Results. July 25, 2017
 Second Quarter 2017 Financial Results July 25, 2017 Forward-Looking Statements Certain statements included in this presentation constitute forward-looking statements within the meaning of the United States
First Quarter 2010 Earnings Conference Call. 17 February 2010
 First Quarter 2010 Earnings Conference Call 17 February 2010 Safe Harbor Statement & Disclosures The earnings call and accompanying material include forward-looking comments and information concerning
Investor Update Business Transformation Delivering Results
 Investor Update Business Transformation Delivering Results September 13, 2016 Preliminary Statements Forward Looking Statements This document contains certain forward-looking statements. These statements
Morgan Stanley Midstream MLP and Diversified Natural Gas Corporate Access Event
 Morgan Stanley Midstream MLP and Diversified Natural Gas Corporate Access Event March 4-5, 2014 LEGAL NOTICE/FORWARD-LOOKING STATEMENTS This presentation contains forward-looking statements that we believe
Nutrien Q4 Results Presentation. February 5, 2018
 Nutrien Q4 Results Presentation Forward Looking Statements 2 Certain statements and other information included in this presentation constitute "forward-looking information" or "forward-looking statements"
NYSE: GBX. 3Q17 Earnings Slides & Supplemental Information. Investor Contact: Website:
 NYSE: GBX 3Q17 Earnings Slides & Supplemental Information Investor Contact: Investor.Relations@gbrx.com Website: www.gbrx.com Safe Harbor Statement UNDER THE PRIVATE SECURITIES LITIGATION REFORM ACT OF
Ag Growth Announces First Quarter 2016 Results; Declares Dividends
 Ag Growth Announces First Quarter 2016 Results; Declares Dividends Winnipeg, MB, May 5, 2016 Ag Growth International Inc. (TSX: AFN) ( AGI or the Company ) today announced its financial results for the
First Quarter 2017 Results
 April 27, 2017 First Quarter 2017 Earnings Release Lance Fritz Chairman, President & CEO 1 First Quarter 2017 Results Earnings Per Share First Quarter Operating Ratio First Quarter $1.16 +14% $1.32 First
PolyOne Investor Presentation KeyBanc 2014 Basic Materials & Packaging Conference Boston, MA September 10, 2014
 PolyOne Investor Presentation KeyBanc 2014 Basic Materials & Packaging Conference Boston, MA September 10, 2014 PolyOne Corporation Page 1 Forward-Looking Statements In this presentation, statements that
Fourth Quarter 2018 Results
 January 24, 2019 Fourth Quarter 2018 Earnings Release Lance Fritz Chairman, President & CEO 1 Fourth Quarter 2018 Results Earnings Per Share Fourth Quarter Operating Ratio Fourth Quarter $9.25 +39% $2.12
Driven to Create Value
 Driven to Create Value Bank of America Refining Conference March 2016 2015 Corporation. All Rights Reserved. Forward Looking Statements This Presentation includes forward-looking statements within the
News Release NYSE: BPL
 News Release NYSE: BPL Buckeye Partners, L.P. One Greenway Plaza Suite 600 Houston, TX 77046 Contact: Kevin J. Goodwin Vice President & Treasurer irelations@buckeye.com (800) 422-2825 BUCKEYE PARTNERS,
Fourth Quarter 2008 Earnings Conference Call 26 November th Quarter 2008 Earnings Conference Call
 Fourth Quarter 2008 Earnings Conference Call 26 November 2008 1 Safe Harbor Statement & Disclosures The earnings call and accompanying material include forward-looking comments and information concerning
INVESTOR PRESENTATION. March 2019
 INVESTOR PRESENTATION March 2019 FORWARD-LOOKING STATEMENTS Some of the statements in this presentation constitute forward-looking statements about Sunoco LP ( SUN, we, our, and us ) that involve risks,
Growth Stock Conference June 11,
 William Blair Growth Stock Conference June 11, 2009 www.theice.com FORWARD-LOOKING STATEMENTS Forward-Looking Statements This presentation may contain forward-looking statements made pursuant to the safe
Earnings Conference Call Third Quarter 2016 October 28, :00 am ET
 Earnings Conference Call Third Quarter 2016 October 28, 2016 9:00 am ET Today s Presenters Kim Ann Mink, Ph.D. Chief Executive Officer and President Han Kieftenbeld SVP and Chief Financial Officer 2 Safe
Agrium s Q Earnings Conference Call
 Agrium s Q3 2015 Earnings Conference Call November 5, 2015 Advisory Forward-Looking Statements Certain statements and other information included in this presentation constitute "forward-looking information",
Cautionary Information
 May 17, 2016 Bank of America Merrill Lynch 2016 Transportation Conference Rob Knight CFO 1 Cautionary Information This presentation and related materials contain statements about the Company s future that
Buckeye Partners, L.P. Master Limited Partner Conference February 2005
 Buckeye Partners, L.P. Master Limited Partner Conference February 2005 Forward Looking Statements This presentation may include forward-looking statements within the meaning of Section 27A of the Securities
Brady Brewer, Allen Featherstone, Christine Wilson, and Brian Briggeman Department of Agricultural Economics Kansas State University
 Agricultural Lender Survey Brady Brewer, Allen Featherstone, Christine Wilson, and Brian Briggeman Department of Agricultural Economics Kansas State University Results: Fall Survey, 2015 Survey Summary
First Quarter 2015 Financial Results April 20, 2015
 First Quarter 2015 Financial Results April 20, 2015 Forward-Looking Statements The financial results in this presentation were determined on the basis of U.S. GAAP. Please refer to the website www.cn.ca/nongaap
Marathon Petroleum Corporation Reports First-Quarter 2015 Results
 Marathon Petroleum Corporation Reports First-Quarter 2015 Results Reported record first-quarter earnings of $891 million ($3.24 per diluted share) Converted over 400 of the 1,245 new retail sites to the
2017 ANNUAL GENERAL MEETING PRESENTATION. Robert Day, President & CEO
 2017 ANNUAL GENERAL MEETING PRESENTATION Robert Day, President & CEO FORWARD LOOKING STATEMENTS This presentation contains "forward-looking information" within the meaning of applicable Canadian securities
Union Pacific Reports All-Time Quarterly Records
 Union Pacific Reports All-Time Quarterly Records Diluted Earnings per Share up 21 Percent FOR IMMEDIATE RELEASE All-Time Quarterly Records Diluted earnings per share of $1.43 improved 21 percent. Operating
American Italian Pasta Company
 American Italian Pasta Company 2 nd Quarter Fiscal 2010 Results May 6, 2010 Forward Looking Statements This presentation contains statements concerning potential future events. These forward-looking statements
Fourth Quarter Earnings Release January 19, 2012
 Fourth Quarter Earnings Release January 19, 2012 Jim Young, Chairman & CEO 1 Union Pacific Achieves Milestones Positives Record Financial Results Achieved in 4 th Quarter and Full Year Employee Safety
Our Transformation Continues. March 21, 2018
 Our Transformation Continues March 21, 2018 Disclosure Regarding Forward-Looking Statements Forward-Looking Statements and Factors That May Affect Future Results: Throughout this presentation, we make
INVESTOR PRESENTATION. December 2018
 INVESTOR PRESENTATION December 2018 FORWARD-LOOKING STATEMENTS Some of the statements in this presentation constitute forward-looking statements about Sunoco LP ( SUN, we, our, and us ) that involve risks,
Bunge Reports Fourth Quarter 2017 Results
 Bunge Reports Fourth Quarter 2017 Results White Plains, NY - February 14, 2018 - Bunge Limited (NYSE:BG) Q4 GAAP EPS of $(0.48) reflecting charges primarily related to restructuring and tax reform; $0.67
Investor Presentation. February 2018
 Investor Presentation February 2018 Legal Disclaimer 2 Certain statements and other information included in this presentation constitute "forward-looking information" or "forward-looking statements" (collectively,
Cautionary Information
 March 6, 2018 Raymond James 39 th Institutional Investors Conference Rob Knight CFO 1 Cautionary Information This presentation and related materials contain statements about the Company s future that are
Managing Director s Address Annual General Meeting of Shareholders - Melbourne Thursday, December 7, 2017 at am. G A Hunt
 Managing Director s Address Annual General Meeting of Shareholders - Melbourne Thursday, December 7, 2017 at 10.00 am G A Hunt Thank you Chairman, and good morning everyone. I would also like to welcome
American Railcar Industries, Inc.
 American Railcar Industries, Inc. Exhibit 99.2 Q4 2017 Supplemental Information Investor Contact: 636.940.6000 Website: americanrailcar.com Forward Looking Disclaimer Safe Harbor Statement This presentation
Financial Statements August 31, 2016 and 2015 Redfield Energy, LLC
 Financial Statements August 31, 2016 and 2015 Redfield Energy, LLC www.eidebailly.com Financial Statements August 31, 2016 Page No. Balance Sheets 2-3 Statements of Operations 4 Statements of Changes in
Bank of America Global Agriculture and Chemicals Conference
 Bank of America Global Agriculture and Chemicals Conference Sergey Vasnetsov SVP, Strategic Planning & Transactions March 2, 2016 Cautionary Statement The statements in this presentation relating to matters
Bunge to Acquire 70% Ownership Interest in IOI Loders Croklaan to Create a Leading Solutions Provider in B2B Oils
 Bunge to Acquire 70% Ownership Interest in IOI Loders Croklaan to Create a Leading Solutions Provider in B2B Oils Creates Comprehensive Product Offering with Enhanced Solutions for Customers Combines Leading
2018 FOURTH QUARTER EARNINGS CALL
 NORTH AMERICA S LEADING BUILDING MATERIALS DISTRIBUTOR RESIDENTIAL COMMERCIAL INTERIOR SOLAR 2018 FOURTH QUARTER EARNINGS CALL Forward Looking Statements / Non-GAAP Measures This presentation contains
Financial Statement August 31, 2014 and 2013 Redfield Energy, LLC
 Financial Statement August 31, 2014 and 2013 Redfield Energy, LLC www.eidebailly.com Financial Statements August 31, 2014 Page No. Balance Sheet s 1-2 Statements of Operations 3 Statements of Changes in