INVESTOR PRESENTATION. September 2018
|
|
|
- Sandra Hawkins
- 5 years ago
- Views:
Transcription
1 INVESTOR PRESENTATION September 2018
2 Cautionary Note on New Accounting Standard and Information on Forward-Looking Statements Cautionary Note Regarding New Revenue Recognition Accounting Standard The financial information for 2016 and prior periods in the slides that follow is presented under Old GAAP i.e., before implementation of the new revenue recognition accounting standard (ASC Topic 606), which we adopted as of January 1, 2018, using the full retrospective method. Information Regarding Forward-Looking Statements This presentation contains forward-looking statements within the meaning of the Private Securities Litigation Reform Act of Examples of forward-looking statements in this presentation include, but are not limited to, statements regarding: (i) earnings from our clean energy investments, and expected future tax rates; (ii) future dividends; (iii) improvements in our new business production; (iv) tuck-in M&A activity; (v) global brand recognition; (vi) the leveraging of internal resources across divisions and borders; (vii) our status as the premier provider of claims management services; (viii) our global presence in the claims space; (ix) our ability to stay in front of improvements in technology; (x) our ability to leverage resources across borders; (xi) commercial P&C pricing; (xii) drivers and expected levels of our organic growth; (xiii) future M&A opportunities, including bolt-on acquisitions to our platforms ; (xiv) increasing productivity and quality; (xv) our management team; (xvi) our use of leverage; (xvii) our balance sheet; and (xviii) our return to shareholders. Statements regarding our clean energy investments and future effective tax rates could be materially impacted by various risk and uncertainties, including uncertainties related to political and regulatory risks, such as potential actions by Congress or challenges by the IRS eliminating or reducing the availability of tax credits under IRC Section 45 retroactively and/or going forward; the ability to maintain and find co-investors; the potential for divergent business objectives by co-investors and other stakeholders; plant operational risks, including supply-chain risks; utilities future use of, or demand for, coal; the market price of coal; the costs of moving a clean coal plant; intellectual property litigation risks; and environmental risks. The other forward-looking statements referred to above could be materially impacted by declines in premiums or other adverse trends in the insurance industry; an economic downturn (including as a result of Brexit, trade wars or tariffs); tax reform, including new interpretations or guidance from regulators; competitive pressures in our businesses; failure to successfully or cost-effectively integrate recently acquired businesses; risks to our acquisition strategy, including continuing consolidation in our industry and increased interest in acquiring insurance brokers by private equity firms; our failure to attract and retain key executives and other personnel; risks arising from our international operations, including political and economic uncertainty and regulatory and legal compliance risk; concentration of large amounts of revenue with certain clients in our risk management segment; failure to apply technology effectively in our businesses; business continuity and cybersecurity risks; damage to our reputation; and failure to comply with regulatory requirements, including the FCPA, other anti-corruption laws, sanctions laws, and data privacy laws. Please refer to Gallagher s filings with the SEC, including Item 1A, Risk Factors, of its most recently filed Annual Report on Form 10-K and Quarterly Report on Form 10-Q for a more detailed discussion of these and other factors that could impact its forward-looking statements. 2
3 Information Regarding Non-GAAP Measures This presentation includes references to Adjusted EBITDAC, Adjusted EBITDAC margin, Adjusted Revenues, Adjusted Operating Expense Ratio and Organic Revenue Growth, which are measures not in accordance with, or an alternative to, the GAAP information provided herein. Earnings Measures - Gallagher believes that each of Adjusted EBITDAC and Adjusted EBITDAC margin, as defined below, provides a meaningful representation of its operating performance and improves the comparability of Gallagher s results between periods by eliminating the impact of certain items that have a high degree of variability. EBITDAC is defined as net earnings before interest, income taxes, depreciation, amortization and the change in estimated acquisition earnout payables. Adjusted EBITDAC is EBITDAC further adjusted to exclude gains realized from sales of books of business, acquisition integration costs related to large acquisitions, workforce related charges, lease termination related charges, acquisition related adjustments and the period-over-period impact of foreign currency translation, as applicable. Adjusted EBITDAC margin is defined as Adjusted EBITDAC divided by Adjusted Revenues (defined below). The most directly comparable GAAP measure for these non-gaap earnings measures is net earnings. For the two segments (Brokerage Segment & Risk Management Segment) on a combined basis, net earnings was $174 million, $199 million, $253 million, $306 million, $325 million, $414 million, $470 million and $582 million in 2011, 2012, 2013, 2014, 2015, 2016, 2017 and 2Q 2018 on trailing twelve month basis. For the Brokerage Segment, net earnings were $262 million and $367 million in the first half of 2017 and 2018, respectively. For the Risk Management Segment, net earnings were $27 million and $34 million in the first half of 2017 and 2018, respectively. See Cautionary Note on page 2. Revenue and Expense Measures - Gallagher believes that Adjusted Revenues and Adjusted Operating Expense Ratio, each as defined below, provides stockholders and other interested persons with useful information that will assist such persons in analyzing Gallagher s operating results as they develop a future outlook for Gallagher. Gallagher believes that Organic Revenue Growth provides a comparable measurement of revenue growth that is associated with the revenue sources that will continue in the future. Gallagher has historically viewed organic revenue growth as an important indicator when assessing and evaluating the performance of its Brokerage and Risk Management segments. Gallagher also believes that using this measure allows financial statement users to measure, analyze and compare the growth from its Brokerage and Risk Management segments in a meaningful and consistent manner. Adjusted Revenues is defined as revenues, Revenues (for the Brokerage segment), revenues before reimbursements (for the Risk Management segment beginning in 2017), adjusted to exclude gains realized from sales of books of business, acquisition integration costs for large acquisitions, workforce related charges, lease termination related charges, acquisition related adjustments, and the period-over-period impact of foreign currency translation, as applicable. Adjusted Operating Expense Ratio is defined as operating expense, adjusted to exclude the items listed above for Adjusted Revenues, as applicable, divided by Adjusted Revenues. Organic Revenue Growth. For the Brokerage segment, organic change in commission and fee revenues excludes the first twelve months of net commission and fee revenues generated from acquisitions and the net commission and fee revenues related to operations disposed of in each year presented. These commissions and fees are excluded from organic revenues in order to help interested persons analyze the revenue growth associated with the operations that were a part of Gallagher in both the current and prior year. In addition, change in commission and fee revenue organic growth excludes the period-over-period impact of foreign currency translation. For the Risk Management segment, organic change in fee revenues excludes the first twelve months of fee revenues generated from acquisitions and the fee revenues related to operations disposed of in each year presented. In addition, change in organic growth excludes the impact of the period-over-period impact of foreign currency translation to improve the comparability of our results between periods by eliminating the impact of the items that have a high degree of variability or are due to the limited-time nature of these revenue sources. The most directly comparable GAAP measure for Adjusted Revenues and Organic Growth is reported revenues. For the Brokerage Segment, reported revenues were $533 million, $679 million, $783 million, $863 million, $946 million, $1,007 million, $1,114 million, $1,188 million, $1,276 million, $1,329 million, $1,544 million, $1,812 million, $2,126 million, $2,896 million, $3,324 million, $3,528 million, $3,831 million, $1,979 and $2,187 in 2001, 2002, 2003, 2004, 2005, 2006, 2007, 2008, 2009, 2010, 2011, 2012, 2013, 2014, 2015, 2016, 2017, the first half of 2017 and the first half of 2018, respectively. For the Risk Management Segment, reported revenues were $427 million and $467 million in the first half of 2017 and the first half of 2018, respectively. On a combined basis (Brokerage Segment & Risk Management Segment) reported revenues were $2,408 million, $2,663 million and $4,944 million in the first half of 2017, the first half of 2018 and on trailing twelve month basis as of 2Q 2018, respectively. See Cautionary Note on page 2. The most directly comparable GAAP measure for Adjusted Operating Expense Ratio is reported operating expense, which was $247 million and $614 million in 2008 and 2017, respectively, for the Brokerage Segment and $126 million and $165 million in 2008 and 2017, respectively, for the Risk Management Segment. Reconciliations For reconciliations, please see the examples set forth in our filings with the Securities and Exchange Commission covering periods prior to 2017 and the examples set forth in Non-GAAP Reconciliation on Gallagher s Web site at ajg.com/ir covering 2017 and after. 3

4 Who We Are Founded in 1927 Public since 1984 One of the World s leading insurance brokers* One of the World s largest P&C third-party administrators* Key Facts Key Shareholder Data 34 Countries*** $4.8B Total Adjusted Revenue** 28,992 Employees $242M Acquired Revenue** 2.3% Dividend Yield*** $73.11 High $57.19 Low 52-Week Range*** $ Q3 Dividend/Share Outstanding 182.6M Shares As of June 30, 2018 unless otherwise indicated *According to Business Insurance **Brokerage & Risk Management adjusted revenue and annualized acquired revenue for the trailing twelve months ended June 30, 2018 ***as of August 24, 2018 $13.2B Market Cap*** AJG NYSE 4

5 Snapshot of Core Operations BROKERAGE SEGMENT 84% of revenue* We sell insurance and consult on insurance programs Property/Casualty and employee benefits Retail and wholesale Primarily middle-market commercial clients and individuals 76% of C&F revenue is commission 24% is fee-based RISK MANAGEMENT SEGMENT 16% of revenue* We adjust claims and help companies and carriers reduce their losses Workers compensation, liability, managed care, auto and property Modest amount of storm/earthquake claims Primarily Fortune 1000 clients More than 90% of 2017 revenue from non-affiliated brokerage customers and their clients *Brokerage & Risk Management adjusted revenue for the trailing twelve months ended June 30,
6 Diverse Revenue Base Brokerage* RETAIL P/C 57% Risk Management* WORKERS COMPENSATION 64% RETAIL BENEFITS 27% WHOLESALE 16% LIABILITY 32% DOMESTIC 66% INTERNATIONAL 34% DOMESTIC 84% PROPERTY 4% *Brokerage & Risk Management revenue for the trailing twelve months ended June 30, 2018 INTERNATIONAL 16% 6
7 Brokerage - 1H 2018 Adjusted Revenues $2,300 $2,100 $1,900 $1,700 (in $M) 9% $2,014 $2, Total Organic Growth 6.0% 5.0% 4.0% 3.0% 3.4% 5.3% 2.0% Adjusted EBITDAC $700 11% Adjusted EBITDAC Margin 31.0% $650 $600 $550 (in $M) $605 $ % 30.0% 29.5% 29.0% 30.0% 30.6% See important disclosures regarding Non-GAAP measures on Page 3. 7
8 Risk Management 1H 2018 Adjusted Revenues $400 $380 $360 $340 (in $M) Adjusted EBITDAC $72 $68 $64 $60 $56 (in $M) 10% $360 $ % $60 $ Total Organic Growth 10.0% 8.0% 6.0% 4.0% 2.0% 0.0% 2.2% 8.9% Adjusted EBITDAC Margin 17.4% 17.2% 17.0% 16.8% 16.6% 16.8% 17.1% 16.4% See important disclosures regarding Non-GAAP measures on Page 3. 8
9 Brk & RM Segments 1H 2018 Adjusted Revenues $2,600 $2,400 $2,200 $2,000 (in $M) Adjusted EBITDAC $800 $750 $700 $650 $600 $550 (in $M) 9% $2,374 $2, % $665 $ Total Organic Growth 8.0% 6.0% 4.0% 2.0% 3.2% 5.9% 0.0% Adjusted EBITDAC Margin 29.0% 28.5% 28.0% 28.0% 28.5% 27.5% See important disclosures regarding Non-GAAP measures on Page 3. 9
10 Net Earnings from Clean Energy $150 $140 $130 $120 $110 $100 $90 $80 $70 $60 $50 $40 $30 $20 $10 $0 -$10 (in $M) $6.7 $2.2 $31.0 $57.2 $79.9 $95.4 $95.7 $110.3 $114.9 ($6.1) * E Estimated net earnings for 2017 and prior periods have been presented as if the US Corporate tax rate was 26% (21% Federal and 5% State). 2018E represents the mid-point of most recent estimate contained within the July 26, 2018 CFO Commentary. *Excludes a non-cash after tax gain of $14.1m from a reconsolidation accounting gain, related to clean-energy investments, recorded in
11 Tax Credit Carryforwards $800 $700 $600 should reduce our US federal cash taxes paid for many years to come. $500 $400 $300 $200 $100 $0 (in $M) $112.3 $147.4 $233.4 $341.6 $477.9 $683.3 $ June
12 Dividends Per Share $1.80 $1.60 $1.64* $1.40 $1.20 $1.00 $0.80 $0.60 $0.40 $0.20 $ E *Indicated On July 24, 2018, Gallagher s Board of Directors declared a $0.41 per share third-quarter 2018 dividend. 12
13 1H 2018 Business Highlights Brokerage & Risk Management Combined 9% 5.9% adjusted revenue growth total organic growth 11% adjusted EBITDAC growth 53 bps margin improvement See important disclosures regarding Non-GAAP measures on Page 3. 13
14 1H 2018 Business Highlights M&A - Brokerage & Risk Management Combined $175m in acquired revenues +19 new merger partners Fair valuations ~8.5x EBITDAC Focus on tuck-in opportunities See important disclosures regarding Non-GAAP measures on Page 3. 14

15 1H 2018 Business Highlights Clean Energy $66.9m of net earnings 13% increase in credits produced over 1H

16 Where We Are Going BROKERAGE SEGMENT Improving new business production Continuing tuck-in M&A Increasing global brand recognition Leveraging internal resources and processes across divisions RISK MANAGEMENT SEGMENT To be premier provider of claims management services with superior outcomes Increasing global presence in claims space U.S. clients with global operations Expanding via M&A/new partners Staying in front of improving technology Increasing brand recognition globally Leveraging resources across borders 16
17 Commercial P&C Pricing Shows Shallow Cycle Stable Market CPI Rates Commercial Rate Index reflects the cost of P&C premiums relative to the year Constructed using Counsel of Insurance Agents and Brokers (CIAB) data. CPI index uses data from the Bureau of Labor Statistics. 17

18 Shows Shallow Pricing Cycle 6.0% 4.0% 2.0% 0.0% -2.0% -4.0% 5.0% 5.2% 4.4%4.3% 4.3% 3.9% 3.4% 2.7% 2.1% 1.5% 1.7% 1.5% 0.9% 0.1% 0.3% -0.1% -0.5% -0.7% -1.3% -2.3% -2.9% -3.3% -3.1%-2.8% -2.5% -2.8% -3.2%-3.3% -3.7% -3.9% -6.0% CIAB Change in Average Commercial Rates 18
19 Sales Culture Performs Through Cycle Gallagher Brk Organic CIAB - Change in Avg. Commercial Rates 25.0% 20.0% 15.0% 10.0% 5.0% 0.0% -5.0% -10.0% -15.0% 19.8% 19.8% 14.0% Hard Market 16.0% 8.1% 10.0% 2.0% 2.0% -4.1% -8.0% 5.0% -5.2% Soft Market 2.0% -12.1% -11.0% -0.8% -2.4% -1.7% -5.4% -5.6% 3.1% 0.2% 4.4% 5.6% 3.8% 3.8% 3.4% 4.4% 3.8% Shallow Market 0.1% -2.9% -3.5% 4.4% 5.6% H18-1.6% AJG Brk Organic 0.6% CIAB CIAB is the 4 quarter average. Gallagher s Brokerage Segment Organic Growth excluding Contingent Commissions. See Cautionary Note on page 2 regarding the new revenue recognition accounting standard. See also important disclosures regarding Non-GAAP measures on Page 3. 19
20 Shallow Rate Cycle Is Better for: CLIENTS CARRIERS & BROKERS 20

21 Consistent Growth Strategy 21

22 Consistent Growth Strategy Organic 22

23 Driving Brokerage Organic Growth 23
24 Niche Expertise Teams Brokerage Affinity Automotive Aviation Construction Energy Entertainment Environmental Equity Advisors Financial Institutions Food/Agribusiness Global Risks Healthcare Higher Education K12 Education Law Firms Life Sciences Marine Not-for-Profit Personal Private Client Public Entity Real Estate/ Hospitality Religious Restaurant Technology Trade Credit/ Political Risk Transportation 24


25 Driving Risk Management Organic Growth 25


26 Risk Management Growth Focuses on Four Market Segments PUBLIC SECTOR ENTITIES ALTERNATIVE MARKET PARTICIPANTS LARGE COMMERCIAL ENTITIES INSURANCE CARRIERS 26
27 Consistent Growth Strategy M&A 27
28 Acquisition Revenue Growth $900 $800 $700 $600 Domestic Property & Casualty Risk Management Employee Benefits Foreign Property & Casualty $500 $400 $300 $200 $100 $ H2018 Annualized Revenues Acquired (in $M s) See Cautionary Note on page 2 regarding the new revenue recognition accounting standard. 28


29 M&A Opportunities Continue Vast Pipeline Acquisition Units Limited Consolidators Core Competency Domestic and international markets highly fragmented 18,000+ agents/ brokers just in the U.S. Retail P&C Wholesale Benefits Culture Proven history Ability to integrate Need Gallagher s expertise International Baby boomers looking for exit strategy MGA/MGU Captive TPA 29


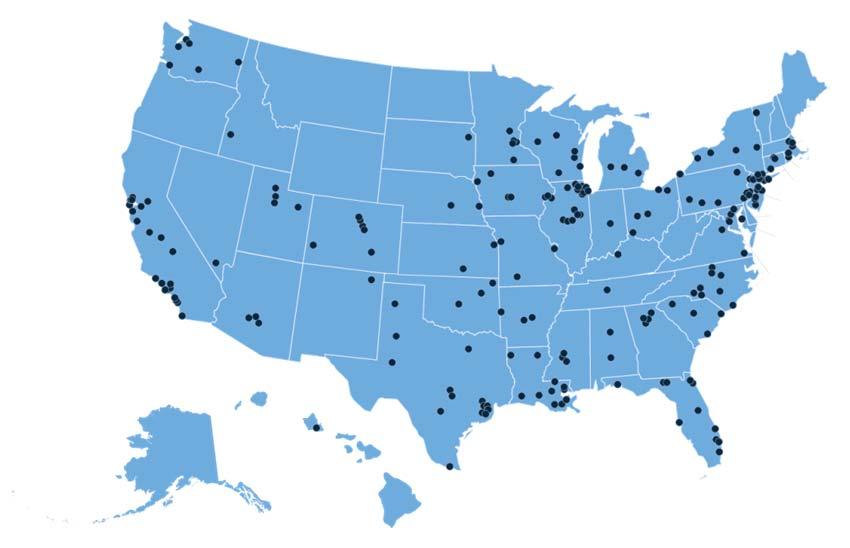
30 Platforms In Place for Bolt-on M&A 30


31 International Correspondent Broker Network Client Capabilities in 150 Countries 31

32 Productivity and Quality Initiatives 32

33 Focus Continues: Optimizing Productivity & Quality Utilizing Centers of Excellence Harmonizing Systems Leveraging Sales Force Management Tools Investing in Business Intelligence, Data & Analytics CONTINUE TO IMPROVE PRODUCTIVITY AND QUALITY Utilizing Sourcing to Manage Expenses Building Productivity Tools DMS and Workflow Optimizing Real Estate Footprint Standardizing Processes 33


34 Benefits Continue: From Centers of Excellence Foster Innovation Reduce Costs Increase Speed to Market Focus on Core Improve Quality 34


35 Behind the Scenes Efforts Centers of Excellence Update Accounting support Claims support Policy checking Policy issuance We now have more than 4,000 associates Improve quality Control operating costs Reduce E&O costs Easy for new acquisitions to leverage Renewal support Certificates of insurance 35
36 Reduced Adjusted Operating Expense Ratio Brokerage 22.0% 21.0% 20.0% 19.0% 18.0% 17.0% 16.0% Risk Management 28.0% 27.0% 26.0% 25.0% 24.0% 23.0% 15.0% 14.0% 20.8% 15.7% % 21.0% 27.0% 22.4% See Cautionary Note on page 2 regarding the new revenue recognition accounting standard as 2017 ratios above reflect the adoption ASC 606, while the 2008 ratios do not. See also important disclosures regarding Non-GAAP measures on Page 3. 36
37 Brokerage & Risk Management Adjusted EBITDAC Margin 27.0% 26.0% 25.0% 24.0% 23.0% 22.0% 21.0% 20.0% 19.0% 18.0% 20.4% 21.2% 22.1% 23.6% 24.5% 25.3% 25.6% 26.0% * See Cautionary Note on page 2 regarding the new revenue recognition accounting standard. See also important disclosures regarding Non- GAAP measures on Page 3. Note that the 2017 brokerage and risk management segment adjusted EBITDAC margin has been restated to reflect the new revenue recognition accounting standard. *2018 is on trailing twelve months basis as of 6/30/
38 Relentless Focus on Quality and Customer Service Claims Management Firm of the Year U.S. CAPTIVE REVIEW AWARDS A Top 100 Internship Program WAYUP Best Casualty Claims Handling Insured/TPA 2018 ADVISEN CLAIMS SATISFACTION SURVEY A Top Best Culture Company in Metro Chicago 2017 USA TODAY UK Insurance Broker of the Year REACTIONS LONDON MARKET AWARDS Caribbean Broker of the Year REACTIONS LATIN AMERICA AWARDS UK Group Risk Adviser of the Year 2017 UK CORPORATE ADVISER Best UK Employee Benefit Consultant 2016 REWARD GUIDE VIB AWARDS CEREMONY Best Sales/Leadership Program (non-store/restaurant) 2016 LEADERSHIP EXCELLENCE PART OF HR.COM 38
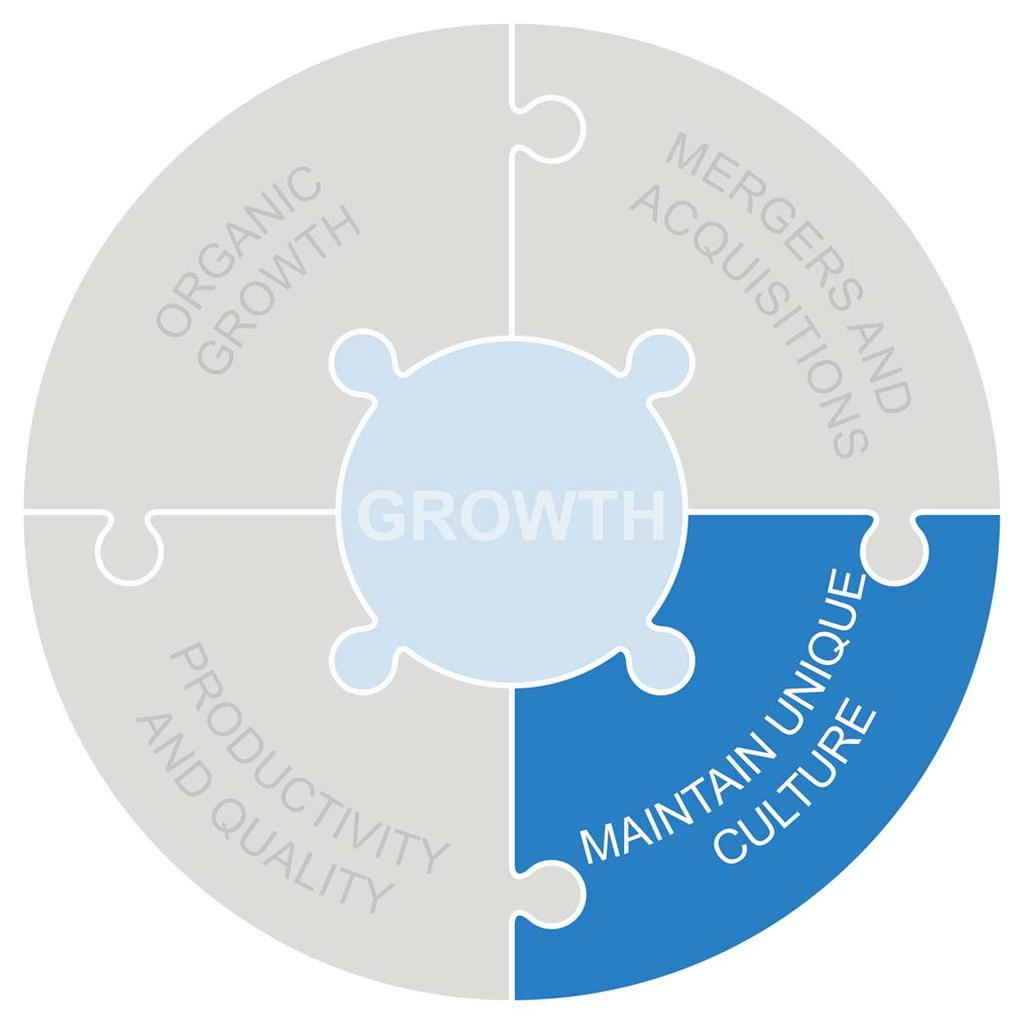
39 Maintaining Culture 39

40 Maintain Unique Culture The Gallagher Way since


41 One of the World s Most Ethical Companies as Recognized by Ethisphere seven years in a row Industry-leading commitment to ethics and dedication to integrity Chosen for: Promoting ethical business standards and practices Exceeding legal compliance standards Innovating to benefit the public Demonstrating that corporate citizenship is tied to company success 41


42 Why Invest? You Believe Our Company Has: Right management Unique culture Proven growth strategy Continuing M&A opportunities Increasing productivity/quality Good use of leverage Strong balance sheet Excellent return to shareholders GALLAGHER IS WELL POSITIONED FOR FUTURE GROWTH 42


43 Why Invest? We Are Just Getting Started! 800% 700% 600% 674 % AJG 500% 400% 300% 200% 100% 165 % S&P 500 0% -100% Source for data: Bloomberg. Total returns from 1/1/2000 6/30/2018 include reinvestment of dividends. 43
44 Additional Information: Ray Iardella Vice President, Investor Relations Phone:
INVESTOR PRESENTATION
 INVESTOR PRESENTATION MARCH 2018 Information Regarding Forward-Looking Statements Arthur J. Gallagher & Co. This presentation contains forward-looking statements within the meaning of the Private Securities
ARTHUR J. GALLAGHER & CO. ANNOUNCES FIRST QUARTER 2018 FINANCIAL RESULTS
 NEWS RELEASE ARTHUR J. GALLAGHER & CO. ANNOUNCES FIRST QUARTER 2018 FINANCIAL RESULTS ROLLING MEADOWS, IL, May 1, 2018 Arthur J. Gallagher & Co. (NYSE: AJG) today reported its financial results for the
ARTHUR J. GALLAGHER & CO. ANNOUNCES THIRD QUARTER 2018 FINANCIAL RESULTS
 NEWS RELEASE ARTHUR J. GALLAGHER & CO. ANNOUNCES THIRD QUARTER 2018 FINANCIAL RESULTS ROLLING MEADOWS, IL, October 25, 2018 Arthur J. Gallagher & Co. (NYSE: AJG) today reported its financial results for
ARTHUR J. GALLAGHER & CO. ANNOUNCES FOURTH QUARTER AND FULL YEAR 2018 FINANCIAL RESULTS
 NEWS RELEASE ARTHUR J. GALLAGHER & CO. ANNOUNCES FOURTH QUARTER AND FULL YEAR 2018 FINANCIAL RESULTS ROLLING MEADOWS, IL, January 31, 2019 Arthur J. Gallagher & Co. (NYSE: AJG) today reported its financial
CFO Commentary. September 13, 2018
 CFO Commentary September 13, 2018 Information Regarding Non-GAAP Measures Arthur J. Gallagher & Co. Non-GAAP Measures and Forward-Looking Statements In this CFO Commentary, we have provided information
ARTHUR J. GALLAGHER & CO. ANNOUNCES SECOND QUARTER 2018 FINANCIAL RESULTS
 NEWS RELEASE ARTHUR J. GALLAGHER & CO. ANNOUNCES SECOND QUARTER 2018 FINANCIAL RESULTS ROLLING MEADOWS, IL, July 26, 2018 Arthur J. Gallagher & Co. (NYSE: AJG) today reported its financial results for
ARTHUR J. GALLAGHER & CO. ANNOUNCES FOURTH QUARTER AND FULL YEAR 2017 FINANCIAL RESULTS
 NEWS RELEASE ARTHUR J. GALLAGHER & CO. ANNOUNCES FOURTH QUARTER AND FULL YEAR 2017 FINANCIAL RESULTS ROLLING MEADOWS, IL, January 25, 2018 Arthur J. Gallagher & Co. (NYSE: AJG) today reported its financial
Tailored solutions for Merger & Acquisition risks. Equity and M&A
 Tailored solutions for Merger & Acquisition risks. Equity and M&A The Gallagher difference. The Gallagher Equity and M&A team has experience that covers the entire mergers and acquisitions spectrum, including
News from Aon Aon Reports Fourth Quarter and Full Year 2017 Results Fourth Quarter Key Metrics From Continuing Operations and Highlights
 Investor Relations News from Aon Aon Reports Fourth Quarter and Full Year Results Fourth Quarter Key Metrics From Continuing Operations and Highlights Reported revenue increased 10 to $2.9 billion with
WILLIS GROUP HOLDINGS FACT BOOK FOR THE QUARTER ENDED JUNE 30, 2010
 WILLIS GROUP HOLDINGS FACT BOOK FOR THE QUARTER ENDED JUNE 30, 2010 Willis snapshot Leading global insurance broker Broad range of professional insurance, reinsurance, risk management, financial and human
UNITED STATES SECURITIES AND EXCHANGE COMMISSION Washington, D.C FORM 8-K. Aon plc (Exact Name of Registrant as Specified in Charter)
") UNITED STATES SECURITIES AND EXCHANGE COMMISSION Washington, D.C. 20549 FORM 8-K CURRENT REPORT Pursuant to Section 13 or 15(d) of the Securities Exchange Act of 1934 Date of report (Date of earliest event
UNITED STATES SECURITIES AND EXCHANGE COMMISSION Washington, D.C. 20549 FORM 8-K CURRENT REPORT Pursuant to Section 13 or 15(d) of the Securities Exchange Act of 1934 Date of report (Date of earliest event
GALLAGHER EQUITY ADVISORS PRACTICE
 GALLAGHER EQUITY ADVISORS PRACTICE The Gallagher Difference The Gallagher Equity Advisors team has experience that covers the entire mergers and acquisitions spectrum, including private equity, venture
Tailored Solutions for Merger & Acquisition Risks
 Tailored Solutions for Merger & Acquisition Risks GALLAGHER EQUITY ADVISORS PRACTICE The Gallagher Difference The Gallagher Equity Advisors team has experience that covers the entire mergers and acquisitions
VMware Reports Fiscal 2019 First Quarter Results. Total revenue growth of 14% year-over-year Broad-based strength across all three geographies
 VMware Reports Fiscal 2019 First Quarter Results Total revenue growth of 14% year-over-year Broad-based strength across all three geographies PALO ALTO, CA May 31, 2018 VMware, Inc. (NYSE: VMW), a leading
TENNECO REPORTS FOURTH QUARTER AND FULL-YEAR 2017 RESULTS
 news release TENNECO REPORTS FOURTH QUARTER AND FULL-YEAR 2017 RESULTS Record fourth quarter and full-year revenue; double-digit growth in commercial truck and off-highway Record fourth quarter EBIT and
TENNECO REPORTS SECOND QUARTER 2017 RESULTS
 news release TENNECO REPORTS SECOND QUARTER 2017 RESULTS Record-high second quarter revenue, outpacing industry production Double-digit growth in commercial truck and off highway revenue Returned $57 million
TENNECO REPORTS SECOND QUARTER 2015 RESULTS
 news release TENNECO REPORTS SECOND QUARTER 2015 RESULTS Revenue of $2.1 billion Continued EBIT margin improvement Higher year-over-year cash from operations Lake Forest, Illinois, July 24, 2015 Tenneco
INVESTOR PRESENTATION Worldpay, Inc. All rights reserved.
 INVESTOR PRESENTATION 1 DISCLAIMER No Offer or Solicitation This presentation is provided for informational purposes only and is not intended to and shall not constitute an offer to sell or the solicitation
MetLife, Inc. Acquisition of ALICO. March 8, 2010
 MetLife, Inc. Acquisition of ALICO March 8, 2010 ALICO: A Unique and Compelling Transaction Significantly Accelerates the Execution of MetLife s Global Growth Strategy Diversifies revenue and earnings
March 21, Crawford & Company. New York Society of Security Analysts
 March 21, 2016 Crawford & Company New York Society of Security Analysts FORWARD-LOOKING STATEMENTS AND ADDITIONAL INFORMATION Forward-Looking Statements This presentation contains forward-looking statements,
INTERACTIVE DATA REPORTS FIRST-QUARTER 2014 RESULTS
 Press Release INTERACTIVE DATA REPORTS FIRST-QUARTER 2014 RESULTS New York May 8, 2014 Interactive Data Corporation today reported its financial results for the first quarter ended 2014. Interactive Data
inspiring wonder 2018 New York Toy Fair
 Forward-Looking Statements/Regulation G FORWARD-LOOKING STATEMENTS: This presentation contains a number of forward-looking statements within the meaning of the Private Securities Litigation Reform Act
TENNECO REPORTS THIRD QUARTER 2014 RESULTS
 news release TENNECO REPORTS THIRD QUARTER 2014 RESULTS Record third quarter revenue of $2.1 billion Record third quarter EBIT of $140 million EPS of $1.27 per diluted share Lake Forest, Illinois, October
News from Aon Aon Reports Fourth Quarter and Full Year 2018 Results Fourth Quarter Key Metrics as Reported Under U.S. GAAP(1)
") Investor Relations News from Aon Aon Reports Fourth Quarter and Full Year Results Fourth Quarter Key Metrics as Reported Under U.S. GAAP (1) Total revenue decreased 5 to $2.8 billion, including a decrease
Investor Relations News from Aon Aon Reports Fourth Quarter and Full Year Results Fourth Quarter Key Metrics as Reported Under U.S. GAAP (1) Total revenue decreased 5 to $2.8 billion, including a decrease
UNITED STATES SECURITIES AND EXCHANGE COMMISSION Washington, D.C FORM 8-K. Aon plc (Exact Name of Registrant as Specified in Charter)
") UNITED STATES SECURITIES AND EXCHANGE COMMISSION Washington, D.C. 20549 FORM 8-K CURRENT REPORT Pursuant to Section 13 or 15(d) of the Securities Exchange Act of 1934 Date of report (Date of earliest event
UNITED STATES SECURITIES AND EXCHANGE COMMISSION Washington, D.C. 20549 FORM 8-K CURRENT REPORT Pursuant to Section 13 or 15(d) of the Securities Exchange Act of 1934 Date of report (Date of earliest event
TENNECO REPORTS FIRST QUARTER 2018 RESULTS
 news release TENNECO REPORTS FIRST QUARTER 2018 RESULTS Record-high first quarter revenue, outpacing industry production Expects constant currency revenue growth of 8% in second quarter Changed segment
Aon Reports First Quarter 2018 Results
 Investor Relations News from Aon Aon Reports First Quarter 2018 Results First Quarter Key Metrics as Reported under U.S. GAAP (1) Total revenue increased 30% to $3.1 billion, including an increase of $365
The Hartford to Acquire Navigators: Broadens and Deepens Commercial Lines Product Offerings and Underwriting Risk Appetite
 The Hartford Financial Services Group, Inc. August 22, 2018 The Hartford to Acquire Navigators: Broadens and Deepens Commercial Lines Product Offerings and Underwriting Risk Appetite Copyright 2018 by
Assurant Investor Overview
 Assurant Investor Overview Fourth Quarter 2017 2018 Assurant, Inc. All rights reserved. 1 Cautionary Statements Some of the statements included in this presentation, particularly those anticipating future
Bank of America Merrill Lynch Media, Communications & Entertainment Conference. Jay Brown Chief Financial Officer
 Bank of America Merrill Lynch Media, Communications & Entertainment Conference Jay Brown Chief Financial Officer Cautionary Information This presentation contains forward-looking statements and information
IQVIA Reports First-Quarter 2018 Results and Raises Full-Year 2018 Revenue Guidance
 News Release Contacts: Andrew Markwick, IQVIA Investor Relations (andrew.markwick@iqvia.com) +1.973.257.7144 Tor Constantino, IQVIA Media Relations (tor.constantino@iqvia.com) +1.484.567.6732 IQVIA Reports
Assurant Investor Overview
 Assurant Investor Overview First Quarter 2018 2018 Assurant, Inc. All rights reserved. 1 Cautionary Statements Some of the statements included in this presentation, particularly those anticipating future
Ben Moreland Chief Executive Officer
 Ben Moreland Chief Executive Officer Cautionary Information This presentation contains forward-looking statements and information that are based on management s current expectations. Such statements include,
2015 Bank of America Merrill Lynch Banking & Insurance Conference. Tom Naratil Group Chief Financial Officer Group Chief Operating Officer
 2015 Bank of America Merrill Lynch Banking & Insurance Conference Tom Naratil Group Chief Financial Officer Group Chief Operating Officer 29 September 2015 Cautionary statement regarding forward-looking
Stanley Black & Decker Reports Full Year And 4Q 2017 Results
 Stanley Black & Decker Reports Full Year And 4Q 2017 Results New Britain, Connecticut, January 24, 2018 Stanley Black & Decker (NYSE: SWK) today announced full year and fourth quarter 2017 financial results.
Q Quarterly Results Conference Call. July 27, 2018
 Q2 2018 Quarterly Results Conference Call July 27, 2018 Safe Harbor Language and Reconciliation of Non-GAAP Measures This presentation contains certain forward-looking statements within the meaning of
Aon Reports Third Quarter 2018 Results
 Investor Relations News from Aon Aon Reports Third Quarter Results Third Quarter Key Metrics as Reported under U.S. GAAP (1) Total revenue was flat at $2.3 billion, including a decrease of $117 million,
Deutsche Bank Global Auto Industry Conference
 Deutsche Bank Global Auto Industry Conference Detroit, MI January 17, 2018 NYSE: TEN Safe Harbor This presentation contains forward-looking statements that involve risks and uncertainties which could cause
Q4 and Full Year 2017 Financial Results. February 16, 2018
 Q4 and Full Year 2017 Financial Results February 16, 2018 Safe Harbor Language and Reconciliation of Non-GAAP Measures This presentation contains certain forward-looking statements within the meaning of
Second Quarter 2018 Earnings (Unaudited Results) July 25, Mattel, Inc. All Rights Reserved.
 July 25, Mattel, Inc. All Rights Reserved.") Second Quarter 2018 Earnings (Unaudited Results) July 25, 2018 FORWARD-LOOKING STATEMENTS: This presentation contains a number of forward-looking statements within the meaning of the Private Securities
Second Quarter 2018 Earnings (Unaudited Results) July 25, 2018 FORWARD-LOOKING STATEMENTS: This presentation contains a number of forward-looking statements within the meaning of the Private Securities
Assurant Reports Second Quarter 2018 Financial Results
 Assurant Reports Second Quarter 2018 Financial Results 2Q 2018 Net Income of $62.2 million, $1.09 per diluted share 2Q 2018 Net Operating Income of $121.9 million, $2.13 per diluted share Key Financial
Cenveo Reports Fourth Quarter and Full Year 2016 Results
 News Release Cenveo Reports Fourth Quarter and Full Year Results Announces Two-Year, $50 Million Profitability Improvement Plan Redeeming Remaining 11.5% Notes STAMFORD, CT (February 22, 2017) - Cenveo,
Q Quarterly Results Conference Call. October 25, 2018
 Q3 2018 Quarterly Results Conference Call October 25, 2018 Safe Harbor Language and Reconciliation of Non-GAAP Measures This presentation contains certain forward-looking statements within the meaning
January 29, 2019 Conference Call Slide Presentation HARLEY-DAVIDSON, INC FOURTH QUARTER UPDATE
 HARLEY-DAVIDSON, INC. 2018 FOURTH QUARTER UPDATE JANUARY 29, 2019 2018 FOURTH QUARTER UPDATE THIS PRESENTATION SUPPORTS THE AUDIO CONFERENCE CALL CONFERENCE CALL AGENDA Introduction Business Perspectives
Cenveo Reports Third Quarter 2016 Results
 News Release Cenveo Reports Third Quarter Results - Redeeming 50% of Remaining 11.5% Notes, Repurchased Most of 7% Convertible Notes - STAMFORD, CT (November 2, ) - Cenveo, Inc. (NYSE: CVO) reported financial
Aon plc. First Quarter 2018 Results May 4, 2018
 Aon plc First Quarter 2018 Results May 4, 2018 Greg Case Chief Executive Officer Christa Davies Chief Financial Officer 1 Safe Harbor Statement This communication contain certain statements related to
Aon plc. First Quarter 2017 Results May 9, 2017
 Aon plc First Quarter 2017 Results May 9, 2017 Greg Case Chief Executive Officer Christa Davies Chief Financial Officer 1 Safe Harbor Statement This communication contain certain statements related to
ECOLAB THIRD QUARTER 2018
 3Q 2018 Overview Sales: ECOLAB THIRD QUARTER 2018 Reported sales +5%; fixed currency sales were +6%, with acquisition adjusted fixed currency sales +7%. New business growth, share gains, pricing and new
TENNECO REPORTS SECOND QUARTER 2016 RESULTS
 news release TENNECO REPORTS SECOND QUARTER 2016 RESULTS Revenue growth continuing to outpace industry production Record-high second quarter EBIT Year-over-year margin expansion Record-high second quarter
Citi 2011 Entertainment, Media and Telecommunications Conference. Jay Brown Chief Financial Officer
 Citi 2011 Entertainment, Media and Telecommunications Conference Jay Brown Chief Financial Officer Cautionary Information This presentation contains forward-looking statements and information that are
August 2018 Investor Presentation
 August 2018 Investor Presentation Standard Diversified Inc. owns and operates subsidiaries in a variety of industries, including other tobacco products, outdoor advertising and insurance. SAFE HARBOR This
SECURITIES AND EXCHANGE COMMISSION WASHINGTON, D.C FORM 8-K
 SECURITIES AND EXCHANGE COMMISSION WASHINGTON, D.C. 20549 FORM 8-K CURRENT REPORT PURSUANT TO SECTION 13 OR 15(d) OF THE SECURITIES EXCHANGE ACT OF 1934 Date of Report (Date of earliest event reported)
INVESTOR PRESENTATION
 The Hartford Financial Services Group, Inc. November 2015 INVESTOR PRESENTATION Copyright 2015 by The Hartford. All rights reserved. No part of this document may be reproduced, published or posted without
Investor Presentation. March 2018
 Investor Presentation March 2018 1 Forward-Looking Statements and Non-GAAP Measures This news release contains statements, estimates, or projections that constitute "forward-looking statements" as defined
Vantiv Investor Presentation
 Vantiv Investor Presentation February 1, 2017 2015 Vantiv, LLC. All rights reserved. Disclaimer This presentation contains forward-looking statements that are subject to risks and uncertainties. All statements
Morgan Stanley European Financials Conference 2018
 Morgan Stanley European Financials Conference 2018 Sergio P. Ermotti Group Chief Executive Officer March 22, 2018 Cautionary statement regarding forward-looking statements This presentations contains statements
HEADWATERS INCORPORATED ANNOUNCES RESULTS FOR FIRST QUARTER OF FISCAL 2015
 N E W S B U L L E T I N FROM: FOR FURTHER INFORMATION RE: Headwaters Incorporated 10701 S. River Front Parkway, Suite 300 South Jordan, UT 84095 Phone: (801) 984-9400 NYSE: HW AT THE COMPANY: Sharon Madden
Oz Management Reports Second Quarter of 2018 Results
 Oz Management Reports Second Quarter of 2018 Results Dividend of $0.02 per Class A Share NEW YORK, August 2, 2018 Och-Ziff Capital Management Group LLC (NYSE: OZM) (the Company or Oz Management ) today
Tenneco Reports Fourth Quarter And Full-Year 2012 Financial Results
 news release Tenneco Reports Fourth Quarter And Full-Year 2012 Financial Results Highest-ever full-year revenue of $7.4 billion Record net income and EPS for Q4 and full year Record fourth quarter cash
Allianz Re. Company Presentation. May Understanding Risk Creating Value
 Allianz Re Company Presentation May 2015 Understanding Risk Creating Value Content 1 Allianz Group 2 Our company 3 Our financial results 4 Our people 5 Our solutions & services 6 Our global presence 2
Assurant, Inc. (Exact Name of Registrant as Specified in Charter)
") UNITED STATES SECURITIES AND EXCHANGE COMMISSION WASHINGTON, D.C. 20549 FORM 8-K CURRENT REPORT Pursuant to Section 13 or 15(d) of the Securities Exchange Act of 1934 Date of Report (Date of earliest event
UNITED STATES SECURITIES AND EXCHANGE COMMISSION WASHINGTON, D.C. 20549 FORM 8-K CURRENT REPORT Pursuant to Section 13 or 15(d) of the Securities Exchange Act of 1934 Date of Report (Date of earliest event
TENNECO REPORTS FOURTH QUARTER AND FULL-YEAR 2013 RESULTS
 news release TENNECO REPORTS FOURTH QUARTER AND FULL-YEAR 2013 RESULTS Record-high 4Q and full year revenue Record-high 4Q EBIT and net income 4Q cash flow from operations of $412 million Lake Forest,
IQVIA Reports Third-Quarter 2018 Results and Updates Full-Year 2018 Guidance
 News Release Contacts: Andrew Markwick, IQVIA Investor Relations (andrew.markwick@iqvia.com) +1.973.257.7144 Tor Constantino, IQVIA Media Relations (tor.constantino@iqvia.com) +1.484.567.6732 IQVIA Reports
Acquisition of Calgon Carbon
 September 21, 2017 Kuraray Co., Ltd. Acquisition of Calgon Carbon Kuraray Co., Ltd. ( Kuraray, or the Company ) announced that it has reached an agreement with Calgon Carbon Corporation, the world s largest
Chubb Limited Investor Presentation. December 2016
 Chubb Limited Investor Presentation December 2016 The New Chubb: A Unique Global P&C Franchise Substantial Scale Customer & Product Diversification 64% commercial, 36% consumer 62% U.S., 38% International
TENNECO REPORTS THIRD QUARTER RESULTS
 news release TENNECO REPORTS THIRD QUARTER RESULTS Record-high third quarter revenue Record-high third quarter EBIT before restructuring charges Lake Forest, Illinois, October 28, 2013 Tenneco Inc. (NYSE:TEN)
2015 Second Quarter Conference Call August 4, 2015
 2015 Second Quarter Conference Call August 4, 2015 Safe Harbor Statements in this presentation, including the information set forth as to the future financial or operating performance of Atlas Financial
Hasbro Reports First Quarter 2018 Financial Results
 Hasbro Reports First Quarter 2018 Financial Results April 23, 2018 First quarter 2018 revenues decreased to $716.3 million due to the liquidation of Toys R Us and retail inventory overhang, primarily in
Oz Management Reports Third Quarter of 2018 Results. Dividend of $0.02 per Class A Share
 Oz Management Reports Third Quarter of 2018 Results Dividend of $0.02 per Class A Share NEW YORK, November 2, 2018 Och-Ziff Capital Management Group LLC (NYSE: OZM) (the Company or Oz Management ) today
Assurant Reports Fourth Quarter and Full-Year 2018 Financial Results
 Assurant Reports Fourth Quarter and Full-Year 2018 Financial Results 4Q 2018 Net Income of $20.3 million, $0.32 per diluted share Full-Year 2018 Net Income of $236.8 million, $3.98 per diluted share 4Q
FOR IMMEDIATE RELEASE AUGUST 7, 2017 SYKES ENTERPRISES, INCORPORATED REPORTS SECOND QUARTER 2017 FINANCIAL RESULTS. Updating 2017 Business Outlook
 News Release news release FOR IMMEDIATE RELEASE AUGUST 7, 2017 SYKES ENTERPRISES, INCORPORATED REPORTS SECOND QUARTER 2017 FINANCIAL RESULTS Updating 2017 Business Outlook TAMPA, FL August 7, 2017 Sykes
Third Quarter 2018 Earnings. (Unaudited Results) October 25, 2018
 October 25, 2018") Third Quarter 2018 Earnings (Unaudited Results) October 25, 2018 Forward-Looking Statements This presentation contains a number of forward-looking statements within the meaning of the Private Securities
Third Quarter 2018 Earnings (Unaudited Results) October 25, 2018 Forward-Looking Statements This presentation contains a number of forward-looking statements within the meaning of the Private Securities
Aon Reports Second Quarter 2017 Results
 Investor Relations News from Aon Aon Reports Second Quarter Results Second Quarter Key Metrics From Continuing Operations Reported revenue increased 4 to $2.4 billion, with organic revenue growth of 3
IQVIA Reports Second-Quarter 2018 Results and Raises Full-Year 2018 Revenue and Profit Guidance
 News Release Contacts: Andrew Markwick, IQVIA Investor Relations (andrew.markwick@iqvia.com) +1.973.257.7144 Tor Constantino, IQVIA Media Relations (tor.constantino@iqvia.com) +1.484.567.6732 IQVIA Reports
Stanley Black & Decker Reports Full Year And 4Q 2016 Results
 Stanley Black & Decker Reports Full Year And 4Q 2016 Results New Britain, Connecticut, January 26, 2017 Stanley Black & Decker (NYSE: SWK) today announced full year and fourth quarter 2016 financial results.
VMware, Inc. VMware Reports Fiscal 2018 First Quarter Results
 VMware Reports Fiscal 2018 First Quarter Results Year-over-year revenue growth of 9% to $1.74 billion, supported by strong growth across all regions PALO ALTO, Calif., June 1, 2017 VMware, Inc. (NYSE:
EMC Q FINANCIAL RESULTS
 EMC Q1 2011 FINANCIAL RESULTS Tony Takazawa Vice President, Global Investor Relations April 20, 2011 1 Forward-Looking Statements and GAAP Reconciliation This presentation contains forward-looking statements
Dun & Bradstreet Reports First Quarter 2018 Results; Declares Quarterly Dividend
 Contacts: Deborah McBride (Media) Kathy Guinnessey (Investors/Analysts) mcbrided@dnb.com Kathy.Guinnessey@dnb.com 973.921.5714 973.921.5892 Dun & Bradstreet Reports First Quarter 2018 Results; Declares
Q Earnings Presentation
 Q1 2018 Earnings Presentation May 24, 2018 1 Cautionary Statement Regarding Forward Looking Statements This presentation contains forward-looking statements, including statements made within the meaning
AFFINION GROUP HOLDINGS, INC. ANNOUNCES RESULTS FOR THE THIRD QUARTER ENDED SEPTEMBER 30, 2015 REPORTS $75
 More information: Torrey Martin SVP, Communications and Corporate Development 203.956.8746 tmartin@affiniongroup.com AFFINION GROUP HOLDINGS, INC. ANNOUNCES RESULTS FOR THE THIRD QUARTER ENDED SEPTEMBER
4Q18 Financial Results. February 26, 2019
 4Q18 Financial Results February 26, 2019 Disclaimer No Offer or Solicitation This presentation is provided for informational purposes only and is not intended to and shall not constitute an offer to sell
Dun & Bradstreet Reports Second Quarter 2016 Results; Announces Transactions to Partner Latin America and Benelux
 August 1, 2016 Dun & Bradstreet Reports Second Quarter 2016 Results; Announces Transactions to Partner Latin America and Benelux Transactions Expected to be Accretive to 2016 and 2017 Operating Income
Wells Fargo Industrials Conference. May 8, 2018
 Wells Fargo Industrials Conference May 8, 2018 Forward-Looking Statements Certain statements in this financial review relate to future events and expectations and are forward-looking statements within
Veeva Announces Fiscal 2018 First Quarter Results
 FOR IMMEDIATE RELEASE Veeva Announces Fiscal 2018 First Quarter Results Total Revenues of $157.9M, up 32% Year-over-year Subscription Services Revenues of $127.3M, up 33% Year-over-year PLEASANTON, CA
Bob Dorrance Vice Chair - Wholesale Banking, TD Bank Financial Group Chairman and CEO, TD Securities
 Bob Dorrance Vice Chair - Wholesale Banking, TD Bank Financial Group Chairman and CEO, TD Securities NATIONAL BANK FINANCIAL CANADIAN BANK CEO CONFERENCE April 7, 2004 Forward-Looking Statements From time
VMware, Inc. VMware Reports Fiscal 2019 Second Quarter Results
 VMware Reports Fiscal 2019 Second Quarter Results Total revenue growth of 13% year-over-year Broad-based strength across product portfolio PALO ALTO, Calif., Aug. 23, 2018 VMware, Inc. (NYSE: VMW), a leading
VMware Reports Fiscal 2018 Second Quarter Results. Year-over-year revenue growth of over 12% to $1.90 billion
 VMware Reports Fiscal 2018 Second Quarter Results Year-over-year revenue growth of over 12% to $1.90 billion Strong results driven by broad-based performance across product portfolio and geographies PALO
VMware Reports Fiscal 2018 Third Quarter Results. Year-over-year revenue growth of 11% to $1.98 billion
 VMware Reports Fiscal 2018 Third Quarter Results Year-over-year revenue growth of 11% to $1.98 billion Continued broad-based strength across product portfolio and geographies PALO ALTO, Calif., November
Fourth Quarter 2017 Earnings
 Fourth Quarter 2017 Earnings Jeff Jacobson, CEO Bill Osbourn, CFO January 31, 2018 http://www.xerox.com/investor Cautionary Statement Regarding Forward-Looking Statements This presentation, and other written
Investor Update 2Q Rob LoCascio CEO Chris Greiner CFO
 Investor Update 2Q 2018 Rob LoCascio CEO Chris Greiner CFO Safe Harbor Provision Statements in this presentation regarding LivePerson that are not historical facts are forward-looking statements and are
EMC Q Financial Results
 EMC Q3 2014 Financial Results Tony Takazawa Vice President, Global Investor Relations October 22, 2014 1 Forward-Looking Statements This presentation contains forward-looking statements as defined under
1Q18 net profit up 19% YoY to CHF 1.5bn
 23 April 2018 1Q18 net profit up 19% YoY to CHF 1.5bn Reported profit before tax (PBT) CHF 2.0bn, +17% YoY, +24% in USD Adjusted 1 RoTE excluding DTAs 2 17.8%, diluted EPS CHF 0.39 CHF 1.1bn adjusted 1
Investor Presentation. February 2018
 Investor Presentation February 2018 1 Forward Looking Statements Important Information About Littelfuse, Inc. This presentation does not constitute or form part of, and should not be construed as, an offer
Bank of America Merrill Lynch Financials Conference. Kirt Gardner Group Chief Financial Officer
 Bank of America Merrill Lynch Financials Conference Kirt Gardner Group Chief Financial Officer September 28, 2017 Cautionary statement regarding forward-looking statements This presentation contains statements
March 2019 Investor Presentation
 March 2019 Investor Presentation Standard Diversified Inc. owns and operates subsidiaries in a variety of industries, including other tobacco products, outdoor advertising and insurance. SAFE HARBOR This
To our shareholders Letter from Our Chairman & CEO
 To our shareholders 2008 Letter from Our Chairman & CEO We are proud of Accenture s performance in fiscal 2008. We responded to the challenges of the global economy by relentlessly focusing on our clients
PRIVATE CAPITAL ADVISORY SERVICES EXPERTS WITH IMPACT TM
 PRIVATE CAPITAL ADVISORY SERVICES EXPERTS WITH IMPACT TM IMPACTING CHANGE ACROSS THE BUSINESS CYCLE About FTI Consulting FTI Consulting is an independent global business advisory firm dedicated to helping
Investor Presentation February 2017
 Investor Presentation February 2017 Safe Harbor Certain statements in this document regarding anticipated financial, business, legal or other outcomes including business and market conditions, outlook
Investor Presentation. May 2018
 Investor Presentation May 2018 Forward-Looking Statements This presentation contains forward-looking statements (as defined in the Securities Litigation Reform Act of 1995) regarding, among other things,
Project Mountain Investor Presentation. AECOM Investor Presentation. World Trade Center Manhattan, New York, U.S.A.
 Project Mountain Investor Presentation AECOM Investor Presentation World Trade Center Manhattan, New York, U.S.A. Safe Harbor Disclosures Cautionary Note Regarding Forward-Looking Statements All statements